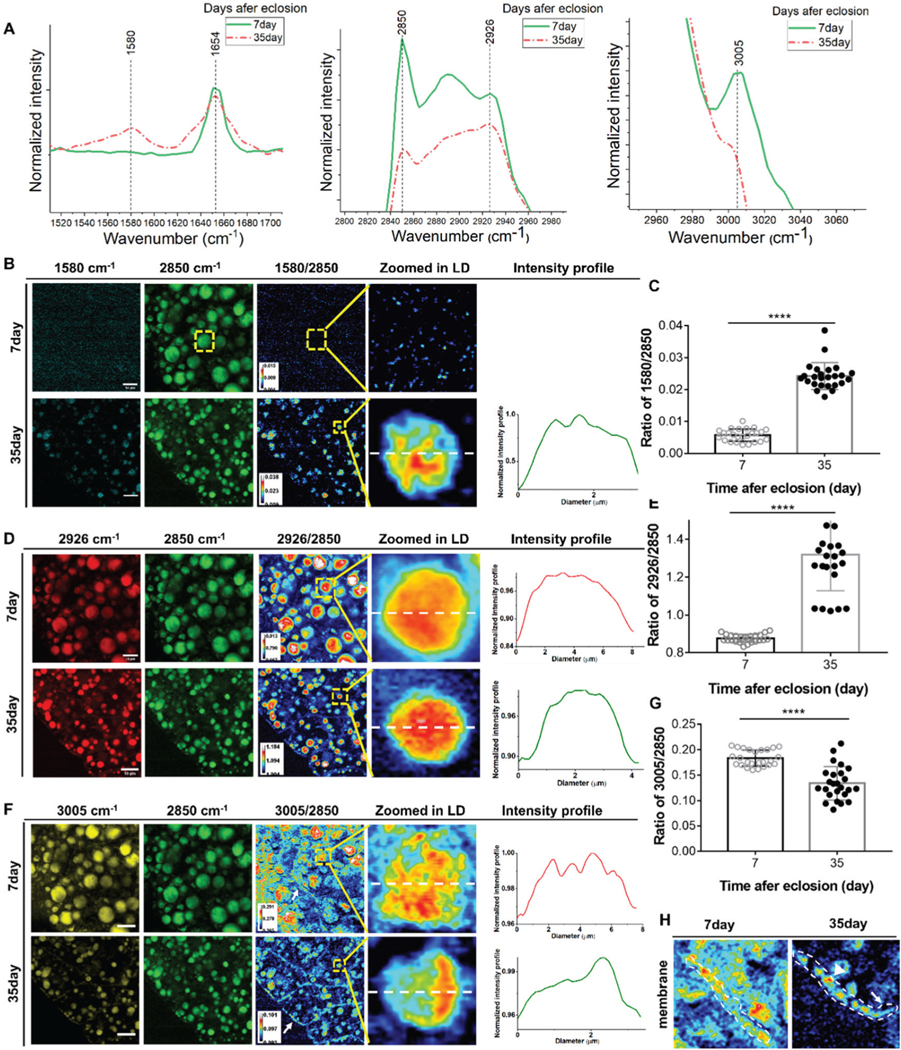
Fig. 1.

SRS imaging detection of biomolecular changes in LDs. SRS images demonstrate more and larger LDs in young flies and smaller LDs were observed in old flies. (A) Raman spectra of the fat body in 7-day-old flies and 35-day-old flies at 1580 cm−1 (retinoid C=C), 2850 cm−1 (CH2 stretching of lipids), 2926 cm−1, and 3005 cm−1 (unsaturated fatty acids). (B) SRS images of retinoids in the fat bodies of 7- and 35-day-old flies. Ratiometric images of 1580 cm−1 to 2850 cm−1 show a significant increase of retinoids in 35-day-old flies. Retinoids were not detectable in 7-day-old flies. The distribution profile of the retinoids inside single LD is also shown. (C) Quantification of changes in retinoids relative to lipids in 7- and 35-day-old flies. There was a significant increase in retinoids in old flies. (D) SRS images of 2926 cm−1 in the fat bodies of 7- and 35-day flies. Ratiometric images of 2926 cm−1 to 2850 cm−1 demonstrate significantly stronger intensity in old flies, indicating more protein synthesis. Curves also showed that proteins were evenly distributed in the LDs in both young and old flies. (E) Quantification of protein changes relative to lipids in 7- and 35-day-old flies. The relative content of proteins significantly increased in old flies. (F) SRS images of unsaturated FAs (at 3005 cm−1) in young and old flies. Ratiometric images of unsaturated FAs to lipids (at 2850 cm−1) show weaker signals in old flies, indicating the reduction of unsaturated FAs. Plots of the intensity profile show unsaturated FAs were more located in certain regions inside the LD in old flies. (G) Quantification of changes in unsaturated FAs in 7- and 35-day-old flies. In old flies, unsaturated FAs decreased significantly. (H) Ratiometric images of unsaturated FAs near/on the fat body cell membrane. There were more unsaturated FAs on the membrane in young flies. Results are presented as mean ± SD (n = 25 in each group). Statistical significance was determined by using unpaired Student’s t-test. ****, p < 0.0001.
