Abstract
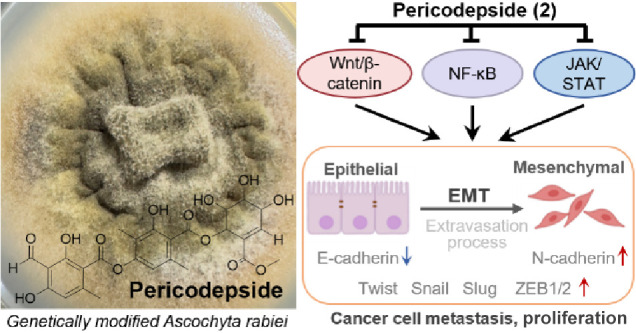
A depside derivative, named pericodepside (2), along with the known depside proatranorin III (1), was isolated from the solid cultivation of an Ascochyta rabiei strain that heterologously expresses atr1 and atr2 that are involved in the biosynthesis of atranorin in a fruticose lichen, Stereocaulon alpinum. The structure of 2 was determined by 1D and 2D NMR and MS spectroscopic data. The structure of 2 consisted of a depside–pericosine conjugate, with the depside moiety being identical to that found in 1, suggesting that 1 acted as an intermediate during the formation of 2 through the esterification process. Pericodepside (2) strongly suppressed cell invasion and proliferation by inhibiting epithelial–mesenchymal transition and the transcriptional activities of β-catenin, STAT, and NF-κB in U87 (glioma cancer), MCF-7 (breast cancer), and PC3 (prostate cancer) cell lines.
Introduction
Cancer is one of the leading causes of death globally. Nearly 10 million people died from cancer in 2020 according to the GLOBOCAN 2020 data.1 Breast cancer is the leading cancer diagnosed cancer worldwide. Lung, prostate, stomach, and colon cancers are the top six leading causes of cancer-related death, with lung cancer being the second-highest cancer-related mortality in 2020.2,3 Brain cancer is the 21st most common cause of death; however, it has the lowest survival rate of all types of cancer.4 Tumor metastasis is the leading cause of tumor treatment failure, and the prognosis of patients with metastatic tumors remains poor.5,6 Therefore, novel therapeutic approaches targeting tumor metastasis are needed.
Metastatic cancer occurs when cancer cells spread from their site of origin to another part of the body.7 The motility of cancer cells contributes to tumor metastasis through several steps, including migration, invasion, and movement to distant sites.8 The epithelial–mesenchymal transition (EMT) is a common mechanism underlying cancer metastasis and progression.9 During EMT, tumor epithelial cells lose cell–cell adhesion and gain migratory and invasive properties due to the upregulation of N-cadherin and EMT transcription factors such as Snail, Slug, Twist, and ZEB1/2.10,11 EMT is a fundamental early step of tumorigenesis.12,13 Therefore, inhibiting EMT is a key aim for the development of antimetastatic therapeutics.
Lichen-derived natural products have the potential to be valuable sources of compounds that are chemically diverse, biologically active, sustainable, and might address various health issues.14−17 Depsides and their derivatives are promising natural products found in lichens, characterized by a structure containing two or more orsellinic acid-like phenolic moieties linked via ester bonds. These compounds exhibit anticancer, antifungal, antioxidant, and anti-inflammatory activities, making them potentially useful for therapeutic applications.18 Atranorin, evernic acid, and olivetoric acid are representative examples of depsides that have cytotoxic activity, which makes them potential anticancer agents.19 −21
Advances in biotechnology and genetic engineering have facilitated the biosynthesis of several depsides, making their production more economically feasible.22−24 At the same time, the production of certain depsides and their derivatives by biosynthesis may provide an environmentally friendly and sustainable alternative to conventional chemical synthesis methods. Moreover, improvements in the biosynthesis of these compounds will facilitate their ultimate large-scale industrial production and use. Recently, we achieved the biosynthesis of atranorin by heterologous expression of three lichen genes (atr1, atr2, and atr3) in a “clean host” Ascochyta rabiei strain.23 During the process of atranorin biosynthesis, the formation of the lichen depside 4-O-demethylbaratic acid was catalyzed by ATR1, a nonreducing polyketide synthase. 4-O-demethylbaratic acid was hydroxylated into proatranorin II, then further oxidized to yield proatranorin III (1) by the CYP450 enzyme ATR2. An O-methyltransferase ATR3 subsequently introduced a methyl group into the carboxyl acid group of proatranorin III to finalize the biosynthesis of atranorin.23
Here, we report the discovery of a previously unknown compound, pericodepside (2), which is a derivative of 1 produced by an A. rabiei strain that heterologously expresses atr1 and atr2. Our structural analysis revealed that 2 was formed by the esterification of a pericosine analogue onto the carboxyl group of 1 (Figure 1). Several reports indicate that the substitution of depside derivatives with 3-methylorsellinic acid or the hydroxylated cyclohexenone unit with corresponding esters enhances their structural diversity and pharmacological activity.25,26 As atranorin has various antimicrobial, anti-inflammatory, anticancer, and photoprotective properties, it was of our interest here to investigate 1) whether 1 shows similar cytotoxicity and 2) whether 2 exhibits stronger bioactivity than 1.
Figure 1.

Structures of proatranorin III (1) and pericodepside (2).
Results and Discussion
Compound 2 showed a deprotonated molecule peak at m/z 545.1292 [M–H]− (calculated for C26H25O13, 545.1295) in the HRESIMS spectrum (Figure S2), thus the molecular formula of 2 was assigned as C26H26O13 with 14 degrees of unsaturation. The molecular formula was supported by 26 resonances shown in the 13C NMR spectrum.
The 1H and 13C NMR spectra of 2 were similar to those of 1 except for several additional signals. There was an additional carbonyl signal observed at C-7″ (δC 166.9) as well as five more methine signals recorded at C-2″, C-3″, C-4″, C-5″, and C-6″ (with chemical shifts of δH/δC 7.12/147.4, 4.43/69.1, 3.74/72.4, 4.15/71.7, and 5.99/71.9, respectively) in the 13C NMR spectrum of 2. Furthermore, a methyl signal was observed at C-8″ (δH/δC 3.76/52.5), along with a sp2 hybridized quaternary carbon signal at δC 126.8 (C-1″) (Table 1).
Table 1. NMR Spectroscopic Data for Pericodepside (2) in CD3OD or DMSO-d6.
| position | δH (CD3OD) | δc (CD3OD) | δH (DMSO-d6) | δc (DMSO-d6) | HMBC (H → C#) |
|---|---|---|---|---|---|
| 1 | 109.3 | 110.8 | |||
| 2 | 161.6 | 161.4 | |||
| 2-OH | 12.43, s | 1,a 2,a 3a | |||
| 3 | 107.2 | 107.8 | |||
| 4 | 163.7 | 163.4 | |||
| 4-OH | 11.63, s | 3a | |||
| 5 | 6.42, s | 111.9 | 6.41, s | 108.9 | 1,a 3,a 9a |
| 6 | 152.5 | 148.9 | |||
| 7 | 168.7 | 164.5 | |||
| 8 | 10.34, s | 194.7 | 10.20, s | 193.9 | 2,a 3a |
| 9 | 2.60, s | 23.8 | 2.37, s | 21.1 | 5,a 6a |
| 1′ | 111.5 | 115.8 | |||
| 2′ | 162.9 | 157.2 | |||
| 2′-OH | 10.36, s | 1′,a 2′a | |||
| 3′ | 117.7 | 116.4 | |||
| 4′ | 153.7 | 151.3 | |||
| 5′ | 6.61, s | 117.3 | 6.63, s | 115.8 | 1′,a 4′,a 9′a |
| 6′ | 140.3 | 136.0 | |||
| 7′ | 171.4 | 168.1 | |||
| 8′ | 2.09, s | 9.2 | 2.04, s | 9.4 | 2′,ab 3′,ab 4′ab |
| 9′ | 2.41, s | 23.6 | 2.24, s | 20.7 | 1′,ab 5′,ab 6′ab |
| 1″ | 126.8 | 125.0 | |||
| 2″ | 7.12, d (1.8) | 147.4 | 6.93, d (1.9) | 147.3 | 1″,b 6″,ab 7″ab |
| 3″ | 4.43, br d (7.7) | 69.1 | 4.20, dd (7.8, 1.6) | 67.8 | 1″,ab 2″,ab 4″ab |
| 4″ | 3.74, overlapped | 72.4 | 3.55, dd (7.8, 1.7) | 70.9 | 3″b |
| 5″ | 4.15, br s | 71.7 | 3.97, t-like (2.4) | 70.1 | 6″b |
| 6″ | 5.99, d (2.8) | 71.9 | 5.76, d (3.0) | 70.5 | 7′,b 1″,b 2″,ab 5″,b 7″b |
| 7″ | 166.9 | 165.3 | |||
| 8″ | 3.76, s | 52.5 | 3.67, s | 52.0 | 7″ab |
The NMR solvent (DMSO-d6) utilized for HMBC data acquisition.
The NMR solvent (CD3OD) employed for acquiring HMBC data.
The 1H–1H correlation spectroscopy (COSY) data confirmed the spin system of H-2″-H-3″-H-4″-H-5″-H-6″. The chemical shifts of C-1″ and C-2″ suggested that they were part of an olefin group, and this finding was confirmed by the heteronuclear multiple bond correlation (HMBC) from H-2″ to C-1″. The chemical shifts of H-3″, H-4″, H-5″, and H-6″ suggested that they were oxygenated, and this notion was supported by the deduced molecular formula. The HMBCs from H-6″ to C-1″ and from H-6″ to C-7″ suggested that this ring system was a moiety that had a planar structure similar to that of pericosines (Figure 2).27 The HMBC from H-6″ to C-7′ (δC 168.7) placed the pericosine-like moiety at C-7′ via an ester bond. This finding was supported by the downfield chemical shift of H-6″. The HMBC from H-8″ to C-7″ suggested the presence of a methyl ester group at C-7″. Consequently, the planar structure of 2 was determined as the structure shown in Figure 1. The stereochemical identification of 2 was challenging. A previous report showed that pericosines are C7 cyclohexenoid metabolites from the fungus Periconia byssoides OUPS-N133,27,28 and the planar structures of pericosines B, C, and E in that report are almost identical to one of the hydroxylated cyclohexenyl moieties of 2. The absolute and relative configurations of pericosines were characterized based on those determined by total synthesis, but it was still difficult to determine the configuration of pericosine analogues due to the ambiguity of the conformation of the cyclohexenyl ring.29 Unfortunately, our attempt to purify pericosine from the acid hydrolyzate of 2 was not successful. By comparing the coupling constants with literature values,29 we tentatively identified the relative configurations as (3″ R*, 4″R*, 5″R*, 6″S*), which was identical to those of pericosine B. SinceA. rabiei is phylogenetically related to P. byssoides, both belong to the order Pleosporales, the finding of pericodepside suggested thatA. rabiei likely produces pericosine B. However, further experimental evidence is needed to confirm these configurations. Here, we named 2 as pericodepside.
Figure 2.
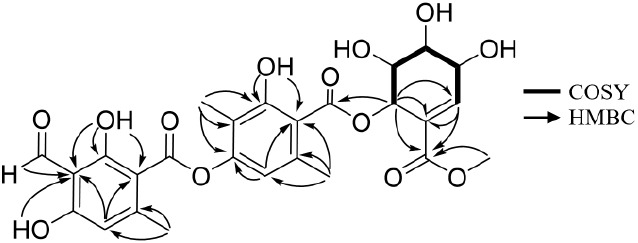
1H–1H correlation spectroscopy and key heteronuclear multiple bond correlations for pericodepside (2).
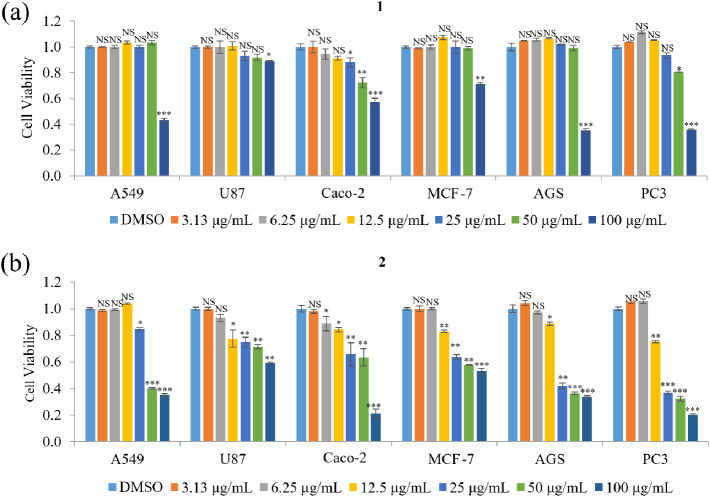
The cellular toxicities of 1 and 2 were examined by an MTT assay using several human cancer cell lines, such as lung carcinoma (A549), glioblastoma cell (U87), colorectal adenocarcinoma (Caco-2), breast cancer cell (MCF-7), gastric adenocarcinoma (AGS), and prostatic adenocarcinoma (PC3) cells. The viability of A549, U87, MCF-7, and AGS cells was not affected by treatment with 1 at concentrations below 100 μg/mL, but ≥100 μg/mL 1 significantly decreased cell viability. In addition, the viability of Caco-2 and PC3 cells was unaffected by 1 at <25 μg/mL but was decreased by 25–100 μg/mL of 1 (Figure 3a). Treatment with 0.78–12.5 μg/mL of 2 did not affect the viability of any of the cell lines, whereas treatment with 12.5–100 μg/mL reduced the viability of all the cell lines in a concentration-dependent manner (Figure 3b). Therefore, these results indicate that 2 has a stronger bioactivity for decreasing cancer cell viability than 1. Compounds 1 and 2 had IC50 values of 81–300 μg/mL and 27–120 μg/mL, respectively, against the tested cell lines (Table 2), indicating that 1 and 2 are not cytotoxic (cytotoxic compounds have an IC50 value <10 μg/mL). A nontoxic concentration (5 μg/mL) was used for subsequent experiments.
Figure 3.
Effects of 1 and 2 on the viability of various cancer cell lines. (a,b) The relative viability of A549, U87, Caco-2, MCF-7, AGS, and PC3 cells treated with 3.13–100 μg/mL of preatranorin III (1) (a) or pericodepside (2) (b) for 48 h was measured by an MTT assay. Data represent the mean ± standard deviation, n = 3. *p < 0.05; **p < 0.01***; p < 0.001; NS, no significant difference compared with DMSO-treated cells in each group.
Table 2. IC50 Values of 1 and 2 on Various Cancer Cell Lines.
| Tissue source | Cell lines | IC50 for 1 (μg/mL) | IC50 for 2 (μg/mL) |
|---|---|---|---|
| Human lung carcinoma cell | A549 | 109.05 ± 2.04 | 55.59 ± 1.75 |
| Human glioblastoma cell | U87 | 303.64 ± 2.49 | 120.42 ± 2.08 |
| Human colorectal adenocarcinoma cell | Caco-2 | 119.85 ± 2.08 | 48.81 ± 1.69 |
| Human breast cancer cell | MCF-7 | 262.40 ± 2.42 | 75.15 ± 1.88 |
| Human gastric cancer cell | AGS | 99.04 ± 1.99 | 37.69 ± 1.58 |
| Human prostatic adenocarcinoma | PC3 | 81.37 ± 1.91 | 27.73 ± 1.44 |
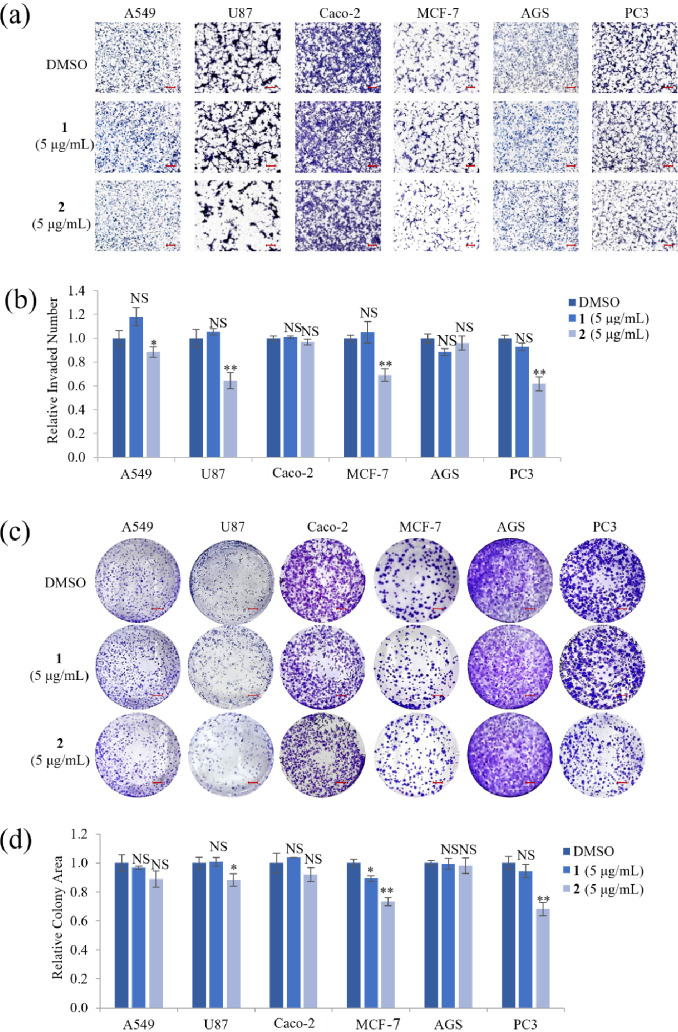
Cell invasiveness plays a vital role in metastatic diseases, which is the leading cause of death in cancer patients.30 To elucidate whether a nontoxic concentration of 1 and 2 affects cell motility and proliferation, invasion and clonogenic assays were performed on cell lines treated with 5 μg/mL of 1 or 2. Treatment with 1 did not inhibit cell invasion or decrease the number of colonies in all cell lines tested, except MCF-7 cells. However, image and quantitative analyses showed that treatment with 2 significantly inhibited the invasion abilities of A549, U87, MCF-7, and PC3 cells by ∼12%, ∼38%, ∼31%, and ∼38%, respectively (Figure 4a,b) and reduced the number of U87, MCF-7, and PC3 cell colonies by ∼12%, ∼27%, and ∼32%, respectively (Figure 4c,d). Taken together, these results indicated that 5 μg/mL 2 inhibited both cell invasion and proliferation in U87, MCF-7, and PC3 cells.
Figure 4.
Effect of compounds 1 and 2 on cell invasion and proliferation of various cancer cell lines. (a) Representative images of A549, U87, Caco-2, MCF-7, AGS, and PC3 cells that invaded through a transwell coated with 1% gelatin after treatment with a nontoxic concentration (5 μg/mL) of compounds 1 or 2 for 24 h. Scale bar = 100 μm. (b) Quantitative analysis of the number of invaded cells in each group. (c) Representative images and (d) quantitative analysis of a clonogenic assay in various cancer cell lines treated with 5 μg/mL of compounds 1 or 2 for 14 days. Representative images from three independent experiments are shown (n = 3). Scale bar = 35 mm. Data represent the mean ± standard deviation. *p < 0.05; **p < 0.01; NS, no significant difference compared with DMSO-treated cells in each group.
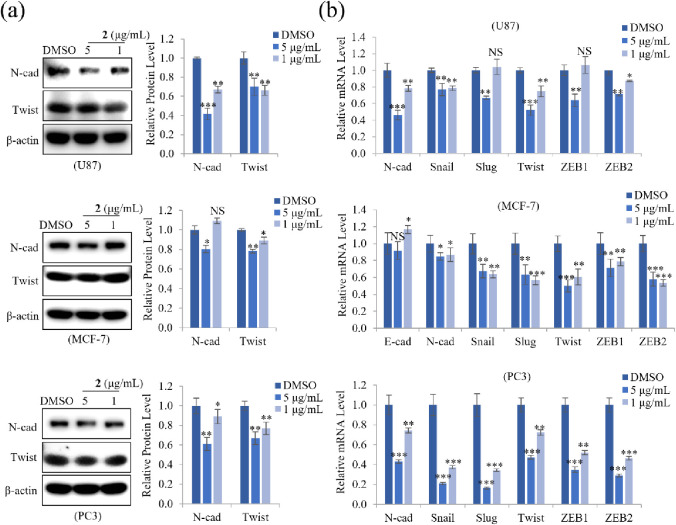
EMT can facilitate cancer cell invasion and metastasis and plays a critical role in tumor progression. E-cadherin and N-cadherin, as well as the transcription factors Snail, Twist, and ZEB1/2, are EMT markers.10,31 Since 2 markedly inhibited cell invasion and proliferation in U87, MCF-7, and PC3 cells, we examined the protein and mRNA expression levels of EMT markers to determine how 2 affects cell motility. Treatment with 5 or 1 μg/mL of 2 markedly decreased protein expression of N-cadherin and Twist, as well as the mRNA expression of N-cadherin, Snail, Slug, Twist, and ZEB1/2 in PC3 cells. Similarly, 2 suppressed the protein and mRNA expression of EMT markers in U87 and MCF-7 cells, especially N-cadherin expression in U87 cells and Twist expression in MCF-7 cells at a dose-dependent manner (Figure 5a,b). These results suggested that 2 modulates the expression of the EMT effector N-cadherin by downregulating transcription factors Snail, Slug, Twist, and ZEB1/2, thereby inhibiting cell motility in U87, MCF-7, and PC3 cells.
Figure 5.
Effect of 2 on protein and mRNA expression of EMT markers. (a) U87, MCF-7, and PC3 cells were treated with 5 or 1 μg/mL of 2. After incubation for 24 h, the cells were lysed, and the total protein was subjected to immunoblot analyses. Representative images and quantitative analysis of relative protein levels of N-cadherin and Twist in cells treated with 2 show that 2 concentration-dependently reduced protein levels. β-actin was used as a loading control. (b) Relative mRNA levels of EMT markers (E-cadherin, N-cadherin) and their regulators (Snail, Slug, Twist, ZEB1, and ZEB2) were analyzed by qRT-PCR. Data represent the mean ± standard deviation (n = 3 for each group). * p < 0.05; ** p < 0.01; *** p < 0.001; NS: no significant difference compared with DMSO-treated cells.
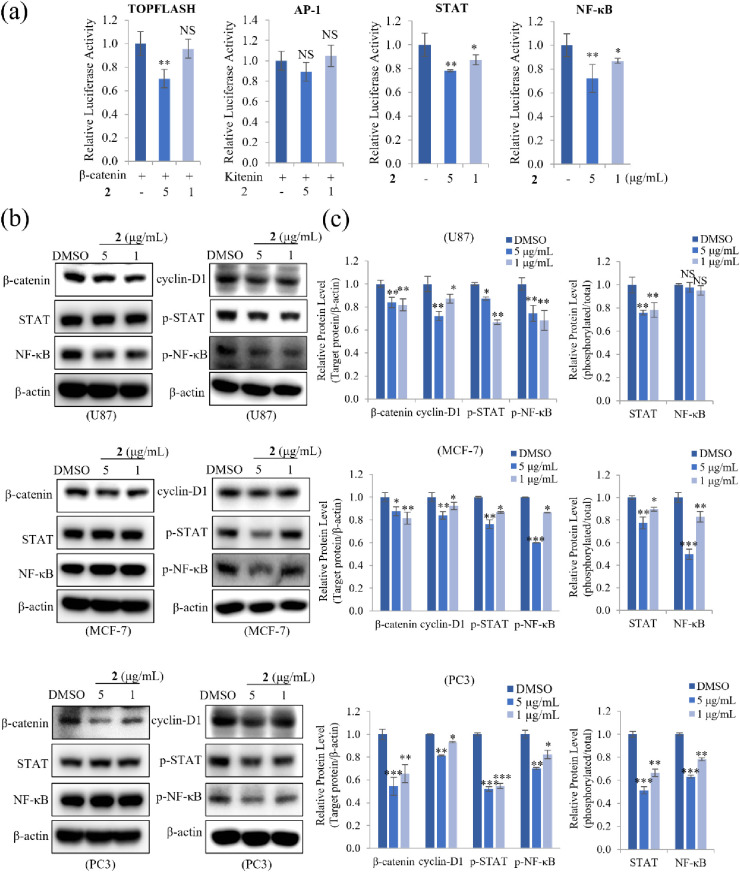
To identify the signaling pathways involved in the inhibition of EMT by 2, reporter assays were performed by using HEK293T cells transfected with vectors containing TOPFLASH, AP-1, STAT, or NF-κB promoters. As shown in Figure 6a, 5 μg/mL 2 significantly suppressed β-catenin-mediated TOPFLASH activity. Compound 2 also concentration-dependently reduced STAT and NF-κB transcriptional activity. However, kitenin-mediated AP-1 activity was unaffected by 2. To examine whether 2 affected the activation of signaling pathways such as Wnt, STAT, and NF-κB, their target molecules were measured by Western blot in U87, MCF-7, and PC3 cells. Compound 2 decreased protein levels of the Wnt signaling target β-catenin and its downstream target cyclin-D1. Also, 2 significantly decreased the protein levels of phosphorylated STAT and NF-κB in a dose-dependent manner but had no effect on the total protein levels in MCF-7 and PC3 cells. In addition, 2 also reduced the phosphorylated STAT level in U87 cells but strongly decreased total NF-κB level as well as phosphorylated NF-κB (Figure 6b). Quantitative analysis showed that these target protein levels were inhibited more robustly in PC3 cells than in other cell lines (Figure 6c). Taken together, these findings demonstrated that 2 suppressed the invasiveness and proliferation of U87, MCF-7, and PC3 cells by inhibiting the activation of Wnt, STAT, and NF-κB signaling, suggesting that 2 has therapeutic potential in glioma, breast, and prostate cancers.
Figure 6.
Effect of 2 on the expression of transcription factors related to Wnt, AP-1, STAT, and NF-κB signaling pathways. (a) HEK293T cells were cotransfected with the pRL-TK (Renilla) plasmid and the pTOPFLASH-luc/β-catenin-luc, pAP-1-luc/Kitenin-luc, pSTAT-luc, or pNF-κB-luc reporter plasmids (firefly). After 12 h, transfected cells were treated with 5 or 1 μg/mL 2 for an additional 48 h. The relative luciferase activity was then quantified. (b) U87, MCF-7, and PC3 cells treated with 5 or 1 μg/mL of compound 2 for 24 h were lysed, and total protein was immunoblotted with the indicated antibodies. (c) The relative protein levels of β-catenin, cyclin-D1, p-STAT, and p-NF-κB in cells treated with 2 were quantified, showing that 2 concentration-dependently reduced protein levels. β-actin was used as a loading control. The relative protein levels of phospho-STAT and phospho-NF-κB were compared to the total expression of STAT and NF-κB. Data represent the mean ± standard deviation (n = 3 for each group). * p < 0.05; ** p < 0.01; *** p < 0.001; NS: no significant difference compared with DMSO-treated cells.
Conclusions
Overall, this study effectively detailed the isolation and structural elucidation of the new depside derivative pericodepside (2). The core structure of 2 comprised a depside–pericosine conjugate, with its depside moiety composed of 3-methylorsellinic acid and hemomatommic acid interconnected by an ester bond. Further esterification of the depside moiety and pericosine analogue led to the formation of 2. Pericodepside (2) showed a stronger inhibitory activity than 1 on cell viability, invasion, and cell growth. Compound 2 suppressed expression of the EMT effector N-cadherin and its transcription factors Snail, Slug, Twist, and ZEB1/2 by downregulating the expression of β-catenin, phosphorylated STAT, and NF-κB, thereby inhibiting the cancer invasiveness and proliferation of U87, MCF-7, and PC3 cells (Figure 7).
Figure 7.
A schematic representation of the mechanism of action of pericodepside (2).Pericodepside (2) suppresses the EMT effector N-cadherin and its transcription factors Snail, Slug, Twist, and ZEB1/2/by inhibiting the activation of Wnt, STAT, and NF-κB, thereby inhibiting cancer cell invasion and proliferation.
Experimental Section
Materials
The strain utilized in this study was the genetically modified A. rabiei strain, as described in our previous paper.23 In this engineered strain, two biosynthetic genes, atr1 and atr2 that had been cloned from the atranorin biosynthetic gene cluster found in Stereocaulon alpinum (GenBank entry PRJNA693574) were introduced into an A. rabiei strain that had lost the ability to produce solanapyrones. The A. rabiei engineered strain (Sta04643–pII95–T2) was conserved at the Korean Lichen and Allied Bioresource Center at Sunchon National University (South Korea).
Extraction and Purification
To conduct structural identification and biological evaluation, we purified 1 and 2 from the culture extracts of the genetically modified A. rabiei strain expressing atr1 and atr2. In a previous study, our findings indicated that 1 was the major product synthesized by this strain. Here, we identified the production of 2 by the same strain, albeit as a minor product. In order to obtain a sufficient amount of 2, we conducted a large-scale culture of this strain. The strain was first grown on potato-dextrose agar (PDA) media at 20 °C for 3 days. Subsequently, the agar was sectioned into small blocks (0.5 cm, diameter), inoculated on fresh PDA, and incubated for 3 weeks at room temperature. Four 0.5-L bottles containing PDA culture medium were autoclaved, resulting in 20 PDA plates for each 0.5-L batch, amounting to a total of 80 plates. The entire batch of 80 PDA culture medium plates was inoculated. After 3 weeks of incubation, 80 PDA culture plates were harvested, immersed in ethyl acetate, and extracted through sonification more than three times. The ethyl acetate was filtered and readied for the subsequent production of crude extracts.
Culture extracts were evaporated to dryness on a rotavapor, followed by reconstitution with methanol and subsequent analysis using high-performance liquid chromatography (HPLC). The separation was achieved on semipreparative HPLC, employing a Kromasil C18-column (250 × 10 mm, 5 μm, 10 nm; at 40 °C) at a flow rate of 2.1 mL/min, with UV monitoring at 254 nm. Compound 1 was purified using 80% acetonitrile (tR = 9.60 min; 18.2 mg), and 2 was purified using a 55% acetonitrile solvent (tR = 16.27 min; 9.4 mg). The solvents used were supplemented with 0.1% trifluoroacetic acid. The purity of 2 was under 90%. Consequently, a second separation round was performed using 50% methanol buffered with 0.1% trifluoroacetic acid as the mobile phase. This separation occurred at a flow rate of 1 mL/min on the YMC-Pack ODS-A column (150 × 4.6 mm, 5 μm, 12 nm) at 40 °C, resulting in a yield of 7.2 mg of 2 (with a retention time tR = 18.90 min). The purified 2 was subjected to NMR spectroscopic analysis. The Bruker Avance III HD500 spectrometer (Bruker, Billerica, MA, USA) was used to obtain the 1D and 2D NMR spectra for 2 in CD3OD. Additionally, the JEOL 400 MHz NMR spectrometer (JEOL, Ltd., Tokyo, Japan) was utilized to acquire the 1D and 2D NMR spectra for 2 in DMSO-d6. HRESIMS was performed by using a Waters VION IMS QTOF mass spectrometer (Waters MS Technologies, Manchester, UK). The chromatography (Figure S3) from HPLC displayed the purity of 2. With a purity surpassing 90%, compound 2 is suitable for biological activities.
Proatranorin III (1): white solid; 1H NMR (400 MHz, CDCl3): δH 12.54 (s, OH), 12.45 (s, OH),11.77 (s, OH), 10.35 (s, CHO), 6.54 (s, 1H), 6.40 (s, 1H), 2.68 (s, 3H), 2.59 (s, 3H), 2.08 (s, 3H).23 HRESIMS m/z 359.0760 [M–H]− (calcd. for C18H15O8, 359.0767) (Figure S1); the MS/MS spectrum is deposited in the GNPS spectral library,
https://gnps.ucsd.edu/ProteoSAFe/gnpslibraryspectrum.jsp?SpectrumID=CCMSLIB00005885126#%7B%7D.
Pericodepside (2): light violet powder; UV (MeOH) λmax (log ε) 253 (4.57), 323 (0.48); 1H NMR (500 MHz, CD3OD), 13C NMR (125 MHz, CD3OD) data, 1H NMR (400 MHz, DMSO-d6), and13C NMR (100 MHz, DMSO-d6) data, see Table 1; HRESIMS m/z 545.1292 [M-H]− (calculated for C26H25O13, 545.1295). The MS/MS spectrum is deposited in the GNPS spectral library,
https://gnps.ucsd.edu/ProteoSAFe/gnpslibraryspectrum.jsp?SpectrumID=CCMSLIB00012176129#%7B%7D.
Cell Culture
The human cancer cell lines A549 (lung carcinoma cell), U87 (glioblastoma cell), Caco-2 (colorectal adenocarcinoma cell), MCF-7 (breast cancer cell), AGS (gastric cancer cell), and PC3 (prostatic adenocarcinoma) were cultured in DMED or RPMI medium (Gen Depot, USA) supplemented with 10% fetal bovine serum (FBS; Gen Depot, USA) and 1% penicillin-streptomycin (Gen Depot, USA) at 37 °C in a humidified atmosphere containing 5% CO2.
MTT Assay
A549, U87, Caco-2, MCF-7, AGS, and PC3 cell lines were performed to detect the cell viability based on the colorimetric quantification of MTT (3-(4, 5-dimethylthiazol-2-yl)-2, 5-diphenyltetrazolium bromide) assay. Briefly, 2 × 10⁴ cells/mL of cells were seeded into 96-well plates, grown overnight, and then incubated with 1 and 2 at concentrations ranging from 3.3 to 100 μg/mL for 48 h. After incubation with MTT solution for 4 h, cells were lysed with DMSO. The absorbance value at 540 nm was measured using a microplate reader and analyzed with Gen 5 (2.03.1; BioTek, VT, USA).
Invasion Assay
Transwell invasion assay was performed using an 8 μm-pore polycarbonate membrane transwell chamber (Corning, New York, USA), which was precoated with 1% gelatin. Briefly, A549, U87, Caco-2, MCF-7, AGS, and PC3 cells were plated at 1–2 × 10⁶ cells/well in DMEM or RPMI medium containing 0.2% bovine serum albumin (BSA) in the upper compartment of the chamber. The culture medium containing 10 μg/mL fibronectin was placed as a chemoattractant in the lower chamber. After 12 h incubation, cells were treated with DMSO (0.01%), 5 μg/mL of 1 or 5 μg/mL of 2. After incubation for 24 h, the cells in the upper chamber were fixed with a Diff Quik kit (Sysmex, Kobe, Japan) and counted under a light microscope (5 fields per chamber).
Clonogenic Assay
A549, U87, Caco-2, MCF-7, AGS, and PC3 cells were seeded at a density of 0.5–2 × 10³ cells/well in 2 mL of DMEM or RPMI medium and then treated with DMSO (0.01%), 5 μg/mL of 1 or 2 after seeding at 3 h. After incubation for 7–14 days at 37 °C, cells were stained with 0.01% crystal violet. Pixel intensity of colony areas was measured by the IMT iSolutionFL software (IMT i-Solution Inc., Northamp-ton, NJ, USA) in the whole microscope field in each plate. Data represent the mean of the three experiments.
Reporter Assay
HEK293T cells were transfected with TOPFLASH-luc/β-catenin-luc, AP-1-luc/Kitenin-luc, STAT-luc, and NF-κB-luc-conjugated firefly plasmid along with Renilla-luc (pRL-TK) plasmid using the GENE 9 DNA transfection reagent (Roche,Werk Penzberg, Germany). After 12 h of transfection, cells were treated with DMSO (0.01%) and 1 or 5 μg/mL of 2 and then were incubated for 48 h. Luciferase activity was measured using the Dual-Luciferase reporter assay kit (Promega, Madison, WI, USA), normalizing firefly against Renilla luciferase activity to control for transfection efficiency.
Western Blot
U87, MCF-7, and PC3 cells were treated with 1 or 5 μg/mL of 2 for 24 h. 20 μg of extracted protein was separated by applying 8–10% sodium dodecyl sulfate-polyacrylamide gel electrophoresis. Antibodies against N-cadherin (Cell Signaling Technology) and Twist (Abcam) primary antibodies were used to detect the EMT markers. Anti-β-catenin (Cell Signaling Technology), anticyclin-D1 (Calbiochem), phospho-STAT, and phospho-NF-κB (Cell Signaling Technology) primary antibodies were used to detect multiple target molecules. β-Actin (Santa Cruz Biotechnology) primary antibody was used as an internal standard. For each sample, bands were measured by Multi Gauge 3.0. Values were expressed as densitometric units, corresponding to the signal intensity.
Quantitative Real-Time PCR
Total RNAs were isolated from U87, MCF-7, and PC3 cells after treatment with DMSO (0.01%), 1 or 5 μg/mL of 2 for 24 h using RNAiso Plus (TaKaRa, Otsu, Japan) according to the manufacturer’s instruction. Total RNA (1 μg) from each group of treated cells was converted to cDNA using an M-MLV Reverse Transcriptase Kit (Invitrogen, Carlsbad, USA) and SYBR green (En-zynomics, Seoul, Korea). E-Cadherin (forward) 5′-cagaaagttttccaccaaag-3′ and (reverse) 5′-aaatgtgagcaattctgctt-3′; N-cadherin (forward) 5′-ctcctat gagtggaacaggaacg-3′ and (reverse) 5′-ttggatcaatgtcataatcaagtgctgta-3′; Snail (forward) 5′-tcccgggcaatttaacaatg-3′ and (reverse) 5′-tgggagacacatcggtcga-3′; Slug (forward) 5′-cgaactggacacacatacagtg-3′ and (reverse) 5′-ctgaggatctctggttgtggt-3′; Twist (forward) 5′-cgggagtccgcagtctta-3′ and (reverse) 5′-tgaatcttgctcagcttgtc-3′; ZEB1 (forward) 5′-atgacacaggaaaggaagg-3′ and (reverse) 5′-agcagtgtcttgttgtag-3′; ZEB2 (forward) 5′-caagaggcgcaaacaagcc-3′ and (reverse) 5′-ggttggcaataccgtcatcc-3′; β-Actin (forward) 5′-attgtgaactttgggggatg-3′ and (reverse) 5′-gatgagattggcatggcttt-3′. qRT-PCR reactions and analyses were performed using CFX (Bio-Rad, Hercules, USA).
Statistical Analysis
All experiments were performed in triplicates. All statistical analyses were performed using IBM Statistical Package for Social Science (SPSS) version 22 and SigmaPlot 12.5. The data were expressed as mean values ± standard deviation. The student t test was used to determine significant differences between the groups, a p value of <0.05 was considered significant.
Acknowledgments
This research was supported by the National Research Foundation of Korea (NRF) grants funded by the Ministry of Science, ICT, and Future Planning (RS-2023-00250803). W.K. was supported by the National Research Foundation of Korea (NRF) grant funded by the Korea government (MSIT) (2022R1C1C2004118). R.L. was partly supported by The Korean National Research Resource Center Program (2017M3A9B8069471).
Supporting Information Available
The Supporting Information is available free of charge at https://pubs.acs.org/doi/10.1021/acsomega.3c08136.
Figures S1–S2, HRESIMS spectra of 1 and 2; Figure S3, HPLC chromatogram of 2; Figures S4–S8, 1H, 13C, COSY, HSQC, and HMBC NMR spectra of 2 in CD3OD; Figures S9–S13, 1H, 13C, COSY, HSQC, and HMBC NMR spectra of 2 in DMSO-d6 (PDF)
Author Contributions
⊥ R.Z. and R.L. contributed equally to this paper.
The authors declare no competing financial interest.
Supplementary Material
References
- Cao W.; Chen H. D.; Yu Y. W.; Li N.; Chen W. Q. Changing profiles of cancer burden worldwide and in China: A secondary analysis of the global cancer statistics 2020. Chin. Med. J. 2021, 134, 783–791. 10.1097/CM9.0000000000001474. [DOI] [PMC free article] [PubMed] [Google Scholar]
- Sung H.; Ferlay J.; Siegel R. L.; Laversanne M.; Soerjomataram I.; Jemal A.; Bray F. Global cancer statistics 2020: GLOBOCAN estimates of incidence and mortality worldwide for 36 cancers in 185 countries. CA Cancer J. Clin. 2021, 71, 209–249. 10.3322/caac.21660. [DOI] [PubMed] [Google Scholar]
- Ismael S. A. A.; Mohammed A.; Hefny H. An enhanced deep learning approach for brain cancer MRI images classification using residual networks. Artif Intell Med. 2020, 102, 101779. 10.1016/j.artmed.2019.101779. [DOI] [PubMed] [Google Scholar]
- Andinata B.; Bachtiar A.; Oktamianti P.; Partahi J. R.; Dini M. A Comparison of Cancer Incidences Between Dharmais Cancer Hospital and GLOBOCAN 2020: A Descriptive Study of Top 10 Cancer Incidences. Indonesian J. Cancer 2023, 17, 119–122. 10.33371/ijoc.v17i2.982. [DOI] [Google Scholar]
- Rothrock R. J.; Barzilai O.; Reiner A. S.; Lis E.; Schmitt A. M.; Higginson D. S.; Yamada Y.; Bilsky M. H.; Laufer I. Survival trends after surgery for spinal metastatic tumors: 20-year cancer center experience. Neurosurgery 2021, 88, 402. 10.1093/neuros/nyaa380. [DOI] [PMC free article] [PubMed] [Google Scholar]
- Liu M.; Yang J.; Xu B.; Zhang X. Tumor metastasis: Mechanistic insights and therapeutic interventions. MedComm 2021, 2, 587–617. 10.1002/mco2.100. [DOI] [PMC free article] [PubMed] [Google Scholar]
- Welch D. R.; Hurst D. R. Defining the hallmarks of metastasis. Cancer Res. 2019, 79, 3011–3027. 10.1158/0008-5472.CAN-19-0458. [DOI] [PMC free article] [PubMed] [Google Scholar]
- Nikolaou S.; Machesky L. The stressful tumour environment drives plasticity of cell migration programmes, contributing to metastasis. J. Pathol. 2020, 250, 612–623. 10.1002/path.5395. [DOI] [PMC free article] [PubMed] [Google Scholar]
- Gaponova A.; Rodin S.; Mazina A.; Volchkov P. Epithelial-mesenchymal transition: Role in cancer progression and the perspectives of antitumor treatment. Acta Naturae 2020, 12, 4–23. 10.32607/actanaturae.11010. [DOI] [PMC free article] [PubMed] [Google Scholar]
- Nowak E.; Bednarek I. Aspects of the epigenetic regulation of EMT related to cancer metastasis. Cells 2021, 10, 3435. 10.3390/cells10123435. [DOI] [PMC free article] [PubMed] [Google Scholar]
- Ang H. L.; Mohan C. D.; Shanmugam M. K.; Leong H. C.; Makvandi P.; Rangappa K. S.; Bishayee A.; Kumar A. P.; Sethi G. J. Mechanism of epithelial-mesenchymal transition in cancer and its regulation by natural compounds. Med. Res. Rev. 2023, 43, 1141–1200. 10.1002/med.21948. [DOI] [PubMed] [Google Scholar]
- Ribatti D.; Tamma R.; Annese T. Epithelial-mesenchymal transition in cancer: A historical overview. Transl. Oncol. 2020, 13, 100773. 10.1016/j.tranon.2020.100773. [DOI] [PMC free article] [PubMed] [Google Scholar]
- Huang Z.; Zhang Z.; Zhou C.; Liu L.; Huang C. Epithelial–mesenchymal transition: The history, regulatory mechanism, and cancer therapeutic opportunities. MedComm 2022, 3, e144 10.1002/mco2.144. [DOI] [PMC free article] [PubMed] [Google Scholar]
- Calcott M. J.; Ackerley D. F.; Knight A.; Keyzers R. A.; Owen J. G. Secondary metabolism in the lichen symbiosis. Chem. Soc. Rev. 2018, 47, 1730–1760. 10.1039/C7CS00431A. [DOI] [PubMed] [Google Scholar]
- Shahid M.; Rasool A.; Anjum F.; Rehman M.. Biomedical perspectives of lichen-derived products. In Lichen-Derived Products: Extraction and Applications; Wiley, 2020; pp 263. DOI: 10.1002/9781119593249.ch12. [DOI] [Google Scholar]
- Adeel S.; Majeed A.; Azeem M.; Iqbal N.; Amin N.. Lichen-Derived Products as Sustainable Source of Natural Dyes. In Lichen-Derived Products: Extraction And Application; Wiley, 2020. [Google Scholar]
- Varol M. Lichens as a promising source of unique and functional small molecules for human health and well-being. Studi. Nat. Prod. Chem. 2019, 60, 425–458. 10.1016/B978-0-444-64181-6.00012-7. [DOI] [Google Scholar]
- Ibrahim S. R.; Sirwi A.; Eid B. G.; Mohamed S. G.; Mohamed G. A. Fungal depsides-Naturally inspiring molecules: Biosynthesis, structural characterization, and biological activities. Metabolites 2021, 11, 683. 10.3390/metabo11100683. [DOI] [PMC free article] [PubMed] [Google Scholar]
- Zhou R.; Yang Y.; Park S. Y.; Nguyen T. T.; Seo Y. W.; Lee K. H.; Lee J. H.; Kim K. K.; Hur J. S.; Kim H. G. The lichen secondary metabolite atranorin suppresses lung cancer cell motility and tumorigenesis. Sci. Rep. 2017, 7, 8136. 10.1038/s41598-017-08225-1. [DOI] [PMC free article] [PubMed] [Google Scholar]
- Kalın S. N.; Altay A.; Budak H. Effect of evernic acid on human breast cancer MCF-7 and MDA-MB-453 cell lines via thioredoxin reductase 1: A molecular approach. J. Appl. Toxicol. 2023, 43, 1148–1158. 10.1002/jat.4451. [DOI] [PubMed] [Google Scholar]
- Emsen B.; Aslan A.; Togar B.; Turkez H. In vitro antitumor activities of the lichen compounds olivetoric, physodic and psoromic acid in rat neuron and glioblastoma cells. Pharm. Biol. 2016, 54, 1748–1762. 10.3109/13880209.2015.1126620. [DOI] [PubMed] [Google Scholar]
- Chen L.; Wei X.; Matsuda Y. Depside bond formation by the starter-unit acyltransferase domain of a fungal polyketide synthase. J. Am. Chem. Soc. 2022, 144, 19225–19230. 10.1021/jacs.2c08585. [DOI] [PubMed] [Google Scholar]
- Kim W.; Liu R.; Woo S.; Kang K. B.; Park H.; Yu Y. H.; Ha H.-H.; Oh S.-Y.; Yang J. H.; Kim H. J.; Yun S.-H. Linking a gene cluster to atranorin, a major cortical substance of lichens, through genetic dereplication and heterologous expression. mBio 2021, 12, 10–1128. 10.1128/mBio.01111-21. [DOI] [PMC free article] [PubMed] [Google Scholar]
- Liu Q.; Zhang D.; Gao S.; Cai X.; Yao M.; Xu Y.; Gong Y.; Zheng K.; Mao Y.; Yang L.; Yang D. Didepside Formation by the Nonreducing Polyketide Synthase Preu6 of Preussia isomera Requires Interaction of Starter Acyl Transferase and Thioesterase Domains. Angew. Chem., Int. Ed. Engl. 2023, 135, e202214379 10.1002/ange.202214379. [DOI] [PubMed] [Google Scholar]
- Sakemi S.; Hirai H.; Ichiba T.; Inagaki T.; Kato Y.; Kojima N.; Nishida H.; Parker J. C.; Saito T.; Tonai-Kachi H. J.; VANVOLKENBURG M. A. Thielavins as Glucose-6-phosphatase (G6Pase) Inhibitors Producing Strain, Fermentation, Isolation, Structural Elucidation and Biological Activities. J. Antibiot. 2002, 55, 941–951. 10.7164/antibiotics.55.941. [DOI] [PubMed] [Google Scholar]
- Perlatti B.; Lan N.; Earp C. E.; AghaAmiri S.; Vargas S. H.; Azhdarinia A.; Bills G. F.; Gloer J. B. Arenicolins: C-glycosylated depsides from Penicillium arenicola. J. Nat. Prod. 2020, 83, 668–674. 10.1021/acs.jnatprod.9b01099. [DOI] [PMC free article] [PubMed] [Google Scholar]
- Yamada T.; Iritani M.; Ohishi H.; Tanaka K.; Minoura K.; Doi M.; Numata A. Pericosines, antitumour metabolites from the sea hare-derived fungus Periconia byssoides. Structures and biological activities. Org. Biomol. Chem. 2007, 5, 3979–3986. 10.1039/b713060k. [DOI] [PubMed] [Google Scholar]
- Numata A.; Iritani M.; Yamada T.; Minoura K.; Matsumura E.; Yamori T.; Tsuruo T. Novel antitumour metabolites produced by a fungal strain from a sea hare. Tetrahedron Lett. 1997, 38, 8215–8218. 10.1016/S0040-4039(97)10198-8. [DOI] [Google Scholar]
- Usami Y.; Ichikawa H.; Arimoto M. Synthetic efforts for stereo structure determination of cytotoxic marine natural product pericosines as metabolites of Periconia sp. from sea hare. Int. J. Mol. Sci. 2008, 9, 401–421. 10.3390/ijms9030401. [DOI] [PMC free article] [PubMed] [Google Scholar]
- Neophytou C. M.; Panagi M.; Stylianopoulos T.; Papageorgis P. The role of tumor microenvironment in cancer metastasis: Molecular mechanisms and therapeutic opportunities. Cancers 2021, 13, 2053. 10.3390/cancers13092053. [DOI] [PMC free article] [PubMed] [Google Scholar]
- Huang Y.; Hong W.; Wei X. The molecular mechanisms and therapeutic strategies of EMT in tumor progression and metastasis. J. Hematol. Oncol. 2022, 15, 129. 10.1186/s13045-022-01347-8. [DOI] [PMC free article] [PubMed] [Google Scholar]
Associated Data
This section collects any data citations, data availability statements, or supplementary materials included in this article.


