

Abstract

This investigation looks at the Late Triassic Baluti Formation’s organic geochemical, mineralogical, and petrographical characteristics from a single exploration well (TT-22) near the Taq Taq oilfield in northern Iraq. The Baluti Formation shale samples that were studied in the studied well have high total organic carbon (TOC %) values up to 4.92 wt % and mostly hydrogen-rich types I and II kerogen with a minor gradient to types II/III and III kerogen, indicating a good oil-source rock. The hydrogen-rich kerogen was also confirmed by various organic matter (OM) origins and depositional environment-related biomarkers. The biomarker indicators demonstrate that the Baluti shale was deposited under anoxic conditions and contains a variety of OM generated mostly from algae marine and other aqueous organic materials, along with some terrigenous land plants. The geochemical and optical maturity indicators show that most of the examined Baluti shale samples, with a deep burial depth of more than 4000 m, are thermally mature, thus defining peak-mature to late-mature stages of the oil generation window. According to the basin models, from the late Miocene to the present, between 10 and 59% of the kerogen in the Baluti shale source rock has been transformed into oil, which is consistent with the VR values between 0.77 and 1.08%. The presence of the oil crossover in these shale rocks with an oil saturation index of more than 100 mg HC/g rock supports the maximal oil generation from the Baluti source rock system. Additionally, there was little oil expulsion from the Baluti source rock system at the end of the late Miocene, with transformation ratio values below 60% (59%). Considering the more significant oil generation and little expulsion, a high pressure was generated and forced the brittle minerals of the Baluti shales (mainly quartz), creating a natural fracture system as recognized and observed in the thin section. This natural fracture system enhances the porosity system of tight shale rocks of the Baluti Formation, giving rise to a high probability of oil production using hydraulic fracturing stimulation.
1. Introduction
Petroleum resources have received increased attention, such that shale oil- and shale gas resources have recently become important global exploration targets.1 Marine and continental organic-rich shale rocks have been successfully explored and developed worldwide, showing remarkable potential in any sedimentary basin.2,3 Multi-integrated techniques are vital to the study of shale oil systems, where organic geochemistry and microscopic examination combined with 1-D basin modeling can be used to evaluate the organic matter (OM) characteristics, their ability to generate oil, and their recoverable estimates in sedimentary basins.4,5
The key focus of the present study is the Zagros Fold Belt (ZFB), which runs northwest-southeast in the northern part of the country (Figure 1a). The ZFB of the northern part of Iraq is one of the biggest and oldest oil-producing zones in Iraq and has seen oil production from oil fields of more than 15 various sizes (Figure 1b). Due to its good source rock appearances and the discovery of commercial petroleum accumulations in the basin, the ZFB has attracted the attention of the scientific community and the oil industry. Numerous investigations regarding the geochemical characteristics of the organic-rich Mesozoic sedimentary rock units have clarified the presence of excellent source rock intervals in the Jurassic and Cretaceous rock units.6−14 The most important and well-known ones are the Sargelu carbonates (Middle Jurassic), the Naokelekan carbonates and shales (Late Jurassic), and the Chia Gara carbonate-rich rocks (Late Jurassic-Early Cretaceous).10−12,15,16 Most of these formations in the northern Iraq’s oilfields, especially the Sargelu Formation, are filled with high-bituminous carbonate-rich rocks and reached a higher burial depth than other formations.13 The ZFB in northern Iraq’s Sargelu Formation is thought to be the primary source rock in this instance.8,14 The types I and II kerogens and mixed type II/III kerogens in the Sargelu organic-rich carbonates, which were deposited in a marine environment, make primarily oil-prone source rocks.6,13 Good geochemical relationships between the reservoir oils and the mature Sargelu rocks in the basin support this discovery.8 The Sargelu Formation is the main oil-source rock and is directly related to the main petroleum-producing regions recognized to date, acting as a conventional petroleum resource, according to Hakimi and Najaf8 analysis of the biomarker fingerprints of reservoir oils from oilfields in the ZFB. There is only one oil family, and the Sargelu Formation is acting as a conventional petroleum resource.
Figure 1.

(A) Location map for the northeast Arabian Peninsula in Iraq, which shows ZFB with oil and gas field locations, including studied oil field location (B).
Although the majority of earlier studies suggested that the organic-rich carbonate rocks of the Sargelu Formation are an important source rock potential for conventional exploration and production targets in northern Iraq, little is known about the organic-rich shales within the Late Triassic succession, particularly those from the Late Triassic Baluti Formation (Figure 2), which is the main subject of this investigation.
Figure 2.

Stratigraphic correlation chart for the Iraq and Kurdistan area, showing the Paleozoic-Cenozoic successions and the hydrocarbon occurrences.
The Late Triassic Baluti Formation’s organically rich shale intervals from the TT-22 well in the Taq Taq oilfield in Iraqi Kurdistan were thoroughly examined in this article, including their organic geochemistry, mineralogy, and petrographical features.
This study’s objectives were to determine the OM content, identify the present kerogen types, assess the petroleum generation potential, assess the OM’s origin, and prevail environmental conditions during deposition by employing multiple biomarkers. In order to anticipate the geothermal history, the ratios of the kerogen’s transformation into oil, the stages of oil production, and the expulsion of the Baluti source rock system, organic geochemical results are integrated with basin modeling and utilized to determine the potential of shale oil. This study also addresses the role of the petrographic data from an X-ray diffraction (XRD) experiment and a thin-section microscope in characterizing the types of visible porosity and mineralogical composition.
2. Geological Setting
On the northeastern edge of the Arabian Plate, North Iraq is located inside the Zagros Fold-Thrust Belt (Figure 1a). The Arabian and Eurasia plates collided throughout the Cretaceous and Tertiary periods, resulting in the formation of the Zagros Mountains.17−20 Thrust belt marks the collision zone between the Arabian and Eurasian plates, which extends through SE Turkey, NE Iraq, and western Iran.21,22 When the Neo-Tethys reached its maximum width of 4000 km in the Late Triassic to Middle Jurassic periods, the second stage of opening began.23,24 Throughout the Middle Triassic and Late Triassic, new extensions developed on the Arabian Plate’s northern and eastern edges.25 The associated tectonic activity produced a thick sedimentary fill in the foreland basin depocenter (resulting in the maturation of underlying source rocks) and the formation of large anticline folds (that have trapped the generated oil) (Figure 3a), making the ZFB of northern Iraq a prolific region of structural trapping for hydrocarbon production (Figure 3b–d; Mackertich and Samarra26).
Figure 3.

(A) Northwest-southeast structural cross-section across ZFB in north Iraq, indicating structures and lithology of rock units. (B) Seismic cross-section in the Shaikan oil field. (C) Seismic cross-section in the Taq Taq oil field. (D) Seismic cross-section in the kurdamir oil field (for location, see Figure 1B).
The lithostratigraphic column of the Kurdistan region, ranging from northern to northeastern Iraq is presented in Figure 2 of Mackertich and Samarra.26 The Kurdistan region received a mixture of clastic, carbonate, and evaporite sediments ranging from the Paleozoic (Cambrian-Permian) to the Cenozoic (Paleocene-Pliocene), with the maximum thickness of the Mesozoic (early Triassic-Late Cretaceous) sedimentary succession (Figure 2). The Mesozoic sediments are mostly carbonate, shale, and anhydrite deposited in marine to lagoonal shelf settings.27 The Baluti Formation, the primary subject of this investigation, is composed of carbonate-evaporate and subsidiary shale sequences (Figure 2), with its complementary type-section located near Sarki Village, Kurdistan region in North Iraq, near the middle of the Gara anticline.27 The Baluti Formation was mostly deposited in a lagoonal estuary environment,27 and the neritic lagoonal and evaporitic episodes of the depositional environment were also identified based on palynology and sedimentology investigations.
3. Datasets and Methods
In the current study, detailed organic geochemical, petrographic, and mineralogical analyses were performed on cutting samples from one exploration well (TT-22) in the Taq Taq oilfield of the ZFB, northern Iraq (Figure 1a). These cutting samples were collected from the calcareous shale intervals with high gamma ray responses at different depths (4008–4096 m) of the Late Triassic Baluti Formation (Figure 4). A higher gamma-ray response in the shales of the thicker Baluti Formation may reflect a deeper deposition environment and potentially more organic-rich facies. However, the studied well was drilled using water-based mud; therefore, the collected cutting samples were mainly washed with cold water to remove the mud drilling before being subjected to multi-geochemical and optical analyses.
Figure 4.
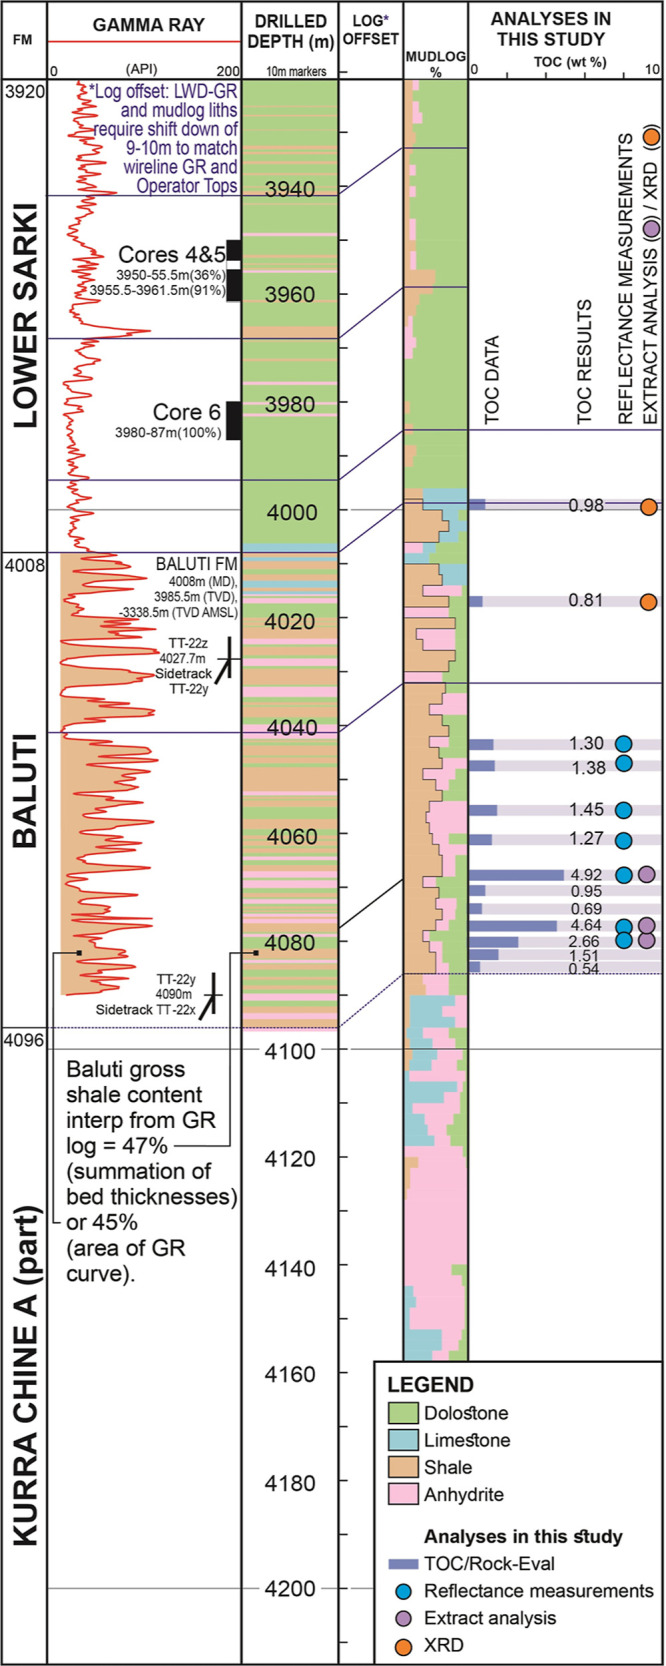
Stratigraphic column of Baluti and Lower Sarki Formations from TT-22 well, Kurdistan region, northern Iraq, and the location of studied samples with different geochemical techniques used in this study.
The description of the organic geochemical and petrographic analyses along the 1-D basin modeling study is highlighted in the next subsections.
3.1. Organic Geochemical Analyses
Thirteen calcareous shale samples from the Baluti Formation were analyzed for total organic carbon (TOC) content (TOC %) and conventional programmed pyrolysis (Rock-Eval 6). To remove carbonate minerals from the original crushed samples, 10% diluted HCl was used. 100 mg of the cleaned crushed samples was then tested using the Rock-Eval (RE) pyrolysis (Rock-Eval 6) apparatus to ascertain the TOC % content and the bulk programmed pyrolysis results.
In an atmosphere of helium, the samples were heated to 600 °C. After maintaining 300 °C for three min, the oven’s temperature was raised by 25 °C every minute. The characteristics that are evaluated during pyrolysis comprise TOC % content, pyrolysis yields of S1, S2, and S3, and the maximum temperature (Tmax) of S2 production (Table 1). According to Peters and Cassa,28 several other limitations, including the hydrogen index (HI = S2 × 100/TOC), oxygen index (OI = S3 × 100/TOC), and production index (PI = S1/S1 + S2), were also determined using various RE yields.
Table 1. Geochemical and Optical Results of the Analyzed Shales from the Late Triassic Baluti Formation in the TT-22 Well in the Taq Taq Oilfield, Including TOC Content, Solid Bitumen, RE Pyrolysis, and Reflectance Measurements of Bitumen-Stained Vitrinite OM (% VRo)a.
| Rock-Eval pyrolysis data |
VRo
(%) |
||||||||||||||
|---|---|---|---|---|---|---|---|---|---|---|---|---|---|---|---|
| sample ID | depth (m) | TOC (wt %) | solid bitumen (ppm) | S1–HC (mg/g) | S2–HC (mg/g) | S3–CO2 (mg/g) | HI (mg/g) | OI (mg/g) | PY (mg/g) | PI (mg/g) | Tmax (°C) | OSI (mg/g) | mean | number measuring | SD |
| TT1 | 4009 | 0.98 | 4.40 | 3.14 | 0.52 | 320 | 53 | 7.54 | 0.58 | 301 | 448.98 | ||||
| TT2 | 4027 | 0.81 | 1.47 | 1.55 | 0.51 | 191 | 63 | 3.02 | 0.49 | 307 | 181.48 | ||||
| TT3 | 4053 | 1.30 | 2.94 | 3.09 | 1.84 | 238 | 142 | 6.03 | 0.49 | 391 | 226.15 | 1.02 | 25 | 0.10 | |
| TT4 | 4059 | 1.38 | 2.24 | 2.75 | 2.48 | 199 | 180 | 4.99 | 0.45 | 394 | 162.32 | 0.97 | 10 | 0.05 | |
| TT5 | 4065 | 1.45 | 2.24 | 2.95 | 2.41 | 203 | 166 | 5.19 | 0.43 | 400 | 154.48 | 0.92 | 10 | 0.06 | |
| TT6 | 4071 | 1.27 | 2.77 | 2.59 | 2.19 | 204 | 172 | 5.36 | 0.52 | 395 | 218.11 | 1.07 | 20 | 0.07 | |
| TT7 | 4077 | 4.92 | 9572.95 | 6.77 | 34.74 | 4.00 | 706 | 81 | 41.51 | 0.16 | 394 | 137.60 | 1.06 | 30 | 0.10 |
| TT8 | 4079 | 0.95 | 1.65 | 4.16 | 0.76 | 438 | 80 | 5.81 | 0.28 | 397 | 173.68 | ||||
| TT9 | 4081 | 0.69 | 0.92 | 2.48 | 0.65 | 359 | 94 | 3.40 | 0.27 | 426 | 133.33 | ||||
| TT10 | 4083 | 4.64 | 10483.95 | 6.71 | 37.06 | 2.96 | 799 | 64 | 43.77 | 0.15 | 396 | 144.61 | 1.15 | 15 | 0.06 |
| TT11 | 4089 | 2.66 | 6208.86 | 6.46 | 13.83 | 2.74 | 520 | 103 | 20.29 | 0.32 | 390 | 242.86 | 1.00 | 10 | 0.12 |
| TT12 | 4091 | 1.51 | 2.00 | 4.90 | 0.79 | 312 | 50 | 6.90 | 0.29 | 395 | 132.45 | ||||
| TT13 | 4093 | 0.54 | 0.68 | 1.73 | 0.40 | 320 | 74 | 2.41 | 0.28 | 436 | 125.93 | ||||
TOC = total organic carbon; S1-peak = free contents of hydrocarbon (mg HC/g rock); S2-peak = remaining hydrocarbon potential (mg HC/g rock); S3 peak = produced carbon dioxide (mg CO2/g rock); HI = hydrogen index [S2 × 100/TOC (mg HC/g rock)]; OI = oxygen index [S3 × 100/TOC (mg CO2/g TOC)]; Tmax = maximum temperature at peak of S2 (°C); PI = production index [S1/(S1 + S2)]; OSI = oil saturated index (S1*100/TOC); and VR = measured vitrinite reflectance.
3.2. Organic Petrological Analysis
In this study, organic petrographic examinations were performed on seven shale samples, with more than 1 wt % TOC, in order to identify the organic facies in the studied samples along with vitrinite reflectance (% VRo) measurements by means of the standard polished block method.29 The whole samples were ground up ∼2–3 mm and placed in molds using a blend of Serifix resin and cold mount hardener. Once hardened, the block was pulverized to expose the sample surface and then individually polished to smooth surfaces following ASTM D2797–04.30
The vitrinite reflectance (VRo) in polished blocks was measured with a 50x oil immersion objective using a plane-polarized reflected-light LEICA DM 6000 M microscope supplied with Diskus Fossil software. The calibration was performed using a piece of sapphire glass standard with a reflectance value of 0.589%, and the numbers presented were the arithmetic means of 10–30 measurements (Table 1). Although the number of vitrinite measurements is relatively low for some samples, the standard deviation values of the measurement are around 0.05–0.12 (Table 1), and these low values of the standard deviation are normally acceptable. Thus, the VRo measurements of the analyzed samples are reliable.
3.3. Bitumen Extraction and Gas Chromatography-Mass Spectroscopy (GC-MS)
Three representative samples were selected based on TOC of more than 2 wt % and then subjected to extraction. The soluble bitumen (expressed in ppm of the total rock sample) in these samples was extracted through the blended solvents of dichloromethane (DCM) and methanol (CH3OH) for 3 days (72 h). The extracted bitumen from these three samples was fractionated into three fractions; aliphatic, aromatic hydrocarbons, and polar compounds (NSO) by means of petroleum ether, DCM, and CH3OH solvents, respectively, in liquid column chromatography (LCQ) with alumina and silica gel.
The three studied materials’ aliphatic and aromatic fractions were then subjected to GC-MS analysis utilizing an HP 5975B MSD-fused silica capillary column with a 30 m length, 0.25 μm inner diameter, and 0.25 μm film thickness, along with helium as the carrier gas. The Flame Ionization Detector’s temperature gradually increases from 40 to 300 °C at a consent rate of 4 °C/min and then was held for 30 min at 320 °C.
Tricyclic terpanes, hopanes, steranes, and diasteranes, as well as their proportions and characteristics, were evaluated using GC-MS analysis using specific ions such as m/z 191 and 217 mass fragmentograms. The heterocyclic and polycyclic aromatic compounds in the aromatic HC fraction were also produced from the GC-MS and studied based on specific ions, e.g., m/z 170, 178, 184, 192, and 198 mass fragmentograms. However, peak identification was established by comparing the studied ion’s retention time and mass spectra with those previously published.31−33
3.4. Thin-Section Microscopy and X-ray Diffraction Analysis
In this work, standard petrographic analysis, including thin sections and XRD, was utilized to estimate the visual porosity and mineral composition in the investigated Baluti shale samples. A standard thin-section examination was performed on four shale samples at the laboratories of the University of Sulaimani, Kurdistan, Iraq. In this case, visible porosity and pore types were estimated by using the image analysis on thin-section photomicrographs.
The Baluti shale samples were also studied using XRD analysis and used to reveal the qualitative and quantitative mineralogical compositions of the Baluti shale. XRD analysis was also carried out on three samples of the Baluti formation from the studied well (TT-22) using a Malvern PANalytical XRD diffractometer (XPERT-ROP diffractometer) using monochromatic—CuKα1 radiation (λ = 1.540598 Å).
3.5. Basin Modeling Procedures
The geological and thermal maturity data (i.e., VRo) were imported into Schlumberger’s PetroMod 1-D modeling software (version 2010 SP1) and used to build burial and thermal history models of the Late Triassic Baluti source rock system. In this example, a single exploratory well (TT-22) drilled to a total depth of up to 4613 m (Table 2) was utilized to construct basin models for the Late Triassic succession’s thermal history progression.
Table 2. Basin Model Input Data Used to Reconstruct the Burial and Thermal History One Well Location (TT-22) in the Taq Taq Oilfield, As Shown in Figure 1B.
| deposition
ages (Ma) |
erosion
ages (Ma) |
TT-22 well |
|||||||
|---|---|---|---|---|---|---|---|---|---|
| formation | lithology | from | to | from | to | erosion thickness (m) | top (m) | bottom (m) | thickness (m) |
| Injana (Upper Fars) | sandstone, claystone | 12 | 3 | 3 | 0 | 2900 | 10 | 269 | 259 |
| Fatha (Lower Fars) | limestone, sandstone, evaporite | 19 | 12 | 269 | 553 | 284 | |||
| Pila Spi | limestone | 43 | 34 | 34 | 19 | 50 | 553 | 675 | 122 |
| Gercus | sandstone, claystone | 47 | 43 | 675 | 731 | 56 | |||
| Khurmala | limestone, dolomite | 52 | 51 | 51 | 47 | 30 | 731 | 781 | 50 |
| Sinjar | limestone, dolomite | 54 | 52 | 781 | 890 | 109 | |||
| Kolosh | sandstone, shale | 65 | 54 | 890 | 1624 | 734 | |||
| Tanjero | sandstone, marl, argillaceous limestone | 67 | 66 | 1624 | 1675 | 51 | |||
| Shiranish | limestone, marl | 78 | 67 | 1675 | 2062 | 387 | |||
| Kometan | limestone | 92 | 78 | 2062 | 2189 | 127 | |||
| Gulneri | limestone, claystone | 93 | 92 | 2189 | 2190 | 1 | |||
| Dokan | limestone | 97 | 93 | 2190 | 2204 | 14 | |||
| Mauddud (UQamchuqa) | limestone, dolomite | 109 | 100 | 100 | 97 | 20 | 2204 | 2418 | 214 |
| Batiwah (NUmr Eq.) | limestone, dolomite | 113 | 109 | 2418 | 2478 | 60 | |||
| M Qamchuqa Lst Eq | limestone, dolomite | 129 | 120 | 120 | 113 | 130 | 2478 | 2581.5 | 103.5 |
| Garagu | limestone | 134 | 129 | 2581.5 | 2662 | 80.5 | |||
| Sarmord | limestone, marl | 143 | 134 | 2662 | 3078 | 416 | |||
| Chia Gara | limestone, shale | 152 | 143 | 3078 | 3172 | 94 | |||
| Barsarin | limestone, dolomite, evaporite | 155 | 152 | 3172 | 3236 | 64 | |||
| Naokelekan | limestone, shale | 164 | 155 | 3236 | 3256 | 20 | |||
| Sargelu | limestone, shale | 170 | 164 | 3256 | 3362 | 106 | |||
| Alan | limestone, evaporite | 180 | 177 | 3362 | 3457 | 95 | |||
| Mus | limestone | 184 | 180 | 3457 | 3493 | 36 | |||
| Adaiyah | limestone, evaporite | 194 | 184 | 3493 | 3552 | 59 | |||
| Upper Sarki Mb | limestone, evaporite | 201 | 194 | 3552 | 3758 | 206 | |||
| Middle Sarki Mb | limestone | 222 | 203 | 3758 | 3920 | 162 | |||
| Lower Sarki Mb | limestone | 228 | 226.5 | 3920 | 4008 | 88 | |||
| Baluti | shale, dolomite, anhydrite, limestone | 229 | 228 | 4008 | 4096 | 88 | |||
| Kurra Chine A | anhydrite, dolomite | 232 | 229 | 4096 | 4214 | 118 | |||
| Kurra Chine B | shale, anhydrite, dolomite | 236 | 232 | 4214 | 4466 | 252 | |||
| Kurra Chine C Anhy (approx) | anhydrite, dolomite, limestone | 237 | 236 | 4466 | 4613.5 | 147.5+ | |||
| total depth | 4613.5 | ||||||||
Geological information, including sedimentary rock types and deposition and erosion periods, was obtained from the TT-22 well’s private well log record (Table 2), and the age of deposition and erosion periods was derived from the stratigraphic data available in the published literature.34,35 A significant thickness of sediments, around 1500 m to more than 4000 m, was eroded throughout Late Cretaceous-Pliocene time.8,35,36 These nearby estimations of eroded sediments were integrated into the basin modeling study (Table 2). For the purpose of estimating the thermal history of sedimentary basins over time, which impacts the maturity of the source rock, heat flow (HF) and temperature gradient are crucial input parameters.37−41 Theoretically, heat produced by local hydrodynamic fluxes and crustal tectonic processes caused the HF to form in the mantle.42−44 The HF is a more severe indicator of the thermal evolution in any basin since the ancient HF was inferred from key tectonic events, especially the extensional tectonics of the rifting epoch.41,44
The maturity data from measured % VRo and maximum temperature (Tmax) can all be used to estimate the paleo-HF.37,43,44 This maturity calibration data was used to establish the paleo-HF and entire thermal maturity history for the sedimentary sequence within the sedimentary basins.45−51
In this study, the % VRo values, as demonstrated in Table 2, were used to calibrate the evolution of geothermal maturation for the studied well utilizing the Easy % Ro method, devised by Sweeney and Burnham.52 This model has good agreement with the measured VRo data and the Easy % Ro model using the Petro Mod basin modeling program.
4. Results
4.1. Vitrinite Reflectance Results
The maturation of the Baluti shale samples and the evolution of the thermal history across the examined well section were both revealed by measuring the VRo.
The shale samples of the Baluti Formation are generally proven to be poor of vitrinite and are usually found as small size particles. However, most of the vitrinite materials are associated with bitumen staining, while other materials are unstained vitrinite. In this case, the unstained vitrinite is not indigenous OM and has been reworked from land plants. Accordingly, the VRo measurements of the selected samples were performed on bitumen-stained vitrinite OM as an indigenous OM. Thus, the VRo measurements are reliable as a thermal maturity indicator. The analyzed Baluti shale samples from well TT-22 have mean VRo values ranging from 0.92 to 1.15% (Table 1). These numbers generally show that the carbonate rocks from Baluti and Sarki, which are rich in solid bitumen, are indicative of a thermally mature sequence. The temperature burial of more than 4000 m is responsible for the high-maturity level in the succession of the Late Triassic Baluti Formation.
4.2. Bulk Geochemical Results
All shale samples from the Baluti Formation in the studied well were analyzed, and their RE pyrolysis results and TOC content were also measured (Table 1). The measured TOC is reported as a function of weight % and shows that the analyzed Baluti shale samples exhibit a TOC range of 0.54–4.92 wt %. Most of the measurements indicate TOC > 1 (1.27–4.92 wt %), while the other six samples have the lowest TOC, ranging between 0.54 and 0.98 wt % (Table 1).
As indicated in Table 1, the results of the RE pyrolysis comprise S1, S2, S3, Tmax, OI, PI, and HI. The range of petroleum output from cracking kerogen (S2) is 1.55 to 37.06 mg HC/g rock (Table 1). Recalled three samples have the largest S2 yields, ranging from 13.83 to 37.06 mg HC/g rock, whereas the majority of the analyzed samples (n = 10 samples) have S2 values of <5 mg HC/g rock (1.55–4.90 mg HC/g rock) (Table 1). The results of free hydrocarbon yields (S1) are substantial, ranging between 0.68 and 6.77 mg of HC/g of rock (Table 1). The S1 values for most of the analyzed samples (n = 11) are more than 1 (1.47–6.77 mg HC/g rock). The other 2 samples show the lowest S1 yields, between 0.68 and 0.92 mg HC/g rock (Table 1).
The agreement between the S2 and S3 values and the TOC content results in the generation of HI and OI (Table 1). The samples under study exhibit HI values between 191 and 799 mg of HC/g of TOC (Table 1). The majority of the analyzed samples (n = 9 samples) have high HI values of greater than 300 mg HC/g TOC, while the other four samples had the lowest HI values, between 191 and 238 mg HC/g TOC (Table 1).
In terms of the OI value, the analyzed samples from the studied well have varied values from 50 to 180 CO2/g TOC (Table 1). The samples range in OI values ranging from 50 to 94 mg CO2/g TOC for the lowest values and from 103 to 180 mg CO2/g TOC for the highest values (Table 1).
The programmed pyrolysis study also included measuring the Tmax values based on the S2 peak. Tmax, which denotes the temperature at which S2 peak yield is obtained, is more accurate when S2 levels are higher than 1 mg/g rock.53,54 Accordingly, the most frequently examined shale samples’ credible Tmax values vary from 301 to 436 °C and contain S2 values greater than 1 mg/g rock (Table 1).
4.3. Molecular and Biomarkers of OM
The present study examined OM characteristics based on n-alkanes, isoprenoids (Figure 5), and sterane and terpane biomarker distributions utilizing mass fragmentograms of m/z 191 and 217 ions from the saturated fraction (Figure 6).
Figure 5.

m/z 85 mass fragmentograms show n-alkane and acyclic isoprenoid (e.g., pristane and phytane) distributions of the aliphatic hydrocarbon fraction in the representative organic-rich shale samples of the Baluti Formation.
Figure 6.

m/z 191 and 217 mass fragmentograms of the aliphatic hydrocarbon fraction in the representative organic-rich shale samples of the Baluti Formation.
The alkanes between C13 and C33 are distributed unimodally in the GC, with an excess of short (C13–C20) to middle-chain (C21–C26) n-alkanes (Figure 5). Such a typical alkane distribution in the analyzed samples gave low carbon preference index (CPI) values between 0.95 and 0.99 (Table 3). The extent of waxiness (WI) was estimated and found to be between 0.70 and 0.78 from the examined shale samples (Table 3).
Table 3. Biomarker Ratios of the Analyzed Three Representative Shale Samples from the Late Triassic Baluti Formation from the TT-22 Well in the Taq Taq Oilfield, Illustrating Source OM, Depositional Environment Conditions, and Thermal Maturity Indicatorsa.
| Source OM and Depositional Environment Conditions | ||||||||||||||||
|---|---|---|---|---|---|---|---|---|---|---|---|---|---|---|---|---|
| tricyclic
terpanes |
regular
steranes (%) |
|||||||||||||||
| sample ID | Pr/Ph | Pr/C17 | Ph/C18 | WI | CPI | C29/C30 | G/C30 | HCR31/HC30 | C26TT/C25TT | C22TT/C21TT | C24TT/C23TT | DBT/Phen | C27/C29 regular steranes | C27 | C28 | C29 |
| TT7 | 0.67 | 0.44 | 0.65 | 0.72 | 0.99 | 1.75 | 0.20 | 0.30 | 0.60 | 0.80 | 0.41 | 1.75 | 1.60 | 50.00 | 18.75 | 31.25 |
| TT10 | 0.77 | 0.52 | 0.65 | 0.80 | 0.96 | 1.54 | 0.10 | 0.25 | 0.50 | 0.90 | 0.41 | 1.05 | 1.47 | 47.83 | 19.57 | 32.61 |
| TT11 | 0.65 | 0.52 | 0.68 | 0.70 | 0.95 | 1.48 | 0.12 | 0.24 | 0.50 | 0.67 | 0.42 | 1.13 | 1.64 | 51.11 | 17.78 | 31.11 |
| Thermal Maturity Parameters | ||||||||
|---|---|---|---|---|---|---|---|---|
| sample ID | Ts/Tm | C32 22S/(22S + 22R) | C2920S/(20S + 20R) | C29ββ/(ββ + αα) | M30/C30 | MPI-1 | MPI-2 | VRC |
| TT7 | 2.67 | 0.57 | 0.48 | 0.51 | 0.10 | 0.89 | 1.09 | 0.93 |
| TT10 | 2.83 | 0.56 | 0.48 | 0.56 | 0.08 | 0.94 | 1.18 | 0.96 |
| TT11 | 3.00 | 0.56 | 0.50 | 0.55 | 0.14 | 0.82 | 1.03 | 0.89 |
Pr—pristane, Ts—(C27 18α (H)-22, 29, 30-trisnorneohopane), CPI—carbon preference index = {2(C23 + C25 + C27 + C29)/(C22 + 2[C24 + C26 + C28] + C30)}, waxiness degree (WI) = Σ (n-C21- n-C31)/Σ (n-C15- n-C20), Ph—phytane, Tm– (C27 17α (H)-22, 29, 30-trisnorhopane), HCR31/HC30: C31 regular homohopane/C30 hopane, C29/C30: C29 norhopane/C30 hopane, G/HC30 = gammacerane/C30 hopane, M30/C30 = C30 moretane/C30 hopane, DB = dibenzothiophene, Phen = phenanthrene, and MPI-1: methylphenanthrene index = 1.5 × (2 – MP + 3 – MP)/(Phenanthrene + 1 – MP + 9 – MP). MPI-2: methylphenanthrene index = 3 × (2 – MP)/(phenanthrene + 1 – MP + 9 – MP). VRc (%) = 0.60 * MPI-1 + 0.40.
A significant amount of acyclic isoprenoid hydrocarbons, such as pristane (Pr) and phytane (Ph), are present in the chromatograms of the three samples that were under investigation (Figure 5). In the chromatograms of the analyzed samples (Figure 5), Ph was more prevalent of the acyclic isoprenoids than Pr, resulting in a Pr/Ph isoprenoid ratio of lower than 1 and ranges between 0.65 and 0.77 (Table 3). Isoprenoid ratios relative to n-alkane concentrations (C17–C18) were compared and measured, providing their Pr/n-C17 and Ph/n-C18 ratios in the range of 0.44–0.52 and 0.65–0.68, respectively (Table 3).
From mass fragmentograms of m/z 191 and 217 ions, respectively, in the saturated hydrocarbon compounds of GC-MS (Figure 6), hopanoids and steroids were generated, and their ratios and characteristics were calculated (Table 3).
The mass fragmentograms of the m/z 191 ions contain significant levels of pentacyclic and tricyclic terpanes (Figure 6a). The hopanoids consist of homohopane (C31–C34) components, C30 hopane, and C29 norhopane. The C29 norhopanes, however, are dominant over the C30 hopanes (Figure 6a), with C29 norhopane/C30 hopane ratio values greater than 1.40 (Table 3). These high ratios of C29/C30 indicate carbonate-rich facies as likely source rocks.55
The homohopane distributions, in particular, are dominated by C31, and when the carbon concentration in all samples rises, the proportion slowly declines (Figure 6a). In comparison, the homohopane C3122R series is lower in abundance than the C30 hopane (Figure 6a), resulting in C3122R homohopane/C30 hopane (C31R/C30H) ratios between 0.24 and 0.30 (Table 3). Substantial quantities of 17 α(H)-trisnorhopane (Tm) and 18 α(H)-trisnorneohopane (Ts) are present, yielding Ts/Tm values of 2.67–3.00 (Table 3). The biomarker maturity ratios of C32 22S/(22R + 22S) and C30M/C30H were also calculated using the hopanoid distribution (Table 3).
Mass fragmentograms of m/z 191 are also revealing significant tricyclic terpane concentrations, ranging from C19 to C26 (Figure 6a). The tricyclic terpane biomarkers have been used to calculate several ratios, such as C22 tricyclic/C21 tricyclic (C22T/C21T), C23 tricyclic/C24 tricyclic (C24T/C23T), and C26 tricyclic/C25 tricyclic (C26T/C25T), as shown in Table 3. In addition, the gammacerane biomarker for the most analyzed samples is reported in low quantities in m/z 191 mass fragmentograms (Figure 6a), and its gammacerane/C30 hopane (G/C30) index ranges from 0.10 to 0.20 (Table 3).
The m/z 217 mass fragmentograms also contained and identified the sterane and diasterane biomarkers (Figure 6b). In the saturated hydrocarbon, mass fragmentograms of m/z 217 often show a high abundance of steranes (Figure 6b). The C27–C29 regular steranes are distinguished from the C29 and C28 regular steranes by the existence of a significant amount of regular sterane C27 (Figure 6b). The relative abundance of C27, C29, and C28 is estimated in the range of 47.83–51.11, 31.11–32.61, and 17.78–19.57%, respectively (Table 3). Several ratios, such as standard C27/C29 regular sterane, C29 20S/(20S + 20R), and ββ/(ββ + αα), as well as C27/C29 regular sterane, were further determined (Table 3).
In the current study, polycyclic aromatic compounds such as dibenzothiophene (DBT), phenanthrene (P), alkyl naphthalene, and methylphenanthrene were identified in the aromatic fraction of the investigated three shale samples. These aromatic characteristics and ratios serve as helpful thermometric markers,56,57 depositional environment and lithologies,58,59 and source rock facies.60−62
The relative distribution of DBF, P, and the homologues of alkyl naphthalene and methylphenanthrene are shown in partial chromatograms of m/z 184, m/z 178, m/z 170, m/z 192, and m/z 198, respectively (Figure 7). The relative distribution of these aromatic compounds is used to calculate several aromatic parameters and ratios, such as MDR, MPI-1, MPI-2, and DBT/P, and are presented in Table 3.
Figure 7.

m/z 170, 178, 184, 192, and 198 mass fragmentograms of the aromatic hydrocarbon fraction in the representative organic-rich shale samples of the Baluti Formation.
4.4. Petrographic and Mineralogical Results
The mineral compositions of the analyzed Baluti shale samples were determined from XRD charts. The results of XRD revealed that the studied Baluti samples comprise an extremely complex mineral composition, including quartz, clay (mainly illite), and pyrite minerals (Figure 8a,b). The distributions of the mineral composition demonstrate that the quartz mineral dominates over the other minerals (Figure 8a,b). The presence of quartz and pyrite minerals, with a high abundance of quartz, was also observed in a thin section under a microscope (Figure 8c–e). The pyrite mineral is represented by an irregular surface, varying shapes, and gray color (Figure 8c,d). However, the enrichment with quartz minerals is considered to be more brittle rocks.63−65 In this case, the analyzed Baluti shale samples consist of a higher quartz brittle mineral compared to clay mineral (Figure 8a,b). Based on this mineral constituent, the selected Baluti samples are likely to be high-brittle rocks for fracability and the development of natural and artificial fractures.64,65 Fractures seen in the examined shale samples provided support for this interpretation (Figure 8d,e).
Figure 8.

(a,b) X-ray diffractograms of the representative organic-rich shale samples of the Baluti Formation, showing the presence of quartz, illite, and pyrite minerals, and (c–e) photomicrographs of a thin section of the representative organic-rich shale samples of the Baluti Formation, showing the mineral composition and porosity types, including secondary pores such as fracture.
4.5. Basinal Thermal Evolution and Maturation of Source Rock
The period of source rock maturation is influenced by thermal geo-history development in sedimentary basins, which affects petroleum generation over the course of geological time.42,66 The key elements that influence a basin’s thermal history include sedimentation, erosion history, burial temperature slopes, temperature gradients, and paleo-HFs.67
Using a 1-D-basin simulation method, the measured % VRo (available from the exploratory well; Table 1) was used to determine the paleo-HF values. Here, several HF model scenarios are used in conjunction with erosion episodes that occurred in the late Pliocene (3 Ma; Table 2). By including the erosional history, a passable fit of Sweeney and Burnham’s52 maturation (Easy % Ro) and measured VRo profiles is obtained (Figure 9a). In order to achieve the best fit between measured % VRo and modeled EASY % Ro, elevated HF values between 40 and 68 mW/m2 were assigned (Figure 9b). However, Allen and Allen42 indicated that the paleo-HF values between 40 and 80 mW/m2 are considered for foreland basins. The HF model employed in this study reveals that paleo-HF values during the Late Cretaceous and Miocene periods were relatively high, ranging between 60 and 68 mW/m2 (Figure 9b). This is related to the Zagros Mountains’ development as a result of the Arabian and Iranian plates’ reactive convergence and collision during the Mid-Late Cretaceous (Zagros Orogeny) and the foreland basin of the ZFB in northern Iraq.68−73
Figure 9.

Basin models show (A) an optimized fit of calibrated data, i.e., measured % VRo and models of EASY % Ro maturity in the studied well (TT-22), and (B) the estimated HF range that achieved from calibration data (% VRo).
However, we employed modeled HF to reconstruct the thermal maturation history of the Late Triassic Baluti Formation and pinpoint the time of petroleum formation (Figure 9). According to the maturity models, the Baluti Formation is currently in the peak-to-late-mature of the oil generation window (Figure 10a). These models further show that the thermal gradient has a significant impact on the thermal maturation history of the studied Baluti shales and that the base of the Baluti Formation extends down to a depth of more than 4000 m, resulting in high burial temperatures of around 157 °C during the Late Miocene (Figure 10b). Following that, the Baluti Formation’s base enters the early mature oil window (0.55–0.70 Easy % Ro) during the Late Eocene to Late Miocene time (45–12 Ma; Figure 10a). Peak oil production occurred during the Late Miocene (12 Ma) and has continued until today. This corresponds to an Easy % Ro value between 0.70 and 1.08 (Figure 10a) and a temperature value of up to 150 °C (Figure 10b).
Figure 10.

(A) Burial overlap with thermal maturity (colored areas) cross all rock units (left) and the blue line are shown exclusively for computed VRo (right), and (B) burial overlap with thermal gradient history (colored areas) cross all rock units (left) and the red line are shown exclusively for computed temperatures (right) of the base Baluti Formation in the studied TT-22 well.
5. Discussion
5.1. Source of OM and Paleoenvironmental Conditions
The intake of OM, its origin, and the depositional environment of the Baluti shales were assessed based on accepted standard interpretations of molecular biomarker proxies in light of the saturated and aromatic biomarker data.74−77 The unimodal distribution of normal alkanes in GC may signify a significant contribution from marine OM made up of algae microbial mats, which is dominated by n-C13 to n-C26 molecules of short to medium molecular weight (Figure 5). The contribution of the different OM inputs may also be deduced using CPI and WI degree values.78,79 Lower CPI and WI values reveal a higher contribution of aquatic OM.74 In this case, the combination of CPI and further support the increased contributions from marine OM and some terrestrial source input into these shale strata (Figure 11a).
Figure 11.

Geochemical biomarker results of the representative three shale samples of the Baluti Formation from TT-22 well, including (A) CPI and WI degree, (B) Pr/n-C17 versus Ph/n-C18, (C) Pr/Ph versus Pr/n-C17, and (D) Pr/Ph versus DPT/P ratio, indicate that the Baluti shale sediments contain mainly marine OM and were deposited under anoxic conditions.
The OM present in the redox depositional environment was also assessed from the isoprenoids.80,81 In this case, the relatively high concentrations of Ph (Figure 5), with low Pr/Ph, Pr/n-C17, and Ph/n-C18 ratios, further point to algal marine-derived OM and highly reductive conditions during deposition (Figure 11b,c). The depositional conditions may also be deduced using the Pr/Ph isoprenoid ratio.80 Pr/Ph < 1 denotes an anoxic environment with a stratified water column, while Pr/Ph > 2 denotes contributions from terrestrial OM under oxic environmental conditions, according to Didyk et al.,80 and Chandra et al.81 Most of the shale samples show low Pr/Ph values ranging from 0.65 to 0.77 (Table 3), indicating that these shales were accumulated during anoxic depositional settings.
In addition, the combination of the Pr/Ph ratio together with the high DBT/Phen ratios of >1 supports the interpretation of a marine source rock (Figure 11d). The distribution of the C31 homohopanes in the m/z 191 mass fragmentograms lends credence to this interpretation.71 The C30 hopane dominates in comparison to the C31R homohopane (Figure 6b), and the ratio of C31R/C30 is relatively high, ranging from 0.24 to 0.30 (Table 3), suggesting that the Baluti rocks were formed in a marine environment.
The occurrence of a significant concentration of tricyclic terpanes in the m/z 191 mass fragmentograms (Figure 6a), with the ratios of C26/C25, C22/C21, and C24/C23 tricyclic terpanes (Table 3) also suggests this understanding for a high contribution of marine OM into the Baluti source rocks (Figure 12).
Figure 12.

Geochemical biomarker results of the analyzed organic-rich shale samples show (A) C26 tricyclic/C25 tricyclic (C26T/C25T) versus C31 regular homohopane/C30hopane (HCR31/HC30) and (B) C24 tricyclic/C23 tricyclic (C24T/23T) versus C22 tricyclic/C21 tricyclic (C22Ti/C21Ti), indicating that these sediments contain mainly marine OM.
Using the modified ternary diagram from Huang and Meinschein82 (Figure 13), the high concentrations of C27 regular sterane in all of the examined shale samples (Table 3) support the interpretation of primarily planktonic and bacterial origin, with little input of OM derived from plants. Additionally, the existence of high C27/C28 regular sterane ratios supports this (Table 3).
Figure 13.

Ternary diagram of regular steranes (C27–C29) in the saturated HC fraction of the representative three shale samples of the Baluti Formation from TT-22 well, indicating the relationship between sterane compositions concerning OM input.
Organic material from aquatic sources contributed significantly to the Baluti shales in a relatively oxygen-poor environmental setting, as confirmed by the relatively low proportions of 1,2,5- and 1,2,7-trimethylnaphthalene compared to 1,3,7- and 1,2,6-trimethylnaphthalene in the aromatic fraction (Figure 7). According to Strachan et al.,83 the relative abundance of 1,2,5- and 1,2,7-trimethylnaphthalene is likely to indicate a larger supply of plant OM and a deltaic environment with relatively high oxygen levels.84
5.2. Characterization and Efficiency of the Source Rock for the Potential of Hydrocarbon Generation
Most of the Baluti shales are organic-rich, with a high TOC content of more than 1 wt % and reaching maximum TOC % of 4.92 wt % (Table 1). Considering that most organic geochemists reported that sediments with a TOC level of more than 1% suggest a sufficient amount of OM for a good source rock.85,86 Therefore, the high TOC content of more than 1 wt % in most of the Baluti shales indicates good source rock characteristics for noteworthy amounts of petroleum-generating potential at thermal maturation. This finding is confirmed by the relationship between TOC and the petroleum yield obtained by thermal cracking of kerogen (S2). The TOC results correlate well with the petroleum potential yield (S2) and further reveal a good to very good generative potential for most of the examined Baluti samples (Figure 14a).
Figure 14.

Geochemical correlations between TOC content and RE pyrolysis parameters [i.e., S2 and S1 in (A,B), respectively] imply that the analyzed organic-rich shales from the studied well are considered to be good source rocks and have a high probability of oil production.
The high TOC content in the studied Baluti samples was further combined with the pyrolysis S1 petroleum yield and used to calculate the oil saturation index (OSI mg/gram) using the following formula: OSI = S1 × 100/TOC.61,87,88 The capacity of the oil-bearing source rock and the potential economically producible oil were also estimated using this ratio.64,87,88 A mature source rock is represented by OSI values more than 30, whereas an oil-saturated source rock is indicated by values between 50 and 70.87 Likewise, oil crossover is defined as the OSI ratio above 100%, which demonstrates the source rock’s capacity to hold oil.87,88
In this study, the 13 shale samples from the Baluti Formation have OSI values ranging from 125.93 to 448.98 mg/g and are shown in Table 1. The majority of the analyzed samples from the studied well with OSI values of >100 mg/g represent the oil crossover effect and may serve as a significant benchmark for significant quantities of oil-bearing material and increase the likelihood of oil production (Figure 14b).
The present study also integrates bulk RE data and microscopic examination results to understand kerogen’s characteristics and classification within the investigated Baluti shale samples.
The RE parameters HI and OI were employed to evaluate the qualitative kerogen classification using the OI vs HI diagram. In this diagram, the majority of the shale samples under examination fell along the hydrogen-rich type I and II kerogen paths, with just a modest contribution from types II/III and III kerogen (Figure 15a). The domination of hydrogen-rich type I and II kerogens was also reinforced by the relationship between the HI and Tmax (Figure 15b). Therefore, based on the kerogen, it is expected that the Baluti shales can generate high amounts of oil as implied by the relationship between the TOC content and the pyrolysis HI parameter (Figure 16).
Figure 15.

Characteristics of kerogen of the organic-rich shale samples of the Baluti Formation from the studied TT-22 well based on (A) HI versus OI and (B) HI versus Tmax, showing hydrogen-rich types I and II and small amounts of types II/III and III kerogens.
Figure 16.

Geochemical correlation between TOC content and RE data (i.e., HI), implying that the analyzed organic-rich shales samples of the Baluti Formation from the studied TT-22 well are mainly oil-prone source rocks.
The thermal alteration of OM in the studied shale unit of the Baluti Formation from the selected well was assessed using multiple optical and geochemical indicators (Tables 1 and 3). The results of this integration enable us to assess the thermal maturity level of OM input and its potential for petroleum generation.
VRo % data are among the most reliable parameters to highlight maturity and focus on critical information, such as the degree of maturation of organic material and the ability to generate petroleum.45
Seven shale samples from the Baluti Formation taken from the TT-22 well were used in the current investigation to evaluate the thermal changes of OM. In Table 1, the measured VR values for the Baluti shale samples are shown. This range, which represents the peak-mature to late-mature of the oil-generating window, is between 0.92 and 1.15%.
The Tmax values were also used to assume organic maturity. The Tmax data of the analyzed samples varies between 301 and 435 °C (Table 1), indicating immature to early mature oil window. These stages of thermal maturity from Tmax are inconsistent with the VRo %-based observation. We envisage that the presence of generated hydrocarbons within the studied shales might have lowered Tmax values (<430 °C) at deeper burial depths.89 The presence of generated hydrocarbons in the samples is confirmed by the relatively higher S1 as compared to TOC content (Table 1), and hence, high PI values of more than 0.40 (Figure 17). Therefore, the RE Tmax values of <430 °C were not trustworthy thermal maturation indicators in the deeper Baluti shale samples.
Figure 17.

Thermal maturity indicators (i.e., Tmax and PI) of the organic-rich shale samples of the Baluti Formation, including analyzed samples in the studied TT-22 well mainly containing staining or migrated HCs.
Herein, the source rock maturity of the Baluti formation was also concluded from specific maturity-derived biomarkers based on established standard classifications. These maturity-derived biomarkers most commonly used to establish maturity include those derived from terpane, sterane, and methylphenanthrene content of the hydrocarbon fractions, i.e., aliphatic and aromatics,51,52,90−93 including Ts/Tm, C32 hopane, 20S/(20S + 20R), and ββ/(ββ + αα) of C29 sterane and methylphenanthrene indices (i.e., MPI-1 and MPI-2) (Table 3).
The hopane ratio of C32 20S/(20S + 20R) can range up to values of 0.7, reflecting high maturity, although it is most reliable at lower maturities.92 When paired with high C29 sterane ββ/(ββ + αα) ratios, almost all of the studied samples exhibit reasonably high C32 hopane ratios of 0.56 to 0.57, indicating that the Baluti source rock has matured to its peak oil window (Figure 18a). Further, the C29 sterane ratios of the ββ/(ββ + αα) and 20S/(20S + 20R) may also suggest the analyzed Baluti shale samples are mature source rocks (Figure 18b).
Figure 18.

Geochemical cross-plot of the biomarker maturity indicators of the analyzed shale samples (A) C32-hopane 22 S/(22S + 22R) versus C29 sterane ββ/(ββ + αα), (B) C29-sterane 20 S/(20S + 20 R) versus ββ/(ββ + αα), (C) M30/C30 versus Ts/Tm ratio, and (D) MPI-1 versus MPI-2 ratio, showing the high thermal maturation of the Baluti shale samples, corresponding to main stage of petroleum generation (i.e., peak oil generation window).
The high maturity source rock of the examined samples is also suggested by the high trisnorneohopane (Ts) in m/z 191 MC (Figure 6a), with high Ts/Tm ratios greater than 2 (Table 3). The high Ts/Tm index is consistent with the low ratio of C30 moretane/C30 hopane (CM30/C30) and further suggests mature source rock of the peak oil window (Figure 18c). However, these hopane and sterane maturity biomarkers alone are therefore not sufficient to evaluate thermal maturity and must be matched with other maturity-sensitive aromatic biomarkers.
With increasing age, the relative abundance of more stable isomers rises in comparison to less stable isomers because the aromatic maturity characteristics are often based on the variable thermal stability of distinct isomers.56 The MPI-1 and MPI-2 indices of phenanthrene are among the computed aromatic parameters for the samples that were analyzed (Table 3). The high MPI-1 and MPI-2 values in the studied shale samples (ranges of 0.82–0.94 and 1.03–1.18, respectively) point to a mature source rock (Table 3 and Figure 18d). The VRo values from MPI-1 were also calculated, ranging from 0.89 to 0.96% (Table 3), consistent with a peak-mature oil window.
5.3. Implications for Oil Exploration Opportunities
In the studied TT-22 well from Taq Taq oilfield, the Baluti organic-rich shales have a high abundance of main types I and II kerogen and are currently in the high maturity stage of the oil window (i.e., peak-mature to late-mature), implying that commercial quantities of oil have been generated. On the other hand, the high OSI values of more than 100 mg/g confirm that the Baluti source rock system has generated a considerable quantity of oil and is saturated now, leading to a high probability for oil production (Figure 14b). The higher amount of oil accumulation in the Baluti source rock system from the TT-22 well is also confirmed through basin model results.
Modeling of the primary kerogen cracking and oil production from the Baluti source rocks across geological time (Figure 19). These conversion ratio models were developed using the type I kinetic data of Behar et al.94 Based on the type I kinetic reaction parameters, thermal maturity, and burial history, the primary kerogen-oil cracking and retained oil cracking to the gaseous phase from type I source rock were timed.
Figure 19.

(A) Evolution of the TR and computed VRo (EASY % Ro) with age and (B) model of cumulative hydrocarbon generation for the base Baluti Formation in the studied TT-22 well.
The TT-22 well-based model suggests that the Baluti source rock reached a TR of 10–50% (Figure 19a) and had generated substantial volumes of oil during the late Miocene age around 12 to 7 Ma (Figure 19b), corresponding to computed VR values in the ranges of 0.77–1.02% (Figure 10a). From the end of the late Miocene (7 Ma) to the present, tiny amounts of oil produced in the Baluti source rock system have been released, with TR values exceeding 50% (Figure 19a). However, the Baluti source rock has generated its maximum amount of oil and is saturated, suggesting that the greatest values are more than 50% for its kerogen conversion, which led to high pressures and pushed the brittle minerals to be shattered, resulting in a natural fracture system (Figure 8c,d). This natural fracture system can develop the porosity of the tight shale rocks of the Baluti Formation, resulting in better potential oil storage capability. As a result, the fracability of the Baluti shale rocks is identical for hydraulic stimulation, making them ideal for oil production.64,88 Meanwhile, the oil bearing of the shale for oil production is associated with oil generation and expulsion.88 Shales with higher oil generation and lower oil expulsion features are ideal for shale oil resource discoveries.88 The Baluti organic-rich shales attained TR values between 10 and 65%, as indicated in the basin modeling results (Figure 19a). Therefore, the Baluti source rock system should have a lower oil expulsion efficiency (TR up to 65%) and thus higher residual oil as well as oil-bearing capacity, making it a suitable prospect for shale oil discoveries. This significant find will help shale oil prospects and exploration targets in the northern Iraqi basin of the ZFB, where the Late Triassic Baluti Formation candidates as unconventional petroleum resources, and it will lead to the production of more oil that could be released using hydraulic fracturing techniques.
6. Conclusions
This study investigated the Late Triassic Baluti Formation’s organic-rich shale and potential oil production in northern Iraq’s ZFB. The present investigation provides the following findings:
The Late Triassic Baluti Formation, which has a TOC of approximately 4.92 wt % and primarily types I and II kerogens with a trace amount of types II/III and III, is a notable oil-source rock.
The OM origin and depositional environment-related biomarkers suggest that the OM input to the Baluti shale source rock is a mixture of mainly phytoplankton and bacteria with a small amount of terrigenous plants and deposited under marine reducing conditions.
A number of maturity-related indicators show that the investigated samples of the Baluti Formation have attained a variety of thermal maturation stages, from peak-mature to late-mature oil windows.
The majority of the Baluti Formation’s organic-rich shales crossed the oil-crossover, indicating good oil-bearing capacity and enrichment conditions for high-probability oil production matched with OSI values above 100 mg/g.
The basin model study, enriched with geological data, has revealed a primary kerogen-oil conversion of the Baluti source rock occurred between the late Miocene and the present (12–0 Ma), with the main oil window maturity (0.77–1.08 Easy % Ro) and 10–59 % TR.
When the maximum TR (59% TR) was attained at the end of the late Miocene, a small amount of oil was released from the Baluti source rock system.
The natural fracture system in the Baluti shale source rock was recognized and observed in thin sections. This natural fracture system is probably attributed to the combination between the high quartz brittle mineral content and the presence of significant amounts of oil generation with lower oil expulsion efficiency.
The above characteristics of the Baluti shale source rock system can be used as a foundation for further shale oil exploration in the Taq Taq oilfield, where the Baluti Formation serves as a candidate for source-self-reservoir potential and could result in high-probability oil production that could be released using hydraulic fracturing techniques.
Acknowledgments
The authors gladly thank the financial support for the project from the Ministry of Higher Education and Scientific Research of the Kurdistan Regional Government (grant no. 10238/1 of 8/8/2018). It is also greatly appreciated that the Kurdistan Regional Government’s Ministry of Natural Resources assisted in facilitating access to samples used in this study. We would like to thank Mr. Grenville Lunn for helping in drawing Figure 4. Two anonymous reviewers are thanked for the constructive comments that improved the original manuscript.
The authors declare no competing financial interest.
References
- Sohail G. M.; Radwan A. E.; Mahmoud M. A review of Pakistani shales for shale gas exploration and comparison to North American shale plays. Energy Rep. 2022, 8, 6423–6442. 10.1016/j.egyr.2022.04.074. [DOI] [Google Scholar]
- Hill R. J.; Zhang E.; Katz B. J.; Tang Y. Modeling of gas generation from the Barnett shale, Fort Worth Basin, Texas. Am. Assoc. Petrol. Geol. Bull. 2007, 91 (4), 501–521. 10.1306/12060606063. [DOI] [Google Scholar]
- Nie H.; Jin Z.; Li P.; Jay Katz B.; Dang W.; Liu Q.; Ding J.; Jiang S.; Li D. Deep shale gas in the Ordovician-Silurian Wufeng–Longmaxi formations of the Sichuan Basin, SW China: Insights from reservoir characteristics, preservation conditions and development strategies. J. Asian Earth Sci. 2023, 244, 105521. 10.1016/j.jseaes.2022.105521. [DOI] [Google Scholar]
- Qadri S. M. T.; Islam M. A.; Shalaby M. R.; Ali S. H. Integration of 1D and 3D modeling schemes to establish the Farewell Formation as a self-sourced reservoir in Kupe Field, Taranaki Basin, New Zealand. Front. Earth Sci. 2021, 15, 631–648. 10.1007/s11707-020-0839-8. [DOI] [Google Scholar]
- Radwan A. E.; Wood D. A.; Mahmoud M.; Tariq Z.. Gas adsorption and reserve estimation for conventional and unconventional gas resources. Sustainable Geoscience for Natural Gas Subsurface Systems; Gulf Professional Publishing, 2022; pp 345–382. [Google Scholar]
- Al-Ahmed A. A.Organic Geochemistry, Palynofacies and Hydrocarbon Potential of Sargelu Formation (Middle Jurassic) Northern Iraq. Ph.D. Thesis, University of Baghdad; (Unpublished), 2006. [Google Scholar]
- Al-Ameri T. K.; Zumberge J. Middle and upper Jurassic hydrocarbon potential of the Zagross Fold Belt, North Iraq. Mar. Petrol. Geol. 2012, 36, 13–34. 10.1016/j.marpetgeo.2012.04.004. [DOI] [Google Scholar]
- Hakimi M. H.; Najaf A. A. Origin of crude oils from oilfields in the Zagros Fold Belt, southern Iraq: Relation to organic matter input and paleoenvironmental conditions. Mar. Petrol. Geol. 2016, 78, 547–561. 10.1016/j.marpetgeo.2016.10.012. [DOI] [Google Scholar]
- Mohialdeen I. M. J.; Hakimi M. H. Geochemical characterisation of Tithonian-Berriasian Chia Gara organic-rich rocks in northern Iraq with an emphasis on organic matter enrichment and the relationship to the bioproductivity and anoxia conditions. J. Asian Earth Sci. 2016, 116, 181–197. 10.1016/j.jseaes.2015.11.004. [DOI] [Google Scholar]
- Mohialdeen I. M. J.; Hakimi M. H.; Al-Beyati F. M. Geochemical and petrographic characterization of late Jurassic-early Cretaceous Chia Gara Formation in Northern Iraq: palaeoenvironment and oil-generation potential. Mar. Petrol. Geol. 2013, 43, 166–177. 10.1016/j.marpetgeo.2013.02.010. [DOI] [Google Scholar]
- Mohialdeen I. M. J.; Hakimi M. H.; Al-Beyati F. M. Biomarker characteristics of certain crude oils and the oil-source rock correlation for the Kurdistan oilfields, Northern Iraq. Arabian J. Geosci. 2015, 8, 507–523. 10.1007/s12517-013-1228-3. [DOI] [Google Scholar]
- Sachsenhofer R. F.; Bechtel A.; Gratzer R.; Rainer T. M. Source-rock maturity, hydrocarbon potential and oil-source rock correlation in well Shorish-1, Erbil province, Kurdistan Region, Iraq. J. Petrol. Geol. 2015, 38, 357–381. 10.1111/jpg.12617. [DOI] [Google Scholar]
- Hakimi M. H.; Najaf A. A.; Abdula R. A.; Mohialdeen I. M. J. Generation and expulsion history of oil-source rock (Middle Jurassic Sargelu Formation) in the Kurdistan of north Iraq, Zagros folded belt: Implications from 1D basin modeling study. J. Pet. Sci. Eng. 2018, 162, 852–872. 10.1016/j.petrol.2017.11.013. [DOI] [Google Scholar]
- Gharib A. F.; Özkan A. M.; Hakimi M. H.; Zainal Abidin N. S.; Lashin A. A. Integrated geochemical characterization and geological modeling of organic matter-rich limestones and oils from Ajeel Oilfield in Mesopotamian Basin, Northern Iraq. Mar. Pet. Geol. 2021, 126, 104930. 10.1016/j.marpetgeo.2021.104930. [DOI] [Google Scholar]
- Al-Ameri T. K.; Najaf A. A.; Al-Khafaji A. S.; Zumberge J.; Pitman J. Hydrocarbon potential of the Sargelu formation, North Iraq. Arabian J. Geosci. 2014, 7, 987–1000. 10.1007/s12517-013-0875-8. [DOI] [Google Scholar]
- Mohialdeen I. M. J.Source Rock Appraisal and Oil-source Correlation for the Chia Gara Formation, Kurdistan-north Iraq. Ph.D. Thesis, College of Science, University of Sulaimani, 2008, pp 15–35. [Google Scholar]
- Talbot C. J.; Alavi M.. The Past of a Future Syntaxis across the Zagros 100; Geological Society: London, Special Publications, 1996; pp 89–109. [Google Scholar]
- Koshnaw R. I.; Horton B. K.; Stockli D. F.; Barber D. E.; Tamar-Agha M. Y.; Kendall J. J. Neogene shortening and exhumation of the Zagros fold-thrust belt and foreland basin in the Kurdistan region of northern Iraq. Tectonophysics 2017, 694, 332–355. 10.1016/j.tecto.2016.11.016. [DOI] [Google Scholar]; Elsevier B.V.
- Tozer R. S. J.; Hertle M.; Petersen H. I.; Zinck-Jorgensen K.. Quantifying vertical movements in fold and thrust belts: subsidence, uplift and erosion in Kurdistan, northern Iraq. In Fold and Thrust Belts: Structural Style, Evolution and Exploration; Hammerstein J. A., Dcuia R., Cottam M. A., Zamora G., Butler R. W. H., Eds.; Geological Society, London, Special Publications, 2019; Vol. 490, pp 397–415. [Google Scholar]
- Rashid F.; Hussein D. H.; Lawrence J. A.; Khanaqa P. Characterization and impact on reservoir quality of fractures in the cretaceous Qamchuqa Formation, Zagros folded belt. Mar. Petrol. Geol. 2020, 113, 104117. 10.1016/j.marpetgeo.2019.104117. [DOI] [Google Scholar]
- a Al-Sharhan A. S.; Nairn A. E.. Sedimentary Basins and Petroleum Geology of the Middle East; Elsevier Science, 2003. [Google Scholar]; b Aqrawi A. A.; Goff J. C.; Horbury A. D.; Sadooni F. N.. The Petroleum Geology of Iraq; Scientific Press Ltd.: Beaconfield, 2010. [Google Scholar]
- Aqrawi A. A. M.; Goff J. C.; Horbury A. D.; Sadooni F. N.. The Petroleum Geology of Iraq; Scientific Press: Beaconsfield, 2010; pp 424. [Google Scholar]
- Sadooni F. N.; Alsharhan A. S. Stratigraphy, lithofacies distribution, and petroleum potential of the Triassic strata of the northern Arabian plate. AAPG Bull. 2004, 88 (4), 515–538. 10.1306/12030303067. [DOI] [Google Scholar]
- Ali S. A.; Nutman A. P.; Aswad K. J.; Jones B. G. Overview of the tectonic evolution of the Iraqi Zagros thrust zone: sixty million years of Neotethyan ocean subduction. J. Geodyn. 2019, 129, 162–177. 10.1016/j.jog.2019.03.007. [DOI] [Google Scholar]
- Asaad I. S.; Omer M. F. Facies characterization and depositional environment of Baluti Formation (Late Triassic) from selected sections in the Kurdistan region, Northern Iraq. Arabian J. Geosci. 2020, 13, 1253. 10.1007/s12517-020-06280-z. [DOI] [Google Scholar]
- Mackertich D. s.; Samarrai A. I. History of hydrocarbon exploration in the Kurdistan Region of Iraq. GeoArabia 2015, 20, 181–220. 10.2113/geoarabia2002181. [DOI] [Google Scholar]
- Buday T.The regional geology of Iraq. Stratigraphy and Palaergeography 1; Publications of GEOSURV: Baghdad, 1980; p 445. [Google Scholar]
- Peters K.; Cassa M.. Applied Source Rock Geochemistry. In The Petroleum System from Source to Trap; Magoon L. B., Dow W. G., Eds.; American Association of Petroleum Geologists Memory, 1994; Vol. 60, pp 93–117. [Google Scholar]
- Teichmüller M.The origin of organic matter in sedimentary rocks. In Organic petrology; Taylor G. H., Teicmüller M., Davis A., Diessel C. F. K., Littke R., Robert P., Eds.; Gebrüder Borntraeger: Berlin, 1998; p 704. [Google Scholar]
- ASTM . 2004 ASTM C856–04 (2004). Standard Practice for Petrographic Examination of Hardened Concrete. Annual Book of ASTM Standards; American Society for Testing and Materials West Conshohocken: PA, 2004. [Google Scholar]
- Philp R. P. Biological markers in fossil fuel production. Mass Spectrom. Rev. 1985, 4, 1–54. 10.1002/mas.1280040102. [DOI] [Google Scholar]
- Peters K. E.; Walters C. C.; Moldowan J. M.. The Biomarker Guide, 2nd ed.; Cambridge University Press: Cambridge, UK., 2005; p 1155. [Google Scholar]
- Hakimi M. H.; Abdullah W. H.; Shalaby M. R. Molecular composition and organic petrographic characterization of Madbi source rocks from the Kharir Oilfield of the Masila Basin (Yemen): palaeoenvironmental and maturity interpretation. Arab. J. Geosci. 2012, 5, 817–831. 10.1007/s12517-011-0289-4. [DOI] [Google Scholar]
- Van Bellen R. C.; Dunnington H. V.; Wetzel R.; Morton D. M.. Lexique Stratigraphic International, Paris, v. III, Asie, Fascicule 10a Iraq; Centre National de la Recherche Scientifique, 1959; p 333. [Google Scholar]
- Lunn G. A.; Miller S.; Samarrai A. Dating and correlation of the Baluti Formation, Kurdistan, Iraq: Implications for the regional recognition of a Carnian “marker dolomite” and a review of the Triassic to Early Jurassic sequence stratigraphy of the Arabian Plate. J. Petrol. Geol. 2019, 42 (1), 5–36. 10.1111/jpg.12722. [DOI] [Google Scholar]
- Mohialdeen I. M. J.; Fatah S. S.; Abdula R. A.; Hakimi M. H.; Abdullah W. H.; Khanaqa P. A.; Lunn G. A. Stratigraphic correlation and source rock characteristics of the Baluti Formation from selected wells in the Zagros Fold Belt of Kurdistan region, northern Iraq. J. Petrol. Geol. 2022, 45 (1), 29–56. 10.1111/jpg.12806. [DOI] [Google Scholar]
- Hakimi M. H.; Abdullah W. H. Thermal maturity history and petroleum generation modelling for the Upper Jurassic Madbi source rocks in the Marib-Shabowah Basin, western Yemen. Mar. Petrol. Geol. 2015, 59, 202–216. 10.1016/j.marpetgeo.2014.08.002. [DOI] [Google Scholar]
- Hadad Y. T.; Hakimi M. H.; Abdullah W. H.; Makeen Y. M. Basin modeling of the late Miocene Zeit source rock in the Sudanese portion of red sea basin: implication for hydrocarbon generation and expulsion history. Mar. Petrol. Geol. 2017, 84, 311–322. 10.1016/j.marpetgeo.2017.04.002. [DOI] [Google Scholar]
- Qadri S. M. T.; Shalaby M. R.; Islam M. A.; Hoon L. L. Source rock characterization and hydrocarbon generation modeling of the Middle to Late Eocene Mangahewa Formation in Taranaki Basin, New Zealand. Arabian J. Geosci. 2016, 9, 559. 10.1007/s12517-016-2586-4. [DOI] [Google Scholar]
- Makeen Y. M.; Abdullah W. H.; Pearson M. J.; Hakimi M. H.; Elhassan O. M. A.; Hadad Y. T. Thermal maturity history and petroleum generation modelling for the lower cretaceous Abu Gabra formation in the Fula sub-basin, Muglad Basin, Sudan. Mar. Pet. Geol. 2016, 75, 310–324. 10.1016/j.marpetgeo.2016.04.023. [DOI] [Google Scholar]
- Abdula R. A.Oil and gas generation history based on burial history reconstruction and thermal maturity modeling of petroleum systems in Kurdistan Region, Iraq. J. Zankoi Sulaimani 2016. (in press). [Google Scholar]
- Lachenbruch A. Crustal temperature and heat production: Implications of the linear heat-flow relation. J. Geophys. Res. 1970, 75, 3291–3300. 10.1029/JB075i017p03291. [DOI] [Google Scholar]
- He S.; Middleton M. Heat flow and thermal maturity modelling in the northern carnarvon basin, north west shelf, Australia. Mar. Petrol. Geol. 2002, 19, 1073–1088. 10.1016/S0264-8172(03)00003-5. [DOI] [Google Scholar]
- Li M. J.; Wang T. G.; Chen J. F.; He F. Q.; Yun L.; Akbar S.; Zhang W. B. Paleo heat flow evolution of the Tabei Uplift in Tarim basin, northwest China. J. Asian Earth Sci. 2010, 37, 52–66. 10.1016/j.jseaes.2009.07.007. [DOI] [Google Scholar]
- Welte D. H.; Horsfield B.; Baker D. R.. Petroleum and Basin Evolution: Insights from Petroleum Geochemistry, Geology and Basin Modeling; Springer: Berlin Heidelberg, 2012. [Google Scholar]
- Shalaby M. R.; Hakimi M. H.; Abdullah W. H. Geochemical characteristics and hydrocarbon generation modeling of the Jurassic source rocks in the Shoushan Basin, north Western Desert, Egypt. Mar. Petrol. Geol. 2011, 28, 1611–1624. 10.1016/j.marpetgeo.2011.07.003. [DOI] [Google Scholar]
- Shalaby M. R.; Hakimi M. H.; Abdullah W. H. Modeling of gas generation from the Alam El-Bueib Formation in the Shoushan basin, northern western desert of Egypt. Int. J. Earth Sci. 2013, 102, 319–332. 10.1007/s00531-012-0793-0. [DOI] [Google Scholar]
- Allen P. A.; Allen T. R.. Basin Analysis: Principles and Applications; Blackwell Scientific publications: Oxford, 1990. [Google Scholar]
- Allen P. A.; Allen J. R.. Basin Analysis: Principles and Applications; Blackwell, Oxford, 2005; p 549. [Google Scholar]
- Hantschel T.; Kauerauf A. I.. Fundamentals of Basin and Petroleum Systems Modeling: Integrated Exploration Systems GmbH; Schlumberger Company, Springer- Verlag Berlin Heidelberg, 2009. [Google Scholar]
- Waples D. W. Time and temperature in petroleum formation: application of Lopatin’s method to petroleum exploration. AAPG Bull. 1980, 64, 916–926. 10.1306/2f9193d2-16ce-11d7-8645000102c1865d. [DOI] [Google Scholar]
- Sweeney J. J.; Burnham A. K. Evaluation of a simple model of vitrinite reflectance based on chemical kinetics. Am. Assoc. Pet. Geol. Bull. 1990, 74, 1559–1570. 10.1306/0c9b251f-1710-11d7-8645000102c1865d. [DOI] [Google Scholar]
- Jarvie D. M.; Claxton B. L.; Henk F.; Breyer J. T.. Oil and shale gas from the Barnett Shale, Ft. AAPG Annual Meeting Program: Worth Basin, Texas (Abs.), 2001; p A100.
- Katz B.; Lin F. Consideration of the limitations of thermal maturity with respect to vitrinite reflectance, Tmax, and other proxies. AAPG 2021, 105, 695–720. 10.1306/09242019261. [DOI] [Google Scholar]
- Clark J. P.; Philp R. P. Geochemical Characterization of Evaporite and Carbonate Depositional Environments and Correlation of Associated Crude Oils in the Black Creek Basin, Alberta. Bull. Can. Petrol. Geol. 1989, 37, 401–416. 10.35767/gscpgbull.37.4.401. [DOI] [Google Scholar]
- Chakhmakhchev A.; Suzuki M.; Takayama K. Distribution of alkylated dibenzothiophenes in petroleum as a tool for maturity assessments. Org. Geochem. 1997, 26, 483–489. 10.1016/S0146-6380(97)00022-3. [DOI] [Google Scholar]
- Radke M.; Welte D. H. The methylphenanthrene index (MPI): a maturity parameter based on aromatic hydrocarbons. Adv. Org. Geochem. 1981, 1983, 504–512. [Google Scholar]; Bjory, M. (Ed.)
- Pu F.; Philip R.; Zhenxi L.; Guangguo Y. Geochemical characteristics of aromatic hydrocarbons of crude oils and source rocks from different sedimentary environments. Org. Geochem. 1990, 16, 427–435. 10.1016/0146-6380(90)90059-9. [DOI] [Google Scholar]
- Hughes W. B.; Holba A. G.; Dzou L. I. P. The Ratios of Dibenzothiophene to Phenanthrene and Pristane to Phytane as Indicators of Depositional Environment and Lithology of Petroleum Source Rocks. Geochim. Cosmochim. Acta 1995, 59, 3581–3598. 10.1016/0016-7037(95)00225-O. [DOI] [Google Scholar]
- Radke M.; Vriend S. P.; Ramanampisoa L. R. Alkyldibenzofurans in terrestrial rocks: Influence of organic facies and maturation. Geochim. Cosmochim. Acta 2000, 64, 275–286. 10.1016/S0016-7037(99)00287-2. [DOI] [Google Scholar]
- Li M.; Wang T.; Zhong N.; Zhang W.; Sadik A.; Li H. Ternary diagram of fluorenes, dibenzothiophenes and dibenzofurans: Indicating depositional environment of crude oil source rocks. Energy Explor. Exploit. 2013, 31, 569–588. 10.1260/0144-5987.31.4.569. [DOI] [Google Scholar]
- Asif M.; Wenger L. M. Heterocyclic aromatic hydrocarbon distributions in petroleum: A source facies assessment tool. Org. Geochem. 2019, 137, 103896. 10.1016/j.orggeochem.2019.07.005. [DOI] [Google Scholar]
- Chen S.; Zhu Y.; Wang H.; Liu H.; Wei W.; Fang J. Shale gas reservoir characterisation: A typical case in the southern Sichuan Basin of China. Energy 2011, 36, 6609–6616. 10.1016/j.energy.2011.09.001. [DOI] [Google Scholar]
- Jarvie D. M.; Hill R. J.; Ruble T. E.; Pollastro R. M. Unconventional shale-gas systems: The Mississippian Barnett Shale of north-central Texas as one model for thermogenic shale-gas assessment. Am. Assoc. Pet. Geol. Bull. 2007, 91, 475–499. 10.1306/12190606068. [DOI] [Google Scholar]
- Wang F. P.; Gale J. F. W. Screening criteria for shale-gas systems. Gulf Coast Assoc. Geol. Soc. Trans. 2009, 59, 779. [Google Scholar]
- Mohamed A. Y.; Whiteman A. J.; Archer S. G.; Bowden S. A. Thermal modelling of the Melut basin Sudan and South Sudan: Implications for hydrocarbon generation and migration. Mar. Petrol. Geol. 2016, 77, 746–762. 10.1016/j.marpetgeo.2016.07.007. [DOI] [Google Scholar]
- Botor D.; Bábek O. Burial and thermal history modelling of the Upper Carboniferous strata based on vitrinite reflectance data from Bzie-Dębina-60 borehole (Upper Silesian Coal Basin, southern Poland). Geologické výzkumy na Moravě a ve Slezsku 2019, 26, 73–79. 10.5817/gvms2019-1-2-73. [DOI] [Google Scholar]
- Ameen M. S. Possible forced folding in the Taurus-Zagros belt of northern Iraq. Geol. Mag. 1991, 128, 561–584. 10.1017/S0016756800019695. [DOI] [Google Scholar]
- Berberian M. Master “blind” thrust faults hidden under the Zagros folds: active basement tectonics and surface morphotectonics. Tectonophysics 1995, 241, 193–224. 10.1016/0040-1951(94)00185-c. [DOI] [Google Scholar]
- Hessami K.; Koyi H. A.; Talbot C. J.; Tabasi H.; Shabanian E. Progressive unconformities within an evolving foreland fold–thrust belt, Zagros Mountains. J. Geol. Soc. Lond 2001, 158, 969–981. 10.1144/0016-764901-007. [DOI] [Google Scholar]
- Sherkati S.; Letouzey J. Variation of structural style and basin evolution in the central Zagros (Izeh zone and Dezful Embayment), Iran. Iran. Mar. Pet. Geol. 2004, 21, 535–554. 10.1016/j.marpetgeo.2004.01.007. [DOI] [Google Scholar]
- Agard P.; Omrani J.; Jolivet L.; White church H.; Vrielynck B.; Spakman W.; Monie P.; Meyer B.; Wortel R. Zagros Orogeny: a subduction-dominated process. Geol. Mag. 2011, 148, 692–725. 10.1017/S001675681100046X. [DOI] [Google Scholar]
- Allen M. B.; Saville C.; Blanc E. J.-P.; Talebian M.; Nissen N. Orogenic plateau growth: expansion of the Turkish-Iranian Plateau across the Zagros folds-and thrust belt. Tectonic 2013, 32, 171. 10.1002/tect.20025. [DOI] [Google Scholar]
- Hadad Y. T.; Hakimi M. H.; Abdullah W. H.; Kinawy M.; El Mahdy O.; Lashin A. Organic geochemical characteristics of Zeit source rock from Red Sea Basin and their contribution to organic matter enrichment and hydrocarbon generation potential. J. African Earth Sci. 2021, 177, 104151. 10.1016/j.jafrearsci.2021.104151. [DOI] [Google Scholar]
- Zumberge J. E. Terpenoid biomarker distributions in low maturity crude oils. Org. Geochem. 1987, 11, 479–496. 10.1016/0146-6380(87)90004-0. [DOI] [Google Scholar]
- Waples D.; Machihara T.. Biomarkers for Geologists: A Practical Guide to the Application of Steranes and Triterpanes in Petroleum Geology, Methods in Exploration Series; American Association of Petroleum Geologists, 1991. [Google Scholar]
- Murray A. P.; Boreham C. J.. Organic Geochemistry in Petroleum Exploration; Aust. Geol. Surv. Organ. Canberra, 1992; p 230. [Google Scholar]
- Bray E. E.; Evans E. D. Distribution of n-paraffins as a clue to recognition of source beds. Geochim. Cosmochim. Acta 1961, 22, 2–15. 10.1016/0016-7037(61)90069-2. [DOI] [Google Scholar]
- Connan J.; Cassou A. M. Properties of gases and petroleum liquids derived from terrestrial kerogen at various maturation levels. Geochim. Cosmochim. Acta 1980, 44, 1–23. 10.1016/0016-7037(80)90173-8. [DOI] [Google Scholar]
- Didyk B. M.; Simoneit B. R. T.; Brassell S. C. t.; Eglinton G. Organic geochemical indicators of palaeoenvironmental conditions of sedimentation. Nature 1978, 272, 216–222. 10.1038/272216a0. [DOI] [Google Scholar]
- Chandra K.; Mishra C. S.; Samanta U.; Gupta A.; Mehrotra K. L. Correlation of different maturity parameters in the Ahmedabad-Mehsana block of the Cambay basin. Org. Geochem. 1994, 21, 313–321. 10.1016/0146-6380(94)90193-7. [DOI] [Google Scholar]
- Huang W. Y.; Meinschein W. G. Sterols as ecological indicators. Geochim. Cosmochim. Ac 1979, 43, 739–745. 10.1016/0016-7037(79)90257-6. [DOI] [Google Scholar]
- Strachan M. G.; Alexander R.; Kagi R. I. Trimethylnaphthalenes in crude oils and sediments: Effects of source and maturity. Geochim. Cosmochim. Acta 1988, 52, 1255–1264. 10.1016/0016-7037(88)90279-7. [DOI] [Google Scholar]
- Armstroff A.; Wilkes H.; Schwarzbauer J.; Littke R.; Horsfield B. Aromatic hydrocarbon biomarkers in terrestrial organic matter of Devonian to Permian age. Palaeogeog. Palaeoclimatol. Palaeoecol. 2006, 240, 253–274. 10.1016/j.palaeo.2006.03.052. [DOI] [Google Scholar]
- Bissada K. K. Geochemical constraints on petroleum generation and migration—a review. Proc. ASCOPE 1982, 81, 69–87. [Google Scholar]
- Katz B.; Lin F. Lacustrine basin unconventional resource plays: Key differences. Mar. Pet. Geol. 2014, 56, 255–265. 10.1016/j.marpetgeo.2014.02.013. [DOI] [Google Scholar]
- Jarvie D. M.Shale Resource Systems for Oil and Gas: Part 2-Shale-Oil Resource Systems; American Association of Petroleum Geologists, 2012. [Google Scholar]
- Hu T.; Pang X.; Wang Q.; Jiang S.; Wang X.; Huang C.; Xu Y.; Li L.; Li H. Geochemical and geological characteristics of Permian Lucaogou Formation shale of the well Ji174, Jimusar Sag, Junggar Basin, China: Implications for shale oil exploration. Geol. J. 2018, 53, 2371–2385. 10.1002/gj.3073. [DOI] [Google Scholar]
- Shalaby M. R.; Hakimi M. H.; Abdullah W. H. Geochemical characterization of solid bitumen (migrabitumen) in the Jurassic sandstone reservoir of the Tut Field, Shushan Basin, northern Western Desert of Egypt. Int. J. Coal Geol. 2012, 100, 26–39. 10.1016/j.coal.2012.06.001. [DOI] [Google Scholar]
- Seifert W. K.; Michael Moldowan J. The effect of biodegradation on steranes and terpanes in crude oils. Geochim. Cosmochim. Acta 1979, 43, 111–126. 10.1016/0016-7037(79)90051-6. [DOI] [Google Scholar]
- Seifert W. K.; Moldowan J. M. Paleoreconstruction by biological markers. Geochim. Cosmochim. Acta 1981, 45, 783. 10.1016/0016-7037(81)90108-3. [DOI] [Google Scholar]
- Seifert W. K.; Moldowan J. M.. Use of biological markers in petroleum exploration. In Methods in Geochemistry and Geophysics Book; Johns R. B., Ed.; Amsterdam Series, 1986; Vol. 24, pp 261–290. [Google Scholar]
- Mackenzie A. S.; Patience R. L.; Maxwell J. R.; Vandenbroucke M.; Durand B. Molecular parameters of maturation in the Toarcian shales, Paris Basin, France—I. Changes in the configurations of acyclic isoprenoid alkanes, steranes and triterpanes. Geochim. Cosmochim. Acta 1980, 44, 1709–1721. 10.1016/0016-7037(80)90222-7. [DOI] [Google Scholar]
- Behar F.; Vandenbroucke M.; Tang Y.; Marquis F.; Espitalie J. Thermal cracking of kerogen in open and closed systems: determination of kinetic parameters and stoichiometric coefficients for oil and gas generation. Org. Geochem. 1997, 26, 321–339. 10.1016/s0146-6380(97)00014-4. [DOI] [Google Scholar]