

Abstract
Rationale
There is continued debate regarding the equivalency of positive-pressure ventilation (PPV) and negative-pressure ventilation (NPV). Resolving this question is important because of the different practical ramifications of the two paradigms.
Objectives
We sought to investigate the parallel between PPV and NPV and determine whether or not these two paradigms cause identical ventilation profiles by analyzing the local strain mechanics when the global tidal volume (Vt) and inflation pressure was matched.
Methods
A custom-designed electromechanical apparatus was used to impose equal global loads and displacements on the same ex vivo healthy porcine lung using PPV and NPV. High-speed high-resolution cameras recorded local lung surface deformations and strains in real time, and differences between PPV and NPV global energetics, viscoelasticity, as well as local tissue distortion were assessed.
Measurements and Main Results
During initial inflation, NPV exhibited significantly more bulk pressure–volume compliance than PPV, suggestive of earlier lung recruitment. NPV settings also showed reduced relaxation, hysteresis, and energy loss compared with PPV. Local strain trends were also decreased in NPV, with reduced tissue distortion trends compared with PPV, as revealed through analysis of tissue anisotropy.
Conclusions
Apparently, contradictory previous studies are not mutually exclusive. Equivalent changes in transpulmonary pressures in PPV and NPV lead to the same changes in lung volume and pressures, yet local tissue strains differ between PPV and NPV. Although limited to healthy specimens and ex vivo experiments in the absence of a chest cavity, these results may explain previous reports of better oxygenation and less lung injury in NPV.
Keywords: positive-pressure ventilation, negative-pressure ventilation, local strain, pressure–volume response, hysteresis
At a Glance Commentary
Scientific Knowledge on the Subject
The lung injury or damage induced by positive-pressure ventilation (PPV) or artificial breathing is a well-known phenomenon. Understanding the mechanical parallel between PPV and physiological negative-pressure ventilation (NPV) is key to optimizing use of ventilators and improving patient outcomes. By repeating PPV and NPV on the same specimens and using the same air delivery system in both modes, so as to minimize confounding factors, we conclude that previously reported studies need not be necessarily viewed as contradictory: PPV and NPV can produce the same global pressures and volumes, but the local effects resulting from these bulk behaviors differ.
What This Study Adds to the Field
We use a unique multiapparatus interface between global pressure–volume mechanics and local strain measures to examine PPV and NPV and provide exclusive experimental evidence illuminating the debate between previous studies. Comparative measures of pressure–volume curves coupled with tissue-level deformations demonstrate that although the global response between PPV and NPV may be matched, the organ energetics and viscoelasticity and local stretch and distortions of NPV are reduced. This study provides key insights for major controversies within the field.
Pressure–volume curves derived from organ-level inflation–deflation tests can help characterize lung mechanics in health and disease (1, 2). Previous studies have analyzed positive-pressure ventilation (PPV) mechanics, in which applied air pressure produces lung inflation (3, 4). In contrast, physiological lung mechanics are governed by negative-pressure ventilation (NPV), in which diaphragm excursion reduces intrathoracic pressure, resulting in lung expansion and gas entrainment (3, 5). Understanding the similarities and differences between lung inflation resulting from PPV and NPV may yield mechanistic insights into ventilator-induced lung injury (VILI) (6).
Previous assessments of respiratory system responses to PPV and NPV through inflation–deflation tests or computed tomography compared outcomes from analyses of respiratory pressure–volume mechanics, hemodynamics, and oxygenation (5, 7–11). Grasso and colleagues reported better oxygenation via computed tomography tests and more recruitment of atelectatic lung in NPV (7, 8), whereas Engelberts and colleagues found insignificant pressure–volume or oxygenation differences between the two modes of ventilation (5). Engelberts and colleagues concluded that because their experiments demonstrated various applied positive and negative pressures resulted in the same tidal volumes (Vts), PPV and NPV are mechanically similar; they refute the benefits of NPV as claimed by Grasso and colleagues, suggesting those findings are attributable to the use of unmatched lung volume histories in NPV and PPV.
In the current study, we sought to resolve this controversy by using a custom-designed dual-piston apparatus (4) to implement both PPV and NPV on whole-organ ex vivo lungs under matched loading conditions, similar to Engelberts and colleagues (5). These global measures are uniquely interfaced with high-resolution and high-speed cameras to capture three-dimensional local tissue displacements on the pleural surface via digital image correlation (DIC) (12). This allowed us to link the global pressure–volume behavior of the lung to local tissue deformation responses in both PPV and NPV for the first time. Some of the results of these studies have been previously reported as abstracts (13–15).
Methods
Lungs were collected from five healthy pigs of 6-8 months old weighing 200–250 lbs (local abattoir, Institutional Animal Care and Use Committee approval not required) (16). Testing was completed within 30 hours postmortem, and the lung was maintained in 1× phosphate-buffered saline (17, 18). The specimen was inflated, and quick-drying white enamel paint (Rust-Oleum) was used to speckle the entire lung surface for DIC patterning. Images were collected at 15 Hz, and technical strain was calculated using GOM software (Trilion Quality Systems GOM ARAMIS, 2016) (19). Detailed DIC tracking and analysis methodology can be found in Mariano and colleagues (12).
The lung was placed inside our custom-designed, volume-controlled, airtight pressure–volume ventilation system as validated previously (4), shown with representative pressure– and volume–time responses in Figure E1 in the online supplement. Inflation volumes of 675, 900, and 1,350 ml, corresponding to clinical tidal volumes (Vt) of 6, 8, and 12 ml/kg (4, 20), were applied in PPV. Then, the maximum transpulmonary pressures and corresponding changes in lung volume in PPV were matched for each lung within ±10% for each NPV test, similar to past studies (5, 7, 21). A preload of ±5 cm H2O was applied in PPV and NPV, and each lung was preconditioned with three complete inflation–deflation cycles at 15 breaths per minute before capturing a cycle for analysis (22). PPV and NPV pressure–volume loops for the three various Vts are illustrated in Figure 1, measuring the actual change in lung volume. A subsequent inflation and volume hold of 120 seconds was used to assess the viscoelastic response and calculate the percent pressure relaxation (17).
Figure 1.
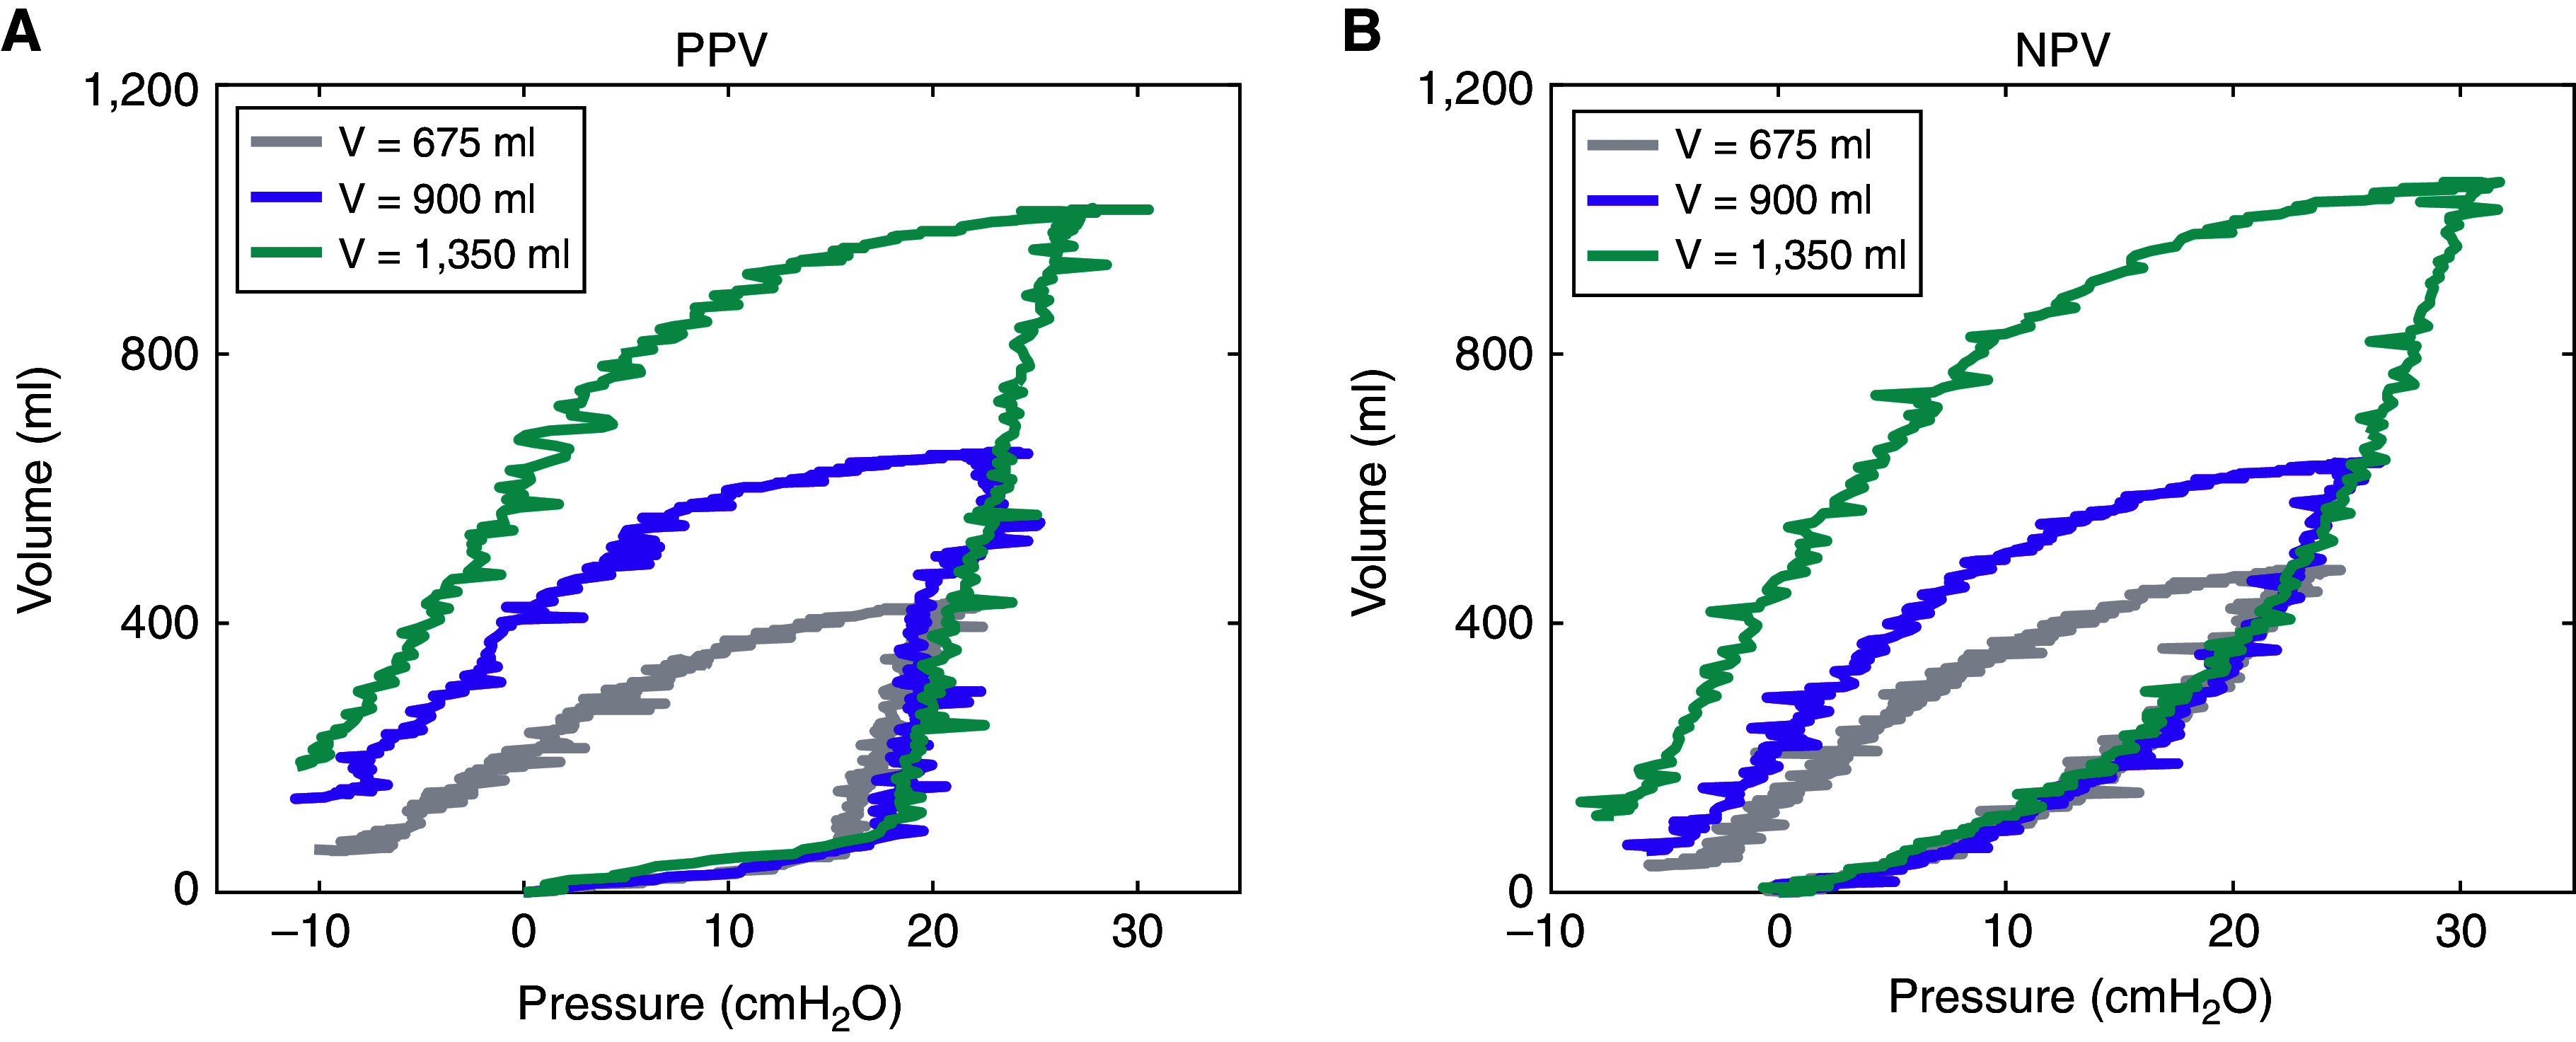
Pressure–volume raw lung measures under (A) positive-pressure ventilation (PPV) and (B) negative-pressure ventilation (NPV), in which inflation volume varied from 675 to 1,350 ml at a rate of 15 breaths per minute. After three preconditioning cycles, the subsequent cycle shown here is analyzed, in which PPV and NPV maximum pressures and change in lung volumes were matched. With increasing inflation volumes, bulk tissue compliancy was also noted to increase.
As exemplified previously (23, 24), a bilinear fit was applied to the linear portions of the inflation and deflation pressure–volume curves to calculate the initial and final slopes representing airway opening, tissue stiffness, and alveolar expansion (25, 26) (Figure 2). Hysteresis was defined as the area between the loading and unloading curve, and energy loss was found as the hysteresis normalized by total work (17, 27).
Figure 2.

(A) Representative porcine pressure–volume response for matched positive-pressure ventilation (PPV) and negative-pressure ventilation (NPV) at maximum pressure and change in lung volume. Dotted lines show the bilinear fit of the initial and final portions of the inflation curves. Initial and final deflation slopes were similarly characterized. The averaged slopes ± SD of (B) the initial portion of inflation curve, (C) the final portion of inflation curve, (D) the initial portion of deflation curve, and (E) the final portion of deflation curve are shown. Varying the Vt influences bulk tissue compliancy, and PPV slopes are noted to differ with NPV during inflation. Indicated differences between PPV and NPV are significant with P = 0.0313 and denoted differences between applied volumes are significant with P = 0.0133 or 0.0047.
Local strain was tracked throughout the experiment, analyzing two stages: maximum inflation and the inflection point, which was defined as the intersection of the bilinear fit. Contour maps represented the strain distributions across the dorsal lung (Figure 3) and were quantified to compare PPV and NPV mean, median, range, and maximum strain values (Figure 4). The NPV pressure–volume inspiratory limb differed, and thus, for the inflection stage, both a PPV volume-match and pressure-match were analyzed (Figure 5).
Figure 3.

(A) Positive-pressure ventilation (PPV) and negative-pressure ventilation (NPV) pressure–volume response highlighting matched maximum inflation point and defined inflection point in PPV with corresponding pressure- and volume-match in NPV on the same representative porcine specimen. Strain contour colormaps at inflation volumes of 675, 900, and 1,350 ml at (B) PPV inflection point, (C) NPV pressure-matched inflection point, (D) NPV volume-matched inflection point, (E) PPV maximum inflation point, and (F) NPV matched maximum inflation point. NPV testing conditions exhibited more uniform strain distribution and smaller strain values at the maximum inflation stage for all applied tidal volumes (Vts).
Figure 4.

Histograms quantifying the measured digital image correlation lung strains for three Vts of 675, 900, and 1,350 ml at the maximum inflation stage for (A) positive-pressure ventilation (PPV) and (B) negative-pressure ventilation (NPV). Vertical line denotes averaged mean. Despite matched lung pressure and volume globally, the specimens exhibited trends of reduced local strain means and maximums in NPV compared with PPV. The differences were statistically significant at 900 and 1,350 ml.
Figure 5.

Inflection point histograms of strain values in (A) positive-pressure ventilation (PPV), and negative-pressure ventilation (NPV) counterparts for (B) pressure-matched and (C) volume-matched Vts of 675, 900, and 1,350 ml. Vertical line denotes averaged mean. These results showed the mean, median, and ranges of strain to be greater in NPV than PPV tests.
The reduced Jacobian calculation confirmed the volume change between the two ventilation schemes was matched at each applied volume (28). In addition, the anisotropic index, a measure of tissue stretch distortion, was calculated, in which a value of 1 indicated tissue isotropy (Figure 6).
Figure 6.
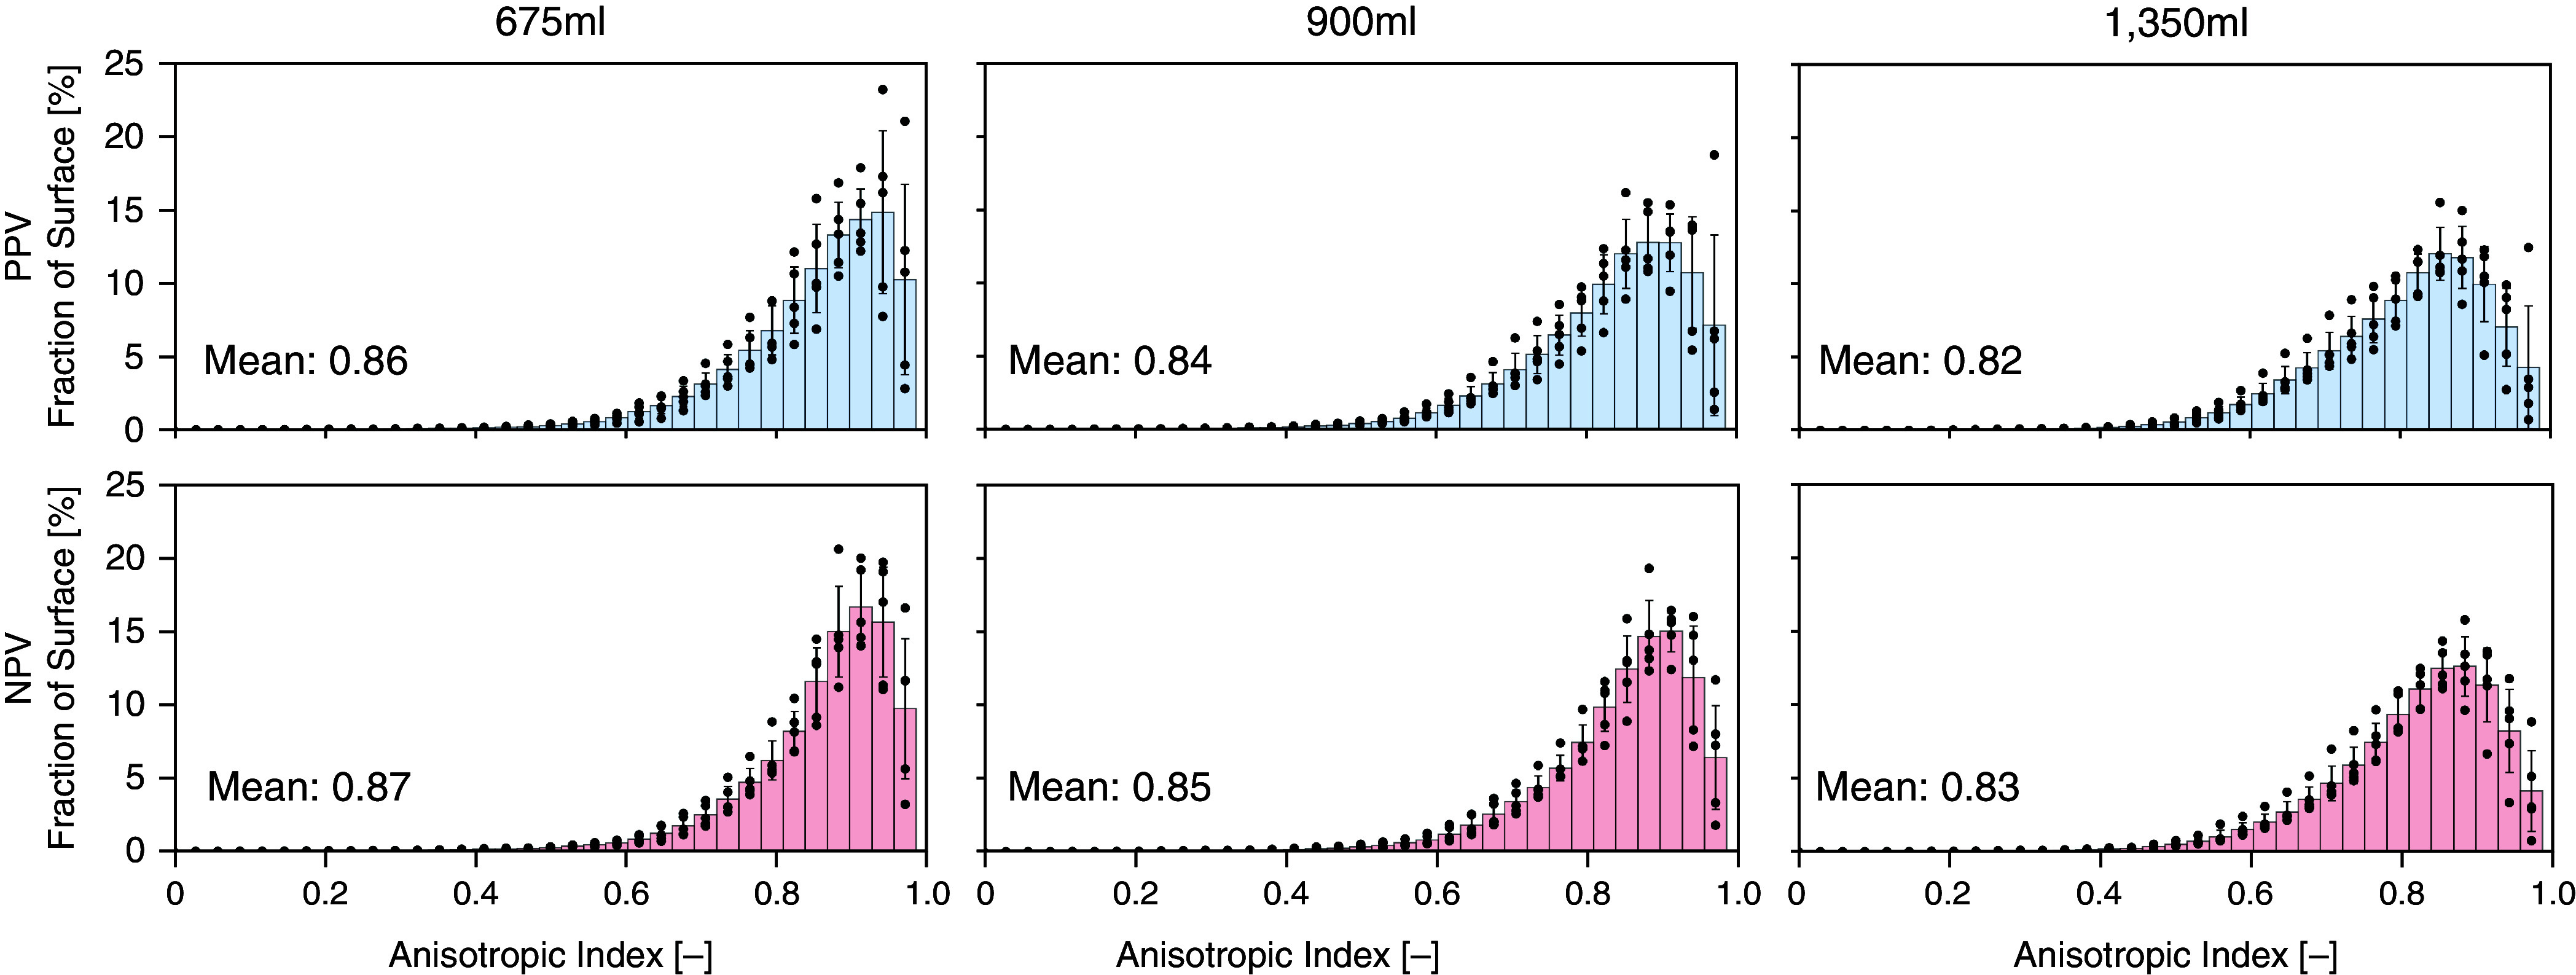
Comparison of the anisotropic index between positive-pressure ventilation (PPV) and negative-pressure ventilation (NPV) tests for various inflation volumes. Vertical line denotes averaged mean. The anisotropic index tended to be higher for NPV than PPV tests.
Results were statistically analyzed using the nonparametric paired t test (Wilcoxon) and one-way ANOVA (Friedman) (GraphPad Prism) for comparisons between PPV and NPV and across volume groups, respectively. Multiple comparisons were performed with Dunn’s methods. A significance level of 0.05 was set, and the actual P values are included in the figures.
Further details are provided in the online supplement.
Results
PPV versus NPV Varying Vts
Figure 1 demonstrates lung pressure–volume data with PPV and NPV matched for maximum inflation for various inflation volumes. With greater applied volumes, both PPV and NPV loops became wider; however, the inflation paths were notably dissimilar.
Global PPV and NPV pressure–volume behaviors were quantified by extracting the slope for initial and final inflation and deflation portions for various volumes (Figure 2). PPV produced a sudden rise in volume at nearly 20 cm H2O, whereas NPV gradually changed volume over the pressure range (Figure 2A). The lung had greater compliance during the initial inflation in NPV compared with PPV for all tested volumes (Figure 2B). In contrast, the compliance was reduced over the final portion of inflation with NPV compared with PPV (Figure 2C). The initial and final deflation curves found NPV to trend more compliantly, with statistically significant differences with PPV in final deflation for 675 ml (Figures 2D and 2E).
Increasing Vts typically found 1,350 ml to yield the greatest inflation and deflation compliancy; this was significant for PPV and NPV during final inflation and deflation. PPV exhibited a unidirectional increase in compliance for increasing Vts, unlike NPV. The initial deflation portion of the pressure–volume curve appeared to be independent of the applied volume, whereas the final deflation slope found PPV and NPV to depend on the Vt.
Strain Distributions
Strain contour colormaps at inflation volumes of 675, 900, and 1,350 ml were collected at PPV–NPV matched maximum inflation, the inflection pressure-match, and the inflection volume-match (Figure 3). Qualitative strain distributions across the lung surface were observed.
PPV and NPV exhibited different pressure–volume paths, indicating the inflection stage to be a point of interest. The PPV inflection stage was matched with NPV either in volume or in pressure (Figure 3A). The surface strain quantification for the PPV inflection stage (Figure 3B) was most similar to NPV volume-match, despite the stage occurring at a lower pressure (Figure 3D). When NPV pressure-matched the PPV inflection point, NPV strains were greater across the specimen’s surface, likely coupled to the higher global volume.
The maximum inflation match between PPV and NPV demonstrated qualitative strain differences. PPV strains were larger and more pronounced (Figure 3E) than NPV (Figure 3F), despite identical changes in global lung volume and pressures. As the inflation volumes were increased, the comparative trends between PPV and NPV at both the maximum and inflection stages were still apparent. All applied PPV volumes exhibited sizable regions of strain >75% at maximum inflation, whereas these large stretches had reduced footprints in NPV.
Additional strain contour colormaps are provided in Figure E2 for a more detailed comparison between PPV and NPV at continuous time points during inflation to better illustrate the disparate strain evolutions observed between these two ventilation modes.
Quantified Maximum Inflation and Inflection Stage Local Strains
PPV and NPV strain distributions were quantified using histograms for the maximum inflation and inflection stage. Figure 4 shows the fraction of the lung surface exhibiting specified values of strains for each pig at maximum inflation, where the lung experienced the same pressure and volume globally. The mean strain and maximum strains averaged across all specimens demonstrated lower values in NPV compared with PPV for all Vts, with statistically significant differences at volumes of 900 and 1,350 ml (P = 0.0313). Increased Vts resulted in increased means, ranges, medians, and maximum strains for both PPV and NPV loads, reshaping the strain histogram from right-skewed to a normal distribution.
The local strains at the PPV inflection stage were compared with corresponding NPV pressure- and volume-matches (Figure 5). NPV strain means and medians trended higher than PPV; both volume- and pressure-matches yielded statistically significant differences between PPV and NPV (P = 0.0313 for all pressure-matches and volume-matches). Similarly, differences in strain range and maximum strain were significant for the PPV and NPV volume-match at Vts of 675 and 900 ml (P = 0.0313) and for all volumes of the PPV and NPV pressure-match (P = 0.0313). The pressure-matched NPV tests exhibited the greatest range and mean strains. As expected, increasing Vts increased the mean and ranges of measured strain.
Tissue Distortion
The anisotropic index was calculated for each lung at maximum inflation (Figure 6). The average index was compared between PPV and NPV and tended to be greater for NPV (not significant, P ⩾ 0.0625). Increasing Vt resulted in more anisotropy for both PPV and NPV, and the increase between 675 ml and 1,350 ml was found to be significant (P = 0.0047).
Relaxation and Energetics
Viscoelasticity was evaluated in both PPV and NPV tests and demonstrated as average ± SD of pressure relaxation for all pigs in Figure 7A. A representative pressure relaxation profile is also provided (Figure 7B) and demonstrated greater pressure relaxation in PPV than in NPV, statistically significant at Vts of 900 and 1,350 ml (P = 0.0313; Figure 7A).
Figure 7.

(A) Percent pressure relaxation of positive-pressure ventilation (PPV) and negative-pressure ventilation (NPV) tests at various Vts. (B) Representative pressure relaxation profile from PPV and NPV tests at volume 900 ml. NPV tests demonstrated lower pressure relaxation than PPV tests, significant with P = 0.0313 at volumes of 900 and 1,350 ml.
Investigations of PPV and NPV energetics found PPV hysteresis trended greater for all inflation volumes and was statistically significant for all Vts (Figure 8). Energy loss was significantly greater in PPV than in NPV for all Vts. Increasing Vt from 675 to 1,350 ml resulted in a significant increase in hysteresis for both PPV and NPV, but the energy loss did not exhibit such a unidirectional trend.
Figure 8.

Comparison of (A) hysteresis and (B) energy loss between positive-pressure ventilation (PPV) and negative-pressure ventilation (NPV) tests for various inflation volumes. Increased hysteresis and energy loss were found for PPV compared with NPV. Indicated differences between PPV and NPV are significant with P = 0.0313 and denoted differences between applied volumes are with P = 0.0047.
Discussion
We associate PPV and NPV local and global lung mechanics, finding results are consistent with Engelberts and colleagues (5), who found peak PPV/NPV pressure-matches resulted in matching volume values. However, we also found NPV reduced surface strain concentrations, caused homogenous stretch contours, and tended to show increased isotropy compared with PPV (Figures 3–6); this aligns with Grasso and colleagues’ conclusions that better oxygenation results from improved air distribution in NPV, as well as the trend documented by Engelberts and colleagues finding greater arterial oxygenation in NPV (5, 7). By repeating PPV and NPV on the same specimens and using the same air delivery system in both modes to minimize confounding factors, we conclude that previously reported results need not be necessarily viewed as contradictory: PPV and NPV can produce the same global pressures and volumes, but the local effects resulting from these bulk behaviors differ. This suggests the use of PPV versus NPV may have different implications for ventilator-induced injury, because this form of damage is influenced by local parenchymal strain (29).
Global pressure–volume inflation paths differed significantly between PPV and NPV (Figure 2), even though total lung volume changed at the same rate. For all Vts, the lung was initially more difficult to inflate in PPV than in NPV (Figure 2B) and became easier to inflate during the latter part of inspiration. This discrepancy in the two ventilation modes is potentially explained by airway resistance and/or parenchymal elastance differences. Given the quasistatic nature of the experiments, it is unlikely airway resistance would be the culprit, because it makes a relatively small contribution to overall transpulmonary pressure changes during ventilation (30, 31). Also, PPV would be expected to expand the proximal airways and thus reduce their resistance. This leaves differences in lung elastance as the likely explanation for Figures 1 and 2. Furthermore, the sharpness of the change in pressure–volume slope during PPV is suggestive of sudden lung recruitment occurring midway along the course of inflation, as has been observed previously in ex vivo lungs and patients with acute respiratory distress syndrome (ARDS) (25, 32–36). In other words, the differences in PPV versus NPV lung stiffness appear to potentially be due to disparate degrees of lung recruitment pertaining to a given lung volume. The local strain values at the inflection point support this interpretation; PPV results in significantly lower mean strain, range, median and maximum strains than the same pressure in NPV (qualitatively observed in Figures 3B and 3C) and in terms of lung expansion and surface strain (Figures 5A and 5B). Even at matched volumes at the inflection point, where PPV pressure is higher, NPV still demonstrates greater local strains (Figure 5C). These findings agree with a previous study reporting significant differences in aeration in midinspiration between PPV and NPV (8).
PPV energetics, reflected in the shape of the inspiratory and expiratory pressure–volume profiles, demonstrate greater hysteresis and work of breathing than NPV (Figure 8). In addition to the recruitment and derecruitment of alveoli (32, 37), the finite width of the pressure– volume loop has been attributed to the dynamics of surfactant molecules at the air–liquid interface (38–41) and the behavior of the fibers that compose the lung tissue (38, 42–44). These effects may be enhanced in lung diseases, such as chronic obstructive pulmonary disease (45) and VILI (46), which could explain why hysteresis and breathing work increase with disease progression (44). Nevertheless, in the normal lungs of the present study, it seems reasonable to suppose that acute changes in hysteresis due solely to the mechanical ventilation mode would be attributable to differences in the nature of recruitment and derecruitment throughout the ventilatory cycle.
Inflation of a lung comprising elastic alveolar units served by a rigid airway tree, in which the inflating medium is considered incompressible and the only relevant variable is transpulmonary pressure, should theoretically result in no inflation behavior difference between PPV and NPV. The differences we observed here, therefore, must be explicable on the basis of the extent to which the above assumptions are not valid. If the airways are compliant, for example, then it is conceivable that the movement of air along the airway tree from branch to branch does not happen simultaneously but rather is a sequential phenomenon in which air must expand one branch to some degree before moving to the next. In this case, the sequence of events would differ during PPV versus NPV. Moreover, if airway closure occurs, it will disrupt the communication between distal and proximal airways, and this might be more pronounced in PPV than in NPV. Although the exact mechanisms remain uncertain, Yoshida and colleagues proposed that NPV may reduce the pleural pressure gradient by recruiting dependent lung instead of aerating nondependent, already-inflated lung (47–49). Our results support this notion: despite matched changes in total lung volume, transpulmonary pressure, and similar expanding surface area as computed by the Jacobian (28), the strain concentrations during PPV were more visible (Figure 3E) and more frequent (Figure 4A) with larger maximum strain values compared with NPV. In contrast, the spatial distribution of strain in NPV was more uniform (Figure 3F). Also, the anisotropic index, a measure previously used to assess the severity of disease progression in patients with chronic obstructive pulmonary disease (50), tended to decrease during PPV compared with NPV, further supporting the notion of distorted local strains in PPV. This was notable at the higher Vts of 900 and 1,350 ml, in which PPV local strains were fourfold to fivefold greater than in NPV, (albeit the anisotropic index difference was not significant; P = 0.0625). This applies particularly to 1,350 ml, where a greater fraction of the lung surface experienced strains of 100% or more in PPV compared with NPV. These findings suggest that lung tissue damage is more likely to be associated with PPV than with NPV (7).
We also observed notable pressure relaxation (Figure 7), mirroring isolated airway and parenchyma tissue stress relaxation tests (17, 18, 51, 52). In our experiments, the same specimen was tested in PPV and NPV, and therefore the material properties must be identical. Thus, the observed PPV/NPV viscoelastic differences suggest alveolar loading, time-dependent recruitment and the experienced tissue stress under positive or negative ventilation, are disparate (explained further below and in supplemental notes). Because patients with ARDS have significant differences in viscoelastic properties (53), these findings support the possibility that lung function may become more impaired under PPV as opposed to NPV. Indeed, continuous external NPV delivered to patients with ARDS has been demonstrated to be effective (54–56). In an analysis of six intubated patients with ARDS, continuous external NPV resulted in better oxygenation at lower transpulmonary, airway, and intraabdominal pressures and improved hemodynamics compared with continuous PPV (57). Furthermore, combining PPV and NPV in a synchronized manner has the putative benefits of enabling more effective modulation of flows, volumes, and pressures to meet the ventilatory needs of the patient (58) and may decrease the high mortality from ARDS (59).
The effect of inflation volume on compliancy, hysteresis, strain values, and anisotropy index has also been investigated in the current study. Increasing the Vt did not have an impact on the initial lung compliance undergoing PPV but did affect NPV lung compliance, supporting the hypothesis that airways and alveoli are initially nonresponsive in PPV, so varying Vt is not as influential on the initial compliance. Increasing hysteresis for increasing Vt was expected and observed, yet energy loss was unaffected by changes in Vt for both PPV and NPV. This was previously established only for PPV from dog and human tests (38, 60), and now for NPV in this study. In addition, increasing Vt results in significantly greater values of mean strain at the maximum inflation stage and greater tissue distortion (lower anisotropy index) in both PPV and NPV.
The aforementioned mechanism of airway recruitment explaining the discrepancies between PPV and NPV may have its own underlying mechanism, attributable to thin- versus thick-walled airway models. Previously, theoretical PPV and NPV differences in thin-walled compartment models have been discussed by Engelberts and colleagues (5), who concluded that similar mechanics are at play but conceded that geometrical effects may be critical. Specifically, if the airways behave like thick-walled cylinders, their behavior will be governed by the Lamé equations instead (61), and the mechanics will be determined not only by the transmural pressure but also by the average pressure across the wall. Therefore, although PPV and NPV transmural pressures are identical, their dissimilar average pressures beget disparate PPV versus NPV wall stresses and therefore strain values, resulting in differing airway recruitment thresholds. This posits an explanation for the different experimental local DIC strains between PPV and NPV (Figures 3–6) and an overarching rationalization for the global PPV and NPV pressure–volume inspiratory limb differences (Figure 2). A more detailed analysis and discussion is provided in the online supplement (Figures E3 and E4).
Limitations
Among the limitations of this study is that our experiments were conducted on porcine and not human lungs. Conclusions may well differ based on animal species; Engelberts and colleagues (5) refute the differences between PPV and NPV based on mice data, whereas Grasso and colleagues (7) used rabbits with lungs potentially large enough to observe the mechanics seen here in pig lungs. In addition, the experiments of the present study were conducted on isolated lungs (12), eliminating circulation and chest wall effects; nonetheless, pressure–volume similarities between in situ and ex vivo mouse lungs have been reported (5), supporting the likelihood that these ex vivo findings may extend to in situ. Although DIC necessitates ex vivo testing, it affords real-time and continuous local strain measures, enabling the extraction of moments of interest, such as the inflection point. Thus, despite being limited to measurements on the lung surface, our study provides insights that are not possible with other discrete-time and prolonged imaging methods that collect internal tissue behaviors (e.g., computed tomography or digital volume correlation). Although absolute displacement of the isolated lung may be somewhat different than in situ, relative measures (strain and the spatial distributions) between PPV and NPV are unlikely to be significantly different between ex vivo and in situ conditions. In addition, the reduced pleural pressure gradient associated with negative pressure requires further exploration, because this phenomenon has been demonstrated to occur through diaphragm realignment, which cannot be examined given our current explanted lung experimental design (47). It is also important to note that measurements were collected exclusively from the dorsal surface of the lung, as simultaneous imaging of the lung’s ventral side would require a second interfacing DIC apparatus; accounting for all sides of the lung during ventilation, as well as the role of lung shape due to positioning (i.e., prone vs. supine) (62), can further elucidate possible mechanistic differences between PPV and NPV posited in this study. Another potential limitation is the use of slightly slower than normal breathing rates to maintain quasistatic assumptions, which may impact viscoelastic effects. Finally, it is important to emphasize that the mechanical discrepancies we observed between PPV and NPV were recorded from the same lung specimen subject to the same testing environment, so the greater resistance and heterogeneity resulting from PPV compared with NPV observed in these healthy specimens may also potentially extend to pathological conditions, given the more solid-like behavior of diseased lungs (63); pulmonary heterogeneities and alterations in pressure distribution in diseased states may well exacerbate PPV and NPV differences (7), particularly at the local level.
Conclusions
VILI is a well-known artifact of PPV, and thus understanding the physiological differences between PPV and NPV can lead to safer ventilation strategies for patients. Previous studies examining the global parallel between these two paradigms were missing associated local insights, which we address here using a unique multiapparatus interface to provide novel experimental evidence to illuminate the PPV versus NPV mechanics debate. Global lung pressure–volume curves coupled with tissue-level deformation maps demonstrate that organ energetics and viscoelasticity, together with local stretch and distortions, are reduced in NPV compared with PPV. Findings from this investigation provide a rationale for additional inquiry into in vivo ventilation differences between PPV and NPV.
Acknowledgments
Acknowledgment
The authors thank Dr. Karen Huaying Xu, Dr. Shaokui Ge, and Matthew Arthur for their help in statistical analysis.
Footnotes
Supported by a Dassault Systemes U.S. Foundation Grant, the Hellman Fellows Program, and the University of California National Laboratory Fees Research Program (M.E.), and the National Science Foundation Graduate Research Fellowship (C.A.M.).
Author Contributions: M.E. conceptualized and devised the study. C.A.M. and S.S. designed and performed the experiments. C.A.M., M.E., and S.S. analyzed the data and drafted the figures. H.T., J.H.T.B., M.E., S.S., and W.G.K. interpreted the results and wrote the manuscript. All authors contributed to the article and approved the submitted version.
This article has an online supplement, which is accessible from this issue’s table of contents at www.atsjournals.org.
Originally Published in Press as DOI: 10.1164/rccm.202111-2480OC on October 4, 2022
Author disclosures are available with the text of this article at www.atsjournals.org.
References
- 1. Faffe DS, Zin WA. Lung parenchymal mechanics in health and disease. Physiol Rev . 2009;89:759–775. doi: 10.1152/physrev.00019.2007. [DOI] [PMC free article] [PubMed] [Google Scholar]
- 2. Suki B, Stamenović D, Hubmayr R. Lung parenchymal mechanics. Compr Physiol . 2011;1:1317–1351. doi: 10.1002/cphy.c100033. [DOI] [PMC free article] [PubMed] [Google Scholar]
- 3. Corrado A, Gorini M. Negative-pressure ventilation: is there still a role? Eur Respir J . 2002;20:187–197. doi: 10.1183/09031936.02.00302602. [DOI] [PubMed] [Google Scholar]
- 4. Sattari S, Mariano CA, Vittalbabu S, Velazquez JV, Postma J, Horst C, et al. Introducing a custom-designed volume-pressure machine for novel measurements of whole lung organ viscoelasticity and direct comparisons between positive- and negative-pressure ventilation. Front Bioeng Biotechnol . 2020;8:578762. doi: 10.3389/fbioe.2020.578762. [DOI] [PMC free article] [PubMed] [Google Scholar]
- 5. Engelberts D, Malhotra A, Butler JP, Topulos GP, Loring SH, Kavanagh BP. Relative effects of negative versus positive pressure ventilation depend on applied conditions. Intensive Care Med . 2012;38:879–885. doi: 10.1007/s00134-012-2512-5. [DOI] [PMC free article] [PubMed] [Google Scholar]
- 6. Dar M, Swamy L, Gavin D, Theodore A. Mechanical-ventilation supply and options for the COVID-19 pandemic: leveraging all available resources for a limited resource in a crisis. Ann Am Thorac Soc . 2021;18:408–416. doi: 10.1513/AnnalsATS.202004-317CME. [DOI] [PMC free article] [PubMed] [Google Scholar]
- 7. Grasso F, Engelberts D, Helm E, Frndova H, Jarvis S, Talakoub O, et al. Negative-pressure ventilation: better oxygenation and less lung injury. Am J Respir Crit Care Med . 2008;177:412–418. doi: 10.1164/rccm.200707-1004OC. [DOI] [PubMed] [Google Scholar]
- 8. Helm E, Talakoub O, Grasso F, Engelberts D, Alirezaie J, Kavanagh BP, et al. Use of dynamic CT in acute respiratory distress syndrome (ARDS) with comparison of positive and negative pressure ventilation. Eur Radiol . 2009;19:50–57. doi: 10.1007/s00330-008-1105-8. [DOI] [PubMed] [Google Scholar]
- 9. Skaburskis M, Helal R, Zidulka A. Hemodynamic effects of external continuous negative pressure ventilation compared with those of continuous positive pressure ventilation in dogs with acute lung injury. Am Rev Respir Dis . 1987;136:886–891. doi: 10.1164/ajrccm/136.4.886. [DOI] [PubMed] [Google Scholar]
- 10. Lockhat D, Langleben D, Zidulka A. Hemodynamic differences between continual positive and two types of negative pressure ventilation. Am Rev Respir Dis . 1992;146:677–680. doi: 10.1164/ajrccm/146.3.677. [DOI] [PubMed] [Google Scholar]
- 11. Easa D, Mundie TG, Finn KC, Hashiro G, Balaraman V. Continuous negative extrathoracic pressure versus positive end-expiratory pressure in piglets after saline lung lavage. Pediatr Pulmonol . 1994;17:161–168. doi: 10.1002/ppul.1950170305. [DOI] [PubMed] [Google Scholar]
- 12. Mariano CA, Sattari S, Maghsoudi-Ganjeh M, Tartibi M, Lo DD, Eskandari M. Novel mechanical strain characterization of ventilated ex vivo porcine and murine lung using digital image correlation. Front Physiol . 2020;11:600492. doi: 10.3389/fphys.2020.600492. [DOI] [PMC free article] [PubMed] [Google Scholar]
- 13.Sattari S, Mariano CA, Eskandari M.2021.
- 14.Mariano CA, Sattari S, Eskandari M.Assessing the comparative strains between positive and negative pressure ventilation using digital image correlation. 2021.
- 15. Eskandari M, Sattari S, Mariano CA. Investigating the mechanics of positive- versus negative-pressure ventilation [abstract] Am J Respir Crit Care Med . 2021;203:A4671. doi: 10.1164/rccm.202111-2480OC. [DOI] [PMC free article] [PubMed] [Google Scholar]
- 16. Mariano CA, Sattari S, Quiros KAM, Nelson TM, Eskandari M. Examining lung mechanical strains as influenced by breathing volumes and rates using experimental digital image correlation. Respir Res . 2022;23:1–13. doi: 10.1186/s12931-022-01999-7. [DOI] [PMC free article] [PubMed] [Google Scholar]
- 17. Eskandari M, Arvayo AL, Levenston ME. Mechanical properties of the airway tree: heterogeneous and anisotropic pseudoelastic and viscoelastic tissue responses. J Appl Physiol (1985) . 2018;125:878–888. doi: 10.1152/japplphysiol.00090.2018. [DOI] [PubMed] [Google Scholar]
- 18. Sattari S, Eskandari M. Characterizing the viscoelasticity of extra- and intra-parenchymal lung bronchi. J Mech Behav Biomed Mater . 2020;110:103824. doi: 10.1016/j.jmbbm.2020.103824. [DOI] [PubMed] [Google Scholar]
- 19.2016. Digital image correlation and strain computation basics [accessed 2021 Oct 14]. Available from: https://www.gom.com/en/products/3d-testing/aramis-3d-camera. 1–30.
- 20. Chiumello D, Carlesso E, Cadringher P, Caironi P, Valenza F, Polli F, et al. Lung stress and strain during mechanical ventilation for acute respiratory distress syndrome. Am J Respir Crit Care Med . 2008;178:346–355. doi: 10.1164/rccm.200710-1589OC. [DOI] [PubMed] [Google Scholar]
- 21. Dong S-J, Wang L, Chitano P, Coxson HO, Vasilescu DM, Paré PD, et al. Lung resistance and elastance are different in ex vivo sheep lungs ventilated by positive and negative pressures. Am J Physiol Lung Cell Mol Physiol . 2022;322:L673–L682. doi: 10.1152/ajplung.00464.2021. [DOI] [PubMed] [Google Scholar]
- 22. Perinel S, Pourchez J, Leclerc L, Avet J, Durand M, Prévôt N, et al. Development of an ex vivo human-porcine respiratory model for preclinical studies. Sci Rep . 2017;7:43121. doi: 10.1038/srep43121. [DOI] [PMC free article] [PubMed] [Google Scholar]
- 23. Eskandari M, Nordgren TM, O’Connell GD. Mechanics of pulmonary airways: linking structure to function through constitutive modeling, biochemistry, and histology. Acta Biomater . 2019;97:513–523. doi: 10.1016/j.actbio.2019.07.020. [DOI] [PMC free article] [PubMed] [Google Scholar]
- 24. Lynch HA, Johannessen W, Wu JP, Jawa A, Elliott DM. Effect of fiber orientation and strain rate on the nonlinear uniaxial tensile material properties of tendon. J Biomech Eng . 2003;125:726–731. doi: 10.1115/1.1614819. [DOI] [PubMed] [Google Scholar]
- 25. Jonson B, Svantesson C. Elastic pressure-volume curves: what information do they convey? Thorax . 1999;54:82–87. doi: 10.1136/thx.54.1.82. [DOI] [PMC free article] [PubMed] [Google Scholar]
- 26. Maghsoudi-Ganjeh M, Sattari S, Eskandari M. Mechanical behavior of the airway wall in respiratory disease. Curr Opin Physiol . 2021;22:100445. [Google Scholar]
- 27. Chung J, Lachapelle K, Wener E, Cartier R, De Varennes B, Fraser R, et al. Energy loss, a novel biomechanical parameter, correlates with aortic aneurysm size and histopathologic findings. J Thorac Cardiovasc Surg . 2014;148:1082–1088. doi: 10.1016/j.jtcvs.2014.06.021. [DOI] [PubMed] [Google Scholar]
- 28. Amelon R, Cao K, Ding K, Christensen GE, Reinhardt JM, Raghavan ML. Three-dimensional characterization of regional lung deformation. J Biomech . 2011;44:2489–2495. doi: 10.1016/j.jbiomech.2011.06.009. [DOI] [PMC free article] [PubMed] [Google Scholar]
- 29. Gaver DP, III, Nieman GF, Gatto LA, Cereda M, Habashi NM, Bates JHT. The POOR get POORer: a hypothesis for the pathogenesis of ventilator-induced lung injury. Am J Respir Crit Care Med . 2020;202:1081–1087. doi: 10.1164/rccm.202002-0453CP. [DOI] [PMC free article] [PubMed] [Google Scholar]
- 30. Bayliss LE, Robertson GW. The visco-elastic properties of the lung. Q J Exp Physiol Cogn Med Sci . 1939;29:27–47. [Google Scholar]
- 31. Mount LE. The ventilation flow-resistance and compliance of rat lungs. J Physiol . 1955;127:157–167. doi: 10.1113/jphysiol.1955.sp005246. [DOI] [PMC free article] [PubMed] [Google Scholar]
- 32. Bates JHT, Irvin CG. Time dependence of recruitment and derecruitment in the lung: a theoretical model. J Appl Physiol (1985) . 2002;93:705–713. doi: 10.1152/japplphysiol.01274.2001. [DOI] [PubMed] [Google Scholar]
- 33. Hickling KG. Best compliance during a decremental, but not incremental, positive end-expiratory pressure trial is related to open-lung positive end-expiratory pressure: a mathematical model of acute respiratory distress syndrome lungs. Am J Respir Crit Care Med . 2001;163:69–78. doi: 10.1164/ajrccm.163.1.9905084. [DOI] [PubMed] [Google Scholar]
- 34. Harris RS. Pressure-volume curves of the respiratory system. Respir Care . 2005;50:78–98, discussion 98–99. [PubMed] [Google Scholar]
- 35. Chen L, Del Sorbo L, Grieco DL, Shklar O, Junhasavasdikul D, Telias I, et al. Airway closure in acute respiratory distress syndrome: an underestimated and misinterpreted phenomenon. Am J Respir Crit Care Med . 2018;197:132–136. doi: 10.1164/rccm.201702-0388LE. [DOI] [PubMed] [Google Scholar]
- 36. Hedenstierna G, Chen L, Brochard L. Airway closure, more harmful than atelectasis in intensive care? Intensive Care Med . 2020;46:2373–2376. doi: 10.1007/s00134-020-06144-w. [DOI] [PMC free article] [PubMed] [Google Scholar]
- 37. Smaldone GC, Mitzner W, Itoh H. Role of alveolar recruitment in lung inflation: influence on pressure-volume hysteresis. J Appl Physiol . 1983;55:1321–1332. doi: 10.1152/jappl.1983.55.4.1321. [DOI] [PubMed] [Google Scholar]
- 38. Mead J, Whittenberger JL, Radford EP., Jr Surface tension as a factor in pulmonary volume-pressure hysteresis. J Appl Physiol . 1957;10:191–196. doi: 10.1152/jappl.1957.10.2.191. [DOI] [PubMed] [Google Scholar]
- 39. Leite-Júnior JH, Rocco PRM, Faffe DS, Romero PV, Zin WA. On the preparation of lung strip for tissue mechanics measurement. Respir Physiol Neurobiol . 2003;134:255–262. doi: 10.1016/s1569-9048(02)00217-3. [DOI] [PubMed] [Google Scholar]
- 40. Sanderson RJ, Paul GW, Vatter AE, Filley GF. Morphological and physical basis for lung surfactant action. Respir Physiol . 1976;27:379–392. doi: 10.1016/0034-5687(76)90066-9. [DOI] [PubMed] [Google Scholar]
- 41. Bachofen M, Bachofen H, Hildebrandt J. Pressure-volume curves of air- and liquid-filled excised lungs-surface tension in situ. J Appl Physiol . 1970;29:422–431. doi: 10.1152/jappl.1970.29.4.422. [DOI] [PubMed] [Google Scholar]
- 42. Bates JHT. A micromechanical model of lung tissue rheology. Ann Biomed Eng . 1998;26:679–687. doi: 10.1114/1.42. [DOI] [PubMed] [Google Scholar]
- 43. Mijailovich SM, Stamenović D, Fredberg JJ. Toward a kinetic theory of connective tissue micromechanics. J Appl Physiol (1985) . 1993;74:665–681. doi: 10.1152/jappl.1993.74.2.665. [DOI] [PubMed] [Google Scholar]
- 44. Oliveira CLN, Araújo AD, Bates JHT, Andrade JS, Jr, Suki B. Entropy production and the pressure-volume curve of the lung. Front Physiol . 2016;7:73. doi: 10.3389/fphys.2016.00073. [DOI] [PMC free article] [PubMed] [Google Scholar]
- 45. Chen S, Li Y, Zheng Z, Luo Q, Chen R. The analysis of components that lead to increased work of breathing in chronic obstructive pulmonary disease patients. J Thorac Dis . 2016;8:2212–2218. doi: 10.21037/jtd.2016.08.01. [DOI] [PMC free article] [PubMed] [Google Scholar]
- 46. Marini JJ, Crooke PS, Tawfik P, Chatburn RL, Dries DJ, Gattinoni L. Intracycle power and ventilation mode as potential contributors to ventilator-induced lung injury. Intensive Care Med Exp . 2021;9:55. doi: 10.1186/s40635-021-00420-9. [DOI] [PMC free article] [PubMed] [Google Scholar]
- 47. Yoshida T, Engelberts D, Otulakowski G, Katira B, Ferguson ND, Brochard L, et al. Continuous negative abdominal pressure: mechanism of action and comparison with prone position. J Appl Physiol (1985) . 2018;125:107–116. doi: 10.1152/japplphysiol.01125.2017. [DOI] [PubMed] [Google Scholar]
- 48. Yoshida T, Engelberts D, Otulakowski G, Katira B, Post M, Ferguson ND, et al. Continuous negative abdominal pressure recruits lungs at lower distending pressures. Am J Respir Crit Care Med . 2018;197:534–537. doi: 10.1164/rccm.201705-0979LE. [DOI] [PubMed] [Google Scholar]
- 49. Yoshida T, Engelberts D, Otulakowski G, Katira B, Post M, Ferguson ND, et al. Continuous negative abdominal pressure reduces ventilator-induced lung injury in a porcine model. Anesthesiology . 2018;129:163–172. doi: 10.1097/ALN.0000000000002236. [DOI] [PubMed] [Google Scholar]
- 50.Pan Y, Christensen GE, Durumeric OC, Gerard SE, Bhatt SP, Barr RG, et al. 2020, pp. 1891–1895.
- 51. Safshekan F, Tafazzoli-Shadpour M, Abdouss M, Shadmehr MB. Viscoelastic properties of human tracheal tissues. J Biomech Eng . 2017;139:1–9. doi: 10.1115/1.4034651. [DOI] [PubMed] [Google Scholar]
- 52. Dai Z, Peng Y, Mansy HA, Sandler RH, Royston TJ. A model of lung parenchyma stress relaxation using fractional viscoelasticity. Med Eng Phys . 2015;37:752–758. doi: 10.1016/j.medengphy.2015.05.003. [DOI] [PMC free article] [PubMed] [Google Scholar]
- 53. Ganzert S, Möller K, Steinmann D, Schumann S, Guttmann J. Pressure-dependent stress relaxation in acute respiratory distress syndrome and healthy lungs: an investigation based on a viscoelastic model. Crit Care . 2009;13:R199. doi: 10.1186/cc8203. [DOI] [PMC free article] [PubMed] [Google Scholar]
- 54. Sanyal SK, Bernal R, Hughes WT, Feldman S. Continuous negative chest-wall pressure: successful use for severe respiratory distress in an adult. JAMA . 1976;236:1727–1728. doi: 10.1001/jama.236.15.1727. [DOI] [PubMed] [Google Scholar]
- 55. Sanyal S, Turner S, Ossi M, Coburn T. Continuous negative chest wall pressure therapy in management of severe hypoxemia due to aspiration pneumonitis: a case report. Respir Care . 1979;16:1022–1025. [Google Scholar]
- 56. Morris AH, Elliott CG. Adult respiratory distress syndrome: successful support with continuous negative extrathoracic pressure. Crit Care Med . 1985;13:989–990. [PubMed] [Google Scholar]
- 57. Raymondos K, Molitoris U, Capewell M, Sander B, Dieck T, Ahrens J, et al. Negative- versus positive-pressure ventilation in intubated patients with acute respiratory distress syndrome. Crit Care . 2012;16:R37. doi: 10.1186/cc11216. [DOI] [PMC free article] [PubMed] [Google Scholar]
- 58. Vincenzi U. A new mode of mechanical ventilation: positive + negative synchronized ventilation. Multidiscip Respir Med . 2021;16:788. doi: 10.4081/mrm.2021.788. [DOI] [PMC free article] [PubMed] [Google Scholar]
- 59. Raymondos K, Ahrens J, Molitoris U. Combined negative- and positive-pressure ventilation for the treatment of ARDS. Case Rep Crit Care . 2015;2015:714902. doi: 10.1155/2015/714902. [DOI] [PMC free article] [PubMed] [Google Scholar]
- 60. Bachofen H, Hildebrandt J. Area analysis of pressure-volume hysteresis in mammalian lungs. J Appl Physiol . 1971;30:493–497. doi: 10.1152/jappl.1971.30.4.493. [DOI] [PubMed] [Google Scholar]
- 61.Boresi AP, Schmidt RJ. Advanced mechanics of materials. 6th. Hoboken: John Wiley & Sons; 2003. [Google Scholar]
- 62. Katira BH, Osada K, Engelberts D, Bastia L, Damiani LF, Li X, et al. Positive end-expiratory pressure, pleural pressure, and regional compliance during pronation: an experimental study. Am J Respir Crit Care Med . 2021;203:1266–1274. doi: 10.1164/rccm.202007-2957OC. [DOI] [PubMed] [Google Scholar]
- 63. Yoshida T, Torsani V, Gomes S, De Santis RR, Beraldo MA, Costa ELV, et al. Spontaneous effort causes occult pendelluft during mechanical ventilation. Am J Respir Crit Care Med . 2013;188:1420–1427. doi: 10.1164/rccm.201303-0539OC. [DOI] [PubMed] [Google Scholar]