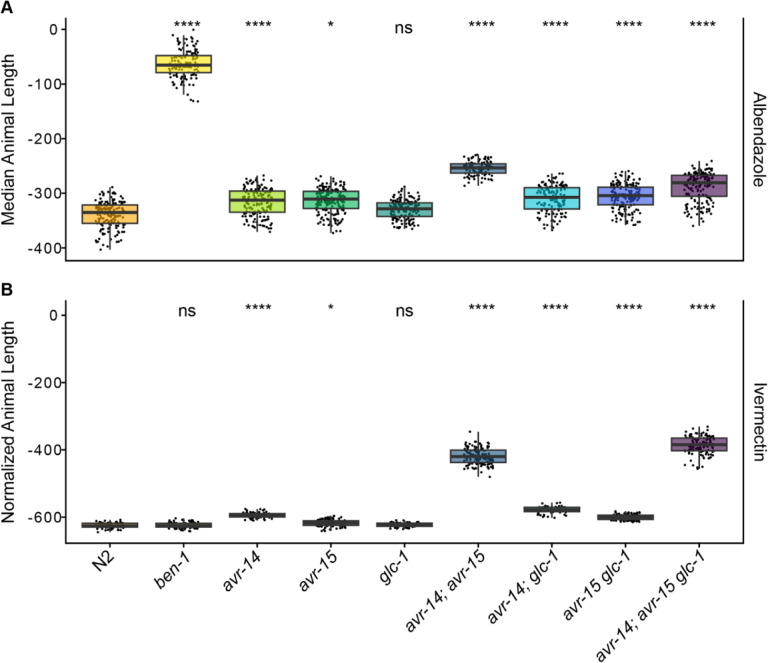
Fig 4. High-throughput assays for each mutant strain in the presence of albendazole and ivermectin.
The regressed median animal length values for populations of nematodes growth in either (A) 30 μM albendazole or (B) 250 nM ivermectin are shown on the y-axis. Each point represents the normalized median animal length value of a well containing approximately 5–30 animals. Data are shown as Tukey box plots with the median as a solid horizontal line, and the top and bottom of the box representing the 75th and 25th quartiles, respectively. The top whisker is extended to the maximum point that is within the 1.5 interquartile range from the 75th quartile. The bottom whisker is extended to the minimum point that is within the 1.5 interquartile range from the 25th quartile. Significant differences between the wild-type strain and all other deletions are shown as asterisks above the data from each strain (p > 0.05 = ns, p < 0.001 = ***, p < 0.0001 = ****, Tukey HSD).

