Abstract
Insulin exerts its potent effects on hepatic glucose fluxes via direct and indirect mechanisms. Whereas a liver-specific insulin receptor (IR) knockout (LIRKO) mouse exhibits glucose intolerance as well as insulin resistance, it is unclear whether a more acute decrease in the expression of hepatic IR would be sufficient to induce hepatic insulin resistance. Here we report that the downregulation of hepatic IR expression by up to 95% does not modify hepatic insulin action. The i.p. administration (2 injections over 1 week) of an antisense oligodeoxynucleotide (ASO) directed to reduce insulin expression downregulated hepatic IR expression in C57BL6J mice. A high dose of IR-ASO decreased IR protein approximately 95%, while a control-ASO failed to modify IR expression. At this dose, the IR-ASO also decreased IR expression in adipose tissue but did not significantly decrease IR expression in hypothalamus or skeletal muscle. Insulin action was assessed with insulin clamp studies in conscious mice. The rate of glucose infusion during the clamp studies was comparable in control-ASO– and IR-ASO–treated mice. Importantly, the depletion of liver IR protein markedly impaired downstream insulin signaling in the liver, but it failed to modify the rate of glucose production. Thus, near ablation of liver IR does not alter insulin action on glucose production.
Introduction
Systemic administration of insulin lowers blood glucose levels and inhibits endogenous glucose production (GP) within minutes. Insulin exerts its potent effects on hepatic glucose fluxes via direct and indirect mechanisms (1–4). The direct effects can be further divided into acute insulin actions leading to rapid decrease in GP (5–7) and chronic insulin actions modulating the gene expression of key gluconeogenic enzymes (8–10). Studies in conscious dogs indicate that the acute and direct effect of insulin in the liver is mainly to restrain hepatic glycogenolysis (11, 12). The indirect effects of insulin on hepatic glucose output include the suppression of lipolysis, the inhibition of glucagon secretion, and the activation of hypothalamic descending pathways (13, 14). There is a great deal of controversy regarding which mode of insulin action is most important under physiological conditions. In this regard, the life-long deletion of insulin receptors (IRs) in hepatocytes has been shown to lead to a near-complete loss of insulin action on glucose output (15, 16). Furthermore, selective acute changes in hepatic sinusoidal insulin levels in the absence of changes in circulating fatty acids, glucagon, or insulin were associated with marked alterations in hepatic GP in dogs (12). Additionally, acute manipulations of hypothalamic insulin signaling, circulating lipids, or glucagon were also sufficient to markedly impair insulin action on the liver (7, 13, 17, 18). Thus, the role of liver IRs in mediating the acute actions of insulin on liver glucose fluxes remains to be delineated.
The hepatic expression of IR protein is often decreased in chronic hyperinsulinemic states such as obesity, and this decline may contribute to hepatic insulin resistance (19). However, it is presently unknown to what extent hepatic IR expression has to be diminished in order to significantly impair downstream insulin signaling in vivo. This gap in knowledge is partly due to the lack of experimental evidence for the notion that a short-term IR loss-of-function can exert meaningful effects on liver signal transduction and on metabolic processes.
To determine the extent of downregulation of liver IR protein that can induce a defect in insulin signaling in vivo, we decreased the hepatic expression of IR protein using 2 i.p. doses of a sequence-specific antisense oligodeoxynucleotide (ASO). We first identified a level of IR protein sufficient to markedly impede the acute effects of insulin on Akt phosphorylation. Next, we asked whether defective insulin signaling within the liver is sufficient to alter in vivo insulin action on GP and/or glucose disposal. For this purpose, we employed the insulin clamp technique in combination with tracer infusions in conscious mice. Finally, we examined whether hepatic insulin signaling is specifically required for the rapid effects of insulin on glycogenolysis and/or on gluconeogenesis (GNG). Our results indicate that hepatic insulin signaling plays a significant role in the intrahepatic partitioning of glucose fluxes between glycogenolysis and GNG but is not required for the rapid effects of physiological hyperinsulinemia on GP.
Results
Treatment with IR-ASO markedly reduced liver IR expression.
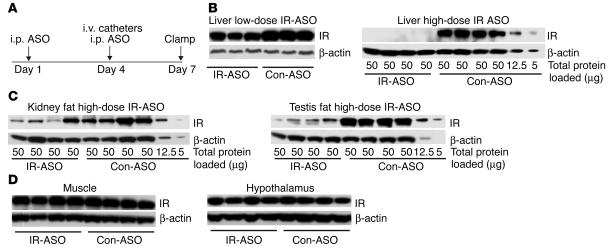
We treated mice with 2 i.p. injections of either IR-ASO or control-ASO on days 1 and 4 and examined them after 1 week (Figure 1A). Biweekly i.p. injections of IR-ASO at a dose of 50 mg/kg body weight decreased the hepatic expression of IR by approximately 60% (Figure 1B, upper panel) whereas injections of IR-ASO at a dose of 100 mg/kg body weight reduced liver IR protein by approximately 95% (Figure 1B, lower panel). On day 5, the decrease in the hepatic expression of IR induced by 2 i.p. injections of IR-ASO at a dose of 100 mg/kg body weight averaged approximately 60% compared with the values obtained in rats similarly treated with control-ASO (data not shown). Since the i.p. administration of ASO can decrease protein expression in adipose tissue (20, 21), we also analyzed IR expression in adipose tissue. IR expression was downregulated by approximately 65% in renal and testis fat (Figure 1C). Importantly, IR protein abundance was unchanged in skeletal muscle and in hypothalamus (Figure 1D).
Figure 1.
Treatment with IR-ASO decreases liver IR protein levels in mice. (A) Protocol of ASO treatment in mice. Mice received i.p. injections of either IR-ASO or control-ASO on days 1 and 4 (7 and 3 days prior to the insulin clamp/insulin signaling studies, respectively). Catheters were inserted in the jugular vein 3 days prior to the clamp studies. (B) IR protein expression in livers of animals treated with IR-ASO or scrambled control-ASO (con-ASO). Livers from mice treated with a low dose (50 mg/kg body weight) of ASO (left panel) or with a high dose (100 mg/kg body weight) of ASO (right panel) were analyzed by Western blot with antiserum against IR. Membranes were stripped and reprobed with antiserum against β-actin for normalization purposes. Note protein dilutions of 1:4 and 1:10 of liver extracts from rats treated with scrambled ASO (last 2 samples on the right) were used for quantification purposes. IR protein is virtually undetectable in IR-ASO–treated mice, whereas a dilution of 1:10 in the control livers still shows a clearly detectable band. Thus, we estimate that the IR protein is downregulated by more than 95% in liver of IR-ASO rats. (C) IR expression in kidney and testis fat. We used the same dilution method as described for B. Samples were derived from the same animals in the same order as for the liver samples in Figure 1B, right panel. (D) Muscle and hypothalamus IR expression were not affected by treatment with IR-ASO.
Treatment with IR-ASO did not cause structural liver damage but moderately decreased liver glycogen content.
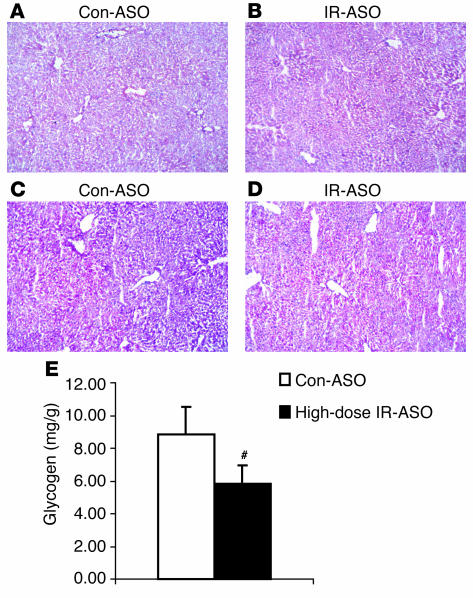
Since the livers of adult liver-specific IR knockout (LIRKO) mice display structural changes and a decrease in glycogen content (15), frozen sections of livers obtained from mice treated with control-ASO (Figure 2, A and C) and IR-ASO (Figure 2, B and D) were stained with either H&E or PAS. Livers of animals treated with either IR (Figure 2B) or control-ASO (Figure 2A) appeared to be structurally normal. However, PAS staining revealed decreased glycogen content in livers of mice treated with IR-ASO (Figure 2D) compared with livers of mice treated with control-ASO (Figure 2C). This decrease in liver glycogen content was also confirmed by chemical analysis (Figure 2E).
Figure 2.
Livers of IR-ASO–treated mice contain less glycogen than livers of animals treated with control-ASO. H&E staining of frozen sections of livers obtained from fasted mice treated with 100 mg/kg body weight of control-ASO (A) or IR-ASO (B) failed to reveal any major structural abnormalities. However, PAS staining suggested a decrease in glycogen content in livers of IR-ASO–treated mice (D) compared with livers of control-ASO–treated animals (C). This decrease was confirmed by chemical analyses of multiple liver samples (E) from the 2 experimental groups (#P < 0.001; IR-ASO vs. control-ASO).
Treatment with IR-ASO resulted in moderate decrease in plasma glycerol and FFA levels.
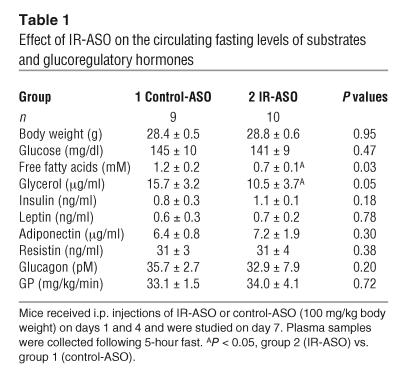
The levels of glucose, insulin, glucagon, resistin, adiponectin, and leptin were similar in mice treated with control-ASO and IR-ASO and fasted for 5 hours (Table 1). However, mice treated with IR-ASO displayed lower levels of FFA and glycerol compared with mice treated with control-ASO. Similar results were also obtained following a 24-hour fast with the only exception being a moderate but significant increase in plasma resistin levels (data not shown).
Table 1.
Effect of IR-ASO on the circulating fasting levels of substrates and glucoregulatory hormones
Decreased hepatic expression of IR does not modify in vivo insulin action.
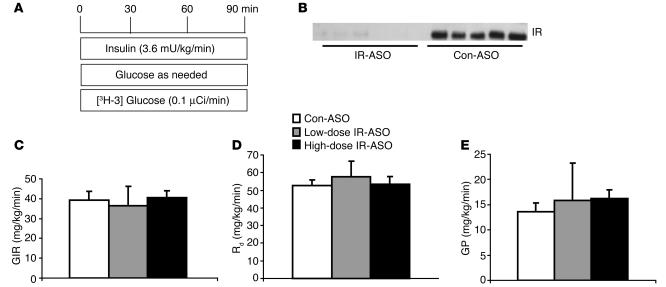
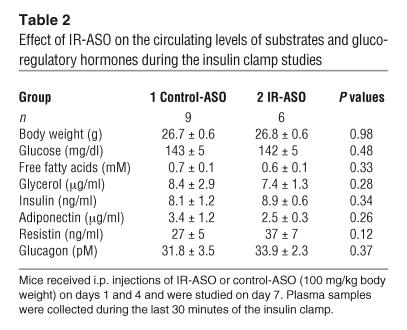
In order to delineate the role of hepatic IR in insulin action we performed insulin clamp studies in conscious mice (see Figure 3A; Table 2). The rate of insulin infusion was selected to generate a physiological increase in plasma insulin levels (to ∼8 ng/ml) that would submaximally stimulate glucose uptake and inhibit GP (21, 22). All measurements were performed during the final 40 minutes of the 90-minute clamp procedure, after steady-state conditions for plasma glucose and insulin concentrations, glucose specific activity (SA), and rates of glucose infusion were achieved. The plasma concentrations of glucose, free fatty acids, glycerol, insulin, adiponectin, resistin, and glucagons were similar in the control-ASO and IR-ASO groups during the last 40 minutes of the clamp studies (Table 2). Despite profound downregulation of hepatic IR expression (Figure 3B), the rates of exogenous glucose infusion required to maintain the target plasma glucose concentration during the insulin clamp were not significantly altered in mice treated with IR-ASO (Figure 3C). Similarly, the rate of glucose disappearance (Rd) and the rate of GP were also unaffected in mice treated with IR-ASO compared with that in mice treated with control-ASO (Figure 3, D and E). These results indicate that short-term downregulation of hepatic IR expression to as low as approximately 5% of normal levels does not compromise the ability of insulin to suppress GP.
Figure 3.
Acute downregulation of IR protein does not lead to hepatic insulin resistance. (A) Schematic representation of the insulin clamp procedure. The infusion studies lasted a total of 90 minutes. Mice received a primed-constant infusion of HPLC-purified [3-3H]-glucose (0.1 μCi/min) and insulin (3.6 mU/kg/min) at t = 0 minutes for the duration of the study. A variable infusion of a 10% glucose solution was started and periodically adjusted (glucose as needed) to maintain the plasma glucose concentration at approximately 8 mM for the rest of the study. (B) Western blot analysis of IR protein expression in liver extracts from mice receiving the insulin clamp procedure after treatment with the high dose IR-ASO or scrambled control-ASO. (C) Rates of glucose infusion (GIR) during the insulin clamp studies of mice treated with low and high dose IR antisense compared with mice treated with control-ASO. (D) Rates of glucose uptake (Rd) during the insulin clamp studies. (D) Rates of endogenous GP during the insulin clamp studies.
Table 2.
Effect of IR-ASO on the circulating levels of substrates and glucoregulatory hormones during the insulin clamp studies
Decreased hepatic expression of IR alters the intrahepatic distribution of glucose fluxes.
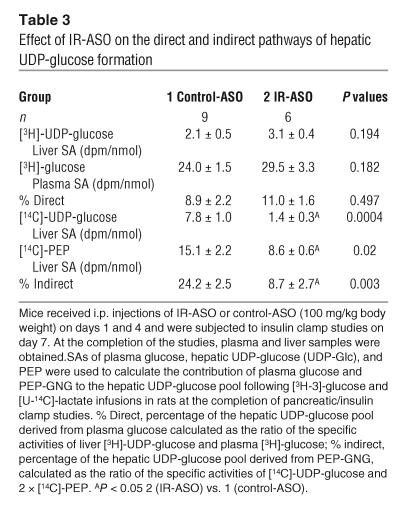
GP represents the net contribution of glucosyl units derived from GNG and glycogenolysis (Table 3). However, a portion of glucose entering the liver via phosphorylation of plasma glucose is also a substrate for dephosphorylation via glucose-6-phosphatase (G6Pase). This futile cycle between glucokinase and G6Pase is commonly named glucose cycling and accounts for the difference between the total glucose output (TGO) (flux through G6Pase) and GP.
Table 3.
Effect of IR-ASO on the direct and indirect pathways of hepatic UDP-glucose formation
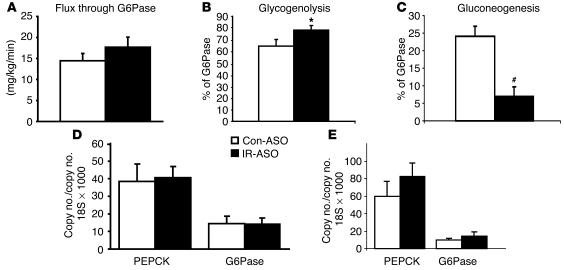
In order to assess whether an acute downregulation of hepatic IR levels modulates hepatic glucose fluxes, we estimated the in vivo flux through G6Pase and the relative contribution of glucose cycling, GNG, and glycogenolysis to glucose output (Table 2, Figure 4) in a subgroup of mice. Table 3 displays the [14C]-phosphoenolpyruvate ([14C]-PEP), [3H]- and [14C]-uridine-diphospho-glucose ([14C]-UDP-glucose), and the [3H]-glucose SAs used to calculate the contribution of PEP and plasma glucose (Indirect and Direct in Table 3) to the hepatic glucose-6-phosphate pool. Following the infusion of [14C]-lactate, the incorporation of labeled PEP in the hepatic UDP-glucose pool was markedly decreased in mice with decreased hepatic expression of IR (Table 3). This decrease was reflected in a markedly lower contribution of the indirect pathway to UDP-glucose formation. These data allowed us to estimate the in vivo fluxes through G6Pase, the rates of glucose cycling, PEP-GNG, and glycogenolysis in both groups (Figure 4). Dramatic changes in hepatic IR expression failed to significantly alter the rates of glucose cycling (P = 0.123) or of G6Pase flux (Figure 4A; P = 0.248). However, the relative contributions of GNG and glycogenolysis to either GP or G6Pase flux were significantly affected in mice treated with IR-ASO compared with those in mice treated with control-ASO. Glycogenolysis accounted for 73% ± 4% of GP in the control-ASO–treated group and 90% ± 3% in the IR-ASO–treated group (P = 0.006). Conversely, GNG constitutes 27% ± 4% of GP in the control-ASO–treated mice, but only 10% ± 3% of GP in the IR-ASO–treated mice. A similar shift in the intrahepatic distribution of hepatic glucose fluxes was detected when the contribution of glycogenolysis and GNG to the flux through G6Pase was calculated (Figure 4, B and C). This suggests that the short-term deficiency in the direct action of insulin in the liver results in increased glycogenolysis that is balanced by a parallel decrease in GNG. We next explored whether the hepatic expression of G6Pase and PEP carboxykinase (PEPCK) were significantly altered by the treatment with IR-ASO. Real-time PCR analyses performed on livers harvested either at the completion of the clamp studies (Figure 4D) or in fasted rats (Figure 4E) failed to reveal significant alterations in the hepatic expression of these gluconeogenic enzymes.
Figure 4.
Effect of acute downregulation of IR protein on hepatic glucose fluxes during insulin clamp studies. (A) Glucose flux through G6Pase in mice treated with high-dose IR antisense compared with that of controls. (B) Effect of treatment with high-dose IR antisense compared with that of control on glycogenolysis expressed as % of G6Pase flux. (C) Effect of treatment with high-dose IR antisense compared with that of control on GNG as % of G6Pase flux. (D) Effect of treatment with high-dose IR antisense compared with that of control on hepatic G6Pase and PEPCK mRNA levels assessed in the liver of mice completing the clamp procedure. (E) Effect of treatment with high-dose IR antisense compared with that of control on hepatic G6Pase and PEPCK mRNA levels assessed in the liver of fasted mice. *P < 0.05 vs. control-ASO–treated group; #P < 0.01 vs. control-ASO–treated group.
Downregulation of IR leads to marked decreases in downstream hepatic insulin signaling.
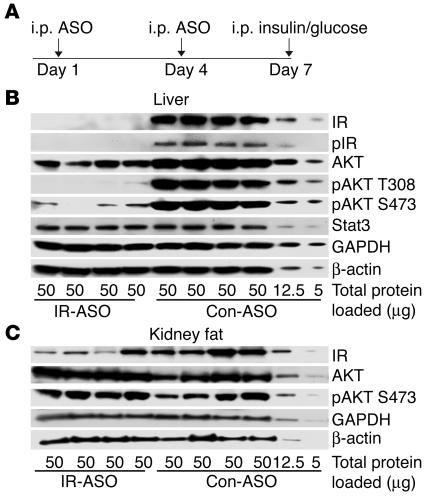
Based on the surprisingly modest metabolic impact of a 95% reduction in the hepatic expression of IR, we next asked whether this deficit is indeed sufficient to induce a marked impairment in liver insulin signaling. To this end, we injected mice fasted overnight with an i.p. bolus of insulin and sampled the liver 15 minutes later (Figure 5A). We assessed the phosphorylation of the IR and of Akt (PKB) by Western blots. Treatment with IR-ASO resulted in a marked downregulation of insulin signaling components when normalized to reference proteins (Figure 5B). The acute administration of insulin resulted in minimal phosphorylation of IR as assessed with a phosphospecific antibody against the phosphorylated IR. Furthermore, threonine phosphorylation at position 308 as well as serine phosphorylation at position 473 of Akt were markedly decreased in livers of IR-ASO–treated animals. Total protein levels of Akt were also moderately lower despite similar levels of β-actin, GAPDH, and Stat3 protein, indicating symmetrical loading of the gel. It should be noted that, although Stat 3 has been shown to regulate hepatic gluconeogenic genes, it is not known to be a direct target of IR signaling (23). Since IR was also downregulated in adipose tissue, we assessed IR signaling in renal fat obtained from the same animals. Confirming the results shown in Figure 1, the expression of IR was decreased by approximately 65% in these samples of renal adipose tissue (Figure 5C). Interestingly, this decrease in IR expression failed to impair insulin action on AKT phosphorylation in adipose tissue. Taken together, these data support the notion that signaling downstream of the IR is greatly impaired in the livers of animals treated with IR-ASO.
Figure 5.
IR-ASO treatment impairs insulin signaling. (A) Experimental design for treatment with IR-ASO and control-ASO and acute in vivo stimulation with i.p. insulin (100 mU). (B) Effect of IR-ASO compared with control-ASO on IR and Akt activation in liver extracts after acute insulin stimulation. IR activation was assessed with a phosphospecific antibody for tyrosine 1146 IR. Akt activation was assessed with phospho-specific antibodies against serine 473 (S473) and threonine 308 (T308) of Akt. For normalization purposes, membranes were stripped and reprobed with the housekeeping genes actin and GAPDH, as well as the transcription factor Stat3.
Discussion
Patients with type 2 diabetes mellitus (DM2) exhibit an elevation in the rates of GP despite increased circulating levels of insulin and glucose (24). This increase is largely accounted for by a marked enhancement in the rate of GNG rather than that of glycogenolysis (5, 25–28). Furthermore, several studies have confirmed that the ability of insulin to inhibit GNG is impaired in DM2 (5). However, the precise mechanism(s) by which insulin acutely regulates hepatic glucose fluxes remains controversial. Under physiological conditions, small changes in the portal insulin levels have been shown to alter GP mainly via modulation of the rate of hepatic glycogenolysis (11, 12). Conversely, rapid modulation of GNG appears to be largely mediated via extrahepatic actions of insulin (7, 13, 17, 18). The latter actions involve effects on lipolysis, glucagon secretion, and hypothalamic descendent pathways (13, 14).
The development of experimental models with a selective and marked impairment in liver insulin signaling should allow one to better define the relative contribution and the reciprocal interactions of the direct (hepatic) and indirect (extrahepatic) action of insulin on liver glucose fluxes. During the last decade, several approaches have been used to obtain tissue-selective downregulation of a target protein (20, 21, 29–31). Each of these experimental models has intrinsic advantages over the others. Most important, the careful characterization of the phenotype of these animal models has generally provided complementary rather than redundant information. In this regard, Fisher and Kahn have made use of the LIRKO mouse to test insulin’s effects on GP in a setting where direct hepatic effects of insulin were eliminated (16). Using this model, they concluded that insulin’s ability to suppress GP requires intact hepatic insulin signaling. Indeed, the lifelong lack of hepatic insulin signaling led to a complete loss not only of the direct but also of the indirect actions of insulin on the liver in this model. These findings appeared to be in contrast with previous work in humans and animals demonstrating that insulin also regulates hepatic GNG and GP via indirect actions in extrahepatic tissues (11, 12). The LIRKO mouse is indeed a valuable model for discerning the effects of liver-selective insulin deficiency. However, the lifelong lack of IRs in hepatocytes also resulted in age-dependent deterioration in liver pathology and function in this mouse. Furthermore, the liver of LIRKO mice is approximately half the normal size and displays dramatic changes in the expression of numerous insulin-regulated genes, including albumin, PEPCK, G6Pase, and IGF-1 (15). It is currently unknown how these dramatic changes in liver morphology, gene transcription, and function may have contributed to the severe hepatic insulin resistance in this model.
To begin unraveling this controversy, we developed an experimental mouse model in which the hepatic expression of IRs is more acutely modulated via a week-long treatment with sequence-specific ASO. This treatment results in a progressive decline in the hepatic expression of IR protein, culminating with its near ablation after 7 days. At this time, insulin action on downstream signaling is also markedly impaired. Importantly, the residual hepatic insulin signaling appears to be sufficient to prevent liver pathology as well as alterations in the expression of insulin-regulated genes and in insulin clearance. We can only speculate that the short duration of IR downregulation (with approximately 40% residual IR expression on day 5 after administration of IR-ASO) coupled with the modest expression of IR protein at the time of the experiments account for the relatively well-preserved effects of insulin on transcription and clearance during these experiments. Regardless, this is an ideal model for determining whether a severe but short-lived impairment in hepatic insulin signaling is sufficient to impair the acute action of insulin on hepatic glucose fluxes. In this study, we report that rapidly decreasing the expression of liver IRs to approximately 5% of the control levels is not sufficient to induce hepatic insulin resistance.
Insulin clamp studies in LIRKO mice demonstrated a marked impairment in insulin action on both GP and glucose disposal (16). In the present study, similar clamp studies were performed in conscious mice with near depletion of hepatic IRs. Surprisingly, the effects of insulin on glucose disposal and on GP were unaltered in mice treated with IR-ASO compared with mice treated with control-ASO. In fact, in vivo insulin action did not differ in animals with intact liver IRs (treated with control-ASO), with approximately 60% (low-dose IR-ASO) and approximately 95% (high-dose IR-ASO) reduction in IR protein in the liver. As it is known that in some but not in all cell systems, maximal insulin action can be achieved with partial occupancy of receptor-binding sites (32–34), we next determined whether the 95% decrease in IR protein abundance was sufficient to impair insulin action on downstream insulin signaling in the liver. Indeed, insulin effects on both IR phosphorylation and Akt phosphorylation were markedly blunted in mice treated with the high dose of IR-ASO. Thus, it is not likely that the preserved action of insulin on liver GP is simply due to enhanced ligand occupancy of spare receptors. Conversely, we propose that, in this model, insulin action in extrahepatic sites is well preserved and that this action is sufficient to preserve insulin’s ability to suppress glucose output.
The discrepancy between the present studies and those of Fisher and Kahn could be explained on several grounds. First, since in the LIRKO mice the depletion of liver IRs was restricted to hepatocytes, it is possible that the depletion of IR protein in hepatocytes was more complete in that model even though the reduction in overall liver IR abundance (approximately 95%) was similar in our high-dose IR-ASO group and in the LIRKO mice. In other words, the residual low level of hepatic insulin action may be sufficient to provide direct effects on the liver. Second, the prolonged depletion of liver IRs in the LIRKO mice led to dramatic changes in the expression of multiple insulin-regulated proteins. The latter included key enzymes within the glycolytic and gluconeogenic pathways. These transcriptional changes resemble the effects of severe insulin deficiency and therefore may override any acute effect of insulin on GP. Third, the associated liver pathology and/or other deficiencies during liver development may also play a role in the development of hepatic and peripheral insulin resistance in LIRKO mice. Finally, the presence of chronic and marked hyperinsulinemia may lead to severe impairment in insulin signaling at extrahepatic sites, such as the adipose tissue, the pancreas, and/or the hypothalamus, which in turn play an important role in the regulation of liver glucose metabolism.
It has been suggested that insulin action on the liver is particularly important for the regulation of glycogenolysis, while direct effects on GNG are difficult to demonstrate (11, 35). In this report, the overall rate of glucose output was not significantly altered by the changes in liver insulin signaling. However, the intrahepatic partitioning of glucose fluxes appeared to be affected. In fact, glycogenolysis accounted for 80% of the in vivo flux through G6Pase in mice treated with IR-ASO and for only 66% in mice treated with control-ASO (Figure 4, B and C). Conversely, the rate of GNG was markedly lower in the IR-ASO group. Thus, it is quite possible that a short-term and severe deficiency in direct insulin signaling in the liver results in a selective impairment in insulin action on hepatic glycogen breakdown. The moderate decrease in liver glycogen in the liver of these mice (Figure 2) is consistent with this notion.
Interestingly, administration of IR-ASO leads to moderate downregulation in the expression of IR in adipose tissue. In adipose tissue, insulin has been shown to achieve maximal suppression of lipolysis at a partial rate of occupancy of the IR (32, 33). Consistent with this, postulate treatment with IR-ASO did not alter insulin signaling downstream of the adipose tissue IR. Overall, it is unlikely that the decrease in adipose tissue IR resulted in elevated lipolytic rates at the whole body level, since the fasting FFA and glycerol levels were moderately decreased in the IR-ASO mice (Table 1). Furthermore, during the insulin clamp studies, the concentrations of both glycerol and FFA were similar independently of the ASO treatment; a postulated increase in lipolysis would be expected to stimulate rather than restrain GP in the presence of physiological hyperinsulinemia. Thus, the lack of hepatic insulin resistance is also consistent with preserved adipose tissue insulin action in this mouse model. Similarly, measurable differences in the levels of major glucoregulatory hormones did not provide an explanation for the preserved effect of insulin on GP despite a striking impairment in liver IR expression and signaling.
In conclusion, near ablation of liver IRs was sufficient to blunt downstream insulin signaling but failed to alter the effect of physiological hyperinsulinemia on the rates of GP and glucose uptake. Thus, a severe defect in insulin signaling within the liver is not sufficient to alter insulin action in vivo. However, hepatic insulin signaling appears to play a significant role in the intrahepatic partitioning of glucose fluxes between glycogenolysis and GNG. Our findings indicate that, though hepatic IRs are likely to play an important role in the long-term modulation of metabolic processes, mainly via changes in gene transcription (8, 10, 15), the rapid control of GP by insulin can still occur in the presence of short-term and severe impairment in liver insulin signaling.
Methods
Animals.
Adult male C57BL6J mice (27–32 g) were anesthetized with chloral hydrate (400 mg/kg BW i.p.) and catheterized through the right internal jugular vein as previously described (36). The venous catheter was used for infusion while blood samples were collected from the tail vein. Each animal was monitored for food intake and weight gain after surgery to ensure complete recovery. Mice were fed a standard chow diet (no. 5001, Purina Mills Ltd., with 59% calories provided by carbohydrate, 28% by protein, and 12% by fat). All mice received 2 i.p. injections of either control-ASO or IR-ASO at either 50 mg/kg (low dose) or 100 mg/kg (high dose) during the last week preceding the clamp study or the insulin signaling studies (Figure 1A). In an additional group of mice treated with the high-dose IR or control-ASO as above, liver was sampled on day 5 rather than on day 7. For insulin-signaling studies, mice were fasted overnight, tail blood was sampled for hormone analysis, and animals were injected i.p. with 100 mU insulin (human recombinant, Sigma-Aldrich) in 300 μl of 5% glucose (Sigma-Aldrich). After 15 minutes, animals were sacrificed, and livers and intracardiac blood were sampled.
Design of IR-ASO against IR- β mRNA.
Rapid throughput screens were performed in vitro to identify IR-selective ASO inhibitors for mice. The ASOs were synthesized on an Applied Biosystems 380B automated DNA synthesizer (PerkinElmer-Applied Biosystems) and purified as described (37). Mouse IR-ASO is a 20-base, 5-10-5 2′-O-methoxyethyl–group (MOE-group), chimeric ASO with the following sequence: TTCTTCTCGATGCGGACAGA. This chimeric design has been shown to provide increased nuclease resistance and mRNA affinity while maintaining the robust RNase H-terminating mechanism utilized by this class of ASOs (38). The control-ASO (ISIS 29848) has the same length and chemical makeup as the IR-ASO but is composed of all 419 ASO combinations possible when each base position is randomly synthesized with any of the 4 possible nucleotides (A, G, T, or C). Thus, it is not expected to hybridize to any mRNA sequence.
Primers and real-time PCR.
Liver G6Pase and PEPCK mRNAs were measured with quantitative PCR with the following mouse primers: for G6Pase: forward primer, 5′-TCCTGGGACAGACACACAAG-3′, reverse primer, 5′-CAACTTTAATATACGCTATTGG-3′; for PEPCK: forward primer, 5′-CTTCTCTGCCAAGGTCATCC-3′, reverse primer, 5′- TTTTGGGGATGGGCAC -3′). The mRNA levels for G6Pase and PEPCK were normalized to 18S expression: forward 5′-AGGGTTCGATTCCGGAGAGG-3′, reverse 5′-CAACTTTAATATACGCTATTGG -3′. Total RNA was isolated with Trizol (Invitrogen Corp.), and single-strand cDNA was synthesized with Superscript (Invitrogen Corp.). Real-time PCR reactions were prepared with a LightCycler reaction kit (2239264; Roche Diagnostics Corp.). A real-time PCR reaction of 20 μl contained the following: primers (200 nM), reaction buffer, MgCl2 (2.3 mM), SYBR green (2 μl), cDNA (2 μl), and Taq DNA polymerase. Routinely, the reactions were cycled approximately 40 times and were carried out in capillaries with a LightCycler instrument from Roche Diagnostics Corp.
Measurement of mouse leptin, glucagon, resistin, leptin, adiponectin, and insulin levels in plasma.
Plasma mouse adiponectin levels were measured by radioimmunoassay (Linco Research Inc.) whereas plasma resistin, insulin, glucagon, and leptin levels from fasted mice were measured via immunoassay using Lincoplex microspheres analyzed by a Luminex-100 (Linco Research Inc.).
Measurements of in vivo glucose kinetics and insulin clamp procedures.
Euglycemic clamps were performed in conscious, unrestrained, catheterized mice as previously described. Food was removed for 5 hours prior to beginning of in vivo studies. The infusion studies lasted a total of 90 minutes. At t = 0 minutes, mice began receiving a constant infusion of HPLC-purified [3H] glucose (0.1 μCi/min; New England Nuclear), and insulin (3.6 mU/min/kg BW). A solution of glucose (10% wt/vol) was infused at a variable rate as required to maintain euglycemia (8 mM). Thereafter, plasma samples were collected to determine glucose levels (at t = 10, 20, 30, 40, 50, 60, 70, 80, and 90 minutes) as well as [3H]glucose SA (at t = 40, 50, 60, 70, 80, and 90 minutes). Additionally, in 5 mice from each experimental group, 10 minutes before the end of the in vivo studies, [U-14C]-lactate (New England Nuclear; 5 μCi bolus, 0.4 μCi/min) was administered in order to determine the contribution of GNG to the hepatic glucose-6-phosphate pool. Consecutive samples were pooled together for assessment of the plasma insulin levels. Steady-state conditions for both plasma glucose concentration and SA were achieved by 40 minutes in these studies. At the end of the in vivo studies, mice were anesthetized (pentobarbital 60 mg/kg IV), the abdomens were quickly opened, and adipose tissue and liver were freeze-clamped in situ with aluminum tongs that had been cooled in liquid nitrogen. The time between the injection of anesthesia and the freeze clamping of tissue samples was less than 60 seconds. Tissue samples were stored at –80°C for further analysis.
Analytical procedures.
Plasma FFAs were measured by an enzymatic colorimetric method (Wako Chemicals USA Inc.). Plasma glucose was measured by the glucose oxidase method (Glucose Analyzer II; Beckman Coulter). Under steady-state conditions for plasma glucose concentration, the Rd equals the rate of glucose appearance (Ra). Ra was determined from the ratio of the infusion rate for [3H]glucose (dpm) and the SA of plasma [3H]glucose (dpm) under steady-state conditions. The rate of GP was therefore obtained from the difference between Ra and the rate of glucose infusion. The hepatic [14C]-PEP and [3H/14C]-UDP-glucose SAs were measured by HPLC, and the rates of PEP-GNG were calculated. The percentage of the hepatic glucose-6-phosphate pool directly derived from plasma glucose (direct pathway) was calculated as the ratio of liver [3H]UDP-glucoseto plasma [3H-3]glucose-specific activities. GNG was estimated from the specific activities of [14C]-labeled hepatic UDP-glucose (assumed to reflect the SA of hepatic glucose-6-phosphate) and hepatic PEP following the infusion of [U-14C]-lactate and [3-3H]-glucose using the following formula: GNG = TGO × [14C]-UDP-glucose [SA/14C]-PEP SA × 2 (39).
Western blot analyses.
Liver tissues were homogenized in 20 mM MOPS, 2 mM EGTA, 5 mM EDTA, 30 mM sodium fluoride, 40 mM β-glycerophosphate, 10 mM sodium pyrophosphate, 2 mM orthovanadate, 0.5% NP-40, and complete phosphatase inhibitor cocktail (Roche Diagnostics Corp.). Protein concentration was measured with a BCA protein quantification kit (Pierce). Extracts were fractionated on 10% Bis-Tris NuPAGE (Invitrogen Corp.) and were blotted as described (40). Primary antibodies against phosphorylated phospho–IR-β, phospho-Akt473, phospho-Akt308, Akt, phospho–glycogen synthase kinase 3 (phospho-GSK3), and GSK were from Cell Signaling Technology, and primary antibodies against IR and Stat 3, and goat anti-rabbit HRP-conjugated secondary antibodies (Santa Cruz Biotechnology Inc.) were used with ECL reagents (PerkinElmer). Membranes were stripped with the stripping agent Restore (Pierce) according to the protocol of the manufacturer and reprobed with the housekeeping genes actin (Abcam) and GAPDH (RDI) to ensure equal loading. Binding was imaged on Kodak MS films.
All values are presented as the mean ± SE. Comparisons among groups were made using analysis of variance and unpaired, nonparametric Student’s t test. Differences were considered statistically significant at P < 0.05. The study protocol was reviewed and approved by the Institutional Animal Care and Use Committee of the Albert Einstein College of Medicine.
Acknowledgments
This work was supported by grants from the NIH (DK45024 and DK48321 to L. Rossetti; DK066058 to S. Obici), the American Diabetes Association (to L. Rossetti and S. Obici), and the Core Laboratories of the Albert Einstein Diabetes Research and Training Center (P60-DK20541).
Footnotes
See the related Commentary beginning on page 1136.
Nonstandard abbreviations used: ASO, antisense oligodeoxynucleotide; DM2, type 2 diabetes mellitus; GNG, gluconeogenesis; GP, glucose production; G6Pase, glucose-6-phosphatase; GSK, glycogen synthase kinase; IR, insulin receptor; LIRKO, liver-specific IR knockout; PEP, phosphoenolpyruvate; PEPCK, PEP carboxykinase; Ra, rate of glucose appearance; Rd, rate of glucose disappearance; SA, specific activity; TGO, total glucose output; UDP-glucose, uridine-diphospho-glucose.Conflict of interest: The authors have declared that no conflict of interest exists.
References
- 1.Mittelman SD, Fu YY, Rebrin K, Steil G, Bergman RN. Indirect effect of insulin to suppress endogenous glucose production is dominant, even with hyperglucagonemia. J. Clin. Invest. 1997;100:3121–3130. doi: 10.1172/JCI119867. [DOI] [PMC free article] [PubMed] [Google Scholar]
- 2.Giacca A, et al. Importance of peripheral insulin levels for insulin-induced suppression of glucose production in depancreatized dogs. J. Clin. Invest. 1992;90:1769–1777. doi: 10.1172/JCI116051. [DOI] [PMC free article] [PubMed] [Google Scholar]
- 3.Lewis GF, Zinman B, Groenewoud Y, Vranic M, Giacca A. Hepatic glucose production is regulated both by direct hepatic and extrahepatic effects of insulin in humans. Diabetes. 1996;45:454–462. doi: 10.2337/diab.45.4.454. [DOI] [PubMed] [Google Scholar]
- 4.Lewis GF, Carpentier A, Vranic M, Giacca A. Resistance to insulin’s acute direct hepatic effect in suppressing steady-state glucose production in individuals with type 2 diabetes. Diabetes. 1999;48:570–576. doi: 10.2337/diabetes.48.3.570. [DOI] [PubMed] [Google Scholar]
- 5.Ferrannini E, et al. Insulin: new roles for an ancient hormone. Eur. J. Clin. Invest. 1999;29:842–852. doi: 10.1046/j.1365-2362.1999.00536.x. [DOI] [PubMed] [Google Scholar]
- 6.Gastaldelli A, et al. Effect of physiological hyperinsulinemia on gluconeogenesis in nondiabetic subjects and in type 2 diabetic patients. Diabetes. 2001;50:1807–1812. doi: 10.2337/diabetes.50.8.1807. [DOI] [PubMed] [Google Scholar]
- 7.Boden G, Chen X, Ruiz J, White JV, Rossetti L. Mechanisms of fatty acid-induced inhibition of glucose uptake. J. Clin. Invest. 1994;93:2438–2446. doi: 10.1172/JCI117252. [DOI] [PMC free article] [PubMed] [Google Scholar]
- 8.Duong DT, Waltner-Law ME, Sears R, Sealy L, Granner DK. Insulin inhibits hepatocellular glucose production by utilizing liver-enriched transcriptional inhibitory protein to disrupt the association of CREB-binding protein and RNA polymerase II with the phosphoenolpyruvate carboxykinase gene promoter. J. Biol. Chem. 2002;277:32234–32242. doi: 10.1074/jbc.M204873200. [DOI] [PubMed] [Google Scholar]
- 9.Hall RK, et al. Regulation of phosphoenolpyruvate carboxykinase and insulin-like growth factor-binding protein-1 gene expression by insulin. The role of winged helix/forkhead proteins. J. Biol. Chem. 2000;275:30169–30175. doi: 10.1074/jbc.M004898200. [DOI] [PubMed] [Google Scholar]
- 10.O’Brien RM, Granner DK. Regulation of gene expression by insulin. Physiol. Rev. 1996;76:1109–1161. doi: 10.1152/physrev.1996.76.4.1109. [DOI] [PubMed] [Google Scholar]
- 11.Sindelar DK, Chu CA, Neal DW, Cherrington AD. Interaction of equal increments in arterial and portal vein insulin on hepatic glucose production in the dog. Am. J. Physiol. 1997;273:E972–E980. doi: 10.1152/ajpendo.1997.273.5.E972. [DOI] [PubMed] [Google Scholar]
- 12.Sindelar DK, et al. Basal hepatic glucose production is regulated by the portal vein insulin concentration. Diabetes. 1998;47:523–529. doi: 10.2337/diabetes.47.4.523. [DOI] [PubMed] [Google Scholar]
- 13.Lewis GF, Vranic M, Giacca A. Role of free fatty acids and glucagon in the peripheral effect of insulin on glucose production in humans. Am. J. Physiol. 1998;275:E177–E186. doi: 10.1152/ajpendo.1998.275.1.E177. [DOI] [PubMed] [Google Scholar]
- 14.Obici S, Zhang BB, Karkanias G, Rossetti L. Hypothalamic insulin signaling is required for inhibition of glucose production. Nat. Med. 2002;8:1376–1382. doi: 10.1038/nm1202-798. [DOI] [PubMed] [Google Scholar]
- 15.Michael MD, et al. Loss of insulin signaling in hepatocytes leads to severe insulin resistance and progressive hepatic dysfunction. Mol. Cell. 2000;6:87–97. [PubMed] [Google Scholar]
- 16.Fisher SJ, Kahn CR. Insulin signaling is required for insulin’s direct and indirect action on hepatic glucose production. J. Clin. Invest. 2003;111:463–468. doi:10.1172/JCI200316426. doi: 10.1172/JCI16426. [DOI] [PMC free article] [PubMed] [Google Scholar]
- 17.Rebrin K, Steil GM, Mittelman SD, Bergman RN. Causal linkage between insulin suppression of lipolysis and suppression of liver glucose output in dogs. J. Clin. Invest. 1996;98:741–749. doi: 10.1172/JCI118846. [DOI] [PMC free article] [PubMed] [Google Scholar]
- 18.Rebrin K, Steil GM, Getty L, Bergman RN. Free fatty acid as a link in the regulation of hepatic glucose output by peripheral insulin. Diabetes. 1995;44:1038–1045. doi: 10.2337/diab.44.9.1038. [DOI] [PubMed] [Google Scholar]
- 19.Caro JF, et al. Studies on the mechanism of insulin resistance in the liver from humans with noninsulin-dependent diabetes. Insulin action and binding in isolated hepatocytes, insulin receptor structure, and kinase activity. J. Clin. Invest. 1986;78:249–258. doi: 10.1172/JCI112558. [DOI] [PMC free article] [PubMed] [Google Scholar]
- 20.Butler M, et al. Specific inhibition of PTEN expression reverses hyperglycemia in diabetic mice. Diabetes. 2002;51:1028–1034. doi: 10.2337/diabetes.51.4.1028. [DOI] [PubMed] [Google Scholar]
- 21.Muse ED, et al. Role of resistin in diet-induced hepatic insulin resistance. J. Clin. Invest. 2004;114:232–239. doi:10.1172/JCI200421270. doi: 10.1172/JCI21270. [DOI] [PMC free article] [PubMed] [Google Scholar]
- 22.Massillon D, et al. Quantitation of hepatic glucose fluxes and pathways of hepatic glycogen synthesis in conscious mice. Am. J. Physiol. 1995;269:E1037–E1043. doi: 10.1152/ajpendo.1995.269.6.E1037. [DOI] [PubMed] [Google Scholar]
- 23.Inoue H, et al. Role of STAT-3 in regulation of hepatic gluconeogenic genes and carbohydrate metabolism in vivo. Nat. Med. 2004;10:168–174. doi: 10.1038/nm980. [DOI] [PubMed] [Google Scholar]
- 24.Mevorach M, et al. Regulation of endogenous glucose production by glucose per se is impaired in type 2 diabetes mellitus. J. Clin. Invest. 1998;102:744–753. doi: 10.1172/JCI2720. [DOI] [PMC free article] [PubMed] [Google Scholar]
- 25.Consoli A, Nurjhan N, Capani F, Gerich J. Predominant role of gluconeogenesis in increased hepatic glucose production in NIDDM. Diabetes. 1989;38:550–557. doi: 10.2337/diab.38.5.550. [DOI] [PubMed] [Google Scholar]
- 26.Magnusson I, Rothman DL, Katz LD, Shulman RG, Shulman GI. Increased rate of gluconeogenesis in type II diabetes mellitus. A 13C nuclear magnetic resonance study. J. Clin. Invest. 1992;90:1323–1327. doi: 10.1172/JCI115997. [DOI] [PMC free article] [PubMed] [Google Scholar]
- 27.Magnusson I, Rothman DL, Gerard DP, Katz LD, Shulman GI. Contribution of hepatic glycogenolysis to glucose production in humans in response to a physiological increase in plasma glucagon concentration. Diabetes. 1995;44:185–189. doi: 10.2337/diab.44.2.185. [DOI] [PubMed] [Google Scholar]
- 28.Rothman DL, Magnusson I, Katz LD, Shulman RG, Shulman GI. Quantitation of hepatic glycogenolysis and gluconeogenesis in fasting humans with 13C NMR. Science. 1991;254:573–576. doi: 10.1126/science.1948033. [DOI] [PubMed] [Google Scholar]
- 29.Kitamura T, Kahn CR, Accili D. Insulin receptor knockout mice. Annu. Rev. Physiol. 2003;65:313–332. doi: 10.1146/annurev.physiol.65.092101.142540. [DOI] [PubMed] [Google Scholar]
- 30.Nandi A, Kitamura Y, Kahn CR, Accili D. Mouse models of insulin resistance. Physiol. Rev. 2004;84:623–647. doi: 10.1152/physrev.00032.2003. [DOI] [PubMed] [Google Scholar]
- 31.An J, et al. Hepatic expression of malonyl-CoA decarboxylase reverses muscle, liver and whole-animal insulin resistance. Nat. Med. 2004;10:268–274. doi: 10.1038/nm995. [DOI] [PubMed] [Google Scholar]
- 32.Gliemann J, Gammeltoft S, Vinten J. Time course of insulin-receptor binding and insulin-induced lipogenesis in isolated rat fat cells. J. Biol. Chem. 1975;250:3368–3374. [PubMed] [Google Scholar]
- 33.Kahn CR. Insulin resistance, insulin insensitivity, and insulin unresponsiveness: a necessary distinction. Metabolism. 1978;27:1893–1902. doi: 10.1016/s0026-0495(78)80007-9. [DOI] [PubMed] [Google Scholar]
- 34.Frank HJ, Davidson MB, Serbin PA. Insulin binding and action in isolated rat hepatocytes: evidence for spare receptors. Metabolism. 1981;30:1159–1164. doi: 10.1016/0026-0495(81)90035-4. [DOI] [PubMed] [Google Scholar]
- 35.Cherrington AD. Banting Lecture 1997. Control of glucose uptake and release by the liver in vivo. Diabetes. 1999;48:1198–1214. doi: 10.2337/diabetes.48.5.1198. [DOI] [PubMed] [Google Scholar]
- 36.Rossetti L, et al. Peripheral but not hepatic insulin resistance in mice with one disrupted allele of the glucose transporter type 4 (GLUT4) gene. J. Clin. Invest. 1997;100:1831–1839. doi: 10.1172/JCI119711. [DOI] [PMC free article] [PubMed] [Google Scholar]
- 37.Baker BF, et al. Discovery and analysis of antisense oligonucleotide activity in cell culture. Methods. 2001;23:191–198. doi: 10.1006/meth.2000.1120. [DOI] [PubMed] [Google Scholar]
- 38.McKay RA, et al. Characterization of a potent and specific class of antisense oligonucleotide inhibitor of human protein kinase C-alpha expression. J. Biol. Chem. 1999;274:1715–1722. doi: 10.1074/jbc.274.3.1715. [DOI] [PubMed] [Google Scholar]
- 39.Rossetti L, et al. Mechanism by which hyperglycemia inhibits hepatic glucose production in conscious rats. Implications for the pathophysiology of fasting hyperglycemia in diabetes. J. Clin. Invest. 1993;92:1126–1134. doi: 10.1172/JCI116681. [DOI] [PMC free article] [PubMed] [Google Scholar]
- 40.Buettner C, Harney JW, Larsen PR. The role of selenocysteine 133 in catalysis by the human type 2 iodothyronine deiodinase. Endocrinology. 2000;141:4606–4612. doi: 10.1210/endo.141.12.7831. [DOI] [PubMed] [Google Scholar]


