

Abstract
Purpose
Neoadjuvant chemotherapy (NAC) for triple-negative breast cancer (TNBC) allows for assessment of tumor pathological response and has survival implications. In 2017, the CREATE-X trial demonstrated survival benefit with adjuvant capecitabine in patients TNBC and residual disease after NAC. We aimed to assess national rates of NAC for cT1–2N0M0 TNBC before and after CREATE-X and examine factors associated with receiving NAC vs adjuvant chemotherapy (AC).
Methods
A retrospective cohort study of women with cT1–2N0M0 TNBC diagnosed from 2014 to 2019 in the National Cancer Database (NCDB) was performed. Variables were analyzed via ANOVA, Chi-squared, Fisher Exact tests, and a multivariate linear regression model was created.
Results
55,633 women were included: 26.9% received NAC, 52.4% AC, and 20.7% received no chemotherapy (median ages 53, 59, and 71 years, p < 0.01). NAC utilization significantly increased over time: 19.5% in 2014–15 (n = 3,465 of 17,777), 27.1% in 2016–17 (n = 5,140 of 18,985), and 33.6% in 2018–19 (n = 6,337 of 18,871, p < 0.001). On multivariate analysis, increased NAC was associated with younger age (< 50), non-Hispanic white race/ethnicity, lack of comorbidities, cT2 tumors, care at an academic or integrated-network cancer program, and diagnosis post-2017 (p < 0.05 for all). Patients with government-provided insurance were less likely to receive NAC (p < 0.01). Women who traveled > 60 miles for treatment were more likely to receive NAC (p < 0.01).
Conclusion
From 2014 to 2019, NAC utilization increased for patients with cT1–2N0M0 TNBC. Racial, socioeconomic, and access disparities were observed in who received NAC vs AC and warrants interventions to ensure equitable care.
Keywords: Triple-negative breast cancer, Neoadjuvant chemotherapy, Cancer disparities, Disparities, Healthcare access, Breast cancer, Early-stage breast cancer, CREATEX
Background
Over the past several years, strides in systemic therapy options for triple-negative breast cancer (TNBC) have been made through advancements in chemotherapeutic agents and novel immunotherapies [1–4]. TNBC constitutes approximately 10–20% of annually diagnosed breast cancers and is associated with higher rates of recurrence, decreased overall survival (OS), and disease-specific survival (DSS) compared to other breast cancer subtypes [5–7]. Coupling the heterogeneity of TNBC and lack of available targets for treatment, it is evident that the use of focused and effective therapies is imperative in the clinical treatment of this disease. Additionally, inferior outcomes for TNBC are seen in Non-Hispanic Black women, thought to be due to genomic, socioeconomic, and access differences leading to disparities in oncologic outcomes [8].
The Adjuvant Capecitabine for Breast Cancer after Preoperative Chemotherapy (CREATE-X) trial randomly assigned 910 patients (887 included in final analysis) with operable HER2-negative breast cancer to receive neoadjuvant chemotherapy (NAC) followed by adjuvant capecitabine vs no further adjuvant chemotherapy (AC) in patients with residual disease on surgical pathology after NAC [1]. Findings demonstrated an increase in disease-free survival (DFS) and OS with adjuvant capecitabine most pronounced in those with residual TNBC, thus further supporting the use of NAC for patients with TNBC to assess pathological response and guide adjuvant systemic therapy [1]. While prespecified subgroup analysis demonstrated a statistically significant improvement in disease-free survival (DFS) in patients with cT2–4 tumors and in those with 1–3 positive nodes, a statistically significant benefit was not observed for patients with cT1 tumors or those with node-negative disease [1]. These findings were first presented in December 2015 at the San Antonio Breast Cancer Symposium [9] and were subsequently published in June 2017 in the New England Journal of Medicine [1]. This trial prompted rapid changes in the national comprehensive network clinical (NCCN) guidelines in August 2017 [10], changing the treatment paradigm for patients with TNBC by encouraging the use of NAC to evaluate the tumor’s in vivo response to systemic therapy and to evaluate the role of adjuvant capecitabine for those patients with residual disease [11–15].
Prior to CREATE-X, the role of NAC for operable breast cancer was primarily used to downstage the primary breast tumor and in the clinically node-positive axilla to improve candidacy for breast conserving surgery and de-escalation of axillary surgery in those with a pathological complete response, respectively [16–19]. Thus, most patients diagnosed with early-stage node-negative TNBC underwent upfront surgery, followed by AC. However, since the results of CREATE-X, much discourse has occurred regarding the role for NAC in early-stage node-negative TNBC patients to evaluate tumor pathological response to therapy and thus, patient candidacy for adjuvant capecitabine in those with residual disease [20–22].
It is currently unknown how the CREATE-X study has impacted the utilization of NAC in early-stage node-negative TNBC within the United States. Using data from the National Cancer Database, this study aimed to assess national contemporary trends in NAC utilization for patients with cT1–T2 node-negative (N0) non-metastatic (M0) TNBC in the years surrounding the CREATE-X study results. Secondary aims included examining demographic and clinicopathologic factors associated with the use of NAC vs AC and how these factors may have changed over the study period.
Methods
A retrospective cohort study was performed through the American College of Surgeons’ National Cancer Database (NCDB) utilizing the 2019 Participant User File to identify women with early-stage node-negative TNBC. The NCDB is a clinical oncology database that collects information from over 1,500 Commission on Cancer-accredited facilities nationally, reporting data on cancer treatment, staging, and patient demographics [23, 24]. All data from the NCDB is compliant with the Health Insurance Portability and Accountability Act. This study protocol was approved by our Institutional Review Board and the NCDB.
This study included women ≥ 18 years of age who were diagnosed with clinical T1–2 N0 M0 TNBC with ductal and/or lobular histology between 2014 and 2019. Earlier years of diagnosis were not included to minimize confounding changes in treatment standards outside of those prompted by the CREATE-X study. (Fig. 1) The years 2014–2015 were classified as the pre-CREATE-X period, 2016–2017 were categorized as transition years to provide an effective washout period between treatment paradigms, and 2018–2019 as the post-CREATE-X period. To ensure generalizability, less common breast cancer histologies, such as apocrine and metaplastic TNBC, were excluded from analysis due to the potential for the aggressive nature of these pathologic entities to influence chemotherapy management [25–27]. Patients were excluded from the study if they did not undergo surgery or if their disease was coded as estrogen and/or progesterone receptor positive and/or human epidermal growth factor receptor 2 positive/amplified. Those with missing data on tumor biomarkers, clinical stage, and missing treatment data were excluded. Patients also needed to have received most of their treatment at the reporting facility and had no other documented malignancies at the time of diagnosis.
Fig. 1.
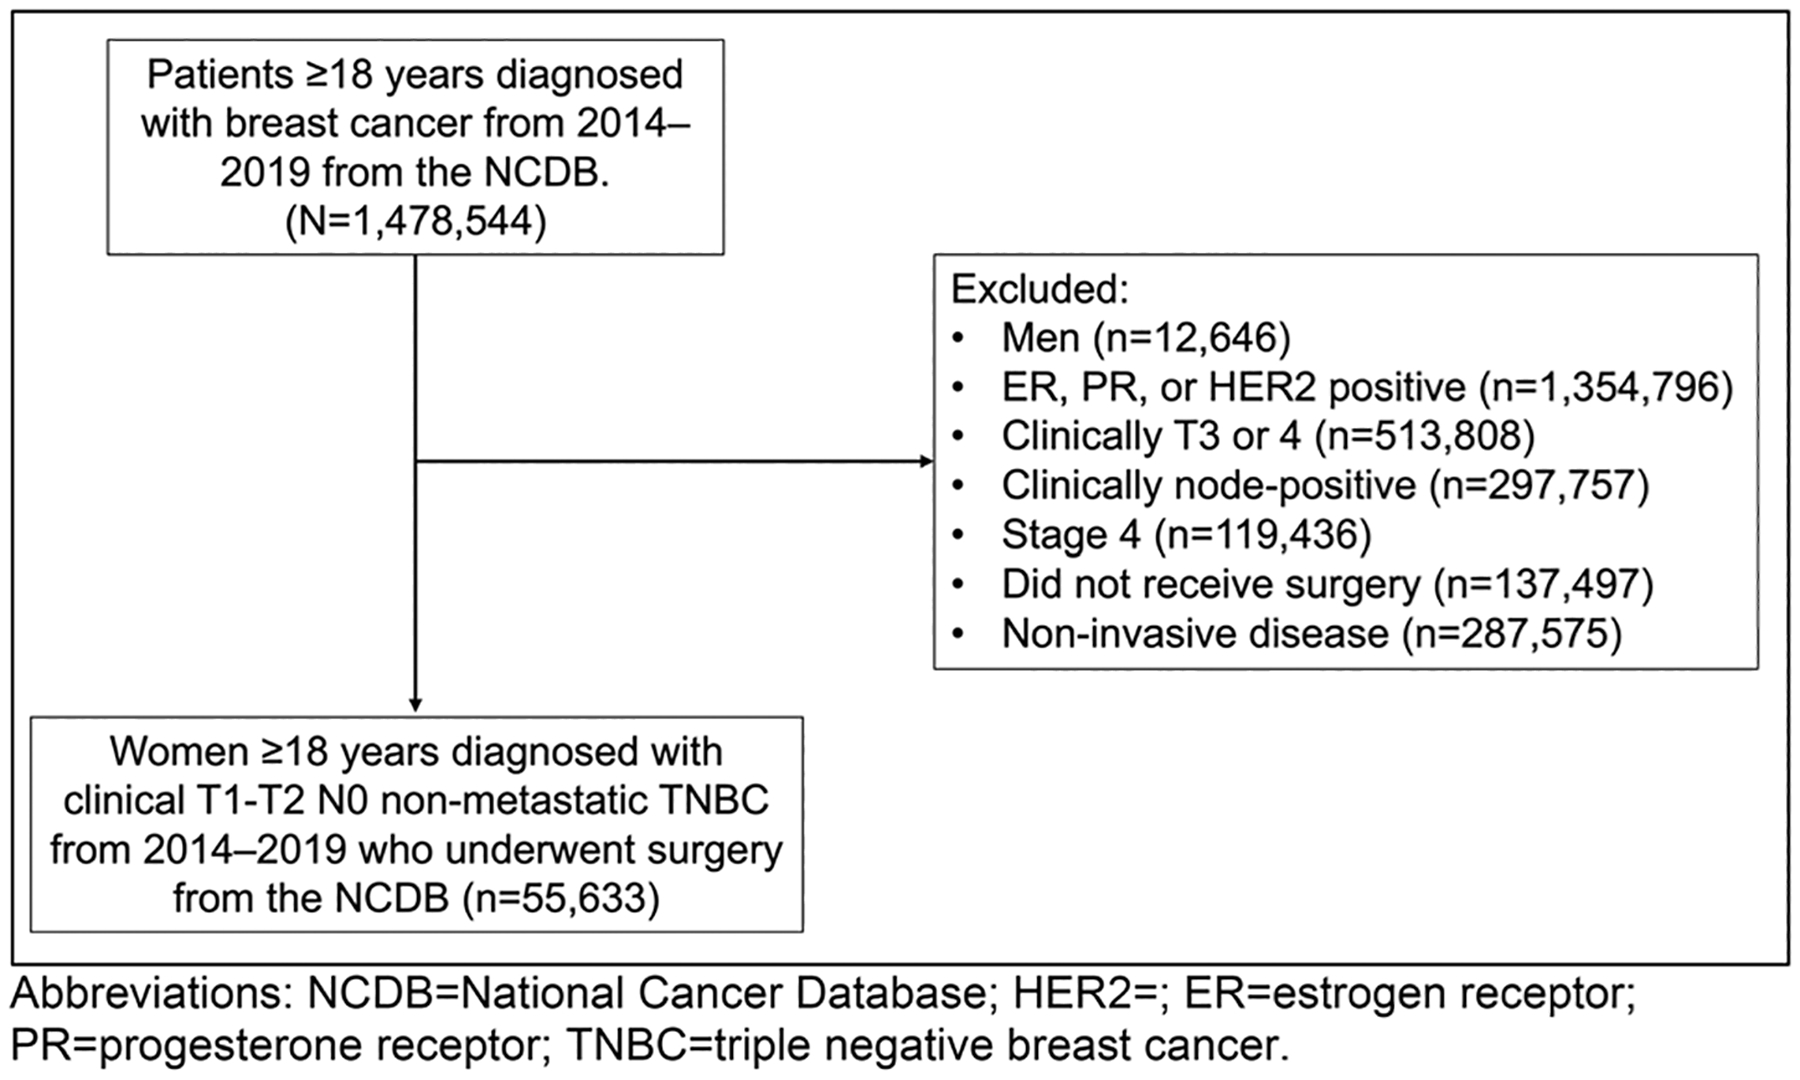
Consort diagram for cohort inclusion and exclusion data
Demographic, clinicopathologic, and treatment data were then collected and recorded with the charlsondeyo comorbidity index (CCI) used to assess patient comorbidities [28]. Patients were then separated into two cohorts for comparative analysis: a NAC cohort, defined as chemotherapy occurring before surgical intervention, and an AC cohort, defined as persons who received chemotherapy after upfront surgery. Clinical and demographic factors associated with receipt of NAC, AC, or no chemotherapy were assessed using ANOVA, Kruskal–Wallis, Chi-square, and Fisher’s Exact tests. A multivariable logistic regression analysis was used to assess NAC utilization trends over the study period, and to determine variables predictive of the receipt of NAC vs AC. All statistical analyses were performed using R version 4.1.3.
Results
Entire cohort
Between 2014 and 2019, 55,633 women were diagnosed with cT1–2 N0 M0 TNBC in the NCDB and met study inclusion criteria. Within the study cohort, 29,150 (52.4%) received AC, 14,942 (26.9%) received NAC, and 11,532 (20.7%) did not receive any documented systemic chemotherapy (Table 1). The median age was 59 years (inner quartile range [IQR]: 50, 69) and most patients were Non-Hispanic White (67.2%) with private insurance (53.6%) and treated at either a comprehensive community cancer program (37.2%) or at an academic/research center (28.7%). Nearly all patients had unilateral (> 99.9%) invasive ductal carcinoma (99.1%) and most had no comorbidities (82%), defined as CCI of 0. Patients who did not receive systemic chemotherapy were more frequently older (median age 71 years (IQR: 61, 80), with cT1 tumors (71%), had Medicare insurance (61.7%), and had more comorbidities than those patients who received systemic chemotherapy (CCI of 0 constituted 81.8%, 86.5%, and 76% of patients treated with AC, NAC, and no chemotherapy, respectively).
Table 1.
Cohort demographics and clinicopathological characteristics of surgically managed cT1–2/N0 TNBC in the NCDB from the years 2014–19, stratified by receipt and timing of chemotherapy
| Variable | Overall N = 55,633 | Receipt and Timing of Chemotherapy | p-value | ||
|---|---|---|---|---|---|
| AC n = 29,150 | NAC n = 14,942 | No Chemotherapy n = 11,532 | |||
| Median (IQR) | Median (IQR) | Median (IQR) | Median (IQR) | ||
| Age (years) | 59 (50, 69) | 59 (50, 67) | 53 (44, 62) | 71 (61, 80) | |
| n (%) | n (%) | n (%) | n (%) | ||
| Race and Ethnicity | < 0.001 | ||||
| Hispanic | 3,715 (6.7) | 1,807 (6.2) | 1,255 (8.4) | 649 (5.6) | |
| NH Black | 11,003 (19.8) | 6,153 (21.1) | 2,812 (18.8) | 2,036 (17.7) | |
| NH White | 37,372 (67.2) | 19,413 (66.6) | 9,872 (66.1) | 8,084 (70.1) | |
| Other | 3,543 (6.4) | 1,777 (6.1) | 1,003 (6.7) | 763 (6.6) | |
| Charlson-Deyo Comorbidity Index | < 0.001 | ||||
| 0 | 45,610 (82.0) | 23,842 (81.8) | 12,932 (86.5) | 8827 (76.5) | |
| 1 | 7256 (13.0) | 3961 (13.6) | 1552 (10.4) | 1743 (15.1) | |
| 2 | 1752 (3.1) | 889 (3.0) | 303 (2.0) | 560 (4.9) | |
| ≥ 3 | 1015 (1.8) | 458 (1.6) | 155 (1.0) | 402 (3.5) | |
| Primary Payor | < 0.001 | ||||
| Private | 29,835 (53.6) | 16,525 (36.7) | 9,852 (65.9) | 3,452 (29.9) | |
| Medicaid | 4,270 (7.7) | 2,250 (7.7) | 1,425 (9.5) | 593 (5.1) | |
| Medicare | 19,258 (34.6) | 9,270 (31.8) | 2,870 (19.2) | 7,117 (61.7) | |
| Other government | 710 (1.3) | 375 (1.3) | 241 (1.6) | 94 (0.8) | |
| Not insured | 943 (1.7) | 447 (1.5) | 370 (2.5) | 126 (1.1) | |
| Unknown | 617 (1.1) | 283 (1.0) | 184 (1.2) | 150 (1.3) | |
| Year of Diagnosis | < 0.001 | ||||
| 2014–2015 | 17,777 (32.0) | 10,549 (59.3) | 3,465 (19.5) | 3,756 (21.1) | |
| 2016–2017 | 18,985 (34.1) | 9,861 (51.9) | 5,140 (27.1) | 3,984 (21.0) | |
| 2018–2019 | 18,871 (33.9) | 8,740 (46.3) | 6,337 (33.6) | 3,792 (20.1) | |
| Tumor Grade | < 0.001 | ||||
| I | 1,196 (2.1) | 452 (1.6) | 123 (0.8) | 621 (5.4) | |
| II | 10,317 (18.5) | 5,014 (17.2) | 2,221 (14.9) | 3,080 (26.7) | |
| III | 40,721 (73.2) | 22,158 (76.0) | 11,710 (78.4) | 6,848 (59.4) | |
| Unknown | 3,399 (6.1) | 1,526 (5.2) | 888 (5.9) | 983 (8.5) | |
| Clinical T Stage | < 0.001 | ||||
| T1 | 32,302 (58.1) | 19,870 (68.2) | 4,246 (28.4) | 8,182 (71.0) | |
| T1x | 4,017 (7.2) | 2,455 (8.4) | 300 (2.0) | 1,262 (10.9) | |
| T1a | 2,167 (3.9) | 886 (3.0) | 125 (0.8) | 1,156 (10.0) | |
| T1b | 7,928 (14.3) | 5,016 (17.2) | 452 (3.0) | 2,459 (21.3) | |
| T1c | 18,190 (32.7) | 11,513 (39.5) | 3,369 (22.5) | 3,305 (28.7) | |
| T2 | 23,331 (41.9) | 9,280 (31.8) | 10,696 (71.6) | 3,350 (29.0) | |
| Procedure Type | < 0.001 | ||||
| Lumpectomy | 36,123 (64.9) | 19,552 (67.1) | 8,368 (56.0) | 8,197 (71.1) | |
| Mastectomy | 19,510 (35.1) | 9,598 (32.9) | 6,574 (44.0) | 3,335 (28.9) | |
| Regional Nodes Positive | < 0.001 | ||||
| 0 | 47,831 (86.0) | 24,728 (84.8) | 13,497 (90.3) | 9,600 (83.2) | |
| 1–3 | 5,185 (9.3) | 3,632 (12.5) | 849 (5.7) | 704 (6.1) | |
| ≥ 4 | 693 (1.2) | 466 (1.6) | 121 (0.8) | 106 (0.9) | |
| Unknown | 1,924 (3.5) | 324 (1.1) | 475 (3.2) | 1,122 (9.7) | |
| AJCC Pathologic T | < 0.001 | ||||
| T0 | 6,340 (11.4) | 901 (3.1) | 5,324 (35.6) | 115 (1.0) | |
| Tis | 739 (1.3) | 85 (0.3) | 617 (4.1) | 37 (0.3) | |
| T1 | 31,832 (57.2) | 18,084 (62.0) | 6,010 (40.2) | 7,735 (67.1) | |
| T1x | 321 (0.6) | 137 (0.5) | 105 (0.7) | 79 (0.7) | |
| T1mic | 661 (1.2) | 76 (0.3) | 373 (2.5) | 212 (1.8) | |
| T1a | 4,178 (7.5) | 773 (2.7) | 1,672 (11.2) | 1,733 (15.0) | |
| T1b | 8,456 (15.2) | 4,669 (16.0) | 1,529 (10.2) | 2,257 (19.6) | |
| T1c | 18,216 (32.7) | 12,429 (42.6) | 2,331 (15.6) | 3,454 (30.0) | |
| T2 | 14,445 (26.0) | 9,360 (32.1) | 1,813 (12.1) | 3,270 (28.4) | |
| T3 | 841 (1.5) | 454 (1.6) | 176 (1.2) | 211 (1.8) | |
| T4 | 94 (0.2) | 44 (0.2) | 24 0.2) | 26 (0.2) | |
| Unknown | 1,342 (2.4) | 222 (0.8) | 978 (6.5) | 138 (1.2) | |
| AJCC Pathologic N | < 0.001 | ||||
| N0 | 37,983 (68.3) | 19,125 (65.6) | 11,141 (74.6) | 7,712 (66.9) | |
| N0(i +) | 835 (1.5) | 510 (1.7) | 136 (0.9) | 189 (1.6) | |
| N1(mic) | 1,334 (2.4) | 907 (3.1) | 251 (1.7) | 176 (1.5) | |
| N1 | 12,804 (23.0) | 7,710 (26.4) | 2,630 (17.6) | 2,464 (21.4) | |
| N2 | 513 (0.9) | 348 (1.2) | 88 (0.6) | 77 (0.7) | |
| N3 | 162 (0.3) | 115 (0.4) | 19 (0.1) | 28 (0.2) | |
| Unknown | 2,002 (3.6) | 435 (1.5) | 677 (4.5) | 886 (7.7) | |
| Endocrine Therapy | < 0.001 | ||||
| Yes | 1,550 (2.8) | 744 (2.6) | 460 (3.1) | 346 (3.0) | |
| No | 53,647 (96.4) | 28,198 (96.7) | 14,380 (96.2) | 11,060 (95.9) | |
| Unknown | 436 (0.8) | 208 (0.7) | 102 (0.7) | 126 (1.1) | |
| Radiation Therapy | < 0.001 | ||||
| Yes | 34,202 (61.5) | 19,441 (66.7) | 8,768 (58.7) | 5,986 (51.9) | |
| No | 20,200 (36.3) | 9,116 (31.3) | 5,895 (39.5) | 5,187 (45.0) | |
| Unknown | 1,231 (2.2) | 593 (2.0) | 279 (1.9) | 359 (3.1) | |
| Treatment Facility | < 0.001 | ||||
| Community cancer program | 3,785 (6.8) | 2,061 (7.1) | 723 (4.8) | 999 (8.7) | |
| Comprehensive community cancer program | 20,706 (37.2) | 11,357 (39.0) | 4,539 (30.4) | 4,806 (41.7) | |
| Academic/research program | 15,978 (28.7) | 8,379 (28.7) | 4,415 (29.5) | 3,183 (27.6) | |
| Integrated network cancer program | 10,574 (19.0) | 5,293 (18.2) | 2,992 (20.0) | 2,289 (19.8) | |
| Missing | 4,590 (8.3) | 2,060 (7.1) | 2,273 (15.2) | 255 (2.2) | |
| Distance to Treatment Facility (miles) | < 0.001 | ||||
| ≤ 20 | 36,405 (65.4) | 19,185 (65.8) | 9,407 (63.0) | 7,806 (67.7) | |
| 21–40 | 6,617 (11.9) | 3,588 (12.3) | 1,791 (12.0) | 1,238 (10.7) | |
| 41–60 | 2,169 (3.9) | 1,128 (3.9) | 629 (4.2) | 411 (3.6) | |
| > 60 | 2,812 (5.1) | 1,347 (4.6) | 961 (6.4) | 504 (4.4) | |
| Missing | 7,630 (13.7) | 3,902 (13.4) | 2,154 (14.4) | 1,573 (13.6) | |
Key: IQR interquartile range, AC adjuvant chemotherapy, NAC neoadjuvant chemotherapy, NH non-Hispanic, T1x all T1 sub-categories that did not include an a,b,c subset code, Tis carcinoma in situ, T1mic T1 stage tumor with microinvasion, N0(i +) N0 stage nodes with isolated tumor cells, N1(mic) N1 stage nodes with microinvasion
NAC vs AC Cohorts
Examining patients with cT1–2 N0 M0 TNBC who received any form of chemotherapy, NAC utilization significantly increased over the study period from 19.5% in 2014–15 (n = 3465 of 17,777), to 27.1% in 2016–17 (n = 5140 of 18,985), and then 33.6% in 2018–19 (n = 6337 of 18,871) (p < 0.001) (Fig. 2). During this time frame, patients with cT1c and cT2 tumors represented the majority of those receiving NAC (Fig. 3 and Table 2). Conversely, as NAC utilization increased, the rate of AC utilization significantly decreased over the same period: 59.3% in 2014–15 (n = 10,549 of 17,777), 51.9% in 2016–17 (n = 9861 of 18,985), and 46.3% in 2018–19 (n = 8740 of 18,871) (p < 0.001) (Table 3).
Fig. 2.
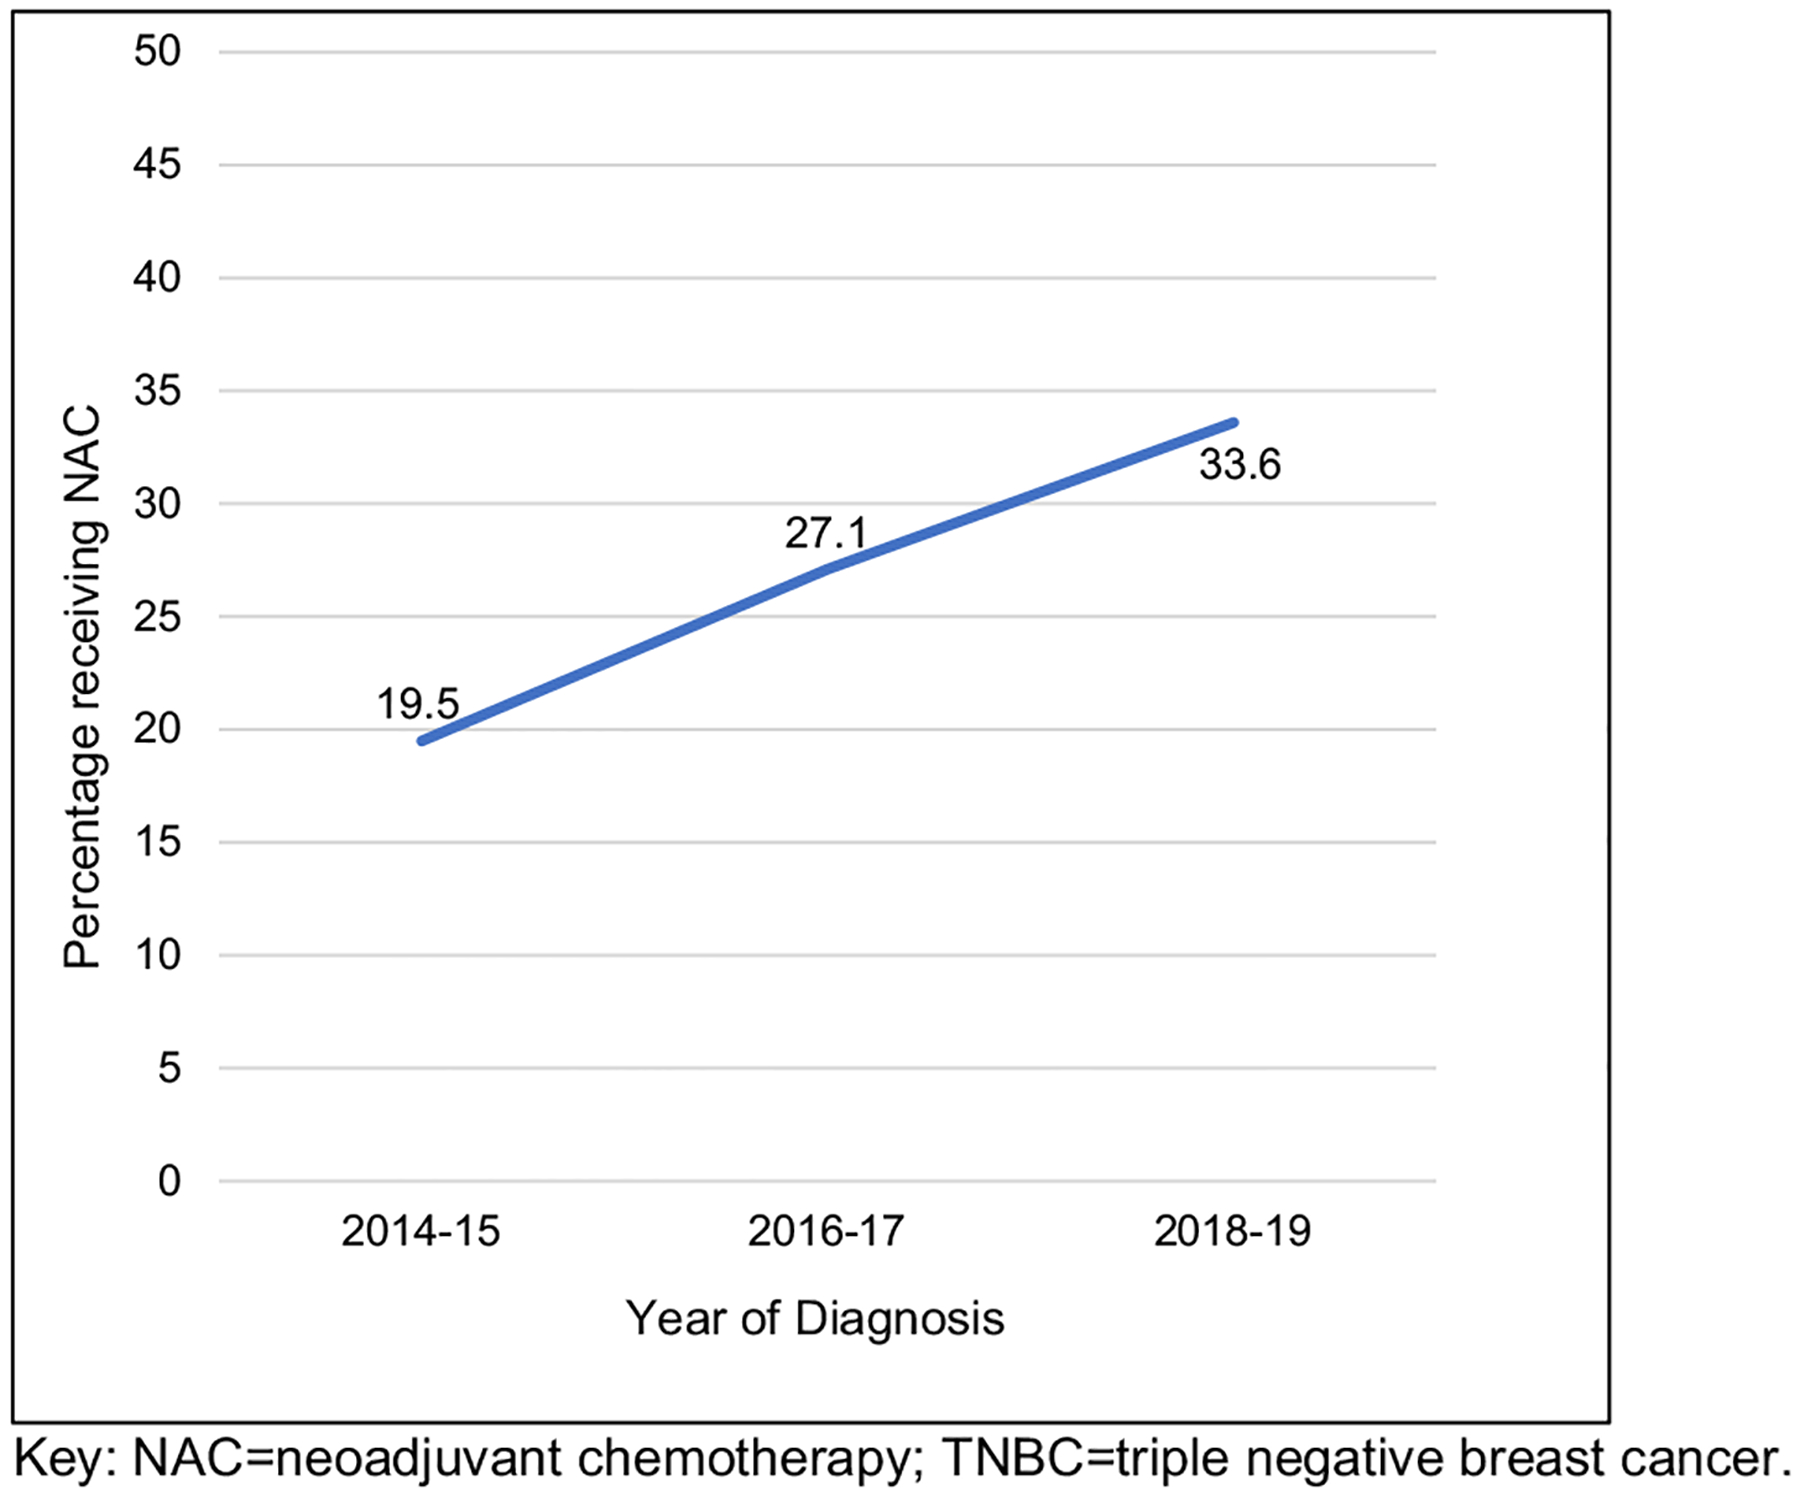
Rates of women receiving neoadjuvant chemotherapy in surgically managed cT1-2N0M0 TNBC, by year of clinical diagnosis from the NCDB
Fig. 3.
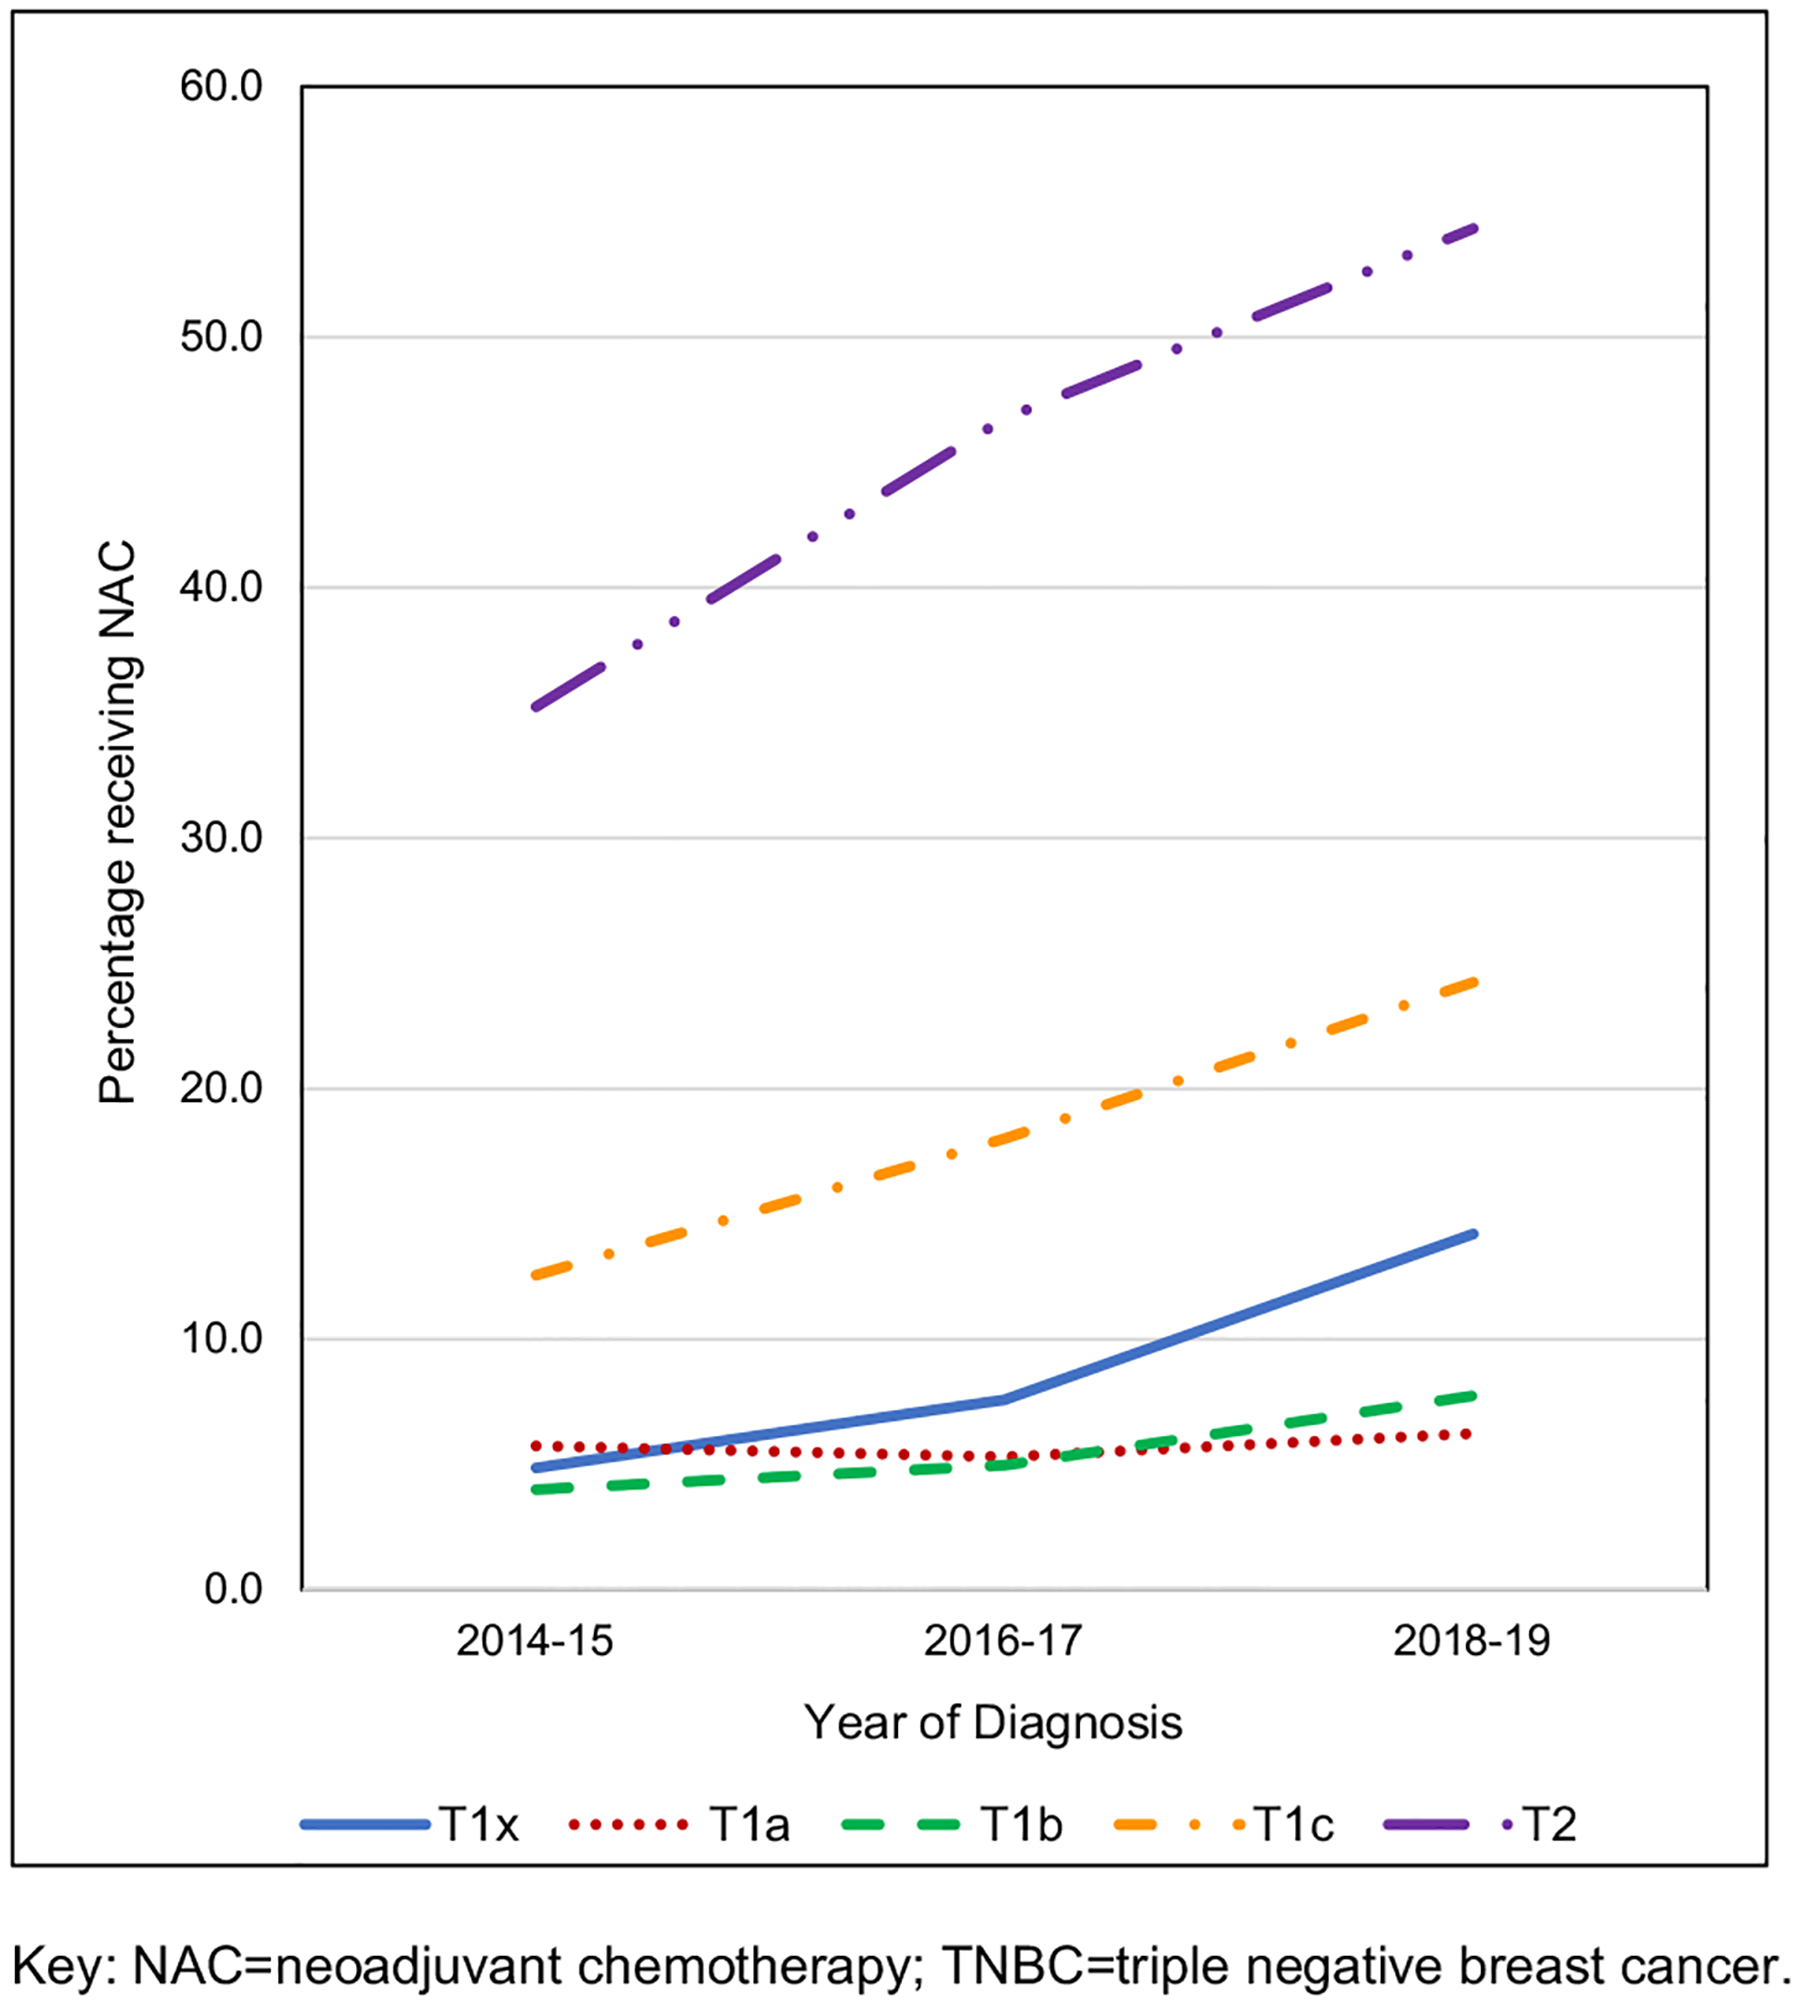
Rates of women receiving neoadjuvant chemotherapy in surgically managed cT1–2N0M0 TNBC, by year of clinical diagnosis and specific clinical T stage from the NCDB. Key: NAC neoadjuvant chemotherapy, TNBC triple-negative breast cancer
Table 2.
Percentage rates of women receiving neoadjuvant chemotherapy in surgically managed cT1-2N0M0 TNBC, by year of clinical diagnosis and specific cT stage from the NCDB
| Clinical T stage | Year of diagnosis | |||
|---|---|---|---|---|
| 2014–2015 (%) | 2016–2017 (%) | 2018–2019 (%) | ||
| T1 | ||||
| T1x | 4.9 | 7.6 | 14.2 | |
| T1a | 5.7 | 5.3 | 6.2 | |
| T1b | 4.0 | 5.0 | 7.7 | |
| T1c | 12.6 | 18.0 | 24.3 | |
| T2 | 35.2 | 46.7 | 54.3 | |
Table 3.
Cohort demographics and clinicopathological characteristics of chemotherapy-treated cT1–2/N0 TNBC in the NCDB from the years 2014 to 19, stratified by year, and receipt and timing of those who specifically received chemotherapy
| Chemotherapy | Adjuvant chemotherapy | Neoadjuvant chemotherapy | p-value | ||||
|---|---|---|---|---|---|---|---|
| Years | 2014–2015 | 2016–2017 | 2018–2019 | 2014–2015 | 2016–2017 | 2018–2019 | |
| n | 10,549 | 9,861 | 8,740 | 3,465 | 5,140 | 6,337 | |
| Median (IQR) | Median (IQR) | Median (IQR) | Median (IQR) | Median (IQR) | Median (IQR) | ||
| Age (years) | 57 (11.7) | 59 (11.7) | 60 (11.8) | 52 (11.8) | 53 (12.0) | 54 (12.3) | < 0.001 |
| n (%) | n (%) | n (%) | n (%) | n (%) | n (%) | ||
| Race/Ethnicity | < 0.001 | ||||||
| Hispanic | 631 (6.0) | 615 (6.2) | 561 (6.4) | 272 (7.8) | 411 (8.0) | 572 (9.0) | |
| NH Black | 2,204 (20.9) | 2,105 (21.3) | 1,844 (21.1) | 662 (19.1) | 982 (19.1) | 1,168 (18.4) | |
| NH White | 7,098 (67.3) | 6,566 (66.6) | 5,749 (65.8) | 2,312 (66.7) | 3,394 (66.0) | 4,166 (65.7) | |
| Other | 616 (5.8) | 575 (5.8) | 586 (6.7) | 219 (6.3) | 353 (6.9) | 431 (6.8) | |
| Charlson-deyo comorbidity index | < 0.001 | ||||||
| 0 | 8,641 (81.9) | 8,107 (82.2) | 7,094 (81.2) | 3,034 (87.6) | 4,490 (87.4) | 5,408 (85.3) | |
| 1 | 1,528 (14.5) | 1,279 (13.0) | 1,154 (13.2) | 363 (10.5) | 492 (9.6) | 697 (11.0) | |
| 2 | 294 (2.8) | 297 (3.0) | 298 (3.4) | 49 (1.4) | 113 (2.2) | 141 (2.2) | |
| ≥ 3 | 86 (0.8) | 178 (1.8) | 194 (2.2) | 19 (0.5) | 45 (0.9) | 91 (1.4) | |
| Primary payor | < 0.001 | ||||||
| Private | 6,301 (59.7) | 5,597 (56.8) | 4,627 (52.9) | 2,348 (67.8) | 3,428 (66.7) | 4,076 (64.3) | |
| Medicaid | 832 (7.9) | 762 (7.7) | 656 (7.5) | 340 (9.8) | 487 (9.5) | 598 (9.4) | |
| Medicare | 2,999 (28.4) | 3,124 (31.7) | 3,147 (36.0) | 582 (16.8) | 936 (18.2) | 1,352 (21.3) | |
| Other government | 127 (1.2) | 130 (1.3) | 118 (1.4) | 51 (1.5) | 93 (1.8) | 97 (1.5) | |
| Not insured | 181 (1.7) | 148 (1.5) | 118 (1.4) | 80 (2.3) | 136 (2.6) | 154 (2.4) | |
| Unknown | 109 (1.0) | 100 (1.0) | 74 (0.8) | 64 (1.8) | 60 (1.2) | 60 (0.9) | |
| Tumor grade | < 0.001 | ||||||
| I | 122 (1.2) | 152 (1.5) | 178 (2.0) | 25 (0.7) | 56 (1.1) | 42 (0.7) | |
| II | 1,524 (14.4) | 1,470 (14.9) | 2,020 (23.1) | 528 (15.2) | 705 (13.7) | 988 (15.6) | |
| III | 8,596 (81.5) | 8,065 (81.8) | 5,497 (62.9) | 2,757 (79.6) | 4,168 (81.1) | 4,785 (75.5) | |
| Unknown | 307 (2.9) | 174 (1.8) | 1,045 (12.0) | 155 (4.5) | 211 (4.1) | 522 (8.2) | |
| Clinical T stage | < 0.001 | ||||||
| T1 | 6,914 (65.5) | 6,768 (68.6) | 6,188 (70.8) | 932 (26.9) | 1,394 (27.1) | 1,920 (30.3) | |
| T1x | 1,269 (12.0) | 765 (7.8) | 421 (4.8) | 97 (2.8) | 97 (1.9) | 106 (1.7) | |
| T1a | 283 (2.7) | 303 (3.1) | 300 (3.4) | 41 (1.2) | 38 (0.7) | 46 (0.7) | |
| T1b | 1,476 (14.0) | 1,736 (17.6) | 1,804 (20.6) | 92 (2.7) | 136 (2.6) | 224 (3.5) | |
| T1c | 3,886 (36.8) | 3,964 (40.2) | 3,663 (41.9) | 702 (20.3) | 1,123 (21.8) | 1,544 (24.4) | |
| T2 | 3,635 (34.5) | 3,093 (31.4) | 2,552 (29.2) | 2,533 (73.1) | 3,746 (72.9) | 4,417 (69.7) | |
| Procedure type | < 0.001 | ||||||
| Lumpectomy | 6,820 (64.7) | 6,700 (67.9) | 6,032 (69.0) | 1,917 (55.3) | 2,862 (55.7) | 3,589 (56.6) | |
| Mastectomy | 3,729 (35.3) | 3,161 (32.1) | 2,708 (31) | 1,548 (44.7) | 2,278 (44.3) | 2,748 (43.4) | |
| Regional nodes examined | < 0.001 | ||||||
| 0 | 111 (1.1) | 88 (0.9) | 77 (0.9) | 157 (4.5) | 136 (2.6) | 127 (2.0) | |
| 1–5 | 8,333 (79.0) | 8,079 (81.9) | 7,401 (84.7) | 2,672 (77.1) | 4,167 (81.1) | 5,303 (83.7) | |
| 6–10 | 1203 (11.4) | 1016 (10.3) | 843 (9.6) | 393 (11.3) | 521 (10.1) | 619 (9.8) | |
| > 10 | 817 (7.7) | 590 (6.0) | 376 (4.3) | 181 (5.2) | 239 (4.6) | 224 (3.5) | |
| Unknown | 85 (0.8) | 88 (0.9) | 43 (0.5) | 62 (1.8) | 77 (1.5) | 64 (1) | |
| Regional nodes positive | < 0.001 | ||||||
| 0 | 8829 (83.7) | 8384 (85.0) | 7515 (86.0) | 3064 (88.4) | 4616 (89.8) | 5817 (91.8) | |
| 1–3 | 1,389 (13.2) | 1,231 (12.5) | 1,012 (11.6) | 203 (5.9) | 323 (6.3) | 323 (5.1) | |
| ≥ 4 | 202 (1.9) | 143 (1.5) | 121 (1.4) | 30 (0.9) | 49 (1.0) | 42 (0.7) | |
| Unknown | 129 (1.2) | 103 (1.0) | 92 (1.1) | 168 (4.8) | 152 (3) | 155 (2.4) | |
| AJCC Pathologic T | < 0.001 | ||||||
| T0 | 282 (2.7) | 267 (2.7) | 352 (4.0) | 1188 (34.3) | 1718 (33.4) | 2418 (38.2) | |
| Tis | 24 (0.2) | 21 (0.2) | 40 (0.5) | 141 (4.1) | 186 (3.6) | 290 (4.6) | |
| T1^ | 6315 (59.9) | 6127 (62.1) | 5642 (64.6) | 1371 (39.6) | 2079 (40.4) | 2560 (40.4) | |
| T1x | 72 (0.7) | 35 (0.4) | 30 (0.3) | 46 (1.3) | 34 (0.7) | 25 (0.4) | |
| T1mic | 33 (0.3) | 18 (0.2) | 25 (0.3) | 69 (2.0) | 121 (2.4) | 183 (2.9) | |
| T1a | 288 (2.7) | 239 (2.4) | 246 (2.8) | 357 (10.3) | 582 (11.3) | 733 (11.6) | |
| T1b | 1521 (14.4) | 1598 (16.2) | 1,550 (17.7) | 337 (9.7) | 539 (10.5) | 653 (10.3) | |
| T1c | 4,401 (41.7) | 4,237 (43.0) | 3,791 (43.4) | 562 (16.2) | 803 (15.6) | 966 (15.2) | |
| T2 | 3,634 (34.4) | 3,196 (32.4) | 2,530 (28.9) | 461 (13.3) | 660 (12.8) | 692 (10.9) | |
| T3 | 190 (1.8) | 139 (1.4) | 125 (1.4) | 51 (1.5) | 63 (1.2) | 62 (1.0) | |
| T4 | 14 (0.1) | 21 (0.2) | 9 (0.1) | 5 (0.1) | 9 (0.2) | 10 (0.2) | |
| Unknown | 90 (0.9) | 90 (0.9) | 42 (0.5) | 248 (7.2) | 425 (8.3) | 305 (4.8) | |
| AJCC Pathologic N | < 0.001 | ||||||
| N0 | 6,185 (58.6) | 5,637 (57.2) | 7,303 (83.6) | 2,203 (63.6) | 3,267 (63.6) | 5,671 (89.5) | |
| N0(i +) | 182 (1.7) | 189 (1.9) | 139 (1.6) | 28 (0.8) | 49 (1.0) | 59 (0.9) | |
| N1(mic) | 320 (3.0) | 325 (3.3) | 262 (3.0) | 52 (1.5) | 102 (2.0) | 97 (1.5) | |
| N1 | 3,509 (33.3) | 3,463 (35.1) | 738 (8.4) | 971 (28.0) | 1,438 (28.0) | 221 (3.5) | |
| N2 | 155 (1.5) | 106 (1.1) | 87 (1.0) | 21 (0.6) | 38 (0.7) | 29 (0.5) | |
| N3 | 50 (0.5) | 35 (0.4) | 30 (0.3) | 4 (0.1) | 7 (0.1) | 8 (0.1) | |
| Unknown | 148 (1.4) | 106 (1.1) | 181 (2.1) | 186 (5.4) | 239 (4.6) | 252 (4) | |
| Endocrine therapy | 0.005 | ||||||
| Yes | 265 (2.5) | 255 (2.6) | 224 (2.6) | 119 (3.4) | 140 (2.7) | 201 (3.2) | |
| No | 10,189 (96.6) | 9,540 (96.7) | 8,469 (96.9) | 3,319 (95.8) | 4,964 (96.6) | 6,097 (96.2) | |
| Unknown | 95 (0.9) | 66 (0.7) | 47 (0.5) | 27 (0.8) | 36 (0.7) | 39 (0.6) | |
| Radiation therapy | < 0.001 | ||||||
| Yes | 6,943 (65.8) | 6,542 (66.3) | 5,956 (68.1) | 2,056 (59.3) | 2,955 (57.5) | 3,757 (59.3) | |
| No | 3,389 (32.1) | 3,038 (30.8) | 2,689 (30.8) | 1,366 (39.4) | 2,015 (39.2) | 2,514 (39.7) | |
| Unknown | 217 (2.1) | 281 (2.8) | 95 (1.1) | 43 (1.2) | 170 (3.3) | 66 (1.0) | |
| Treatment facility | < 0.001 | ||||||
| Community cancer program | 730 (6.9) | 711 (7.2) | 620 (7.1) | 137 (4.0) | 248 (4.8) | 338 (5.3) | |
| Comprehensive community cancer program | 4,102 (38.9) | 3,811 (38.6) | 3,444 (39.4) | 1,119 (32.3) | 1,525 (29.7) | 1,895 (29.9) | |
| Academic/research program | 2,963 (28.1) | 2,840 (28.8) | 2,576 (29.5) | 996 (28.7) | 1,504 (29.3) | 1,915 (30.2) | |
| Integrated network cancer program | 1,935 (18.3) | 1,792 (18.2) | 1,566 (17.9) | 661 (19.1) | 1,058 (20.6) | 1,273 (20.1) | |
| Missing | 819 (7.8) | 707 (7.2) | 534 (6.1) | 552 (15.9) | 805 (15.7) | 916 (14.5) | |
| Distance to treatment facility (miles) | < 0.001 | ||||||
| ≤ 20 | 7,123 (67.5) | 6,488 (65.8) | 5,574 (63.8) | 2,150 (62.0) | 3,264 (63.5) | 3,993 (63.0) | |
| 21–40 | 1,266 (12.0) | 1,236 (12.5) | 1,086 (12.4) | 415 (12.0) | 611 (11.9) | 765 (12.1) | |
| 41–60 | 403 (3.8) | 375 (3.8) | 350 (4.0) | 151 (4.4) | 199 (3.9) | 279 (4.4) | |
| > 60 | 449 (4.3) | 456 (4.6) | 442 (5.1) | 191 (5.5) | 350 (6.8) | 420 (6.6) | |
| Missing | 1,308 (12.4) | 1,306 (13.2) | 1,288 (14.7) | 558 (16.1) | 716 (13.9) | 880 (13.9) | |
Key: IQR interquartile range, NH non-Hispanic, T1x all T1 sub-categories that did not include an a,b,c subset code, Tis carcinoma in situ, T1mic T1 stage tumor with microinvasion, N0(i +) N0 stage nodes with isolated tumor cells, N1(mic) N1 stage nodes with microinvasion (N = 44,095)
When assessing surgical pathology findings, patients who received NAC had a higher proportion who were found to be pathologically T0, Tis, or T1 compared to those who received AC (79.9% vs 65.4%, p < 0.001). Similarly, more NAC patients were found to be pathologically node-negative at the time of surgery (defined as ypN0 or pN0) compared to those who received AC (65.6% vs 74.6%, p < 0.001).
On multivariable analysis, when compared to the years 2016–2017, the use of NAC was significantly lower in 2014–2015 (pre-CREATE-X) (OR 0.46, 95% CI 0.35–0.59, p < 0.001) and significantly higher in 2018–2019 (post-CREATE-X) (OR 1.63, 95% CI 1.31–2.03, p < 0.001) (Table 4). Additionally, several variables were found to be associated with an increased odds of receiving NAC vs AC across all years of the study. Younger patients, defined as those < 50 years of age, had a higher likelihood of receiving NAC (OR 1.41, 95% CI 1.33–1.49, p < 0.001), while older patients, defined as ≥ 70, were less likely to receive NAC (OR 0.67, 95% CI 0.62–0.73, p < 0.001). Non-Hispanic Black patients had lower odds of receiving NAC compared to non-Hispanic White patients (OR 0.84, 95% CI 0.80–0.90, p < 0.001), as well as patients with Medicaid (OR 0.87, 95% CI 0.81–0.95, p < 0.001) or Medicare insurance (OR 0.75, 95% CI 0.70–0.80, p < 0.001) compared to those with private insurance. Women with cT1 tumors were less likely to receive NAC compared to women with cT2 tumors (OR 5.55, 95% CI 5.14–5.99, p < 0.001). As CCI score increased above 0, the odds of receiving NAC conversely decreased (score of 1 (OR 0.83, 95% CI 0.78–0.89, p < 0.001), 2 (OR 0.73, 95% CI 0.63–0.84, p < 0.001), ≥ 3 (OR 0.69 95% CI 0.56–0.85, p < 0.001)). Patients living > 60 miles from the treating facility had an increased odds of NAC use as compared to patients living < 20 miles from the treating facility (OR 1.28, 95% CI 1.16–1.41, p < 0.001). Compared to women who received care at a community cancer program, women who received care at an academic research center academic/research center (OR 1.45, 95% CI 1.22–1.72, p < 0.001) or at an integrated network cancer program (OR 1.70, 95% CI 1.43–2.04, p < 0.001).were more likely to receive NAC.
Table 4.
Factors associated with receipt of neoadjuvant chemotherapy vs adjuvant chemotherapy in cT1-2/N0 TNBC from the NCDB.
| Variable | OR | 95%CI | p-value |
|---|---|---|---|
| Age | |||
| < 50 | 1.41 | 1.33–1.49 | < 0.001 |
| 50–69 | Ref. | ||
| ≥ 70 | 0.67 | 0.62–0.73 | < 0.001 |
| Race/ethnicity | |||
| Hispanic | 1.02 | 0.94–1.12 | 0.619 |
| NH Black | 0.84 | 0.80–0.90 | < 0.001 |
| NH White | Ref. | ||
| Other | 0.91 | 0.83–1.00 | 0.055 |
| Charlson-deyo comorbidity index | |||
| 0 | Ref. | ||
| 1 | 0.83 | 0.78–0.89 | < 0.001 |
| 2 | 0.73 | 0.63–0.84 | < 0.001 |
| ≥ 3 | 0.69 | 0.56–0.85 | < 0.001 |
| Primary payor | |||
| Private | Ref. | ||
| Medicaid | 0.87 | 0.81–0.95 | 0.001 |
| Medicare | 0.75 | 0.70–0.80 | < 0.001 |
| Other government | 1.12 | 0.93–1.34 | 0.25 |
| Not insured | 1.11 | 0.95–1.30 | 0.21 |
| Year of diagnosis | |||
| 2014–2015 | 0.46 | 0.35–0.59 | < 0.001 |
| 2016–2017 | Ref. | ||
| 2018–2019 | 1.63 | 1.31–2.03 | < 0.001 |
| Tumor Grade | |||
| I | 0.73 | 0.58–0.91 | 0.006 |
| II | 1.16 | 1.09–1.24 | < 0.001 |
| III | Ref. | ||
| Unknown | 0.93 | 0.84–1.02 | 0.131 |
| Clinical T Stage | |||
| T1x | 0.11 | 0.09–0.14 | < 0.001 |
| T1a | 0.11 | 0.07–0.15 | < 0.001 |
| T1b | 0.07 | 0.06–0.09 | < 0.001 |
| T1c | 0.24 | 0.22–0.26 | < 0.001 |
| T2 | Ref. | ||
| Procedure Type | |||
| Lumpectomy | Ref. | ||
| Mastectomy | 1.14 | 1.08–1.19 | < 0.001 |
| Treatment Facility | |||
| Community cancer program | Ref. | ||
| Comprehensive community cancer program | 1.15 | 0.97–1.36 | 0.114 |
| Academic/research program | 1.45 | 1.22–1.72 | < 0.001 |
| Integrated network cancer program | 1.70 | 1.43–2.04 | < 0.001 |
| Distance to treatment facility (miles) | |||
| ≤ 20 | Ref. | ||
| 21–40 | 0.98 | 0.91–1.05 | 0.48 |
| 41–60 | 1.06 | 0.95–1.19 | 0.32 |
| > 60 | 1.28 | 1.16–1.41 | < 0.001 |
OR odds ratio, CI confidence interval, NH non-Hispanic, Ref reference, T1x all T1 sub-categories that do not fit in the listed sub-categories
Discussion
In this study of women from the NCDB with cT1–2 N0 M0 TNBC, there was a clinically and statistically significant increase in NAC utilization from 2014 to 2019, coinciding with the release of the CREATE-X trial results and subsequent changes to national clinical treatment guidelines [1, 10]. Demographic and clinicopathologic factors predictive of receiving NAC included younger age, no comorbidities, higher disease grade and clinical tumor stage (cT2), further travel distance for treatment (> 60 miles), and care at an academic or integrated network cancer center. Inversely, non-Hispanic Black ethnic/racial identity and Medicaid or Medicare insurance were associated with reduced receipt of NAC. To our knowledge, this is the first national study examining the frequency of NAC utilization in early-stage node-negative TNBC and unfortunately identifies that racial, socioeconomic, and access disparities exist with respect to receipt of NAC in the context of rapid adoption of adjuvant systemic therapy for patients with residual disease.
Our findings that younger age, fewer comorbidities, higher tumor grade, and increased clinical tumor stage were associated with increased NAC use are anticipated and have been observed in previous contemporary series [29–31]. Older women are less frequently managed with NAC due to concerns for toxicity and increased frailty associated with advancing age and comorbidities. However, investigations specifically examining NAC utilization in breast cancer actually found no increase in surgical complications in older women compared to younger women [32, 33]. Similarly, having fewer comorbidities was associated with receiving NAC, as complications from chemotherapy may exacerbate existing health conditions or result in new medical comorbidities such as cardiac toxicity [31, 34]. While granular information regarding individual level comorbidities in this population is not available in the NCDB, this may have precluded patients from receiving NAC. For example, the standard NAC regimen for early TNBC frequently includes doxorubicin, cyclophosphamide, and paclitaxel [11] which have significant potential side effects such as cardiotoxicity, peripheral neuropathy, and gastrointestinal upset. Thus, these chemotherapeutic drugs are often contraindicated in patients with underlying significant cardiovascular disease and/or diabetes mellitus which may be observed in this cohort as an increased CCI [35–37].
High tumor grade and increased Ki-67 score are known to be associated with chemosensitivity and are contributing factors in the decision for NAC [38]. Similarly, NAC previously has been demonstrated to successfully downstage the primary breast tumor for women with larger tumors, improving a patient’s candidacy for breast conservation therapy, and may partly explain why we observed higher NAC utilization for those women with cT2 tumors when compared to patients with cT1 tumors [29, 38]. Additionally, while the CREATE-X trial prespecified subgroup disease-free survival analysis for disease-free survival found the hazard ratios (HR) leaned toward favoring adjuvant capecitabine for the 14.5% of the CREATE-X cohort with cT1 tumors and the 39.2% with N0 disease, both variables were not found to be statistically significant (HR 0.65, 95% CI 0.30–1.44 and HR 0.97, 95% CI 0.48–1.60, respectively) [1]. However, a statistically significant disease-free survival benefit was observed in patients with cT2–4 tumors (HR 0.71 95% CI 0.53–0.96) and may explain why NAC was used less in cT1 patients in this cN0 NCDB cohort [1].
Non-Hispanic Black women experienced lower rates of NAC receipt compared to non-Hispanic White women on multivariate analysis and is unsettling given the higher likelihood of the TNBC subtype and generally more advanced breast cancer stage at diagnosis in this specific population [8, 39]. Race-based differences in receipt of oncologic treatment modalities are well-documented [40–43] and several studies have identified that non-Hispanic Black patients are less likely to be offered surgery, radiation therapy, and even breast reconstruction following mastectomy compared to Non-Hispanic White women [44–46]. The inadequate delivery of systemic chemotherapy in non-Hispanic Black patients has also been well studied [47–49], with cited reasons varying from ethnic neutropenia, toxicity and inability to complete therapy, to patient preference [47–50]. These data in combination with our study’s findings suggest a departure from guideline concordant care and highlight an opportunity for the multi-disciplinary oncology team to be diligent in identifying barriers [51] to NAC and offering NAC to clinically appropriate patients, regardless of race and/or ethnicity.
Socioeconomic factors often impact a patient’s ability to obtain care and prior analysis demonstrated that 5-year survival rates following any cancer diagnosis are lower for the most impoverished [52]. Patients with TNBC who had Medicaid insurance were less likely to receive NAC in our study, and this finding serves as an indicator that patients with lower socioeconomic status haver a lower likelihood of receiving NAC despite the findings of CREATE-X. The reasons behind these disparities are multifactorial, but may include decreased access to care, reduced health literacy, and the compounding impacts of structural racism with lower socioeconomic status [52–55].
On multivariate analysis, we identified that patients who lived > 60 miles from the treating facility had a higher likelihood of receiving NAC. This observation initially may seem counterintuitive as one might hypothesize that living farther from a treatment center could present transportation challenges and a financial toxicity given associated travel, food, and lodging expenses, compounded by lost wages for time off work [56–58]. High-volume centers are associated with improved cancer-specific outcomes and utilization of guideline concordant care across multiple disease sites, including breast [59, 60], leading to efforts to centralize care for some cancers, which may prompt and/or require patients to travel greater distances to obtain comprehensive cancer care – particularly those individuals who have the means, both financially and socially, to travel to high-volume centers for care. This finding may also be a flaw inherent to the data as only a minority of patients in this study (approximately 5%) lived > 60 miles from the treating facility. While the NCDB registry encompasses approximately 72% of the cancer cases diagnosed in the United States [24], it covers less than a third of hospitals in the US and may under sample hospitals with rural catchment areas [61], targeting a subset of the population that is traveling for care rather than patronizing local hospitals.
In addition to CREATE-X, several groundbreaking clinical trials in the past few years have resulted in significant changes to systemic treatment paradigms for patients with TNBC. The addition of novel immune checkpoint inhibitors to NAC regimens for select high-risk TNBC patients has resulted in improved rates of a complete pathological response at the time of surgery, such as pembrolizumab, atezolizumab, and durvalumab with pembrolizumab also demonstrating improvement in DFSS at 3 years [2–4]. Additionally, for patients with BRCA1 or BRCA2 pathogenic mutations with high-risk early-stage Her2-negative breast cancer who received NAC and found to have residual disease, the addition of Olaparib, a PARP inhibitor, in the adjuvant setting significantly improved DFS and illuminates the future potential for genetic data to guide precision systemic therapy for breast cancer [62]. Given that our study ended in 2019, prior to the publication of these therapies, our data likely underestimates the true current rate of NAC use in patients with early-stage TNBC. Furthermore, given that the KATHERINE trial also demonstrated the utility of NAC in HER2-positive/amplified breast cancer to identify poor tumor response with residual disease and thus oncologic benefit from trastuzumab emtansine (T-DM1) in the adjuvant setting, there is possibly an uptrend in the use of NAC among other tumor-receptor subtypes as well and warrants investigation [63]. Recent and ongoing dynamic systemic therapy trials, like the ISPY-2 trial, will further alter how the multi-disciplinary oncology team approaches NAC for breast cancer patients using an individualized evidence-based approach [64, 65].
There are several limitations to this study. The NCDB uses trained abstractors to collect data across hundreds of hospitals in the US; however, with this comes the potential for sampling/coding errors and the associated inherent bias of a retrospective study. Given the contemporary nature of this data at the time analysis there was little available data for five-year OS (the NCDB does not report DSS) and thereby inhibiting any meaningful survival data analysis. Furthermore, the NCDB does not contain information on clinical decision-making, including patient preferences, which prevents understanding the complex decision-making that occurs regarding chemotherapy. Additionally, at the time of this study’s inception, NCDB data from 2020 was available; however, this year was purposely excluded from analysis given the rapid shifts in breast cancer treatment due to the COVID-19 global pandemic that may have confounded standard practice data. Some patients in this cohort, although very few, did receive adjuvant endocrine therapy, likely indicating that some patients had low estrogen and/or progesterone receptor activity or tumor heterogeneity. Nevertheless, the strengths of this cohort include its robust patient size and its ability to identify contemporary trends in national treatment patterns of women with early-stage node-negative TNBC.
Conclusion
In this study of women from the NCDB with cT1–2 N0 M0 TNBC from 2014 to 2019, there was a significant increase in NAC utilization, coinciding with the release of the practice changing CREATE-X trial results and updated clinical treatment guidelines for TNBC. While expected differences were observed in who received NAC vs AC, striking racial, socioeconomic, and access disparities to receiving NAC were identified. Future work is urgently needed to identify strategies to mitigate these disparities and ensure equitable access to rapidly changing clinical breast cancer treatment guidelines to optimize oncologic outcomes for patients with early-stage TNBC.
Funding
CSC is supported by the National Institutes of Health (NIH) under Award Number 1K08CA276706-01A1 (PI: Cortina). The content of this manuscript is soley the responsiblity of the authors and does not neccessarily represent the official views of the NIH.
Footnotes
Conflict of interest The authors have no relevant disclosures to report.
Data availability
Enquiries about data availability should be directed to the authors.
References
- 1.Masuda N, Lee S-J, Ohtani S et al. (2017) Adjuvant capecitabine for breast cancer after preoperative chemotherapy. N Engl J Med 376(22):2147–2159. 10.1056/nejmoa1612645 [DOI] [PubMed] [Google Scholar]
- 2.Schmid P, Cortes J, Pusztai L et al. (2020) Pembrolizumab for early triple-negative breast cancer. N Engl J Med 382(9):810–821. 10.1056/nejmoa1910549 [DOI] [PubMed] [Google Scholar]
- 3.Mittendorf EA, Zhang H, Barrios CH et al. (2020) Neoadjuvant atezolizumab in combination with sequential nab-paclitaxel and anthracycline-based chemotherapy versus placebo and chemotherapy in patients with early-stage triple-negative breast cancer (IMpassion031): a randomised, double-blind, phase 3 trial. Lancet 396(10257):1090–1100. 10.1016/S0140-6736(20)31953-X [DOI] [PubMed] [Google Scholar]
- 4.Loibl S, Schneeweiss A, Huober J et al. (2022) Neoadjuvant durvalumab improves survival in early triple-negative breast cancer independent of pathological complete response. Ann Oncol 33(11):1149–1158. 10.1016/j.annonc.2022.07.1940 [DOI] [PubMed] [Google Scholar]
- 5.Malorni L, Shetty PB, De Angelis C et al. (2012) Clinical and biologic features of triple-negative breast cancers in a large cohort of patients with long-term follow-up. Breast Cancer Res Treat 136(3):795–804. 10.1007/s10549-012-2315-y [DOI] [PMC free article] [PubMed] [Google Scholar]
- 6.Bianchini G, Balko JM, Mayer IA, Sanders ME, Gianni L (2016) Triple-negative breast cancer: challenges and opportunities of a heterogeneous disease. Nat Rev Clin Oncol 13(11):674–690. 10.1038/nrclinonc.2016.66 [DOI] [PMC free article] [PubMed] [Google Scholar]
- 7.Dent R, Trudeau M, Pritchard KI et al. (2007) Triple-negative breast cancer: Clinical features and patterns of recurrence. Clin Cancer Res 13(15):4429–4434. 10.1158/1078-0432.ccr-06-3045 [DOI] [PubMed] [Google Scholar]
- 8.Cho B, Han Y, Lian M et al. (2021) Evaluation of racial/ethnic differences in treatment and mortality among women with triple-negative breast cancer. JAMA Oncol 7(7):1016. 10.1001/jamaoncol.2021.1254 [DOI] [PMC free article] [PubMed] [Google Scholar]
- 9.Toi M, Lee S-J, Lee ES, et al. A phase III trial of adjuvant capecitabine in breast cancer patients with HER2-negative pathologic residual invasive disease after neoadjuvant chemotherapy (CREATE-X, JBCRG-04). Abstract presented at: San Antonio Breast Cancer Symposium; December, 2015. S1–07. [Google Scholar]
- 10.NCCN Guidelines for Breast Cancer V.3.2017 Meeting Updates. Accessed May 1, 2023.
- 11.Telli M, Ward J, Gradishar W. NCCN guidelines updates: Breast cancer. Journal of the National Comprehensive Cancer Network: JNCCN. Accessed May 8, 2023. https://pubmed.ncbi.nlm.nih.gov/31117035/. [DOI] [PubMed] [Google Scholar]
- 12.Zujewski JA, Rubinstein L (2017) Create-x a role for Capecitabine in early-stage breast cancer: an analysis of available data. Npj Breast Cancer. 10.1038/s41523-017-0029-3 [DOI] [PMC free article] [PubMed] [Google Scholar]
- 13.Montemurro F, Nuzzolese I, Ponzone R (2020) Neoadjuvant or adjuvant chemotherapy in early breast cancer? Expert Opin Pharmacother 21(9):1071–1082. 10.1080/14656566.2020.1746273 [DOI] [PubMed] [Google Scholar]
- 14.Matuschek C, Jazmati D, Bölke E et al. (2022) Post-neoadjuvant treatment strategies in breast cancer. Cancers 14(5):1246. 10.3390/cancers14051246 [DOI] [PMC free article] [PubMed] [Google Scholar]
- 15.Wolmark N, Wang J, Mamounas E, Bryant J, Fisher B (2001) Preoperative chemotherapy in patients with operable breast cancer: nine-year results from national surgical adjuvant breast and bowel project B-18. J Natl Cancer Inst Monogr 30:96–102. 10.1093/oxfordjournals.jncimonographs.a003469 [DOI] [PubMed] [Google Scholar]
- 16.Boughey JC (2013) Sentinel lymph node surgery after neoadjuvant chemotherapy in patients with node-positive breast cancer. JAMA 310(14):1455. 10.1001/jama.2013.278932 [DOI] [PMC free article] [PubMed] [Google Scholar]
- 17.Le-Petross HT, McCall LM, Hunt KK et al. (2018) Axillary ultra-sound identifies residual nodal disease after chemotherapy: results from the american college of surgeons oncology group Z1071 trial (Alliance). AJR Am J Roentgenol 210(3):669–676. 10.2214/AJR.17.18295 [DOI] [PMC free article] [PubMed] [Google Scholar]
- 18.Boughey JC, Ballman KV, Le-Petross HT et al. (2016) Identification and resection of clipped node decreases the false-negative rate of sentinel lymph node surgery in patients presenting with node-positive breast cancer (T0–T4, N1–N2) who receive neoadjuvant chemotherapy: results from ACOSOG Z1071 (Alliance). Ann Surg 263(4):802–807. 10.1097/SLA.0000000000001375 [DOI] [PMC free article] [PubMed] [Google Scholar]
- 19.Caudle AS, Yang WT, Krishnamurthy S et al. (2016) Improved axillary evaluation following neoadjuvant therapy for patients with node-positive breast cancer using selective evaluation of clipped nodes: implementation of targeted axillary dissection. J Clin Oncol 34(10):1072–1078. 10.1200/JCO.2015.64.0094 [DOI] [PMC free article] [PubMed] [Google Scholar]
- 20.Korde LA, Somerfield MR, Carey LA et al. (2021) Neoadjuvant chemotherapy, endocrine therapy, and targeted therapy for breast cancer: ASCO guideline. J Clin Oncol 39(13):1485–1505. 10.1200/JCO.20.03399 [DOI] [PMC free article] [PubMed] [Google Scholar]
- 21.Huo X, Li J, Zhao F et al. (2021) The role of capecitabine-based neoadjuvant and adjuvant chemotherapy in early-stage triple-negative breast cancer: a systematic review and meta-analysis. BMC Cancer. 21(1):78. 10.1186/s12885-021-07791-y [DOI] [PMC free article] [PubMed] [Google Scholar]
- 22.Fitzpatrick A, Tutt A (2019) Controversial issues in the neoadjuvant treatment of triple-negative breast cancer. Ther Adv Med Oncol. 11:1758835919882581. 10.1177/1758835919882581 [DOI] [PMC free article] [PubMed] [Google Scholar]
- 23.Bilimoria KY, Stewart AK, Winchester DP, Ko CY (2008) the national cancer data base: a powerful initiative to improve cancer care in the United States. Ann Surg Oncol 15(3):683–690. 10.1245/s10434-007-9747-3 [DOI] [PMC free article] [PubMed] [Google Scholar]
- 24.About the National Cancer Database. American College of Surgeons. Accessed May 3, 2023. https://www.facs.org/quality-programs/cancer-programs/national-cancer-database/about/
- 25.Martinez EO, Jorns JM, Kong AL et al. (2022) Primary breast neuroendocrine tumors: an analysis of the national cancer database. Ann Surg Oncol 29(10):6339–6346. 10.1245/s10434-022-12123-w [DOI] [PMC free article] [PubMed] [Google Scholar]
- 26.Mills MN, Yang GQ, Oliver DE et al. (2018) Histologic heterogeneity of triple negative breast cancer: a national cancer centre database analysis. Eur J Cancer 98:48–58. 10.1016/j.ejca.2018.04.011 [DOI] [PubMed] [Google Scholar]
- 27.Ong CT, Campbell BM, Thomas SM et al. (2018) Metaplastic breast cancer treatment and outcomes in 2500 patients: a retrospective analysis of a national oncology database. Ann Surg Oncol 25(8):2249–2260. 10.1245/s10434-018-6533-3 [DOI] [PMC free article] [PubMed] [Google Scholar]
- 28.Deyo R (1992) Adapting a clinical comorbidity index for use with ICD-9-CM administrative databases. J Clin Epidemiol 45(6):613–619. 10.1016/0895-4356(92)90133-8 [DOI] [PubMed] [Google Scholar]
- 29.Duchesneau ED, An SJ, Strassle PD et al. (2022) Sociodemo-graphic and clinical predictors of neoadjuvant chemotherapy in CT1-T2/n0 Her2-amplified breast cancer. Ann Surg Oncol 29(5):3051–3061. 10.1245/s10434-021-11260-y [DOI] [PMC free article] [PubMed] [Google Scholar]
- 30.Zhang H, Barner JC, Moczygemba LR, Rascati KL, Park C, Kodali D (2022) Neoadjuvant chemotherapy use trends among older women with breast cancer: 2010–2017. Breast Cancer Res Treat 193(3):695–705. 10.1007/s10549-022-06604-5 [DOI] [PubMed] [Google Scholar]
- 31.Puig CA, Hoskin TL, Day CN, Habermann EB, Boughey JC (2016) National trends in the use of neoadjuvant chemotherapy for hormone receptor-negative breast cancer: a national cancer data base study. Ann Surg Oncol 24(5):1242–1250. 10.1245/s10434-016-5733-y [DOI] [PubMed] [Google Scholar]
- 32.Lorentzen T, Heidemann LN, Möller S, Bille C (2022) Impact of neoadjuvant chemotherapy on surgical complications in breast cancer: a systematic review and meta-analysis. Eur J Surg Oncol 48(1):44–52. 10.1016/j.ejso.2021.09.007 [DOI] [PubMed] [Google Scholar]
- 33.Brown L, Carr MJ, Sam C et al. (2023) Tolerance and outcomes of neoadjuvant chemotherapy in geriatric breast cancer patients. J Surg Res 283:329–335. 10.1016/j.jss.2022.10.092 [DOI] [PubMed] [Google Scholar]
- 34.Curigliano G, Burstein HJ, Winer EP et al. (2017) De-escalating and escalating treatments for early-stage breast cancer The St Gallen international expert consensus conference on the primary therapy of early breast cancer. Annals of Oncology 28(8):1700–1712. 10.1093/annonc/mdx308 [DOI] [PMC free article] [PubMed] [Google Scholar]
- 35.Hershman DL, Till C, Wright JD et al. (2016) Comorbidities and risk of chemotherapy-induced peripheral neuropathy among participants 65 years or older in Southwest oncology group clinical trials. J Clin Oncol 34(25):3014–3022. 10.1200/jco.2015.66.2346 [DOI] [PMC free article] [PubMed] [Google Scholar]
- 36.Johnson-Arbor K, Dubey R. Doxorubicin. In: Statpearls. StatPearls Publishing; 2023. [PubMed] [Google Scholar]
- 37.Ogino M, Tadi P. Cyclophosphamide. In: Statpearls. StatPearls Publishing; 2022. [PubMed] [Google Scholar]
- 38.Thompson AM, Moulder-Thompson SL (2012) Neoadjuvant treatment of breast cancer. Ann Oncol 23:x231–x236. 10.1093/annonc/mds324 [DOI] [PMC free article] [PubMed] [Google Scholar]
- 39.Newman LA, Kaljee LM (2017) Health disparities and triple-negative breast cancer in african american women: a review. JAMA Surg 152(5):485–493. 10.1001/jamasurg.2017.0005 [DOI] [PubMed] [Google Scholar]
- 40.Shavers VL, Brown ML (2002) Racial and ethnic disparities in the receipt of cancer treatment. J Natl Cancer Inst 94(5):334–357. 10.1093/jnci/94.5.334 [DOI] [PubMed] [Google Scholar]
- 41.Hershman D, McBride R, Jacobson JS et al. (2005) Racial disparities in treatment and survival among women with early-stage breast cancer. J Clin Oncol 23(27):6639–6646. 10.1200/JCO.2005.12.633 [DOI] [PubMed] [Google Scholar]
- 42.Reyes SA, King TA, Fei K, Franco R, Bickell NA (2016) Factors affecting the completion of adjuvant chemotherapy in early-stage breast cancer. Ann Surg Oncol 23(5):1537–1542. 10.1245/s10434-015-5039-5 [DOI] [PubMed] [Google Scholar]
- 43.Zipkin RJ, Schaefer A, Wang C et al. (2022) Rural-Urban differences in breast cancer surgical delays in medicare beneficiaries. Ann Surg Oncol 29(9):5759–5769. 10.1245/s10434-022-11834-4 [DOI] [PMC free article] [PubMed] [Google Scholar]
- 44.Connors SK, Goodman MS, Myckatyn T, Margenthaler J, Gehlert S (2016) Breast reconstruction after mastectomy at a comprehensive cancer center. Springerplus. 5(1):955. 10.1186/s40064-016-2375-2 [DOI] [PMC free article] [PubMed] [Google Scholar]
- 45.Black DM, Jiang J, Kuerer HM, Buchholz TA, Smith BD (2014) Racial disparities in adoption of axillary sentinel lymph node biopsy and lymphedema risk in women with breast cancer. JAMA Surg 149(8):788–796. 10.1001/jamasurg.2014.23 [DOI] [PMC free article] [PubMed] [Google Scholar]
- 46.Cortina CS, Bergom CR, Kijack J, Thorgerson AA, Huang CS, Kong AL (2021) Postmastectomy breast reconstruction in women aged 70 and older: An analysis of the national cancer database (NCDB). Surgery 170(1):30–38. 10.1016/j.surg.2021.03.033 [DOI] [PMC free article] [PubMed] [Google Scholar]
- 47.Hershman D, Weinberg M, Rosner Z et al. (2003) Ethnic neutropenia and treatment delay in African American women undergoing chemotherapy for early-stage breast cancer. J Natl Cancer Inst 95(20):1545–1548. 10.1093/jnci/djg073 [DOI] [PubMed] [Google Scholar]
- 48.Hershman DL, Unger JM, Barlow WE et al. (2009) Treatment quality and outcomes of African American versus white breast cancer patients: retrospective analysis of Southwest oncology studies S8814/S8897. J Clin Oncol 27(13):2157–2162. 10.1200/JCO.2008.19.1163 [DOI] [PMC free article] [PubMed] [Google Scholar]
- 49.Bickell NA, Wang JJ, Oluwole S et al. (2006) Missed opportunities: racial disparities in adjuvant breast cancer treatment. J Clin Oncol 24(9):1357–1362. 10.1200/JCO.2005.04.5799 [DOI] [PubMed] [Google Scholar]
- 50.Lipscomb J, Gillespie TW, Goodman M et al. (2012) Black-white differences in receipt and completion of adjuvant chemotherapy among breast cancer patients in a rural region of the US. Breast Cancer Res Treat 133(1):285–296. 10.1007/s10549-011-1916-1 [DOI] [PMC free article] [PubMed] [Google Scholar]
- 51.Daly B, Olopade OI (2015) A perfect storm: How tumor biology, genomics, and health care delivery patterns collide to create a racial survival disparity in breast cancer and proposed interventions for change. CA Cancer J Clin 65(3):221–238. 10.3322/caac.21271 [DOI] [PubMed] [Google Scholar]
- 52.Ward E, Jemal A, Cokkinides V et al. (2004) Cancer disparities by race/ethnicity and socioeconomic status. CA Cancer J Clin 54(2):78–93. 10.3322/canjclin.54.2.78 [DOI] [PubMed] [Google Scholar]
- 53.Magai C, Consedine NS, Adjei BA, Hershman D, Neugut A (2008) Psychosocial influences on suboptimal adjuvant breast cancer treatment adherence among African American women: implications for education and intervention. Health Educ Behav 35(6):835–854. 10.1177/1090198107303281 [DOI] [PubMed] [Google Scholar]
- 54.Chen JY, Diamant AL, Thind A, Maly RC (2008) Determinants of breast cancer knowledge among newly diagnosed, low-income, medically underserved women with breast cancer. Cancer 112(5):1153–1161. 10.1002/cncr.23262 [DOI] [PubMed] [Google Scholar]
- 55.Freedman RA, Virgo KS, He Y et al. (2011) The association of race/ethnicity, insurance status, and socioeconomic factors with breast cancer care. Cancer 117(1):180–189. 10.1002/cncr.25542 [DOI] [PubMed] [Google Scholar]
- 56.Mujumdar V, Butler TR, Shalowitz DI (2021) A qualitative study on the impact of long-distance travel for gynecologic cancer care. Gynecol Oncol Rep. 38:100868. 10.1016/j.gore.2021.100868 [DOI] [PMC free article] [PubMed] [Google Scholar]
- 57.Wolfe MK, McDonald NC, Holmes GM (2020) Transportation barriers to health care in the United States: findings from the national health interview survey, 1997–2017. Am J Public Health 110(6):815–822. 10.2105/AJPH.2020.305579 [DOI] [PMC free article] [PubMed] [Google Scholar]
- 58.Wheeler SB, Spencer JC, Pinheiro LC, Carey LA, Olshan AF, Reeder-Hayes KE (2018) Financial impact of breast cancer in black versus white women. J Clin Oncol 36(17):1695–1701. 10.1200/JCO.2017.77.6310 [DOI] [PMC free article] [PubMed] [Google Scholar]
- 59.McDermott AM, Wall DM, Waters PS et al. (2013) Surgeon and breast unit volume-outcome relationships in breast cancer surgery and treatment. Ann Surg 258(5):808–814. 10.1097/SLA.0b013e3182a66eb0 [DOI] [PubMed] [Google Scholar]
- 60.Kong AL, Pezzin LE, Nattinger AB (2015) Identifying patterns of breast cancer care provided at high-volume hospitals: a classification and regression tree analysis. Breast Cancer Res Treat 153(3):689–698. 10.1007/s10549-015-3561-6 [DOI] [PubMed] [Google Scholar]
- 61.Bilimoria KY, Bentrem DJ, Stewart AK, Winchester DP, Ko CY (2009) Comparison of commission on cancer-approved and -non-approved hospitals in the United States: implications for studies that use the national cancer data base. J Clin Oncol 27(25):4177–4181. 10.1200/JCO.2008.21.7018 [DOI] [PubMed] [Google Scholar]
- 62.Tutt ANJ, Garber JE, Kaufman B et al. (2021) Adjuvant Olaparib for Patients with BRCA1- or BRCA2-Mutated Breast Cancer. N Engl J Med 384(25):2394–2405. 10.1056/NEJMoa2105215 [DOI] [PMC free article] [PubMed] [Google Scholar]
- 63.von Minckwitz G, Huang CS, Mano MS et al. (2019) Trastuzumab Emtansine for residual invasive HER2-positive breast cancer. N Engl J Med 380(7):617–628. 10.1056/NEJMoa1814017 [DOI] [PubMed] [Google Scholar]
- 64.Esserman L (2016) The I-SPY approach to drug development. Clin Adv Hematol Oncol 14(10):782–784 [PubMed] [Google Scholar]
- 65.Campbell JI, Yau C, Krass P et al. (2017) Comparison of residual cancer burden, American Joint Committee on Cancer staging and pathologic complete response in breast cancer after neoadjuvant chemotherapy: results from the I-SPY 1 TRIAL (CALGB 150007/150012; ACRIN 6657). Breast Cancer Res Treat 165(1):181–191. 10.1007/s10549-017-4303-8 [DOI] [PMC free article] [PubMed] [Google Scholar]
Associated Data
This section collects any data citations, data availability statements, or supplementary materials included in this article.
Data Availability Statement
Enquiries about data availability should be directed to the authors.