

Abstract
Objective:
To assess whether an obesity paradox (lower event rates with higher body mass index [BMI]) exists in participants with advanced chronic kidney disease (CKD) and chronic coronary disease in the International Study of Comparative Health Effectiveness of Medical and Invasive Approaches (ISCHEMIA)-CKD, and whether BMI modified the effect of initial treatment strategy.
Methods:
Baseline BMI was analyzed as both a continuous and categorical variable (<25, 25-<30, ≥30 kg/m2). Associations between BMI and the primary outcome of all-cause death or myocardial infarction (D/MI), as well as all-cause death, cardiovascular death, and MI individually were estimated. Associations with health status were also evaluated using the Seattle Angina Questionnaire-7, the Rose Dyspnea Scale, and the EuroQol-5D Visual Analog Scale.
Results
BMI ≥30 kg/m2 versus <25 kg/m2 demonstrated increased risk for MI (hazard ratio [HR] (95% confidence interval) = 1.81 (1.12, 2.92)) and for D/MI (HR 1.45 (1.06, 1.96)) with a HR for MI of 1.22 (1.05, 1.40) per 5 kg/m2 increase in BMI in unadjusted analysis. In multivariable analyses, BMI ≥30 kg/m2 was marginally associated with D/MI (HR 1.43 (1.00, 2.04)) and greater dyspnea throughout follow up (P < 0.05 at all time points). Heterogeneity of treatment effect between baseline BMI was not evident for any outcome.
Conclusions
In ISCHEMIA-CKD, an obesity paradox was not detected. Higher BMI was associated with worse dyspnea, and a trend toward increased D/MI and MI risk. Larger studies to validate these findings are warranted.
Keywords: Body mass index, chronic kidney disease, coronary artery disease, death, dialysis, myocardial infarction, obesity, obesity paradox
Introduction
Although overweight and obesity are associated with greater mortality and cardiovascular morbidity in patients without known cardiovascular disease, a paradoxical relationship between body mass index (BMI) and clinical outcomes has been observed in patients with cardiovascular disease.1–4 For example, the International VErapamil SR-trandolopril Study demonstrated that participants with chronic coronary disease and hypertension with Class I obesity (BMI 30 to 35 kg/m2) had a lower risk for all-cause mortality, non-fatal myocardial infarction or non-fatal stroke than those with normal BMI (20 to 25 kg/m2).4
Comorbid diseases, such as chronic kidney disease, may confound the association of BMI with outcomes in cardiovascular disease, especially since a similar paradox has been described among general chronic kidney disease populations. Whether an obesity paradox is present in patients with specific comorbid diseases, such as chronic coronary disease and chronic kidney disease, has not been previously reported. The co-existence of chronic kidney disease with cardiovascular diseases, such as chronic coronary disease, significantly increases the risk for mortality.5 Understanding the relationship of a modifiable risk factor, such as BMI, in high-risk subsets such as those with chronic kidney disease and chronic coronary disease remains an important gap in knowledge.
The International Study of Comparative Health Effectiveness with Medical and Invasive Approaches–Chronic Kidney Disease (ISCHEMIA-CKD) (NCT01985360) examined whether an invasive strategy added to guideline directed medical therapy reduces cardiovascular events when compared with an initially conservative strategy of medical therapy alone in participants with advanced chronic kidney disease and at least moderate myocardial ischemia.6 ISCHEMIA-CKD found no benefit from an initial invasive strategy for the primary outcome of death or nonfatal myocardial infarction or for angina-related health status (symptoms, functional status, and health-related quality of life).7,8 The objective of this post hoc analysis was to assess whether BMI independently correlates with clinical and health status outcomes, and whether the associations vary by treatment assignment to an initially invasive or conservative strategy.
Methods
Baseline BMI and risk factor measurements
The design of the ISCHEMIA-CKD trial has been reported previously.6 Participants with documented chronic kidney disease G 4–5 (estimated glomerular filtration rate [eGFR] <30 mL/min/1.73 m2 and not on dialysis) or on dialysis (chronic kidney disease G5D), with at least moderate myocardial ischemia on stress testing were randomized to an initial invasive or a conservative management strategy, with efforts to optimize guideline-directed medical therapy in both groups. Follow-up was planned for 3 years with visits occurring at 6 weeks, 3, 6, and 12 months, and every 6 months thereafter. The median follow-up period was 2.2 years.7
We calculated BMI as weight (in kilograms) divided by height (in meters) squared (kg/m2) for each participant using baseline data. BMI was categorized as <25 kg/m2 (thin or normal), ≥25 to <30 kg/m2 (overweight), and ≥30 kg/m2 (obese).
Clinical and health status outcomes
We examined the effect of baseline BMI on the ISCHEMIA-CKD primary composite outcome of all-cause death or nonfatal myocardial infarction, which were adjudicated by an independent clinical events committee whose members were blinded to treatment assignment. We also examined the effect of baseline BMI on the individual outcomes of all-cause death, cardiovascular death, nonfatal myocardial infarction, and health status as secondary outcomes. Health status was assessed using the 7-item Seattle Angina Questionnaire, the Rose Dyspnea Scale, and the European Quality of Life–5 Dimensions Visual Analogue Scale.9–11 The Seattle Angina Questionnaire includes 3 domains including physical limitation, angina frequency, and quality of life related to angina symptoms; individual domain scores and a summary score were separately evaluated.10 Seattle Angina Questionnaire-7 and European Quality of Life–5 Dimensions Visual Analogue Scale scores range 0–100, with 100 indicating perfect health and 0 indicating death. Rose Dyspnea Scale scores range from 0–4, with higher scores denoting worse dyspnea symptoms.
Guideline-directed medical therapy
Guideline-directed medical therapy goals were recommended for all participants.7 The goals were defined as: smoking cessation; systolic blood pressure <140 mm/Hg (later revised to <130 mmHg); low density lipoprotein cholesterol <70 mg/dL and on any statin; and taking aspirin or other antiplatelet or anticoagulant therapy. Guideline-directed medical therapy goal attainment per participant was assessed at each follow-up visit.
Statistical analysis
For descriptive analyses, categorical variables are presented as frequencies and percentages, and continuous variables are summarized as medians and quartiles or means and standard deviations. We describe baseline characteristics of participants by categories of BMI: <25, ≥25 to <30, and ≥30 kg/m2. Cumulative event probabilities for clinical outcomes for each BMI category were estimated using the Kaplan–Meier method for all-cause death and the composite of all-cause death/myocardial infarction, and by a nonparametric cumulative-incidence function estimator for outcomes that were subject to competing risks (e.g., cardiovascular death, for which death from non-cardiovascular causes is a competing risk).12 A Cox model was created to assess the independent association of BMI with clinical outcomes. The proportional hazards assumption was not violated for the outcomes of interest; proportional hazard assumption was checked through the graphical display of the empirical score process based on the Martingale residuals accompanied by the Kolmogorov-Smirnov test. Multivariable models evaluated the association of both continuous BMI and BMI categories with clinical outcomes by treatment effect included adjustment for baseline age, sex, hypertension, diabetes, smoking status, atrial fibrillation, prior myocardial infarction, prior percutaneous coronary intervention or coronary artery bypass grafting, prior heart failure, ejection fraction, prior stroke, peripheral artery disease, Seattle Angina Questionnaire-7 Summary Score, Canadian Cardiovascular Society (CCS) Angina (I/II/III), New York Heart Association (NYHA) I/II/III, low-density lipoprotein cholesterol and high-density lipoprotein cholesterol. The non-linearity of the association between continuous BMI and clinical outcomes was assessed using cubic splines. Linearity was not violated for any outcome. As a result, hazard ratios associated with 5 kg/m2 increase in BMI were reported.
The association of BMI with health status was evaluated using proportional odds regression models, which treat the outcomes as ordinal variables. Separate analyses were performed at baseline, 3, 12, and 24 months. At each time point, both unadjusted and adjusted odds ratios were estimated, the latter adjusting for the same variables included in the analyses of clinical events and baseline health status using the same baseline score for the outcome being modeled. Thus, baseline analyses estimate the cross-sectional association of BMI with health status across the study population at time of randomization, and follow-up analyses estimate the prognostic association of baseline BMI with health status outcomes for participants with the same baseline health status. For consistency in interpretation, all model estimates were scaled so that odds ratios represent the change in odds of better health status per 5 kg/m2 increase in BMI. The linearity of the association of BMI with health status outcomes was assessed using restricted cubic splines. Evidence of non-linearity was found for three outcomes: baseline Physical Limitation (P=0.03), baseline Rose Dyspnea Scale (P=0.03) and baseline European Quality of Life–5 Dimensions Visual Analogue Scale (P<0.001). However, the degree of narity was modest in these cases. All associations were monotonic and were broadly consistent across times points. For consistency and ease of interpretation, all model estimates are presented as linear effects.
Interaction terms between BMI and randomized treatment strategy were included to evaluate whether the relationship between BMI and clinical or health status outcomes differed by management strategy. As no significant interactions were found (P>0.05 for all outcomes), the interaction terms were excluded, and the results presented here are pooled across treatment groups.
Health status assessment completion rates (initial invasive: 85.2%, conservative: 88.9% at 1 year; initial invasive: 85.8%, conservative: 87.4% at 2 years) were described in the primary health status paper for ISCHEMIA-CKD.13 Missing health status scores were imputed using multiple imputation by chained equations, incorporating all baseline and follow-up variables; analyses were performed on 25 imputed data sets and results were pooled using Rubin’s method to obtain final model estimates.14 P values were not adjusted for multiple comparisons. Two-tailed P<0.05 was used as the threshold for evidence of a statistical difference between groups. Analyses were performed with the use of SAS software (version 9.4; SAS, Cary, NC) and R version 3.6315.
Results
Baseline Characteristics by BMI Category
Of the 777 participants randomized in ISCHEMIA-CKD, 4 were excluded due to missing baseline BMI. Participants with BMI ≥30 kg/m2 were younger, more likely to have hypertension, diabetes, atrial fibrillation, and a history of prior percutaneous coronary intervention or stroke (Table 1) whereas participants with BMI ≤25 kg/m2 were more likely to be on chronic dialysis at baseline (Table 1). Those who were not on dialysis at baseline but started dialysis during trial follow-up had the highest baseline BMI (30.1 kg/m2 versus 27.7 kg/m2 for those never on dialysis throughout study follow up, and 25.8 kg/m2 for those on dialysis at baseline; P<0.0001). BMI remained stable over the study period (Supplemental Figure). BMI was the same between randomized strategy groups (mean 28.0 kg/m2 in both initial invasive and conservative arms).
Table 1.
Baseline characteristics of participants enrolled in ISCHEMIA-CKD by BMI category*.
| Baseline BMI (Kg/m2) | P value | |||
|---|---|---|---|---|
| <25.0 (N=274) |
≥25.0 and <30.0 (N=246) |
≥30.0 (N=253) |
||
| Demographics | ||||
| Age at randomization (years) | 62 (54, 69) | 65 (56, 72) | 63 (57, 69) | 0.026 |
| Male | 70.4 | 72.0 | 63.6 | 0.10 |
| Clinical History | ||||
| Hypertension | 87.2 | 93.0 | 96.0 | <0.001 |
| Diabetes | 47.1 | 54.5 | 70.8 | <0.001 |
| Prior myocardial infarction | 15.8 | 16.3 | 19.8 | 0.42 |
| Cigarette smoking | 0.06 | |||
| Never smoked | 52.6 | 48.4 | 42.3 | |
| Former smoker | 35.8 | 40.7 | 48.6 | |
| Current smoker | 11.7 | 11.0 | 9.1 | |
| Prior PCI | 13.9 | 20.3 | 22.9 | 0.023 |
| Prior CABG | 2.9 | 3.3 | 4.7 | 0.50 |
| Atrial fibrillation/atrial flutter | 6.6 | 7.3 | 13.0 | 0.019 |
| Prior stroke | 5.8 | 9.3 | 11.5 | 0.070 |
| Prior peripheral artery disease | 6.2 | 8.1 | 4.3 | 0.22 |
| History of HF (diagnosis of prior HF or LVEF <45%) | 24.5 | 22.8 | 28.9 | 0.27 |
| LVEF (%) | 59 (50, 64) | 60 (50, 65) | 56 (50, 61) | 0.22 |
| HF status over the past month, n/N (%) | 0.36 | |||
| None | 50.0 | 47.6 | 41.9 | |
| NYHA Class I | 15.7 | 18.7 | 18.2 | |
| NYHA Class II/III/IV | 34.3 | 33.7 | 39.9 | |
| Laboratory Values | ||||
| LDL cholesterol (mg/dL) | 81.0 (55.0, 107.5) | 87.0 (65.0, 110.0) | 83.0 (57.0, 120.0) | 0.18 |
| HDL cholesterol (mg/dL) | 40.2 (34.0, 50.3) | 41.0 (34.0, 49.5) | 36.9 (30.9, 47.0) | <0.001 |
| Renal Disease-related Measures | ||||
| Estimated GFR from enrollment among those not on dialysis (mL/min/1.73m2) | 22 (16, 27) | 23 (17, 26) | 23 (18, 27) | 0.83 |
| On dialysis at baseline | 64.2 | 47.2 | 47.0 | <0.001 |
| Duration of dialysis (years) | 3 (1, 6) | 3 (1, 5) | 2 (1, 4) | 0.06 |
Categorical variables are displayed as percentages of the total; continuous variables are displayed as median (interquartile range).
BMI, body mass index; CABG, coronary artery bypass grafting; CV, cardiovascular; GFR, glomerular filtration rate; HDL, high density lipoprotein; HF, heart failure; LVEF, left ventricular ejection fraction; LDL, low density lipoprotein; NYHA, New York Heart Association, PCI, percutaneous coronary intervention
BMI and guideline-directed medical therapy
At baseline, the proportion of participants with 0, 1, 2, 3 or 4 guideline-directed medical therapy goals at target were similar across BMI categories (Supplemental Table 1). Achievement of 3 and 4 guideline-directed medical therapy goals at the last visit was not different among the BMI categories (45.3% and 22.2% in the BMI <25 kg/m2 category, 45.6% and 27.8% in the category with BMI ≥25 to <30 kg/m2, and 47.6% and 29.6% in the category with BMI ≥30 kg/m2, respectively). Achievement of individual guideline-directed medical therapy goals was not statistically different between BMI categories at 12 months or last visit (Supplemental Table 1).
BMI and clinical outcomes
The 3-year cumulative incidence rates of all-cause death/myocardial infarction, all-cause death, and cardiovascular death were similar across BMI categories (Table 2). A higher cumulative incidence rate for myocardial infarction with higher BMI category was observed (P=0.039) (Table 2). Bivariate analysis of pairs of categories with BMI <25 kg/m2 as the reference category demonstrated a significantly higher hazard for the primary outcome, and myocardial infarction for the ≥30 kg/m2 category (Table 3a). In multivariable analyses (Table 3a), despite similar directionality, the hazard ratio was no longer significant for the ≥30 kg/m2 category relative to the <25 kg/m2 category (all-cause death/myocardial infarction: HR= 1.43, [95%CI 1.00, 2.04]; myocardial infarction: HR= 1.26, [0.8, 1.97]).
Table 2:
Cumulative incidence rate and 95% confidence intervals at 3 years for clinical outcomes of participants enrolled in ISCHEMIA-CKD by BMI category.
| Clinical Outcomes (%) | Baseline BMI (Kg/m2) | |||
|---|---|---|---|---|
| <25.0 (N=274) |
≥25.0 and <30.0 (N=246) |
≥30.0 (N=253) |
P value | |
| Death or MI | 28.7 (22.6,35.0) |
39.5 (31.9,46.9) |
41.2 (33.8,48.3) |
0.06 |
| All-cause death | 22.5 (17.1,28.5) |
29.1 (22.5,35.9) |
30.4 (23.6,37.4) |
0.31 |
| CV death | 19.4 (14.4,25.1) |
22.1 (16.4,28.2) |
26.5 (20.0,33.3) |
0.53 |
| MI | 11.1 (7.3,15.8) |
15.5 (10.4,21.5) |
19.9 (14.5,25.8) |
0.039 |
All data presented as % (95% CI). BMI, body mass index; CV, cardiovascular; MI, myocardial infarction.
Table 3a:
Bivariate and Multivariable analysisa of the relationship between baseline BMI categories and clinical outcomes.
| Death/MI | Death | CV Death | MI | |
|---|---|---|---|---|
| BMI category (kg/m2) | HR (95% CI) | HR (95% CI) | HR (95% CI) | HR (95% CI) |
| Bivariate Analysis | ||||
| <25 | ref | ref | ref | ref |
| 25- <30 | 1.27 (0.93,1.75) |
1.22 (0.85,1.75) |
1.11 (0.74,1.64) |
1.25 (0.74,2.10) |
| ≥30 | 1.45 (1.06,1.96) |
1.31 (0.92,1.86) |
1.25 (0.86,1.84) |
1.81 (1.12,2.92) |
| Multivariable Analysis | ||||
| <25 | ref | ref | ref | ref |
| 25- <30 | 1.3 (0.92, 1.85) |
1.38 (0.93,2.06) |
1.07 (0.6, 1.9) |
1.21 (0.78, 1.88) |
| ≥30 | 1.43 (1.00, 2.04) |
1.42 (0.94,2.15) |
1.29 (0.73, 2.27) |
1.26 (0.8, 1.97) |
BMI, body mass index; CI, confidence interval; HR, hazard ratio; MI, myocardial infarction; ref: reference.
With adjustment of baseline covariates: randomized treatment, age, sex, hypertension, diabetes, current smoker, atrial fibrillation, dialysis at baseline, prior myocardial infarction/percutaneous coronary intervention/coronary artery bypass grafting, prior heart failure, ejection fraction, prior stroke, prior peripheral arterial disease, baseline Seattle Angina Questionnaire summary score, Canadian Cardiovascular Society Angina (I/II/III), New York Heart Association I/II/III, baseline low density lipoprotein- and high density lipoprotein-cholesterol.
Similarly, unadjusted analyses revealed an association with every 5 kg/m2 increase in BMI and myocardial infarction (HR 1.22 [95%CI: 1.05, 1.40] P=0.007) (Table 3b), but was not significant in multivariable analysis (Table 3b). No heterogeneity in the association between ISCHEMIA-CKD management strategy group and BMI at baseline was identified for any clinical outcome (all interaction P values >0.05; Supplemental Table 2).
Table 3b:
Bivariate and multivariable relationships between continuous baseline BMI and clinical outcomes
| Clinical Outcomes | Bivariate HR (95% CI) associated with 5 unit increase of BMI (kg/m2) | Multivariable HR (95% CI) associated with 5 unit increase of BMIa (kg/m2) |
|---|---|---|
| Death/MI | 1.09 (0.98,1.20) | 1.09 (0.97, 1.23) |
| All-cause death | 1.04 (0.92,1.16) | 1.06 (0.92, 1.21) |
| CV death | 1.02 (0.89,1.16) | 1.01 (0.87, 1.18) |
| MI | 1.22 (1.05,1.4) | 1.12 (0.93, 1.34) |
Multivariable model adjusted for baseline covariates: age, sex, hypertension, diabetes, current smoker, atrial fibrillation, prior MI or prior PCI or prior CABG, prior heart failure, ejection fraction, prior stroke, peripheral artery disease, baseline Seattle Angina Questionnaire Summary Score, Canadian Cardiovascular Society Angina (I/II/III), New York Heart Association I/II/III, baseline low density lipoprotein- and high-density lipoprotein-cholesterol, dialysis status at baseline;
BMI was modeled in its original form; Other continuous covariates are modeled as cubic splines
BMI, body mass index; CI, confidence interval; CV, Cardiovascular; HR, hazard ratio; MI, myocardial infarction.
BMI and health status
At baseline, higher BMI was associated with poorer health status by Seattle Angina Questionnaire-7 summary score (median score 82.8, 77.8, 75.0 for BMI <25, 25 to <30, and ≥30, respectively; P=0.004), a difference driven largely by greater physical limitations (median score 91.7, 83.3, 66.7 for BMI <25, 25 to <30, ≥30, respectively; P<0.001; Table 4a and Figure). Higher BMI was associated with worse dyspnea as indicated by a higher Rose Dyspnea Scale score, and worse general self-perception of health as indicated by lower rating on European Quality of Life-5 Dimensions visual analogue scale (Table 4a, Figure).
Table 4a.
Baseline health status scores for participants enrolled in the ISCHEMIA-CKD triala.
| Mean ± SD Median (IQR) |
Baseline BMI (kg/m) | P-Value | ||
|---|---|---|---|---|
| <25 (N = 235) | 25 to <30 (N = 226) | ≥30 (N = 241) | ||
| SAQ-7 Summary Score | 79.7 ± 17.6 82.8 (68.3, 95.8) |
75.6 ± 18.7 77.8 (60.0, 92.5) |
73.6 ± 20.7 75.0 (60.0, 93.8) |
0.004 |
| SAQ-7 Angina Frequency Score | 89.2 ± 14.6 100.0 (80.0, 100.0) |
86.4 ± 17.3 90.0 (80.0, 100.0) |
86.2 ± 19.9 90.0 (80.0, 100.0) |
0.28 |
| SAQ-7 Quality of Life Score | 69.3 ± 25.6 75.0 (50.0, 100.0) |
64.4 ± 27.4 62.5 (37.5, 87.5) |
65.1 ± 29.3 62.5 (37.5, 87.5) |
0.16 |
| SAQ-7 Physical Limitation Score | 81.3 ± 22.0 91.7 (66.7, 100.0) |
76.3 ± 23.2 83.3 (66.7, 100.0) |
67.6 ± 27.5 66.7 (50.0, 91.7) |
<0.001 |
| Rose Dyspnea Scale | 1.2 ± 1.4 1.0 (0.0, 2.0) |
1.4 ± 1.4 1.0 (0.0, 3.0) |
1.9 ± 1.5 2.0 (1.0, 4.0) |
<0.001 |
| EQ-5D Visual Analog Scale | 61.8 ± 17.0 60.0 (50.0, 75.0) |
63.7 ± 15.7 65.0 (50.0, 75.0) |
57.9 ± 19.7 60.0 (50.0, 70.0) |
0.007 |
Continuous variables compared using Kruskal-Wallis test.
Categorical variables compared using chi-square or Fisher’s exact test.
Main Manuscript Figure:
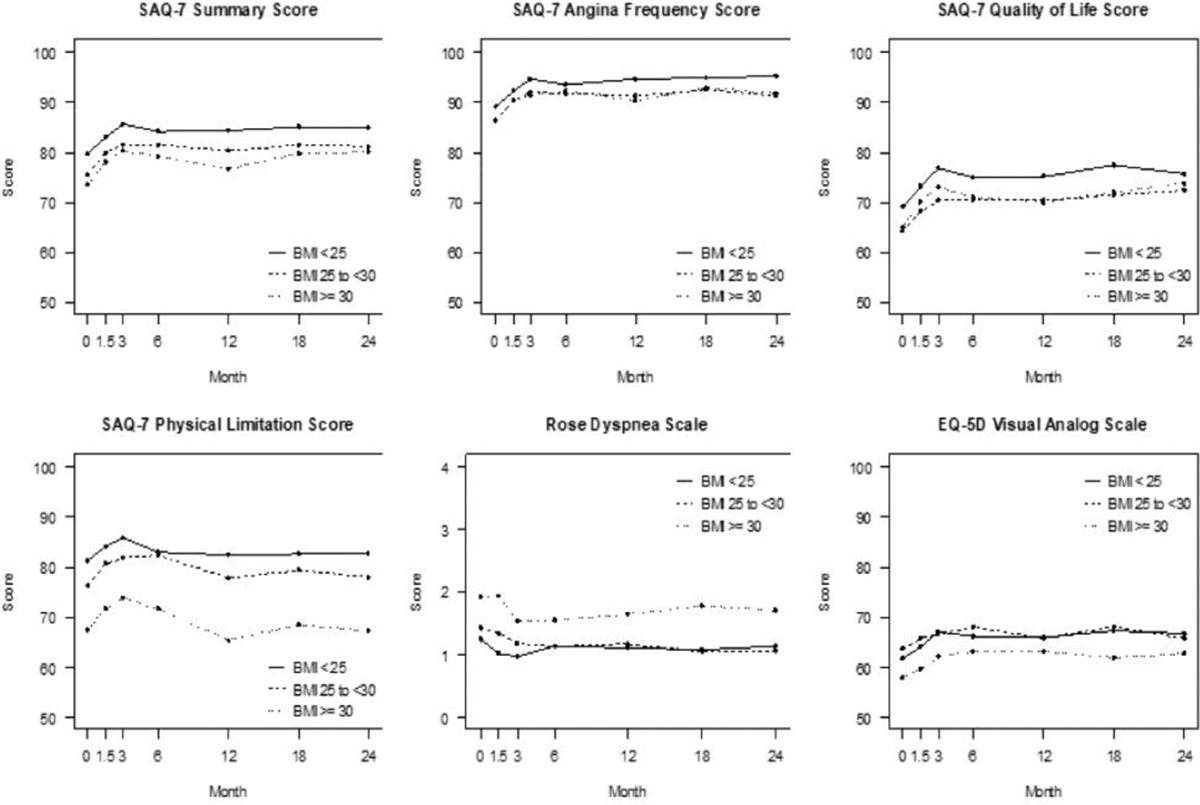
Health status scores based on BMI category. Panels represent the different health status measures assessed during the study follow-up (0: baseline, 1.5 months, 3 months, 6 months, then every 6 months until 24 months). EQ-5D: Euroqol 5D visual analog scale; SAQ-7: Seattle Angina Questionnaire −7.
Throughout follow-up, greater symptomatic dyspnea, as indicated by higher Rose Dyspnea Scale scores, and decreased physical function, as indicated by lower Seattle Angina Questionnaire-7 Physical Limitation scores, were reported by participants with higher baseline BMI. By the 24-month visit, overall self-reported health-status had improved among all BMI categories (Figure). At 24 months, the associations of baseline BMI with Seattle Angina Questionnaire-7 Physical Limitation and Rose Dyspnea Scale scores were attenuated (ORs 0.84 [95% CI: 0.69, 1.03] and 0.88 [95% CI: 0.75, 1.02], respectively) after adjusting for baseline health status and participant characteristics (Table 4b). There were no interactions between management strategy group and BMI for any health status outcomes (Table 4b).
Table 4b.
Health status scores for participants enrolled in the ISCHEMIA-CKD trial as a function of BMI (per 5kg/m2).a
| Health Status Measure | Month | Odds Ratio (95% CI)b | Treatment Interaction P-value |
|---|---|---|---|
| SAQ-7 Summary Score | 0 | 0.84 (0.75, 0.95) | |
| 3 | 0.92 (0.81, 1.04) | 0.34 | |
| 12 | 0.90 (0.79, 1.02) | 0.19 | |
| 24 | 1.01 (0.88, 1.15) | 0.91 | |
| SAQ-7 Angina Frequency Score | 0 | 0.94 (0.81, 1.08) | |
| 12 | 0.86 (0.74, 1.02) | 0.06 | |
| 24 | 0.93 (0.77, 1.11) | 0.51 | |
| SAQ-7 Quality of Life Score | 0 | 0.96 (0.85, 1.09) | |
| 3 | 0.97 (0.85, 1.11) | 0.89 | |
| 12 | 0.97 (0.85, 1.11) | 0.37 | |
| 24 | 1.07 (0.93, 1.24) | 0.59 | |
| SAQ-7 Physical Limitation Score | 0 | 0.70 (0.60, 0.81) | |
| 3 | 0.87 (0.74, 1.04) | 0.16 | |
| 12 | 0.82 (0.69, 0.97) | 0.11 | |
| 24 | 0.84 (0.69, 1.03) | 0.79 | |
| Rose Dyspnea Scale | 0 | 0.68 (0.60, 0.78) | |
| 3 | 0.81 (0.70, 0.93) | 0.82 | |
| 12 | 0.79 (0.68, 0.93) | 0.58 | |
| 24 | 0.88 (0.75, 1.02) | 0.43 | |
| EQ-5D Visual Analog Scale | 0 | 0.81 (0.71, 0.92) | |
| 3 | 0.87 (0.77, 0.99) | <0.001 | |
| 12 | 0.98 (0.86, 1.12) | 0.97 | |
| 24 | 0.93 (0.81, 1.08) | 0.73 |
CI, confidence interval; EQ-5D, European Quality of Life–5 Dimensions; SAQ, Seattle Angina Questionnaire.
For the Seattle Angina Questionnaire-7 (SAQ-7) and the Euroqol-5D (EQ-5D) scores, a higher score indicates better health status. For example, at baseline, a higher BMI was associated with an OR of 0.84 with the SAQ-7 summary score indicating higher (per 5 kg/m2 increase) BMI was associated with a lower SAQ-7 score and thus worse health status. In contrast, higher Rose Dyspnea Scale (RDS) score represents worse dyspnea. For consistency, the OR for RDS was evaluated for the interpretation of RDS (e.g. more or less dyspnea) such that the interpretation of the OR is the same as for SAQ-7 and EQ-5D: e.g. the OR for RDS at baseline was 0.68, indicating that higher BMI is associated with worse dyspnea (not lower RDS score).
With adjustment of baseline covariates: age, sex, hypertension, diabetes, current smoker, atrial fibrillation, prior MI or prior PCI or prior CABG, prior heart failure, ejection fraction, prior stroke, peripheral artery disease, baseline Seattle Angina Questionnaire Summary Score, Canadian Cardiovascular Society Angina (I/II/III), New York Heart Association I/II/III, baseline low density lipoprotein- and high-density lipoprotein-cholesterol.
Follow-up health status associations also include adjustment for baseline health status.
Association between body mass index (BMI) and angina-related health status measure allowing for non-linearity.
Discussion
In light of emerging treatments for obesity, defining the independent associations of obesity on clinical outcomes is becoming increasingly important. As a post hoc analysis of ISCHEMIA-CKD, the largest contemporary trial of treatment strategy for chronic coronary disease in advanced chronic kidney disease, we examined the relationship of BMI with clinical outcomes and health status and found no significant independent associations, though there was a trend toward a greater risk for myocardial infarction and the primary outcome of all-cause death/myocardial infarction, and dyspnea and physical limitations with higher BMI. No treatment by BMI interactions were observed for any of the outcomes.
The current analysis is the first to examine the relationship of BMI to cardiovascular outcomes and mortality in participants with chronic coronary disease and advanced chronic kidney disease. Prior work analyzed general chronic kidney disease cohorts and focused on all-cause mortality. More than two decades ago, Fleischmann et al. described an obesity paradox among a cohort with end-stage kidney disease on hemodialysis.16 In this cohort living in the Southern United States, the authors found a significant 4% relative risk reduction in mortality with higher BMI. Subsequent analyses in a multinational general end stage kidney disease cohort (Dialysis Outcomes and Practice Patterns Study) demonstrated similar findings.17 In the current study, however, among participants with advanced chronic kidney disease (including those on dialysis) and chronic coronary disease, BMI was not associated with all-cause or cardiovascular-mortality in ISCHEMIA-CKD. In contrast, there was a trend toward higher risk of myocardial infarction with higher BMI (≥30 kg/m2), which does not support the concept of an obesity paradox in the population with advanced chronic kidney disease and chronic coronary disease.
The reasons for discordance between prior studies in the overall chronic kidney disease and end stage kidney disease populations compared with the current analysis are not immediately evident. Prior observational studies may have been unable to account for confounding by underlying severity of illness, especially in the lower BMI cohorts.18–20 By balancing covariates across management strategies, our study can more accurately assess whether obesity alters the benefits of an invasive or conservative management strategy group across a range of outcomes. Furthermore, ISCHEMIA-CKD targeted aggressive cardiovascular risk factor reduction among all trial participants, including smoking cessation, blood pressure control, aspirin, and statins. Risk factor goal attainment improved across all BMI categories by 12 months and/or last visit, possibly mitigating the association of lower BMI and poor health status in the advanced chronic kidney disease population. Finally, changing weight over time may also have an important relationship with outcomes in the advanced chronic kidney disease population. Ku et al. demonstrated a >40% increased hazard for death following dialysis initiation in those with >5% weight loss per year in the years preceding dialysis initiation, as compared with those who had stable weight in the year preceding dialysis initiation.21 No significant change in weight was observed among the study participants in ISCHEMIA-CKD regardless of baseline BMI; thus, our results appear to support the findings of Ku et al.
Additionally, the current analysis allowed an evaluation of the influence of BMI with various measures of health status in this population with advanced chronic kidney disease and chronic coronary disease. Obesity was associated with persistently worse dyspnea scores, which is consistent with other cohorts such as those with heart failure.22 Our findings suggest that despite the potentially inconsistent relationship of obesity and mortality in participants with advanced chronic kidney disease, important health status outcomes that relate to self-perceived quality of life, such as dyspnea, are adversely affected by being obese. This adds to the conclusions of a recent review on the adverse effects of obesity in chronic kidney disease, which emphasized the importance of additional non-mortality related outcomes such as faster progression of chronic kidney disease and limited access to kidney transplantation with higher BMI.23
Study strengths and limitations
The strength of the present analysis lies in the well characterized population within the context of a randomized controlled trial. This allows for thorough ascertainment of comorbidities as well as detailed assessment of relevant health outcomes, including measures of health status. In addition, uniform efforts to support guideline-directed medical therapy maximization was directed towards all participants to ensure optimization of risk factors, as previously reported in ISCHEMIA-CKD.24 This allows a greater ability to isolate the relationship between BMI and clinical outcomes. Nevertheless, the present analysis should be interpreted in the context of the following potential limitations. First, our results do not apply to patients who were excluded from randomization, including those with less severe ischemia, recent acute coronary syndromes, left ventricular ejection fraction <35%, or severe valvular heart disease. Second, the trial population included few participants in the extremes of weight (BMI <18 kg/m2or >40 kg/m2); thus, the findings do not apply to these populations. Third, specific measures of body composition (muscle, fat, and water) were not available for this analysis; these measures could provide more meaningful associations of metabolic status and cardiovascular risk.25 Fourth, given the stable weight across the study among participants, modification of high BMI as a therapeutic target cannot be assessed. Finally, while the comparisons of treatment strategies by BMI are unlikely to be biased, the comparisons of outcomes across BMI categories may be attributable to unmeasured confounding.
Conclusion
Among participants with chronic kidney disease G4–5D and chronic coronary disease, we did not observe a paradoxical association between BMI and the composite of all-cause death or myocardial infarction, or the individual subcomponents. We observed a direct association between higher BMI and worsening dyspnea, and a trend toward increased risk of myocardial infarction. Further studies will be needed to confirm these findings and to determine the prognostic benefit of weight loss interventions in patients with chronic coronary disease and advanced chronic kidney disease.
Supplementary Material
Supplemental Figure: BMI at each study visit based on category.
Highlights.
An obesity paradox was not seen in ISCHEMIA-CKD cohort.
Obesity may increase death/myocardial infarction risk in advanced chronic kidney disease and chronic coronary disease.
Obesity is associated with greater dyspnea in advanced chronic kidney disease and chronic coronary disease.
There was no body mass index by treatment assignment interaction for the primary outcome in ISCHEMIA-CKD.
Acknowledgements:
The authors would like to acknowledge Dr. Kristina Wasson Blader, PhD, ELS, who provided editorial assistance.
Sources of Funding:
NIH Grants U01HL117904 and U01HL117905
Other Support:
This project was supported by grants from Arbor Pharmaceuticals LLC and AstraZeneca Pharmaceuticals LP. Devices or medications were provided by Abbott Vascular (previously St. Jude Medical, Inc); Medtronic, Inc.; Phillips (previously Volcano Corporation); and Omron Healthcare, Inc.; medications provided by Arbor Pharmaceuticals, LLC; AstraZeneca Pharmaceuticals, LP; Espero Pharmaceuticals; Merck Sharp & Dohme Corp. and Sunivion Pharmaceuticals
Disclosure Statements:
Dr. Mathew, Kretov, O’Brien, Newman, Maron and Ms. Huang reports grants from National Heart, Lung, and Blood Institute, during the conduct of the study.
Dr. Sidhu reports grants from National Heart, Lung, and Blood Institute during the conduct of the study; personal fees from Astra Zeneca, personal fees from Sanofi-Regeneron, outside the submitted work.
Dr. Rangaswami reports consultant work for Boehringer Ingelheim/Lily, Edward Lifesciences, and Astra Zeneca and advisory board participation for Procyrion Inc (Aortix) outside of the submitted work.
Dr. Stone reports grants from National Heart, Lung, and Blood Institute during the conduct of the study; has received speaker honoraria from Pulnovo, Infraredx; has served as a consultant to Valfix, TherOx, Robocath, HeartFlow, Ablative Solutions, Vectorious, Miracor, Neovasc, Abiomed, Ancora, Elucid Bio, Occlutech, CorFlow, Apollo Therapeutics, Impulse Dynamics, Vascular Dynamics, Shockwave, V-Wave, Cardiomech, Gore, and Amgen; and has equity/options from Ancora, Cagent, Applied Therapeutics, Biostar family of funds, SpectraWave, Orchestra Biomed, Aria, Cardiac Success, Valfix, Xenter. Dr. Stone’s daughter is an employee at Medtronic. Institutional disclosure: Dr. Stone’s employer, Mount Sinai Hospital, receives research support from Abbott, Bioventrix, Cardiovascular Systems Inc, Phillips, Biosense-Webster, Shockwave, Vascular Dynamics and V-wave.
Dr. Jerome L. Fleg reports employment by the National Heart, Lung, and Blood Institute during the conduct of the study.
Dr. Spertus discloses providing consultative services on patient-reported outcomes and evidence evaluation to Abbott, Alnylam, AstraZeneca, Bayer, Merck, Janssen, Bristol Meyers Squibb, Edwards, Kineksia, 4DT Medical, Terumo, Cytokinetics, Imbria, and United Healthcare. He holds research grants from Bristol Meyers Squibb, Abbott Vascular and Janssen. He owns the copyright to the Seattle Angina Questionnaire, Kansas City Cardiomyopathy Questionnaire, and Peripheral Artery Questionnaire and serves on the Board of Directors for Blue Cross Blue Shield of Kansas City.
Dr. Judith S. Hochman is PI for the ISCHEMIA trial for which, in addition to support by National Heart, Lung, and Blood Institute grant, devices and medications were provided by Abbott Vascular; Medtronic, Inc.; Abbott Laboratories (formerly St. Jude Medical, Inc); Royal Philips NV (formerly Volcano Corporation); Arbor Pharmaceuticals, LLC; AstraZeneca Pharmaceuticals, LP; Merck Sharp & Dohme Corp.; Omron Healthcare, Inc, Sunovion Pharmaceuticals, Inc. Espero BioPharma; and Amgen, Inc; and financial donations from Arbor Pharmaceuticals LLC and AstraZeneca Pharmaceuticals LP.
Dr. Sripal Bangalore reports grants from National Heart, Lung, and Blood Institute, during the conduct of the study; grants and personal fees from Abbott Vascular; personal fees from Biotronik, Pfizer, Amgen, and Reata outside the submitted work.
Dr. Prokhorikhin and Mr. Jones have no conflicts to report.
ABBREVIATIONS:
- BMI
body mass index
- CCS
Canadian Cardiovascular Society
- ISCHEMIA-CKD
The International Study of Comparative Health Effectiveness with Medical and Invasive Approaches–Chronic Kidney Disease
- NYHA
New York Heart Association
Footnotes
Publisher's Disclaimer: This is a PDF file of an unedited manuscript that has been accepted for publication. As a service to our customers we are providing this early version of the manuscript. The manuscript will undergo copyediting, typesetting, and review of the resulting proof before it is published in its final form. Please note that during the production process errors may be discovered which could affect the content, and all legal disclaimers that apply to the journal pertain.
Disclaimer: The contents of this manuscript are solely the responsibility of the authors and do not necessarily represent official views of the National Center for Advancing Translational Sciences, the National Heart, Lung, and Blood Institute, the National Institutes of Health, the Department of Health and Human Services, or the Department of Veterans Affairs.
References
- 1.Clark AL, Chyu J, Horwich TB. The obesity paradox in men versus women with systolic heart failure. American Journal of Cardiology. 2012;110(1):77–82. doi: 10.1016/j.amjcard.2012.02.050 [DOI] [PMC free article] [PubMed] [Google Scholar]
- 2.Curtis JP, Selter JG, Wang Y, et al. The obesity paradox: Body mass index and outcomes in patients with heart failure. Arch Intern Med. 2005;165(1):55–61. doi: 10.1001/archinte.165.1.55 [DOI] [PubMed] [Google Scholar]
- 3.Dhoot J, Tariq S, Erande A, Amin A, Patel P, Malik S. Effect of morbid obesity on in-hospital mortality and coronary revascularization outcomes after acute myocardial infarction in the United States. American Journal of Cardiology. 2013;111(8):1104–1110. doi: 10.1016/j.amjcard.2012.12.033 [DOI] [PMC free article] [PubMed] [Google Scholar]
- 4.Uretsky S, Messerli FH, Bangalore S, et al. Obesity Paradox in Patients with Hypertension and Coronary Artery Disease. American Journal of Medicine. 2007;120(10):863–870. doi: 10.1016/j.amjmed.2007.05.011 [DOI] [PubMed] [Google Scholar]
- 5.Bangalore S, Hochman JS, Stevens SR, et al. Clinical and Quality-of-Life Outcomes Following Invasive vs Conservative Treatment of Patients With Chronic Coronary Disease Across the Spectrum of Kidney Function. JAMA Cardiol. 2022;7(8):825–835. doi: 10.1001/JAMACARDIO.2022.1763 [DOI] [PMC free article] [PubMed] [Google Scholar]
- 6.Bangalore S, Maron DJ, Fleg JL, et al. International Study of Comparative Health Effectiveness with Medical and Invasive Approaches–Chronic Kidney Disease (ISCHEMIA-CKD): Rationale and design. Am Heart J. 2018;205:42–52. doi: 10.1016/j.ahj.2018.07.023 [DOI] [PMC free article] [PubMed] [Google Scholar]
- 7.Bangalore S, Maron DJ, O’Brien SM, et al. Management of coronary disease in patients with advanced kidney disease. New England Journal of Medicine. 2020;382(17):1608–1618. doi: 10.1056/NEJMoa1915925 [DOI] [PMC free article] [PubMed] [Google Scholar]
- 8.Spertus JA, Jones PG, Maron DJ, et al. Health Status after Invasive or Conservative Care in Coronary and Advanced Kidney Disease. New England Journal of Medicine. 2020;382(17):1619–1628. doi: 10.1056/nejmoa1916374 [DOI] [PMC free article] [PubMed] [Google Scholar]
- 9.Euroqol. EuroQol - a new facility for the measurement of health-related quality of life. Health Policy (New York). 1990;16(3):199–208. doi: 10.1016/0168-8510(90)90421-9 [DOI] [PubMed] [Google Scholar]
- 10.Chan PS, Jones PG, Arnold SA, Spertus JA. Development and validation of a short version of the seattle angina questionnaire. Circ Cardiovasc Qual Outcomes. 2014;7(5):640–647. doi: 10.1161/CIRCOUTCOMES.114.000967 [DOI] [PMC free article] [PubMed] [Google Scholar]
- 11.Rose G, Blackburn H. Cardiovascular Survey methods. Monogr Ser World Health Organ. 1968;56:1–188. [PubMed] [Google Scholar]
- 12.Kalbfleisch J, Prentice R. The Statistical Analysis of Failure Time Data. Wiley Publishers; 2011. [Google Scholar]
- 13.Spertus JA, Jones PG, Maron DJ, et al. Health Status after Invasive or Conservative Care in Coronary and Advanced Kidney Disease. New England Journal of Medicine. 2020;382(17):1619–1628. doi: 10.1056/nejmoa1916374 [DOI] [PMC free article] [PubMed] [Google Scholar]
- 14.Rubin D Multiple Imputation for Nonresponse in Surveys. John Wiley & Sons, Ltd; 1987. [Google Scholar]
- 15.R Core Development Team. R: A language and environment for statistical computing. Vienna, Austria. Published online 2020. [Google Scholar]
- 16.Fleischmann E, Teal N, Dudley J, May W, Bower JD, Salahudeen AK. Influence of excess weight on mortality and hospital stay in 1346 hemodialysis patients. Kidney Int. 1999;55(4):1560–1567. doi: 10.1046/j.1523-1755.1999.00389.x [DOI] [PubMed] [Google Scholar]
- 17.Leavey SF, McCullough K, Hecking E, Goodkin D, Port FK, Young EW. Body mass index and mortality in “healthier” as compared with “sicker” haemodialysis patients: Results from the dialysis outcomes and practice patterns study (DOPPS). Nephrology Dialysis Transplantation. 2001;16(12):2386–2394. doi: 10.1093/ndt/16.12.2386 [DOI] [PubMed] [Google Scholar]
- 18.Ziolkowski SL, Long J, Baker JF, Chertow GM, Leonard MB. Chronic Kidney Disease and the Adiposity Paradox: Valid or Confounded? Journal of Renal Nutrition. 2019;29(6):521–528. doi: 10.1053/j.jrn.2018.11.011 [DOI] [PMC free article] [PubMed] [Google Scholar]
- 19.Kalantar-Zadeh K, Rhee CM, Chou J, et al. The Obesity Paradox in Kidney Disease: How to Reconcile It With Obesity Management. Kidney Int Rep. 2017;2(2):271–281. doi: 10.1016/j.ekir.2017.01.009 [DOI] [PMC free article] [PubMed] [Google Scholar]
- 20.Kalantar-Zadeh K, Horwich TB, Oreopoulos A, et al. Risk factor paradox in wasting diseases. Curr Opin Clin Nutr Metab Care. 2007;10(4):433–442. doi: 10.1097/MCO.0b013e3281a30594 [DOI] [PubMed] [Google Scholar]
- 21.Ku E, Kopple JD, Johansen KL, et al. Longitudinal Weight Change During CKD Progression and Its Association With Subsequent Mortality. American Journal of Kidney Diseases. 2018;71(5):657–665. doi: 10.1053/j.ajkd.2017.09.015 [DOI] [PMC free article] [PubMed] [Google Scholar]
- 22.Adamson C, Jhund PS, Docherty KF, et al. Efficacy of dapagliflozin in heart failure with reduced ejection fraction according to body mass index. Eur J Heart Fail. 2021;23(10):1662–1672. doi: 10.1002/ejhf.2308 [DOI] [PMC free article] [PubMed] [Google Scholar]
- 23.Friedman AN, Kaplan LM, le Roux CW, Schauer PR. Management of Obesity in Adults with CKD. Journal of the American Society of Nephrology. 2021;32(4):777–790. doi: 10.1681/asn.2020101472 [DOI] [PMC free article] [PubMed] [Google Scholar]
- 24.Mathew RO, Maron DJ, Anthopolos R, et al. Guideline-Directed Medical Therapy Attainment and Outcomes in Dialysis-Requiring Versus Nondialysis Chronic Kidney Disease in the ISCHEMIA-CKD Trial. Circ Cardiovasc Qual Outcomes. 2022;15(10):E008995. doi: 10.1161/CIRCOUTCOMES.122.008995 [DOI] [PMC free article] [PubMed] [Google Scholar]
- 25.Carbone S, Canada JM, Billingsley HE, Siddiqui MS, Elagizi A, Lavie CJ. Obesity paradox in cardiovascular disease: where do we stand? Vasc Health Risk Manag. 2019;Volume 15:89–100. doi: 10.2147/VHRM.S168946 [DOI] [PMC free article] [PubMed] [Google Scholar]
Associated Data
This section collects any data citations, data availability statements, or supplementary materials included in this article.
Supplementary Materials
Supplemental Figure: BMI at each study visit based on category.