

SUMMARY
Acyl-protein thioesterases 1 and 2 (APT1 and APT2) reverse S-acylation, a potential regulator of systemic glucose metabolism in mammals. Palmitoylation proteomics in liver-specific knockout mice shows that APT1 predominates over APT2, primarily depalmitoylating mitochondrial proteins, including proteins linked to glutamine metabolism. miniTurbo-facilitated determination of the protein-protein proximity network of APT1 and APT2 in HepG2 cells reveals APT proximity networks encompassing mitochondrial proteins including the major translocases Tomm20 and Timm44. APT1 also interacts with Slc1a5 (ASCT2), the only glutamine transporter known to localize to mitochondria. High-fat-diet-fed male mice with dual (but not single) hepatic deletion of APT1 and APT2 have insulin resistance, fasting hyperglycemia, increased glutamine-driven gluconeogenesis, and decreased liver mass. These data suggest that APT1 and APT2 regulation of hepatic glucose metabolism and insulin signaling is functionally redundant. Identification of substrates and protein-protein proximity networks for APT1 and APT2 establishes a framework for defining mechanisms underlying metabolic disease.
In brief
Speck et al. use proteomics in mouse liver and miniTurbo constructs in HepG2 cells to identify substrates and the protein interactome for acyl-protein thioesterases 1 and 2. Regulation of hepatic glucose metabolism by these enzymes is found to be functionally redundant, in part through effects on acylation of mitochondrial proteins.
Graphical Abstract:

INTRODUCTION
Prediabetes and type 2 diabetes mellitus afflict millions of people. Patients with type 2 diabetes have elevated blood glucose due to both insulin resistance and insulin deficiency.1 The liver is a major regulator of systemic glucose homeostasis, synthesizing new glucose through gluconeogenesis and storing excess glucose as glycogen. Hepatic insulin resistance can disrupt both processes, resulting in elevated blood glucose.2 Mechanisms underlying hepatic insulin resistance are still under investigation.
Free fatty acids (FFAs) are associated with insulin resistance. Independent of body mass, elevated plasma FFAs induce insulin resistance in humans through multiple pathways, such as limiting insulin-mediated suppression of hepatic glucose production.3–5 In addition to FFAs, amino acids can disrupt glucose homeostasis. Branched-chain amino acids (BCAAs) have been shown in humans and animal models to regulate insulin signaling and glucose metabolism.6–9 Glutamine is the most abundant amino acid in the plasma, and it serves as a precursor for TCA cycle metabolites through the process of anaplerosis. Altered TCA cycle activity can shunt glutamine and other glucogenic amino acids toward gluconeogenesis.10
One mechanism by which fatty acids may modulate glucose homeostasis is S-palmitoylation, the covalent addition of the saturated fatty acid palmitate to cysteine residues.11 When the identity of the attached acyl chain has not been identified, this modification is termed S-acylation. More than 10% of proteins are predicted to be palmitoylated.12 Palmitoylation, the only known reversible lipid modification, and depalmitoylation are major pathways for regulating protein localization, trafficking, and function.13–15 Palmitoylation is mediated by multiple protein acyltransferases known by their catalytic motif, zDHHC (Asp-His-His-Cys). Depalmitoylation (deacylation when the acyl chain has not been identified) is mediated by thioesterases, including the acyl-protein thioesterases APT1 and APT2. Individual zDHHC proteins have known effects on glucose and lipid metabolism in fat16–18 and on mitochondrial function and glucose metabolism in liver.19,20 However, the role of the depalmitoylation/deacylation proteins APT1 and APT2 in liver metabolism is unclear. Palmitoylation and lipid content regulate mitochondrial function by affecting intraorganellar membranes and mitochondrial contact sites with other organelles.21–25 A fraction of APT1 localizes to mitochondria,26,27 but a mitochondrial role for APT2 has not been described.
APT1 and APT2 are ubiquitously expressed and highly conserved across multiple orders of vertebrates. Despite sharing 68% sequence identity and 83% similarity,28–30 APT1 and APT2 have distinct protein targets, and few proteins are known to be depalmitoylated/deacylated by both APT1 and APT2.17,31–33 This functional specificity could be related to accessory proteins, but the APT1 and APT2 interactomes are unknown.
To identify APT1 and APT2 depalmitoylation/deacylation targets and map their interacting partners, we generated liver-specific knockouts of APT1, APT2, and both APT1 and APT2, analyzed palmitoyl-proteomics in these mice, and performed proximity labeling assays for APT1 and APT2 using APT-miniTurbo fusion constructs. Our results suggest that APT1 depalmitoylates multiple targets, especially mitochondrial proteins and proteins involved in the metabolism of amino acids such as glutamine, while APT2 has fewer targets. Both APT1 and APT2 interact with mitochondrial translocases, each uniquely interacts with mediators of respiration, and both interact with multiple membrane glutamine transporters. Single deletion of liver APT1 or APT2 in chow-fed or high-fat-fed mice did not affect metabolic phenotypes, but high-fat-fed mice with combined hepatic APT1 and APT2 deficiency had increased fasting hyperglycemia, impaired insulin sensitivity, increased glutamine-driven gluconeogenesis, and decreased liver mass. These findings define the protein-protein proximity networks for APT1 and APT2 and suggest that depalmitoylation has multifactorial effects on liver metabolism.
RESULTS
Hepatic APT1 regulates palmitoylation of mitochondrial proteins
Male mice with liver-specific knockout (LKO) of APT1 and/or APT2 (APT1LKO, APT2LKO, or APTDLKO), generated by co-expressing liver-specific Albumin-cre and floxed APT1 and/or APT2, were fed a high-fat diet for 3 months. Liver proteins were isolated and subjected to acyl resin-assisted capture (RAC) to pull down palmitoylated proteins.14,15 As shown in Figure 1A, proteins were incubated with thiopropyl Sepharose beads in the presence or absence of hydroxylamine (HA), eluted from the beads, and then analyzed by TMT-labeled mass spectrometry. HA cleaves thioester linkages, and a signal from HA+ samples indicates S-palmitoylated/S-acylated proteins.
Figure 1. Characterization of the APT1 and APT2 palmitoyl-proteomes in the murine liver.

(A) Schematic of acyl resin-assisted capture (RAC) assay prior to MS analysis. Proteins were isolated from the livers of male mice fed a HFD for 3 months. Mice with single or dual deletion of APT1 and/or APT2 (APT1LKO, APT2LKO, or APTDLKO) were compared to floxed littermate controls. Results of analysis are depicted in (B)–(D) and Table S1.
(B–D) Volcano plots of palmitoyl-proteomics analysis from (B) APT1LKO, (C) APT2LKO, or (D) APTDLKO versus floxed controls. Red dots indicate proteins with increased palmitoylation in KO mice based on our low-stringency analysis (unadjusted p < 0.05, ≥2 unique peptides, fold change ≥ 1.1). Squares indicate proteins of interest for further study.
See also Table S1.
Between 2,400 and 3,100 unique proteins were detected in each of the three palmitoyl-proteomics assays (Tables S1F–S1H). Identified proteins were normalized to total detected protein intensity between KO mice and their respective floxed controls. Based on a low-stringency analysis (n = 3 per condition, unadjusted p < 0.05, unique peptides ≥ 2, fold change KO:control ≥ 1.1), APT1LKO mice had increased palmitoylation of 128 proteins, APT2LKO mice had increased palmitoylation of 4 proteins, and APTDLKO mice had increased palmitoylation of 82 proteins (Figures 1B–1D; Tables S1A–S1C). The increased number of targets in APT1-deficient livers versus APT2-deficient livers suggests that in the liver, depalmitoylation is preferentially carried out by APT1.
By Gene Ontology (GO) annotation, the most enriched biological processes among APT1-regulated proteins were glutamate, glutamine, and alpha-ketoglutarate metabolism (Table S1D). One of the most enriched proteins in APT1LKO livers was hydroxymethylglutaryl-CoA lyase (Hmgcl), which regulates leucine catabolism and ketogenesis (Table S1A; fold change = 1.68, unadjusted p = 0.00026). Leucine is a BCAA, and four additional proteins involved in BCAA metabolism also had increased palmitoylation in APT1LKO mice (Table S1A): enoyl-CoA hydratase (Echs1), methylglutaconyl-CoA hydratase (Auh), propionyl-CoA carboxylase alpha (Pcca), and propionyl-CoA carboxylase beta (Pccb).
APT2LKO mouse livers had increased palmitoylation of a guanine nucleotide-binding protein (Gnb1), STE20-related kinase adapter protein beta (Stradb), sodium-independent sulfate anion transporter (Slc26a11), and aquaporin-4 (Aqp4) (Table S1B).
Dual deficiency of APT1 and APT2 increased palmitoylation of proteins involved in mitochondrial protein processing and glutamate metabolism (Table S1C). Three proteins had increased palmitoylation in APTDLKO livers based on high-stringency analysis (Table S1C; adjusted p < 0.05, unique peptides ≥ 2; fold change ≥ 1.1): Hmgcl; Ndufa7, a component of mitochondrial complex I; and transferrin receptor 2 (Tfr2), a major regulator of iron metabolism. Using low-stringency analysis, the most highly enriched proteins in APTDLKO livers were perilipin 2 (Plin2), a lipid droplet protein, Hmgcl, Ndufa7, and catenin delta-1 (Ctnnd1).
Combinatorial palmitoyl-proteomics analysis of single and double APT LKO mice
To increase statistical power and identify the highest-confidence depalmitoylation/deacylation targets of APT1 and APT2 for further study, we combined signals from single- and double-LKO mice (Figures 2A–2C). Based on a high-stringency Fix analysis combining APT1-floxed mice and APT1/APT2-floxed mice, APT1 deficiency was associated with increased palmitoylation of 34 proteins (Table S2A). One of the most enriched biological processes among these APT1-regulated proteins was glutamine metabolism (Table S2D). Of these putative APT1 substrates, 31 of 34 were mitochondrial proteins, strongly suggesting that APT1 directly regulates mitochondrial function through depalmitoylation/deacylation (Figure 2D; Table S2D). When the same data were subjected to a medium-stringency analysis, APT1 deficiency was associated with increased palmitoylation/acylation of 73 proteins (Figure 2B; Table S2B).
Figure 2. Combinatorial analysis of APT1 and APT2 palmitoyl-proteomes in the murine liver.

(A) Schematic depicting that HA + MS data were combined to compare floxed controls to APT-deficient mice (n = 6 per group). Results of combinatorial analysis are shown in (B)–(D) and Table S2.
(B and C) Volcano plots of combinatorial Fix analysis from (B) APT1LKO and APTDLKO or (C) APT2LKO and APTDLKO mouse livers versus floxed controls. Red dots indicate proteins with increased palmitoylation in KO based on medium-stringency analysis (Tables S2B and S2E, unadjusted p < 0.01, ≥2 unique peptides, fold change ≥ 1.1).
(D) Top GO annotations for proteins that had increased palmitoylation in APT1LKO/APTDLKO Fix analysis based on high-stringency analysis (adjusted p < 0.05, ≥2 unique peptides, fold change ≥ 1.1).
(E) Western blot (WB) validation of palmitoyl-proteomics data in APT1-floxed male mice on chow diet for 6 months. Acyl-RAC was used to pull down palmitoylated proteins prior to elution and WB.
(F) Quantification of Hmgcl RAC protein intensities in (E) relative to input. Results are shown as mean ± SEM (n = 3 mice) with p value from unpaired t test.
(G) 293T cells were transfected with myc-Hmgcl and then metabolically labeled with palmitate analog pal-alkyne for 2h. Myc-Hmgcl was immunoprecipitated and click labeled by azide-conjugated biotin. Labeled Hmgcl was detected by WB.
(H) 293T cells stably expressing control (mScarlet only) or APT1 (mScarlet-APT1) were transfected with myc-Hmgcl and then metabolically labeled with palmitate analog pal-alkyne for 30 min followed by 1, 2, or 4 h chase. Palmitoylated Hmgcl was click labeled by azide-biotin probe and detected by streptavidin. APT1 overexpression was confirmed (bottom).
(I) Quantitation of pulse chase. Results are shown as mean ± SEM (n = 3 independent experiments) with p value from two-way ANOVA.
(J) WB of total liver lysate from overnight fasted male mice on HFD for 10 weeks.
(K) Quantification of (J). Results are shown as mean ± SEM (n = 5 mice) with p value from unpaired t test.
See also Table S2.
We also combined the APT2 and APT1/APT2 palmitoyl-proteomics signals. High-stringency Fix analysis failed to identify any proteins with significantly increased palmitoylation common across APT2-deficient conditions, but medium-stringency analysis showed that 20 proteins had increased palmitoylation/acylation in both APT2-deficient and APTDLKO livers (Figure 2C). The most statistically significant enriched palmitoylated/acylated proteins in the combinatorial APT2 analysis (Table S2E) were 17-beta-hydroxysteroid dehydrogenase type 6 (Hsd17b6), RalA-binding protein 1 (Ralbp1), 55 kDa erythrocyte membrane protein (Mpp1), and cardiolipin synthase (Crls1). Crls1 synthesizes cardiolipin, a phospholipid that regulates inner mitochondrial membrane function.34
To validate these findings, palmitoylation assayed by the RAC procedure followed by western blotting showed that APT1 deficiency increased palmitoylation of endogenous Hmgcl in mouse liver (Figures 2E and 2F). In 293T cells, metabolic labeling with a palmitate analog and click chemistry as well as clearance of the metabolic label from Hmgcl by mScarlet-APT1 confirmed that Hmgcl is an APT1 target (Figures 2G–2I). APTDLKO mice on a high-fat diet (HFD) had increased total Crls1 protein (Figures 2J and 2K).
Proximity labeling for APT1 and APT2
To define protein-protein interactions between APTs and their putative substrates and regulators, we conducted proximity labeling in human hepatocellular carcinoma HepG2 cells. Although proximity labeling does not confirm direct protein-protein interactions, it is more sensitive to the transient nature of these interactions than other affinity-based approaches. We fused either APT1 or APT2 to the biotin ligase miniTurbo (mT),35 which uses exogenous biotin to label proximal proteins (within 10–40 nm) at lysine residues. Biotinylated proteins were purified using streptavidin agarose beads, followed by trypsin digestion and analysis by label-free mass spectrometry (Figure 3A). For APT-mT fusion constructs, Gateway cloning was used to generate lentiviral plasmids expressing an APT sequence, a C-terminal mT sequence, and a V5 tag. The C-terminal tag was chosen to minimize interference with the palmitoylated cysteine on APT1 and APT2 (Cys2) near the N terminus, which is critical for membrane localization and substrate interaction.28,36 The expression of mT-tagged APT1 and APT2 was driven by a mild UBC promoter to achieve close to endogenous levels of protein expression (Figure 3B). APT-mT lentiviruses were transduced into HepG2 cells, and biotinylated proteins were isolated (Figures S1A–S1C). Multiple control lines were also analyzed, including a parental HepG2 line lacking the biotin ligase, a PM-mT line expressing a plasma-membrane-targeted mT construct, and an mT-only line expressing the biotin ligase alone. Bait expression and biotinylation activity were validated by treating cells with exogenous biotin (50 μM; Figure 3C), in conditions that optimized signal to noise (Figures S1D and S1E). Protease inhibitor conditions as well as protein input relative to bead volume (Figures S1F and S1G) were also optimized.
Figure 3. Proximity labeling assay to identify the interactomes of APT1 and APT2 in a liver cell model.

(A) Schematic of generating protein proximity network for APT1 and APT2 using the biotin ligase miniTurbo (mT).
(B) Schematic of expression vector containing a UBC promoter, APT1, or APT2 (gene names: Lypla1 and Lypla2), a V5 tag, an mT gene, puromycin resistance, and elements for lentiviral expression. APT protein was fused to mT at the C terminus.
(C) Validation of bait expression and biotinylation activity in transduced cells.
(D) 24 h incubation of cells in biotin-depleted media enhanced contrast in streptavidin signal between cell lines.
(E) WB of input from samples used for streptavidin pull-down and proteomics analysis.
(F) WB of proteins eluted from streptavidin agarose beads.
See also Figure S1.
Gluconeogenesis occurs in HepG2 cells and gluconeogenic enzymes include carboxylases (endogenously biotinylated in cells by holocarboxylase synthetase) that are detected as biotinylated proteins by western blotting, especially at ~75 and 125 kDa (Figures 3C–3F). To enhance contrast between the control and mT-expressing cells, we used biotin depletion, culturing cells in biotin-depleted media 24 h prior to biotin treatment and cell isolation (Figure 3D). Proteins were isolated from biological replicates (n = 3), input normalization was confirmed using vinculin (Figure 3E), and eluates (Figure 3F) were prepared for mass spectrometry (MS).
Characterization of APT1 and APT2 protein-protein networks
More than 5,000 unique proteins were identified across all samples (Table S3). For each construct, we compared APT-mT samples relative to biotin-treated parental controls using Perseus analysis of label-free quantitation (LFQ) intensities. Relative to parental cells, APT1-mT was proximal to 963 proteins, and APT2-mT was proximal to 1,312 proteins (Figures 4A and 4B; Table S3A). APT1 localized near multiple mitochondrial proteins, including Tomm20, Tomm22, Timm44, Sco1, Sdhaf3, Ndufa12, and Cpt2 (Figure 4A; Table S3A). APT2 also localized near several mitochondrial proteins in addition to components of the Golgi apparatus (more than 100 interactors) and SNARE complexes (Bet1l, Snap23, Snap29, Stx4, Stx6, Stx7, and Vti1a), as well as proteins involved in multiple biological processes, including cholesterol homeostasis (Abca1, Fgfr4, Lamtor1, Scarb1, and Srebf2)(Table S3A). Principal-component analysis (PCA) for these cell lines shows clustering of replicates by groups (Figure 4C). Imaging of co-localization between each APT-mT protein and the mitochondrial marker Tomm20 is shown in Figure 4D and quantified using Manders’ overlap coefficient in Figure S2A. Crude fractionation of mouse liver (Figure S2B) was consistent with previous findings that APT1 partially localizes to mitochondria.
Figure 4. APT-mT interactomes and localization.

(A) Volcano plot of APT1-mT prey relative to parental prey based on LFQ intensities.
(B) Volcano plot of APT2-mT prey relative to parental prey based on LFQ intensities.
Red proteins in (A) and (B) have increased labeling by the APT-mT construct based on a Perseus analysis with S0 = 2. Cyan- or blue-labeled proteins in (A) and (B) are proteins of interest for future study.
(C) Principal-component analysis of LFQ intensities from mT MS data.
(D) Confocal microscopy of mT-expressing HepG2 cells. V5: tag for mT constructs. Tomm20: mitochondrial marker. Hoechst: nuclear marker. Scale bars: 10 μm (top) and 2 μm (bottom).
Heatmaps showing selected significant interactors for APT1 and APT2 are shown in Figures 5A and 5B. We confirmed that both APT1 and APT2 interact with the outer mitochondrial membrane translocase Tomm20 (Figures 5C and 5D), that APT1 interacts with Timm44 (Figure 5C), and that both interact with the glutamine transporter Slc1a5 (Figure 5E). Slc1a5, also known as Asct2, was of borderline significance by interactome analysis (Figures 4A and 4B) but has been shown to be palmitoylated12 and is the only glutamine transporter known to localize to mitochondria.37
Figure 5. Characterization of the APT1 and APT2 interactome in a liver cell model.
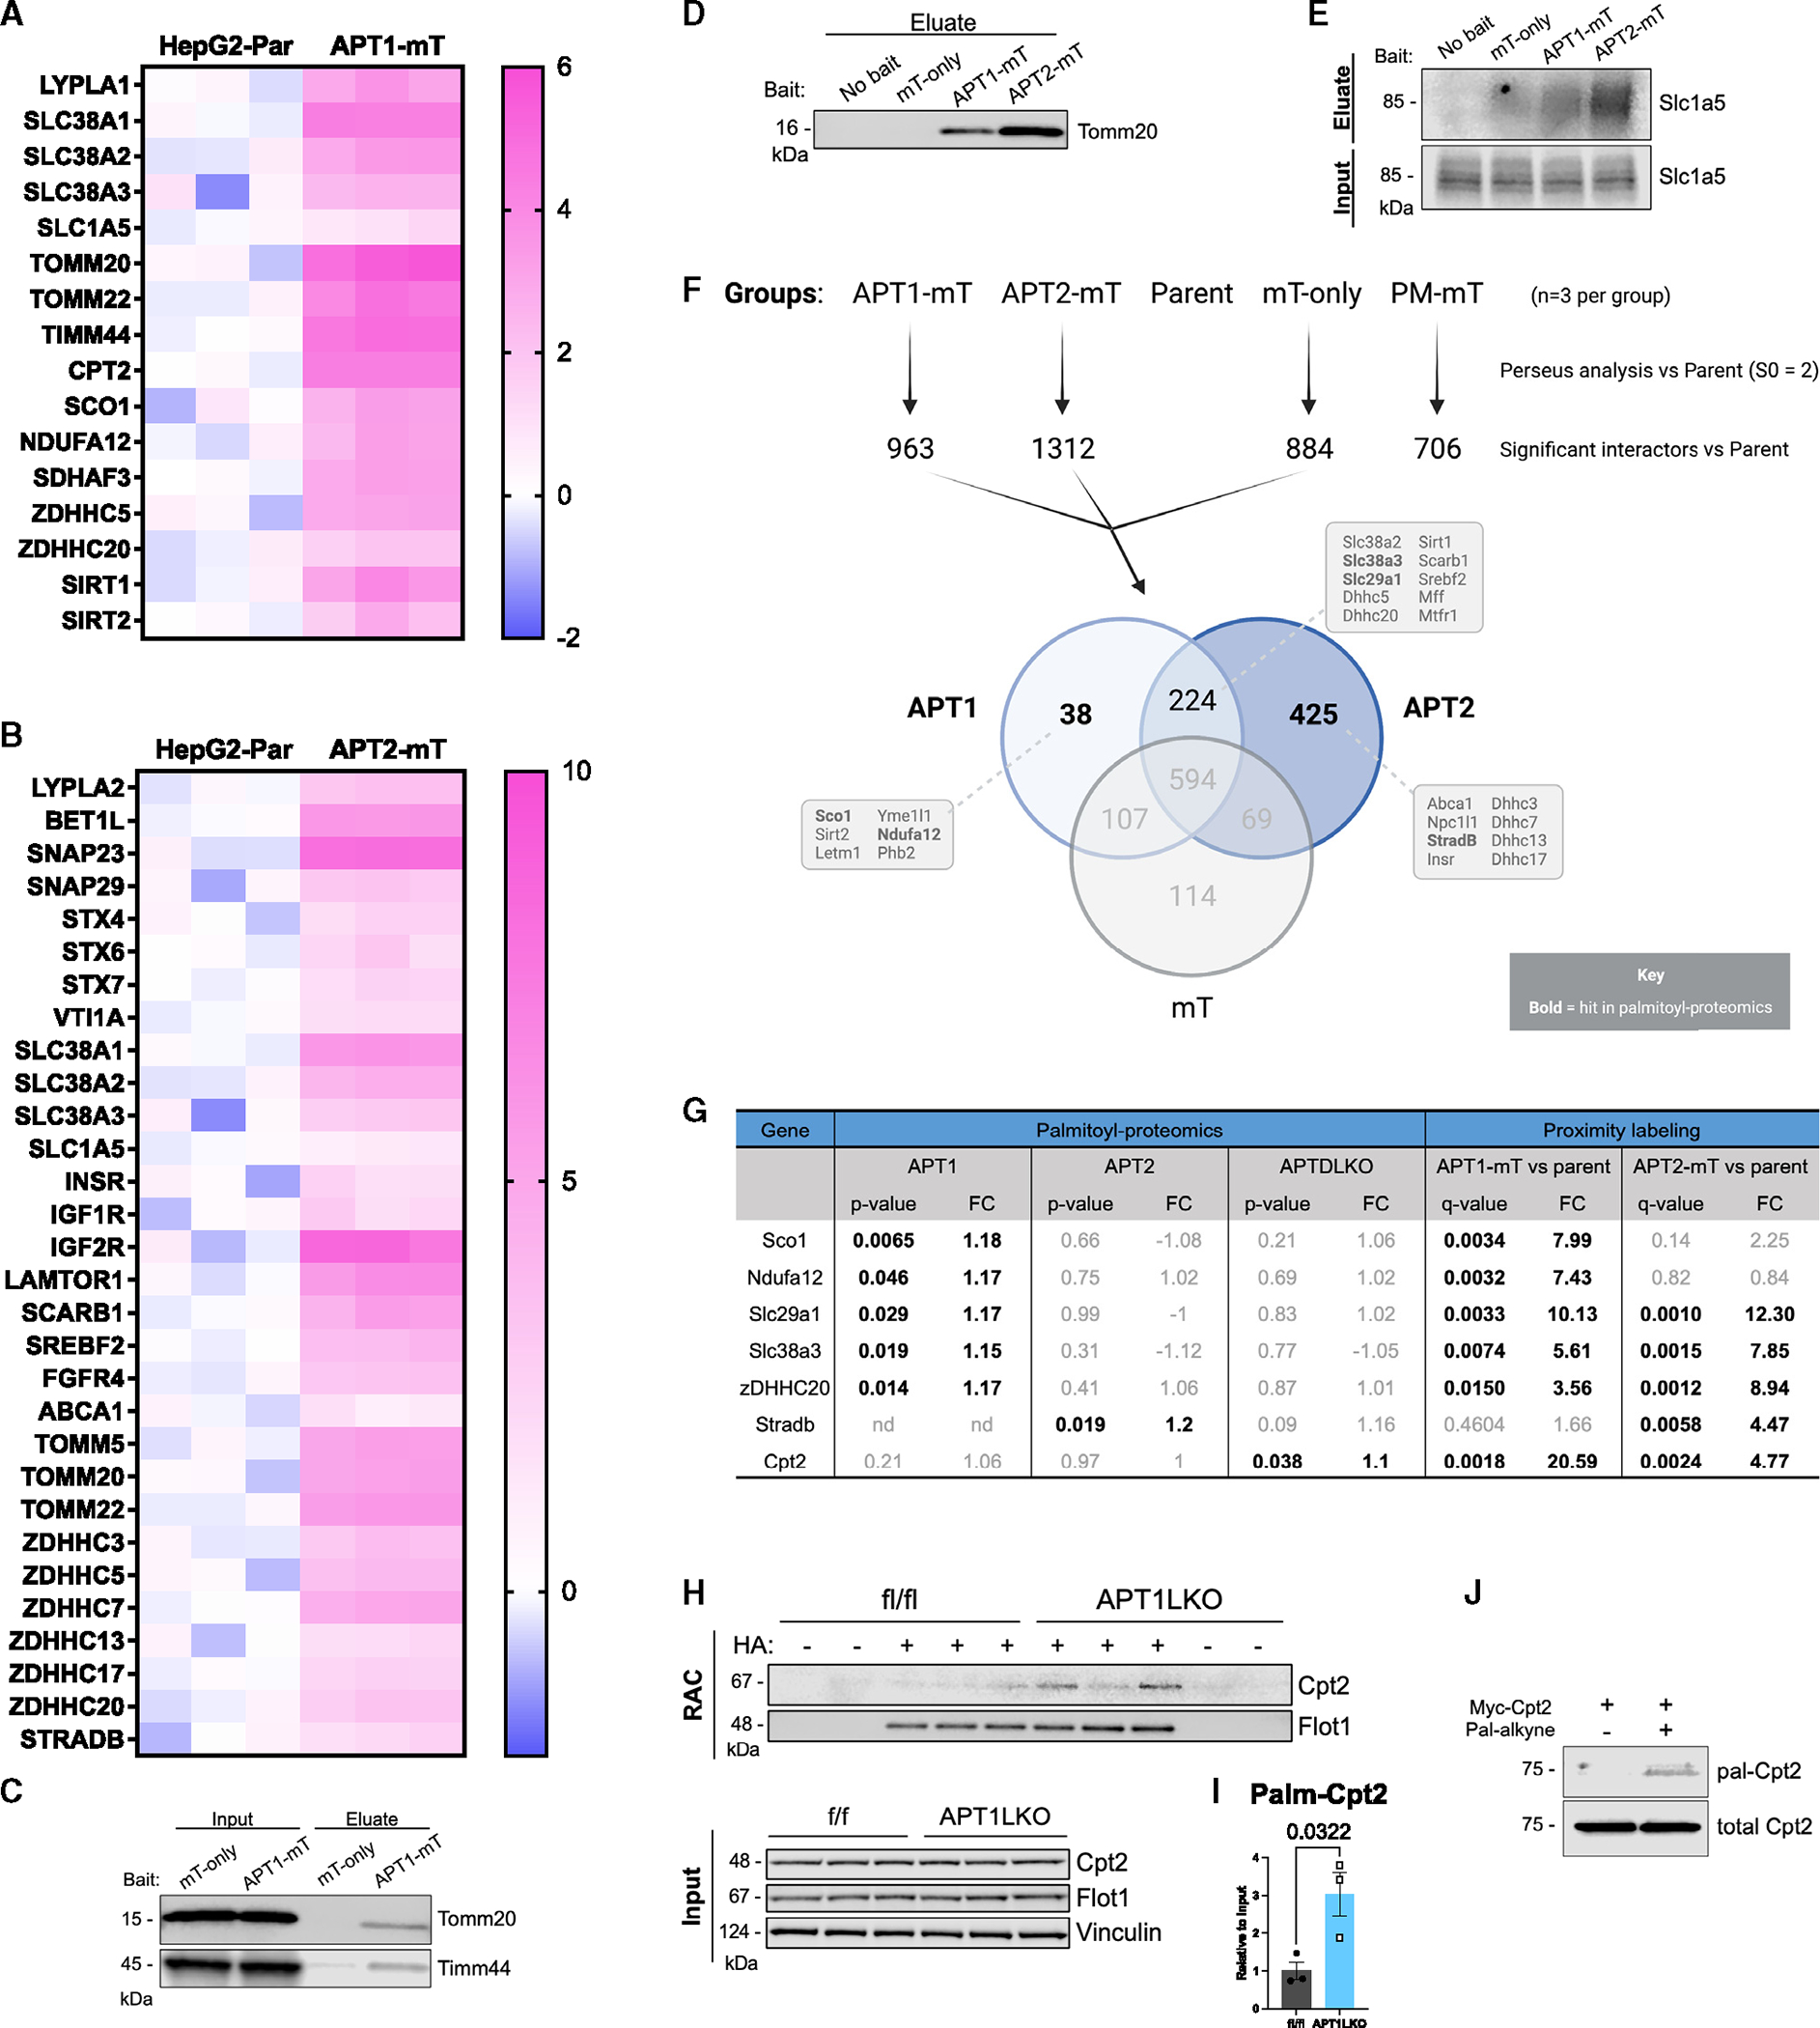
(A and B) Heatmaps of selected interactors in APT1-mT (A) or APT2-mT (B) versus parental control (n = 3 per group). Color intensity indicates log2 fold change (log2FC).
(C and D) WB validation of mitochondrial protein transporters that interact with APT1-mT and APT2-mT.
(E) WB validation of APT interactor Slc1a5, a plasma membrane and mitochondrial glutamine transporter.
(F) Venn diagram depicting significant interactors for APT1, APT2, and cytoplasmic control mT-only relative to parental control (n = 3 per group) based on Perseus analysis. Selected interactors are indicated in boxes, and bolded interactors were hits in the palmitoyl-proteomics analysis.
(G) Table comparing proteomics results of higher-confidence APT substrates. Bolded genes had unadjusted p <0.05.
(H and I) Acyl-RAC on livers from APT1-floxed male mice on chow diet demonstrated that APT1 depalmitoylates Cpt2. (H) WB of acyl-RAC samples. RAC: eluted protein. (I) Quantification of WB in (H). Results are shown as mean ± SEM (n = 3 mice) with p value from unpaired t test.
(J) Metabolic labeling of myc-Cpt2 with palmitic alkyne in 293T cells, followed by click chemistry with azide biotin and WB.
Because APT1 and APT2 are each palmitoylated near their N terminus,36 we anticipated interactions with acyltransferases. APT1 and APT2 interacted with zDHHC5 and zDHHC20, while APT2 also interacted with zDHHC3, zDHHC7, zDHHC13, and zDHHC17 (Table S3A; Figures 5A and 5B). These data are consistent with the reported palmitoylation of APT2 by zDHHC3 and zDHHC7.28
Relative to parental controls, APT1 and APT2 shared many proximal proteins (Figure 5F). APT1 and APT2 are known to interact with each other, as APT1 depalmitoylates APT2.36 APT1 had 38 unique interactors, while APT2 had 425 unique interactors. Functional annotation clustering of shared APT interactors showed that both APT1 and APT2 interacted with proteins that primarily localize to membranes (Table S3F). More than 10% of these 224 common interactors contained pleckstrin homology-like domains, which promote lipid binding and could be involved in palmitoylation. Some proteins are palmitoylated in a pleckstrin-homology-domain-dependent manner,38,39 implicating these common interactors as potential substrates of APT1 and APT2. Both APTs also interacted with proteins involved in glutamine import across the plasma membrane (Slc38a2 and Slc38a3).
For APT1, unique interactors (Figure 5F) included several proteins linked to mitochondrial function (Sco1, sirtuin 2 [Sirt2], Letm1, Yme1l1, Ndufa12, and Phb2). APT1 deficiency did not affect mitochondrial mass or mitochondrial superoxide production in HepG2 cells (Figures S2C and S2D). APT1 interacted with two major protein deacetylases, Sirt1 and Sirt2. Acetylation affects APT1 enzyme activity,14 and Sirt1 deacetylates FoxO1 and Pgc1a, mediators of gluconeogenesis and mitochondrial biogenesis. For APT2, unique interactors (Figure 5F) included proteins on SNARE complexes (Stx6/7/10), the Golgi apparatus (Golga4), and the outer mitochondrial membrane (Tomm5, Tomm40). These data confirm reported localization of APT2 to Golgi membranes.28
Figure 5G shows a comparison of low-stringency palmitoyl-proteomics data (Table S1) with proximity network data (Table S3). Relative to floxed controls, APT1-deficient mice had increased palmitoylation of multiple proteins that were consistent with the proximity labeling data, including the acyltransferase zDHHC20, the glutamine transporter Slc38a3, the equilibrative nucleoside transporter Slc29a1, the complex I accessory subunit Ndufa12, and synthesis of cytochrome c oxidase 1 (Sco1), which regulates mitochondrial cytochrome c oxidase 2 in the electron transport chain (Figure 2B). APT1-mT also labeled proteins related to depalmitoylation targets including Sdhaf3 (Table S3), while APTDLKO livers revealed increased palmitoylation of Sdhaf1 (Table S1). Electron transport chain complex II, also known as succinate dehydrogenase, includes the subunit Sdha. Sdhaf1 and Sdhaf3 are succinate dehydrogenase assembly factors that interact with and are critical to complex II function.40 APT2-mT interacted with pseudokinase StradB, which had increased palmitoylation in APT2LKO mice (Figures 1C, 2C, 5F, and 5G). APT1-mT also interacted with Cpt2 (Figures 4A and 5A), which had increased palmitoylation in APTDLKO livers (Table S1; Figure 5G). We confirmed that murine Cpt2 is a depalmitoylation target of APT1 by RAC assay followed by western blotting (Figures 5H and 5I). Metabolic labeling with palmitic acid alkyne and click chemistry with biotin azide showed that Cpt2 is also palmitoylated in human cells (Figure 5J).
Altered glucose metabolism in mice with hepatic APT deficiency
Metabolic phenotyping of mice with liver-specific deletion of APT1, APT2, or both APT1 and APT2 fed a standard chow diet or a HFD showed no physiologically significant differences in body composition, food intake, or metabolic rate (Figures S3A–S3L). Respiratory exchange ratio (RER) was significantly decreased only during the light cycle in APTDLKO mice compared to controls (Figure S3K). There were no notable effects on serum chemistries with the exception of triglycerides, which were modestly increased on chow but decreased on HFD in male APT2 KO mice, and a ~25% increase (p = 0.0013) in total cholesterol on chow but not on HFD in female APT2 KO mice.
APT1-deficient mice on a HFD had increased palmitoylation of proteins involved in ketone and BCAA metabolism, including Pcca, Echs1, Hmgcl, and Bdh1, but there was no genotype-specific effect on fasting ketones and no differences in plasma leucine or glucose during a leucine tolerance test (LeuTT) (Figures S4A–S4C). The negative LeuTT was expected because, unlike other amino acids catabolized in liver, BCAAs undergo initial metabolism in skeletal muscle.
Hepatic APT deficiency did not affect glucose or insulin tolerance in male mice fed a chow diet (Figures 6A–6F). In females with APT1LKO, APT2LKO, or dual KO, there was no effect on glucose or insulin tolerance on chow diet. On HFD, APT1LKO, but not APT2 or dual-KO, females had mild insulin resistance in insulin tolerance tests without an effect on fasting glucose. In males on HFD, single LKO of either APT1 or APT2 did not affect glucose or insulin tolerance (Figures 6G–6K). However, while dual APT1/APT2 deficiency did not affect glucose tolerance (Figure 6I), APTDLKO males fed a HFD for 16 weeks had impaired insulin sensitivity compared to controls (Figure 6L). Due to the stronger insulin resistance phenotype in males, we focused on male mice for additional metabolic analyses. There was no genotype effect on fasting plasma insulin levels in APT1LKO, APT2LKO, or APTDLKO mice in the setting of chow or HFD (Figures S4D–S4I). Akt is a major integrator of insulin signaling in the liver.2 However, there was no difference in Akt phosphorylation in livers or adipose tissue of insulin-injected APTDLKO mice (Figures 7A, S4J, and S4K), suggesting that insulin resistance in APTDLKO mice occurred downstream of Akt.
Figure 6. Glucose and insulin tolerance in liver-specific APT1, APT2, and double-LKO male mice.

Mice were fasted for 4–6 h prior to glucose tolerance testing (GTT; 1 g/kg) or insulin tolerance testing (ITT; 0.75 U/kg).
(A–F) APT1 (A and D), APT2 (B and E), and dual APT1/APT2 (C and F) deficiency in the liver did not affect glucose tolerance (A–C) or insulin sensitivity (D–F) in chow-fed mice. Single-KO mice on chow diet were tested at 20 weeks of age. Double-KO mice on chow were characterized at 12 weeks of age.
(G–I) APT deficiency did not affect glucose tolerance in mice fed HFD.
(J–L) Dual, but not single, APT deficiency impaired insulin sensitivity in mice fed HFD.
(G–L) Single-KO mice were fed HFD for 12–13 weeks; dual-KO mice were fed HFD for 15–16 weeks (n = 5–12 per group). All results are shown as mean ± SEM with p value from unpaired t tests.
See also Figure S3.
Figure 7. APTDLKO mice have increased overnight fasting glucose levels and glutamine-driven gluconeogenesis.

(A) APTDLKO livers from male mice fed HFD for 10 weeks did not have altered p-Akt after injection with insulin.
(B) APTDLKO mice on 18 weeks of HFD had increased overnight fasting glucose levels (n = 5–7). Results are shown as mean ± SEM with p value from unpaired t test.
(C) qPCR data suggesting that APT-deficient mice did not have significantly altered mRNA expression of gluconeogenic or lipogenic enzymes. Results are shown as mean ± SEM (n = 5–7 mice) with no significance from unpaired t test.
(D) APTDLKO mice on 6 months of HFD had increased glutamine-driven gluconeogenesis during a glutamine tolerance test (QTT; n = 4–7). Inset: area under the curve (AUC) analysis of QTT. Results are shown as mean ± SEM with p value from unpaired t test.
(E) APTDLKO mice on HFD for 10 weeks did not have altered total protein expression of Slc1a5, Cpt2, or Taco1 in the liver.
(F) APTDLKO mice on HFD for 9 months had decreased liver mass after an overnight fast. Results are shown as mean ± SEM with p value from unpaired t test.
See also Figure S4.
Insulin resistance in HFD-fed APTDLKO mice was associated with a trend toward increased 4 h fasting glucose. Overnight fasting unmasked a significant increase in fasting blood glucose among APTDLKO male mice fed a HFD for 18 weeks (Figure 7B). Increased fasting blood glucose in LKO mice can be attributed to increased glycogenolysis or gluconeogenesis. Given that increased blood glucose persisted following an overnight fast, which depleted murine liver glycogen stores, the most likely cause was altered gluconeogenesis. There were no differences in messages (Figure 7C) or protein (Figure S4J) for the gluconeogenesis mediators Pck1 and G6pc, suggesting that dual APT deficiency may post-transcriptionally regulate gluconeogenesis.
Multiple metabolites serve as precursors for hepatic gluconeogenesis, including amino acids such as glutamine, the most abundant circulating amino acid. Since some of the predicted biological processes shared by the APT interactome and palmitoyl-proteomics in APT KO mice were associated with glutamine metabolism, we administered glutamine to mice. After an overnight fast, HFD (6 months)-fed APTDLKO mice had enhanced glutamine-induced gluconeogenesis (Figure 7D). In contrast, hepatic APT deficiency did not affect pyruvate tolerance (Figures S4L–S4N). Altered glutamine-induced gluconeogenesis was not dependent on abundance of the glutamine transporter Slc1a5 (Figure 7E). While APTDLKO mice did not have significant differences in total, lean, or fat mass (Figures S3C and S3F), HFD-fed APTDLKO mice had decreased liver mass after an overnight fast (Figure 7F), potentially reflecting shunting of glutamine away from protein synthesis and toward gluconeogenesis, decreasing liver mass while increasing plasma glucose.
DISCUSSION
Here, we present initial hepatic palmitoyl-proteomes for the depalmitoylases/deacylases APT1 and APT2. We identified multiple high-confidence substrates of APT1, most of which, unexpectedly, are associated with mitochondria. Moreover, we describe initial protein-protein proximity networks for APT1 and APT2, which are consistent with their actions on glutamine metabolism. Our use of this resource to show altered metabolic responses to glutamine in the setting of differential palmitoylation demonstrates biological insight into post-translational control of substrate flux and emphasizes the importance of protein-protein interactions in determining physiologic endpoints. These data are thus a resource for future research evaluating how palmitoylation cycling affects metabolism, especially with respect to mitochondrial function, vesicle recycling, insulin signaling, and amino acid flux.
While many APT1 substrates are thought to be mitochondrial, the localization of APT1 itself is potentially complex. Only a fraction of APT1 is localized to mitochondria, which was known27 and which we confirm by crude fractionation (Figure S2B). APT1 is also found at the plasma membrane, nuclear membranes, and the endoplasmic reticulum (ER).36,41,42 One interpretation is that there are at least two distinct pools of APT1 that exist in topologically different environments. One pool may be cytosolic, accessing substrates in this compartment after APT1 is synthesized. This pool might include APT1 targeted to the outside of mitochondria by acylation. Another pool may be translocated into mitochondria, crossing one or two of its membranes.
APT1 itself is palmitoylated, which can help target proteins to mitochondria-associated membranes. Examples include thioredoxin family protein TMX, the ER chaperone calnexin, and the mitochondrial fission regulator DRP1.25,43 We confirmed that APT1 interacts with the major mitochondrial translocases Tomm20 and Timm44 (Figures 5C and 5D), important facilitators of mitochondrial protein import. However, there was no significant difference for co-localization of Tomm20/APT1-mT and co-localization of Tomm20/mT-only by imaging (Figures 4D and S2A), a finding perhaps related to the C-terminal mT in APT1. The public interactome database BioGrid shows that Timm44 interacts with several mitochondrial proteins with increased palmitoylation in APT1LKO and APTDLKO livers. In short, APT1 is found at many subcellular sites, and the mechanisms underlying its subcellular localization are incompletely understood.
Clinically, human mutations in the mitochondrial respiratory chain cause disorders such as Leigh syndrome.44 Several putative APT1 substrates are linked to Leigh-like symptoms in humans, including Sco1,45 Lrpprc,46 Taco1,47,48 Sqor,49 and Echs1.50 APT1 was also proximal to several regulators of the mitochondrial respiratory chain (Figures 5A and 5F; Table S3). Leigh syndrome has variable presentations depending on the specific mitochondrial mutation, including neurodegeneration in the context of lactic acidosis, hypoglycemia, and lack of muscle tone, among other features.51
Despite a rich protein-protein proximity network (Table S3), APT2 regulated the palmitoylation of few hepatic proteins in vivo. Hepatic APT2 may predominantly serve as a lysophospholipase,29 or APT1 may compensate for its absence. One of the most highly enriched proteins in APT2 palmitoyl-proteomics was Crls1, a mitochondrial protein involved in synthesizing the critical mitochondrial lipid cardiolipin (Table S3). We found increased total protein levels of Crls1 in APT1/APT2 LKO mice (Figures 2J and 2K). Deleterious mutations in Crls1 hinder cardiolipin synthesis and mitochondrial protein translation, leading to severe neurologic deficits and cardiomyopathy.34 Crls1 deficiency in adipose tissue or liver induces systemic insulin resistance.52,53 We found increased Crls1 protein abundance (Figures 2J and 2K) and insulin resistance (Figure 6L) in APTDLKO mice, suggesting that Crls1 had impaired function in the setting of depalmitoylation deficiency or that increased Crls1 was a compensatory response for decreased insulin signaling. Given that APT2 interacted with several mitochondrial proteins, these data support the notion that APT2 may regulate mitochondrial function.
Our current understanding of the clinical effects of glutamine is limited. Low plasma glutamine is a predictor of mortality in severely ill patients.54 Clinical trials of glutamine supplementation in sepsis,55,56 burns,57 sickle cell disease,58 and acute pancreatitis59 have yielded mixed results. Glutamine synthetase is palmitoylated,60 suggesting that glutamine metabolism requires normal palmitoylation cycling. APT1 regulates proteins linked to glutamine metabolism and interacts with multiple glutamine transporters including Slc1a5 (Figures 2D and 5E). Mice with hepatic APT deficiency had insulin resistance and increased glutamine-driven gluconeogenesis. Decreased liver mass in APTDLKO mice suggests that APT deficiency may direct glutamine toward gluconeogenesis, impairing liver protein synthesis while increasing blood glucose. Glutamine shunting would be consistent with previous findings that glutamine availability dictates liver growth,61,62 that liver mass is associated with rhythms in nutrient availability and protein synthesis,63 and that expression of hepatic APT1, APT2, and mitochondrial proteins correlates with dietary protein content in mice.64 Notably, the mitochondrial uncoupling agent dinitrophenol (DNP) has been shown to promote mitochondrial gluconeogenesis by enhancing flux of glutamine into the TCA cycle while decreasing flux through pyruvate carboxylase, important for converting pyruvate into oxaloacetate prior to gluconeogenesis.10 Studying uncoupling in APT-deficient cells could provide insight into carbon flux and gluconeogenesis.
Amino acid metabolism is perturbed in diabetes and insulin resistant states, but how these changes might be leveraged to treat disease is unknown. APT1 deficiency increased palmitoylation of proteins involved in leucine catabolism, but BCAA metabolism was not affected in APTDLKO mice, likely because BCAAs are primarily metabolized by muscle.65 Studying the effects of dietary leucine challenges in mice with hepatic APT1 deficiency could help clarify the role of leucine signaling in liver.
Combinatorial analysis of palmitoyl-proteomics and protein-protein proximity networks for APT1 and APT2 provides a strong foundation for a functional interactome of APTs in the liver. Future studies could pursue discrete mechanisms linking depalmitoylation/deacylation to hepatic insulin resistance, amino acid flux, and mitochondrial function, a strategy with the potential to define how protein lipidation influences the development of metabolic disease.
Limitations of study
APT1 and APT2 are the dominant, but not the only, depalmitoylating/deacylating enzymes in mammalian cells. One known depalmitoylase, PPT1, is lysosome specific. ABHD proteins, prominent in the nervous system, may be involved at other sites, and understanding their role in palmitoylation physiology could be valuable. We used human HepG2 cells for our protein-protein interaction studies. HepG2 cells are derived from a human malignancy, limiting some comparisons with normal mouse physiology. However, these cells carry out many metabolic functions of mammalian liver, and there were striking parallels between mouse proteomics and cellular interactome results. Some technical issues common to expressing exogenous proteins may have affected our interactome findings. Given that several mitochondrial proteins had a similar signal across all samples, including parental control samples, it is possible that our streptavidin agarose beads bound nonspecifically to these proteins, preventing their identification as interactors during our mT assay.
STAR★METHODS
RESOURCE AVAILABILITY
Lead contact
Further information and requests for resources and reagents should be directed to and will be fulfilled by the lead contact, Clay F. Semenkovich (csemenko@wustl.edu).
Materials availability
Plasmids generated in this study are available from the lead contact upon request.
Data and code availability
All data reported in this paper will be shared by the lead contact upon request. Source of Western blot images for the figures in the manuscript is available as Data S1. The mass spectrometry proteomics data have been deposited to the ProteomeXchange Consortium via the PRIDE partner repository with the dataset identifier PXD041552 and 10.6019/PXD041552 (http://proteomecentral.proteomexchange.org).
This study did not report original code.
Any additional information required to reanalyze the data reported in this paper is available from the lead contact upon request.
EXPERIMENTAL MODEL AND STUDY PARTICIPANT DETAILS
Cell lines
Human HEK293T and HepG2 cells were purchased from American Type Culture Collection (ATCC; Catalog No. CRL-11268, HB-8065). Cell lines were cultured at 37°C and 5% CO2 and tested negative multiple times for mycoplasma. Experiments were performed on cell lines passaged fewer than 20 times. Cells were maintained in high-glucose DMEM containing 10% FBS, 1x penicillin-streptomycin, and 1% GlutaMAX.
Animal models
Animal protocols were approved by the Institutional Animal Care and Use Committee (IACUC) at Washington University in St. Louis and followed the NIH Guide for the Care and Use of Laboratory Animals. Mice floxed for Lypla1 (the gene for APT1) were generated on a C57BL/6J background as described.14 Mice floxed for Lypla2 (the gene for APT2) were derived from a global knockout mouse line (the KOMP Repository)14 by transforming into a conditional allele using Flp transgenic mice. Mice with liver-specific knockout of APT1 or APT2 (APT1LKO and APT2LKO) were then generated by crossing floxed mice with constitutive Albumin-cre mice. Mice with dual deletion of APT1 and APT2 from the liver (APTDLKO) were generated by crossing APT1-floxed animals with APT2-floxed animals. Animals resided in a specific pathogen-free facility with a 12h light-dark cycle and were fed standard chow diet or a high-fat diet containing 0.2% cholesterol and 42% calories from fat (Envigo, TD.88137). Mice were fed ad libitum except for studies of food intake. Mice fed with chow diet were studied at 2–6 months of age. Mice fed high-fat diet were started on this diet at 2 months of age and studied after 3- or 6-month of feeding. Metabolic phenotyping was performed in both male and female mice. Because of a stronger phenotype in male mice, additional experiments for proteomics and liver metabolism were performed on male mice alone.
METHOD DETAILS
Acyl-resin assisted capture (RAC)
Acyl-RAC was used to isolate palmitoylated proteins for analysis by mass spectrometry or Western blot.14,15 Mice were fasted prior to perfusion with cold PBS and isolation 50–100 mg of liver. Liver pieces were snap-frozen at −80°C before the RAC assay. Liver was mechanically homogenized in lysis buffer (150 mM NaCl, 50 mM Tris, 5 mM EDTA, 2% Triton X-100, 0.2 mM HDSF, pH 7.4, 1x cOmplete (Roche)) and sonicated on ice. Lysates were spun at 12,000 rpm for 15 min, and the supernatant was isolated for BCA protein concentration assay (Thermo). Equivalent amounts of protein from each sample were diluted with lysis buffer to final concentrations of 2.5% SDS and 0.1% S-methylmethanethiosulfonate (MMTS) at room temperature, and then incubated at 37°C for 20 min. 3-fold volumes of cold acetone were added to each sample, and samples were stored at −20°C overnight. Precipitated protein was spun at 12,000 rpm for 15 min at 4°C, and the supernatant was discarded. The protein pellets were washed 3 times with cold 70% acetone, centrifuged at 12,000 rpm for 15 min at 4°C, and air-dried. Pellets were resuspended in binding buffer (100 mM HEPES, 1 mM EDTA, 1% SDS, pH 7.4, 1x cOmplete) and vortexed for at least 20 min at room temperature until dissolved. Samples were centrifuged at 12,000 rpm for 10 min, and the supernatant was reserved for pulldown. An aliquot was saved in loading buffer for “input” control, and the remaining protein was divided in half for addition of freshly prepared hydroxylamine (HA+, 0.8 M, pH 7.4), or a negative control not treated by HA (HA−). Thiopropyl Sepharose bead slurry (Cytiva) and either HA or PBS was added to each sample then incubated for 2–4h using an inverted vortex. Affinity-purified samples were spun at 3000 rpm then washed twice with PBS and twice with binding buffer. Palmitoylated proteins were eluted from the beads using binding buffer containing 50 mM DTT, shaking at room temperature for 20 min. Palmitoylated proteins in eluate were then analyzed by Western blot or mass spectrometry.
Palmitoyl-proteomics
S-palmitoylated proteins were purified using acyl-RAC, trypsin-digested, and analyzed by TMT-labeled mass spectrometry as described.14,15
TMT identification of proteins
Mass spectrometric (MS) data were converted to peak lists using Proteome Discoverer (version 2.1.0.81, Thermo-Fisher Scientific). The tandem MS spectra (MS/MS) with charges +2, +3 and +4 were analyzed using Mascot software67 (Matrix Science, London, UK; version 2.7.0). The searches were performed with a fragment ion mass tolerance of 0.02 Da and a parent ion tolerance of 20 ppm. MS/MS spectra were set up to search against a Uniprot (ver Oct. 2019) database of mouse proteins (17,148 entries) and common contaminant proteins (cRAP, v1.0 Jan. 2012; 116 entries), assuming the digestion enzyme was trypsin/P with a maximum of 4 missed cleavages allowed. Cysteine carbamidomethylation was specified as a fixed modification. Methionine oxidation, asparagine deamidation, N-terminal glutamine-to-pyroglutamic acid conversion and protein N-terminal acetylation were specified as variable modifications. Peptide spectrum matches (PSM) were filtered at 1% false-discovery rate (FDR) by searching against a reversed database and the ascribed peptide and protein identities were accepted.
TMT protein relative quantification
The processing, quality assurance and analysis of TMT data were performed with proteoQ (version 1.7.5.1, https://github.com/qzhang503/proteoQ), a tool developed with the tidyverse approach (https://CRAN.R-project.org/package=tidyverse) under the free software environment for statistical computing and graphics, R (https://www.R-project.org/) and Posit/RStudio (https://posit.co/). The precursor intensities were converted to logarithmic ratios at base two (log2FC), relative to the average precursor intensity within a TMT plex. Under each sample, Dixon’s outlier removals were carried out recursively for peptides with greater than two identifying peptide spectrum matches (PSM). The median of the PSM log2FC that could be assigned to the same peptide was taken to represent the ratios of the incumbent peptide. The median of the peptide log2FC was taken to represent the log2FC of the inferred protein. To align protein ratios across samples, likelihood functions were first estimated for the protein log2FC using finite mixture modeling, assuming two-component Gaussian mixtures. The distributions of log2FC were then aligned so that maximum likelihood was centered at zero for each sample. Scaling normalization was performed to standardize the protein log2FC across all samples. To reduce the influence of outliers, the values between the 5th and 95th percentile of log2FC and 5th and 95th percentile of intensity were used in the calculations of standard deviations.
Informatic and statistical analysis
Metric multidimensional scaling (MDS) and principal component analysis (PCA) of protein log2FC was performed with the base R function stats:cmdscale and stats:prcomp, respectively. Heatmap visualization of protein log2FC was performed with pheatmap. Linear modelings were performed using the contrast fit approach in limma68 to assess the statistical significance in protein abundance differences between indicated groups of contrasts. Linear mixed effects were applied for data collected from different experiments where groups of contrasts were treated as fixed effects and batches of studies as random effects. Adjustments of p values for multiple comparison were performed with Benjamini-Hochberg (BH) correction.
Cloning
Plasmids were purchased from Origene that contained the open reading frames of Lypla1 or Lypla2 (Catalog No. RC202029, RC202021). Donor (pDONR223) and destination vectors expressing miniTurbo, a V5 tag, and domains for expression in mammalian cells driven using a ubiquitin promoter (p667-UBC-GW-V5-mT-puromycin) were provided by the lab of Michael B. Major. Fusion constructs expressing either Lypla1 or Lypla2 with the V5 tag and the miniTurbo domain were synthesized using Gateway cloning and grown in the DH10B strain of E. coli.35 Plasmid integrity was validated by agarose gel electrophoresis post-restriction digest and Sanger sequencing. For APT1 overexpression assay, mouse APT1 cDNA was cloned into a lentiviral vector pLV-mScarlet-I (Addgene, Cat.No. 159172).
Restriction mapping
To validate the composition of lentiviral expression vectors, pLenti667-Lypla1-mT and pLenti-667-Lypla2-mT were analyzed by restriction digestion. In 25 μL total reaction volume, 400 ng of DNA was digested in the presence of 1x rCutSmart Buffer, 0.5 μL EcoRV-HF (NEB #R3195S), and 0.5 μL BsrGI-HF (NEB #R3575S). Plasmids were digested at 37°C for 60 min, and then enzymes were deactivated at 80°C for 20 min. Loading dye was added, and digested DNA was run in a 0.8% agarose gel with 1:20,000 GelRed (Sigma #SCT123).
Transfection and transduction
Lentiviruses expressing miniTurbo fusion constructs were generated in HEK293T cells using TransIt-LT1 transfection reagent (Mirus). Cells were seeded 24h prior to transfection in antibiotic-free growth medium. Transfection reagents were gently mixed with 6 μg of psPAX2 packaging plasmid, 2 μg of pMD2.G envelope plasmid, and 8 μg of transfer plasmid and then added to adherent 293T cells. Conditioned media was collected over 18–42h and 42–66h, followed by concentration of virus using Lenti-X concentration (Takara). HepG2 cells were transduced with fresh virus in the presence of puromycin, and stably transduced cells were studied after two passages.
Lysis and wash buffers
For miniTurbo assays, RIPA lysis buffer consisted of 10% glycerol, 50 mM HEPES, 150 mM NaCl, 2 mM EDTA, 0.10% SDS, 1% NP40, and 0.2% sodium deoxycholate (NaDOC) at pH 7.5. Five wash buffers were used to wash streptavidin beads after affinity purification. Wash buffer 1 contained 2% SDS. Wash buffer 2 included 50 mM HEPES, 500 mM NaCl, 1 mM EDTA, 1% Triton X-100, and 0.1% NaDOC at pH 7.5. Wash buffer 3 consisted of 50 mm HEPES, 250 mM LiCl, 1 mM EDTA, 0.5% NP40, and 0.5% NaDOC at pH 8.1. Wash buffer 4 consisted of 50 mM HEPES and 50 mM NaCl at pH 7.4. Wash buffer 5 contained 50 mM fresh ammonium bicarbonate.
For Western blot of mouse liver tissue, phospholysis buffer consisted of 50 mM Tris, 1 mM EDTA, 150 mM NaCl, 1% NP40, 2 mM Na3VO4, 5 mM NaF, 0.25% NaDOC, and 1x cOmplete in water. Tissues were homogenized on ice with a Dounce homogenizer, and lysate was centrifuged at 12,000 rpm for 20 min at 4°C. Cleared lysate was collected and protein concentration was assayed using a BCA kit (Thermo).
Western blotting
Equivalent amounts of protein were boiled with 1x Laemmli buffer containing 50 mM DTT. Boiled protein samples were loaded for SDS-PAGE (Novex Wedgewell 4–20% Tris-glycine mini gels, Thermo XP04200BOX) and run at 120–140V for 90 min. Proteins were wet transferred to PVDF membranes, and membranes were blocked (Licor 927–60001) for 60 min. Tween (0.1%) and primary antibodies were added to membranes and incubated overnight at 4°C. Secondary antibodies were incubated with membranes in 50% Licor Odyssey blocking buffer/0.5x TBS/0.05% Tween/0.01% SDS at RT for 60 min. For visualization of biotinylated proteins, after incubation with primary antibodies, membranes were incubated in 50% Licor Odyssey blocking buffer/0.5x TBS/0.15% Tween/0.02% SDS. Streptavidin-680 (Invitrogen S21378, 1:5000) was incubated with membranes at room temperature for 60 min. Protein intensity was quantified with Licor Image Studio software.
Click chemistry for palmitoylation of selected targets
For selected markers, palmitoylation was confirmed by metabolic labeling combined with click chemistry in 293T cells overexpressing the proteins (Myc-Hmgcl or Myc-Cpt2, Origene, Cat. No. MR204737 or MR216278) as previously described.14 Transfected cells were incubated with media in the absence or presence of 20 μM palmitic acid alkyne (Cayman chemical, Cat. No. 13266) for 0.5–4hrs before lysed, and solubilized protein fractions were then isolated. The equal amounts of protein lysates were immunoprecipitated with Myc-trap magnetic agarose (Chromotek, Cat. No. ytma-20). Immunoprecipitates were then click-labeled on beads with labeling buffer containing 1 mM CuSO4, 1 mM TCEP, 0.1 mM TBTA, and 400 μM azide-biotin (Sigma, Cat. No. 762024) at room temperature for 1 h. Labeled proteins were resolved by SDS-PAGE followed by Western blotting for dual-color fluorescence by a Licor Odyssey FC imager. Total proteins were blotted by Myc primary antibody (clone 9E10, Santa Cruz, Cat. No. sc-40) and palmitoylation labels were detected with IRDye-conjugated streptavidin (Licor, Cat. No. 926–32230 or 926–68079). For APT1 overexpression, mouse APT1 cDNA was cloned into a lentiviral vector pLV-mScarlet-I (Addgene, Cat.No. 159172). 293t cells with constitutive expression of control (mScarlet alone) or mScarlet conjugated APT1 were used in metabolic labeling experiments of Hmgcl as described above.
Quantitative PCR
Livers were isolated from mice perfused with cold PBS followed by snap-freezing in liquid nitrogen and storage at −80°C. RNA was isolated using PureLink RNA Mini Kit (Thermo) with on-column gDNA digestion (Thermo). One mg RNA was used to synthesize cDNA using the Applied Biosystems High-Capacity cDNA reverse transcription kit (Thermo). Gene expression was measured using Takara Green Premix Ex Taq (RR420A) with 2.5 ng cDNA per reaction in a StepOnePlus system (Thermo)
Immunofluorescence
For detection of subcellular localization of the target proteins, HepG2 cells from the parental control or expressing various constructs were fixed with 4% paraformaldehyde for 15 min, then washed with PBS. Cells were permeabilized using 0.1% Triton X-100 for 5 min and then blocked with 5% goat serum in PBS at room temperature for 1 h. Cells were incubated with antibodies for V5 (Thermofisher R960–25, 1:200) and Alexa Fluor 647 Anti-TOMM20 antibody (Abcam ab209606) overnight at 4°C. Alexa Fluor 488 secondary antibody (Thermofisher A-11029, 1:200) was used to stain the V5 signal. The images were acquired by a Nikon A1plus laser scan confocal system (40x oil plan Fluor NA 1.3, Ti-E microscope, 405nm, 488nm, and 640nm channel series mode) and processed by Nikon’s Denoise.ai followed by analysis in ImageJ.
Biotin-depleted media
Pierce high-capacity streptavidin agarose beads (Thermo) were washed 4 times at 4°C with sterile PBS, and then diluted to a 50% slurry. Biotin-depleted media (DMEM, 5% FBS, 1% GlutaMAX) was prepared by adding 25 μL of 50% bead slurry to 50 mL of media. Media was rotated overnight at 4°C. Several 50 mL tubes of biotin-depleted media were filter-sterilized (Thermo) to remove beads. Cells were incubated with biotin-depleted media for 24h prior to biotin treatment and cell collection.
Biotinylation and streptavidin affinity purification
Biotin (50 mM, Millipore-Sigma B4501–500MG) was dissolved in DMSO, filter sterilized, and frozen at −20°C in 100- to 250-μL aliquots. For proteomics assays, HepG2 cells were seeded in 15cm dishes at 21 × 106 cells/dish. Three days prior to cell collection, 6 mL of 0.25% trypsin-EDTA was added to cells and incubated at 37°C for 7 min. Trypsin was neutralized with 18 mL complete medium, and cells were resuspended and pelleted at 1000g. Cells were filtered through a 40μm cell strainer (Greiner 542040), counted with a manual hemacytometer, and seeded into new 15cm dishes. Twenty-four hours prior to cell collection, media was replaced with fresh DMEM/5% FBS/1% GlutaMAX medium. Cells were incubated for 2h with 50 μM biotin unless otherwise indicated. Unique passage numbers were used for biological replicates. After 2h, media was aspirated, and cells were washed 3 times with cold PBS. Cells were lifted (CellTreat 229306) from dishes into 50mL tubes and spun at 500g for 10 min at 4°C. Cell pellets were snap-frozen in liquid nitrogen. For affinity purification, pellets were sonicated on ice in RIPA lysis buffer containing phosphatase and protease inhibitors (5 mM NaF, 2 mM Na3VO4, 1x cOmplete, 1:5000 benzonase). Lysates were centrifuged and supernatant was collected as “input.” Protein concentrated was determined with a BCA protein assay. 180 μL of washed streptavidin agarose 50% bead slurry was added to 20 mg of protein from each sample and rotated overnight for affinity purification. Supernatants after affinity purification were reserved at −80°C as “flow-through.” Beads were washed with 4 wash buffers to eliminate nonspecific binding. For blotting, biotinylated proteins were eluted from beads using 4x Laemmli buffer with 50 μM DTT (Figure S1C). For MS analysis, the beads were washed with 50 mM ammonium bicarbonate buffer followed by on-bead digestion (described below).
Label-free MS peptide preparation
Peptides were prepared as described using on-bead tryptic digestion.70 Beads were washed four times with 1 mL of 50 mM ammonium bicarbonate buffer, pH 8.0, resuspended in 40 μL of the same buffer containing 8 M urea (Sigma, U4884), then disulfide bonds were reduced using 2 μL of 0.05 M DTT (Pierce, 20291) and incubated for 60 min at 30°C. Reduced proteins were alkylated using 4 μL of 0.5 M iodoacetamide (Pierce, A39271) with incubation for 30 min at room temperature in the dark. The urea was diluted to 1.5 M by adding 167 μL of 50 mM ammonium bicarbonate buffer, lysyl endopeptidase (Wako Chemicals, 129–02541; 1mAU) was added, and samples were incubated for 2 h at 30°C with gyration at 750 rpm. Trypsin (Promega, V5113; 1 μg) was added and the samples were incubated overnight at 30°C with gyration. The peptides were transferred to a 1.5 mL tube, beads were washed with 50 μL of ammonium bicarbonate buffer, transfer and wash volumes were combined, and residual detergent was removed by ethyl acetate extraction.71 Samples were made 1% (v/v) with Trifluoroacetic acid (Sigma, 91707), peptides were desalted using Stage tips,72 and eluted with 60 μL of 60% (v/v) MeCN in 0.1% (v/v) trigluoroacetic acid and dried in a Speed-Vac. Samples were then dissolved in 20 μL of 1% (v/v) MeCN in water, an aliquot was removed for quantification using the Pierce Quantitative Fluorometric Peptide Assay kit (Thermo Scientific, 23290), and remaining peptides were transferred to autosampler vials (Sun-Sri, 200046), dried, and stored at −80°C.
Nano-LC-MS
Peptides were analyzed using a nano-Elute chromatograph coupled online to a hybrid trapped ion mobility-quadrupole time of flight mass spectrometer (timsTOF Pro, Bruker Daltonics, Bremen Germany) with a modified nano-electrospray source (CaptiveSpray, Bruker Daltonics). The mass spectrometer was operated in PASEF mode.73 The samples in 1% (v/v) aqueous formic acid were loaded (2 μL) onto a 75 μm i.d. × 25 cm Aurora Series column with CSI emitter on a Bruker nano-ELUTE. The column (50°C) was equilibrated using constant pressure (800 bar) with 8 column volumes of solvent A (0.1% aqueous formic acid) and sample loading was performed under the same pressure in a volume of 1 x sample pick-up volume plus 2 μL. Peptides were eluted using the one column separation mode with a flow rate of 350 nL/min and using solvents A and B (0.1% formic acid/MeCN): solvent A containing 2% B increased to 17% B over 60 min, to 25% B over 30 min, to 37% B over 10 min, to 80% B over 10 min and constant 80% B for 10 min. The MS1 and MS2 spectra were recorded from m/z 100 to 1700. Suitable precursor ions for PASEF-MS/MS were selected in real time from TIMS-MS survey scans by a PASEF scheduling algorithm.73 A polygon filter was applied to the m/z and ion mobility plane to select features most likely representing peptide precursors rather than singly charged background ions. The quadrupole isolation width was set to 2 Th for m/z < 700 and 3 Th for m/z > 700, and the collision energy was ramped stepwise as a function of increasing ion mobility: 52 eV for 0–19% of the ramp time; 47 eV from 19 to 38%; 42 eV from 38 to 57%; 37 eV from 57 to 76%; and 32 eV for the remainder. The TIMS elution voltage was calibrated linearly using the Agilent ESI-L Tuning Mix (m/z 622, 922, 1222).
MaxQuant data search
All raw mass spectrometry data files were analyzed for protein identification and label-free quantification (LFQ) using MaxQuant (version 2.0.1.0)74 using the default settings for “TIMS-DDA” with minor modifications. The datasets for the “APT1” and “APT2” experiments, along with relevant controls (“Parental”, “mT”, and “PM-mT”) were all searched together against the human UniProt reference proteome database (https://www.uniprot.org/proteomes/UP000005640) plus a list of likely contaminants containing streptavidin, Trypsin, Albumin, mT, and PM-TiD, and against the contaminants list of MaxQuant. The search parameters were as follows: Methionine oxidation (15.994914) and protein N-terminal acetylation (42.010564) were set as variable modifications and Carbamidomethyl-cysteine (57.021463) as a fixed modification with a maximum of five modifications per peptide. Digestion was set to Trypsin/P with a maximum of four missed cleavages, and a minimum allowed peptide length of seven. FTMS, ITMS, and TOF MS/MS tolerance were 20 ppm, 0.5 Da, and 40 ppm, respectively, and the peptide FDR and protein FDR were set to 0.01. Unique peptides were used for protein quantification, and the minimum LFQ ratio count was set to 1. Fast LFQ with classic normalization was active with a minimum and an average number of neighbors of 3 and 6, respectively. Match between runs for samples within a group (with a match time window of 0.7 min and a 20 min alignment time window) and second peptides were enabled. The raw mass spectrometry proteomics data have been deposited to the ProteomeXchange Consortium with the dataset identifier PXD041552 and 10.6019/PXD041552 (http://proteomecentral.proteomexchange.org).
Perseus data analysis
Data filtering and statistical analysis for the proximity dataset were done using Perseus (version 2.0.7.0).75 The ‘proteinGroups.txt’ output file from MaxQuant was loaded into Perseus using LFQ intensities for all samples as the Main columns. The data matrix was filtered to remove all proteins labeled as “Only identified by site”, “Reverse”, and “Potential contaminant”. The LFQ values were transformed to log2(x), and the individual LFQ columns were grouped by Bait. Proteins without quantified/valid values in all three replicates for at least one the groups were removed, and remaining missing values were imputed using the “Replace missing values from normal distribution” function with a width of 0.3 and a downshift of 1.8 from the standard deviation for the total matrix. Principal component analysis was performed to study the distribution of APT1/2 and control bait replicates. To identify proteins enriched in APT1 and APT2 groups, two-sided unpaired Student’s t-tests were performed with a permutation-based FDR calculation (250 permutations; FDR = 0.05). Two levels of stringency for the Student’s t-test were utilized based on the S0 parameter in Perseus, which controls the relative importance of a t test p value and difference between the means; S0 = 1, a lower stringency level, and S0 = 2, a higher stringency level. All subsequent analysis was performed on proteins significantly enriched in the higher stringency analysis. Heat maps of selected significant interactors were generated, and increased pink color represents increased Log2FC of APT-mT LFQ intensities relative to Parental.
Gene annotation analysis
For palmitoyl-proteomics studies, as described in the Key to Tables S1 and S2, gene ontology (GO) analysis was performed on significant APT substrates using the Gene Ontology Resource, selecting for “biological process,” “cellular component,” or “molecular function,” and “mus musculus.” Proteins with increased palmitoylation in each analysis were included based on our low-stringency analysis (Table S1) or high-stringency analysis (Table S2). For proximity labeling studies, annotation analysis was performed on common significant interactors of APTs minus significant interactors of mT-only relative to the Parental control (see Figure 5F for graphical depiction). As described in the Key to Table S3, functional annotation clustering was performed using DAVID Bioinformatics (https://david.ncifcrf.gov/) default settings, with threshold significant enrichment score set at 2.
Flow cytometry for mitochondrial assays
Scrambled and APT1 knockdown HepG2 cells were generated as described,14,15 and their mitochondrial mass and superoxide production were measured by flow cytometry by using live cell mitochondrial probes MitoTracker green and MitoSOX red. In brief, 5000 cells were trypsinized, washed, and stained by 50nM MitoTracker and/or 5μM MitoSOX red for 15 min at 37°C. Stained samples were then washed again before acquisition by a spectral-based flow cytometer (Cytek Northern Lights). Unmixed data was exported and analyzed in FlowJo.
Metabolic tolerance tests
For glucose (GTT) or insulin tolerance tests (ITT), animals were fasted for 4–6h as described.76 Mice were injected i.p. with 1 g/kg glucose (GTT) or 0.75 U/kg insulin for males or 0.6 U/kg insulin for females (ITT). Blood glucose was measured at 0, 15, 30, 60, and 120 min post injection. To measure insulin signaling, mice were fasted overnight, weighed, and then anesthetized with a ketamine/xylazine cocktail. Anesthetized mice were injected with 2.5 mU/g insulin (chow diet) or 5 mU/g insulin (HFD), and then 10 min later were perfused with cold PBS followed by tissue collection. For leucine tolerance tests (LeuTT), mice were fasted overnight. 150 mM leucine (Sigma L8912) was dissolved in PBS and filtered. Mice were injected at 15 μL/g. Blood was collected at 0, 30, and 60 min post injection. Plasma was isolated, and plasma glucose (Wako 997–03001) and BCAA (Abcam ab83374) were quantified. Prior to the glutamine tolerance test,77 lean mass was quantified using Echo-MRI to determine glutamine dosing. Mice were fasted overnight. In the morning, mice were injected i.p. with 1 g/kg lean body mass glutamine (Sigma 49419) dissolved in sterile saline. Blood glucose levels were measured with a glucometer at 0, 15, 30, 60, 90, and 120 min post injection. For pyruvate tolerance tests (PTT), 1.5 g/kg pyruvate dissolved in sterile PBS was administered to overnight-fasted mice.
Plasma ketone assay
Male chow-fed mice were fasted for 5 h or overnight prior to collecting plasma. Plasma beta-hydroxybutyrate levels were assayed according to kit instructions (Cayman Chemicals #700190).
Food intake
Male mice previously on chow diet were individually housed on aspen bedding and fed HFD ad libitum for 1 week prior to measuring daily HFD food intake and body mass. Daily food intake was averaged over 7 days.
Indirect calorimetry
Eight-to 12-week-old male mice floxed for both APT1 and APT2 were fed HFD and individually housed for 4 days prior to placement into separate chambers of the TSE Systems Phenomaster small animal phenotyping system. Oxygen consumption (VO2), carbon dioxide production (VCO2), respiratory exchange ratio (RER), and locomotor activity were measured every 10 min over the course of 72h. Average RER during light cycle was calculated using CalR (https://calrapp.org/).
QUANTIFICATION AND STATISTICAL ANALYSIS
Statistical analyses were performed using Prism 9 software (GraphPad Software). Results shown are pooled from biological replicates and depicted in bar graphs or line graphs as mean ± SEM. Data were analyzed using unpaired t-tests or 1-way or two-way ANOVA as indicated with significance set at p < 0.05.
Supplementary Material
KEY RESOURCES TABLE.
| REAGENT or RESOURCE | SOURCE | IDENTIFIER |
|---|---|---|
|
| ||
| Antibodies | ||
|
| ||
| V5 Tag Monoclonal Antibody (SV5-Pk1) | Thermo Fisher Scientific | Cat# R960-25; RRID:AB_2556564 |
| β-Actin (13E5) Rabbit mAb | Cell Signaling Technology | Cat# 4970; RRID:AB_2223172 |
| Lysophospholipase 1 antibody | Abcam | Cat# ab91606; RRID:AB_10565192 |
| Anti-APT-2 antibody | Abcam | Cat# ab151578 |
| Phospho-Akt (Ser473) Rabbit mAb | Cell Signaling Technology | Cat# 4060; RRID:AB_2315049 |
| Akt (pan) (40D4) Mouse mAb | Cell Signaling Technology | Cat# 2920; RRID:AB_1147620 |
| Vinculin (E1E9V) | Cell Signaling Technology | Cat# 13901; RRID:AB_2728768 |
| TOMM20 antibody | Abcam | Cat# ab56783; RRID:AB_945896 |
| TIMM44 antibody | Proteintech | Cat# 13859-1-AP; RRID:AB_2204679 |
| HMGCL antibody | Proteintech | Cat# 16898-1-AP; RRID:AB_2295304 |
| CRLS1 Polyclonal Antibody | Thermo Fisher Scientific | Cat# PA5-25338; RRID:AB_2542838 |
| Anti-CPT2 Antibody | Abcam | Cat# ab181114; RRID:AB_2687503 |
| Anti-Flotillin-1 Monoclonal Antibody | BD Biosciences | Cat# 610820; RRID:AB_398139 |
| SDHA (D6J9M) Antibody | Cell Signaling Technology | Cat# 11998; RRID:AB_2750900 |
| TACO1/CCDC44 antibody | Proteintech | Cat# 21147-1-AP; RRID:AB_10732604 |
| Slc1a5 antibody | Cell Signaling Technology | Cat# 8057; RRID:AB_10891440 |
| c-Myc Antibody (9E10) | Santa Cruz Biotechnology | Cat# sc-40; RRID:AB_627268 |
| RFP Monoclonal antibody (6G6) | Proteintech | Cat# 6g6; RRID:AB_2631395 |
| Phospho-Akt (Thr308) Antibody | Cell Signaling Technology | Cat# 9275; RRID:AB_329828 |
| FoxO1 (D7C1H) | Cell Signaling Technology | Cat# 14952; RRID:AB_2722487 |
| Phospho-FoxO1 (Ser256) Rabbit mAb | Cell Signaling Technology | Cat# 84192; RRID:AB_2800035 |
| G6PC antibody | Proteintech | Cat# 22169-1-AP; RRID:AB_2879015 |
| Alexa Fluor 647 TOMM20 antibody | Abcam | Cat# ab209606; RRID:AB_2934123 |
| Anti-Mouse Antibody, Alexa Fluor 488 | Thermo Fisher Scientific | Cat# A-11029; RRID:AB_2534088 |
| GAPDH Rabbit antibody (D16H11) | Cell Signaling Technology | Cat# 5174; RRID:AB_10622025 |
| Anti-PCK1/PEPC antibody | Abcam | Cat# ab70358; RRID:AB_1925305 |
|
| ||
| Bacterial and virus strains | ||
|
| ||
| DH10B Competent Cells | Thermo Fisher Scientific | Cat# EC0113 |
|
| ||
| Chemicals, peptides, and recombinant proteins | ||
|
| ||
| S-methyl methanethiosulfonate (MMTS) | Sigma | Cat# 64306 |
| Hexadecylsulfonyl fluoride (HDSF) | Santa Cruz Biotechnology | Cat# sc-221708 |
| Hydroxylamine | Thermo Fisher Scientific | Cat# B22202.AE |
| Palmitic acid alkyne | Cayman Chemical | Cat# 13266 |
| Hexadimethrine bromide (Polybrene) | Sigma | Cat# H9268-10G |
| Biotin | Sigma | Cat# B4501-500MG |
| Urea | Sigma | Cat# U4884 |
| Leucine | Sigma | Cat# L8912 |
| Glutamine | Sigma | Cat# 49419 |
| Iodoacetamide | Thermo Fisher Scientific | Cat# A39271 |
| Lysyl endopeptidase | Wako Chemicals | Cat# 129-02541 |
| Trypsin | Promega | Cat# V5113 |
| Trifluoroacetic acid | Sigma | Cat# 91707 |
| Azide-biotin | Sigma | Cat# 762024 |
| GelRed® Nucleic Acid Stain | Sigma | Cat# SCT123 |
| BsrGI-HF | New England Biolabs | Cat# R3575S |
| EcoRV-HF | New England Biolabs | Cat# R3195S |
|
| ||
| Critical commercial assays | ||
|
| ||
| BCA protein assay kits | Thermo Fisher Scientific | Cat# 23227 |
| TMT10plex™ Isobaric Label Reagent set | Thermo Fisher Scientific | Cat# 90110 |
| Gateway™ BP Clonase™ II Enzyme mix | Thermo Fisher Scientific | Cat# 11789020 |
| Gateway™ LR Clonase™ II Enzyme mix | Thermo Fisher Scientific | Cat# 11791020 |
| Quantitative Peptide Assay kit | Thermo Fisher Scientific | Cat# 23290 |
| PureLink RNA Mini Kit | Thermo Fisher Scientific | Cat# 12183018A |
| cDNA Reverse Transcription Kit | Thermo Fisher Scientific | Cat# 4368813 |
| SYBR® Premix Ex Taq™ | TAKARA BIO | Cat# RR420A |
| Glucose assay kit | Wako Chemicals | Cat# 997-03001 |
| BCAA assay kit | Abcam | Cat# ab83374 |
| Ketone Body Colorimetric Assay Kit | Cayman Chemicals | Cat# 700190 |
|
| ||
| Deposited data | ||
|
| ||
| Mass spectrometry dataset | ProteomeXchange | Accession ID: PXD041552 |
|
| ||
| Experimental models: Cell lines | ||
|
| ||
| HEK293T | ATCC | Cat# CRL-11268; RRID:CVCL_1926 |
| HepG2 | ATCC | Cat# HB-8065; RRID:CVCL_0027 |
|
| ||
| Experimental models: Organisms/strains | ||
|
| ||
| Mouse: C57BL/6J floxed Lypla1 | Wei et al.14 | N/A |
| Mouse: Lypla2tm1a(KOMP)Mbp | KOMP Repository | RRID:IMSR_KOMP:CSD34805-1a-Mbp |
| Mouse: B6.Cg-Tg(ACTFLPe)9205Dym/J | The Jackson Laboratory | RRID:IMSR_JAX:005703 |
| Mouse: C57BL/6J floxed Lypla2 | This paper | N/A |
| Mouse: Albumin-Cre | The Jackson Laboratory | RRID:IMSR_JAX:003574 |
|
| ||
| Oligonucleotides | ||
|
| ||
| Primers used for qPCR | See Table S4 for primers | N/A |
|
| ||
| Recombinant DNA | ||
|
| ||
| Lypla1 cDNA | Origene | Cat# RC202029 |
| Lypla2 cDNA | Origene | Cat# RC202021 |
| p667-UBC-GW-V5-mT-puromycin | M. Ben Major lab | N/A |
| psPAX2 | Unpublished | Gift from Didier Trono Addgene plasmid # 12260 |
| pMD2.G | Unpublished | Gift from Didier Trono Addgene plasmid # 12259 |
| Myc-Hmgcl | Origene | Cat# MR204737 |
| Myc-Cpt2 | Origene | Cat# MR216278 |
| APT1-mT | This paper | N/A |
| APT2-mT | This paper | N/A |
| pLV-mScarlet-I | Unpublished | Gift from Pantelis Tsoulfas Addgene plasmid # 159172 |
| APT1-mScarlet | This paper | N/A |
|
| ||
| Software and algorithms | ||
|
| ||
| Fiji-ImageJ | National Inst. Of Health | https://ImageJ.nih.gov/ij/ |
| Prism 9 | Graphpad software | https://www.graphpad.com/scientific-software/prism/ |
| DAVID Bioinformatics | Laboratory of Human Retrovirology and Immunoinformatics (LHRI) | https://david.ncifcrf.gov/ |
| CalR | Mina et al.66 | https://calrapp.org/ |
| Mascot | Perkins et al.67 | http://www.matrixscience.com/ |
| Fiji plugin: BIOP JACop | Bioimaging And Optics Platform | https://c4science.ch/w/bioimaging_and_optics_platform_biop/image-processing/imagej_tools/jacop_b/ |
| R | R Core Team (v4.3.0, 2023) | https://www.R-project.org/ |
| Posit/RStudio | RStudio Team (2023.03.0) | https://posit.co/products/open-source/rstudio/ |
| R package: limma | Ritchie et al.68 | https://www.bioconductor.org/packages/release/bioc/html/limma.html |
| R package: mixtools: normalmixEM | Benaglia et al.69 | http://www.jstatsoft.org/v32/i06/ |
| proteoQ | Zhang Q (v1.7.5.1, 2023) | https://github.com/qzhang503/proteoQ |
| FlowJo_V10.8 | Flowjo LLC. | https://www.flowjo.com/ |
|
| ||
| Other | ||
|
| ||
| High fat diet | Envigo | Cat# TD88137 |
| Thiopropyl Sepharose bead | Cytiva | Cat# 17-0420-01 |
| Myc-trap magnetic agarose | Proteintech | Cat# Chromotek ytma-20 |
| Streptavidin agarose beads | Thermo Fisher Scientific | Cat# 20361 |
| DMEM | Thermo Fisher Scientific | Cat# 11965092 |
| TransIt-LT1 transfection reagent | Mirus | Cat# MIR 2300 |
| Intercept blocking buffer | LI-COR Biosciences | Cat# 927-60001 |
| Lenti-X™ concentrator | TAKARA BIO | Cat# 631231 |
| IRDye® 800CW Streptavidin | LI-COR Biosciences | Cat# 926-32230 |
| IRDye 680RD Streptavidin | LI-COR Biosciences | Cat# 926-68079 |
| Streptavidin, Alexa Fluor 680 conjugate | Thermo Fisher Scientific | Cat# S21378 |
| MitoTracker™ Green FM | Thermo Fisher Scientific | Cat# M7514 |
| MitoSOX™ Red | Thermo Fisher Scientific | Cat# M36008 |
| cOmplete™, EDTA-free Protease Inhibitor Cocktail | Roche | Cat# 11873580001 |
Highlights.
APT1 and APT2 deacylate mitochondrial targets including mediators of glutamine metabolism
APT proximity networks include the major mitochondrial translocases Tomm20 and Timm44
High-fat-fed liver-specific APT1/APT2 knockout mice are insulin resistant
Glutamine-driven gluconeogenesis is increased in APT deficiency
ACKNOWLEDGMENTS
We thank Reid Townsend, MD, PhD, Petra Erdmann-Gilmore, Yiling Mi, and Robert Sprung for MS expertise. The proteomic experiments were performed at the Washington University Proteomics Shared Resource (WU-PSR). The WU-PSR is supported in part by the WU Institute of Clinical and Translational Sciences (NCATS UL1 TR000448), the Mass Spectrometry Research Resource (NIGMS P41 GM103422), and the Siteman Comprehensive Cancer Center Support Grant (NCI P30 CA091842). These studies were also funded by NIH Medical Scientist Training Program grant T32 GM007200, F30 DK131830, R01 HL157154, and P30 DK020579. Schema were designed on BioRender.com.
INCLUSION AND DIVERSITY
We support inclusive, diverse, and equitable conduct of research.
Footnotes
DECLARATION OF INTERESTS
The authors declare no competing interests.
SUPPLEMENTAL INFORMATION
Supplemental information can be found online at https://doi.org/10.1016/j.celrep.2023.113389.
REFERENCES
- 1.Kahn SE (2003). The relative contributions of insulin resistance and beta-cell dysfunction to the pathophysiology of Type 2 diabetes. Diabetologia 46, 3–19. 10.1007/s00125-002-1009-0. [DOI] [PubMed] [Google Scholar]
- 2.Petersen MC, Vatner DF, and Shulman GI (2017). Regulation of hepatic glucose metabolism in health and disease. Nat. Rev. Endocrinol. 13, 572–587. 10.1038/nrendo.2017.80. [DOI] [PMC free article] [PubMed] [Google Scholar]
- 3.Roden M, Price TB, Perseghin G, Petersen KF, Rothman DL, Cline GW, and Shulman GI (1996). Mechanism of free fatty acid-induced insulin resistance in humans. J. Clin. Invest. 97, 2859–2865. 10.1172/JCI118742. [DOI] [PMC free article] [PubMed] [Google Scholar]
- 4.Yang Q, Vijayakumar A, and Kahn BB (2018). Metabolites as regulators of insulin sensitivity and metabolism. Nat. Rev. Mol. Cell Biol. 19, 654–672. 10.1038/s41580-018-0044-8. [DOI] [PMC free article] [PubMed] [Google Scholar]
- 5.Kashyap S, Belfort R, Gastaldelli A, Pratipanawatr T, Berria R, Pratipanawatr W, Bajaj M, Mandarino L, DeFronzo R, and Cusi K (2003). A sustained increase in plasma free fatty acids impairs insulin secretion in nondiabetic subjects genetically predisposed to develop type 2 diabetes. Diabetes 52, 2461–2474. 10.2337/diabetes.52.10.2461. [DOI] [PubMed] [Google Scholar]
- 6.Zhou M, Shao J, Wu CY, Shu L, Dong W, Liu Y, Chen M, Wynn RM, Wang J, Wang J, et al. (2019). Targeting BCAA Catabolism to Treat Obesity-Associated Insulin Resistance. Diabetes 68, 1730–1746. 10.2337/db18-0927. [DOI] [PMC free article] [PubMed] [Google Scholar]
- 7.Yu D, Richardson NE, Green CL, Spicer AB, Murphy ME, Flores V, Jang C, Kasza I, Nikodemova M, Wakai MH, et al. (2021). The adverse metabolic effects of branched-chain amino acids are mediated by isoleucine and valine. Cell Metabol. 33, 905–922.e6. 10.1016/j.cmet.2021.03.025. [DOI] [PMC free article] [PubMed] [Google Scholar]
- 8.Lynch CJ, and Adams SH (2014). Branched-chain amino acids in metabolic signalling and insulin resistance. Nat. Rev. Endocrinol. 10, 723–736. 10.1038/nrendo.2014.171. [DOI] [PMC free article] [PubMed] [Google Scholar]
- 9.Vanweert F, Neinast M, Tapia EE, van de Weijer T, Hoeks J, Schrauwen-Hinderling VB, Blair MC, Bornstein MR, Hesselink MKC, Schrauwen P, et al. (2022). A randomized placebo-controlled clinical trial for pharmacological activation of BCAA catabolism in patients with type 2 diabetes. Nat. Commun. 13, 3508. 10.1038/s41467-022-31249-9. [DOI] [PMC free article] [PubMed] [Google Scholar]
- 10.Hubbard BT, LaMoia TE, Goedeke L, Gaspar RC, Galsgaard KD, Kahn M, Mason GF, and Shulman GI (2023). Q-Flux: A method to assess hepatic mitochondrial succinate dehydrogenase, methylmalonylCoA mutase, and glutaminase fluxes in vivo. Cell Metabol. 35, 212–226.e4. 10.1016/j.cmet.2022.11.011. [DOI] [PMC free article] [PubMed] [Google Scholar]
- 11.Linder ME, and Deschenes RJ (2007). Palmitoylation: policing protein stability and traffic. Nat. Rev. Mol. Cell Biol. 8, 74–84. 10.1038/nrm2084. [DOI] [PubMed] [Google Scholar]
- 12.Blanc M, David FPA, and van der Goot FG (2019). SwissPalm 2: Protein S-Palmitoylation Database. Methods Mol. Biol. 2009, 203–214. 10.1007/978-1-4939-9532-5_16. [DOI] [PubMed] [Google Scholar]
- 13.Nasseri GG, Matin N, Wild AR, Tosefsky K, Flibotte S, Stacey RG, Hollman RB, Foster LJ, and Bamji SX (2022). Synaptic activity-dependent changes in the hippocampal palmitoylome. Sci. Signal. 15, eadd2519. 10.1126/scisignal.add2519. [DOI] [PubMed] [Google Scholar]
- 14.Wei X, Adak S, Zayed M, Yin L, Feng C, Speck SL, Kathayat RS, Zhang Q, Dickinson BC, and Semenkovich CF (2020). Endothelial Palmitoylation Cycling Coordinates Vessel Remodeling in Peripheral Artery Disease. Circ. Res. 127, 249–265. 10.1161/CIRCRESAHA.120.316752. [DOI] [PMC free article] [PubMed] [Google Scholar]
- 15.Dong G, Adak S, Spyropoulos G, Zhang Q, Feng C, Yin L, Speck SL, Shyr Z, Morikawa S, Kitamura RA, et al. (2023). Palmitoylation couples insulin hypersecretion with beta cell failure in diabetes. Cell Metabol. 35, 332–344.e7. 10.1016/j.cmet.2022.12.012. [DOI] [PMC free article] [PubMed] [Google Scholar]
- 16.Wang J, Hao JW, Wang X, Guo H, Sun HH, Lai XY, Liu LY, Zhu M, Wang HY, Li YF, et al. (2019). DHHC4 and DHHC5 Facilitate Fatty Acid Uptake by Palmitoylating and Targeting CD36 to the Plasma Membrane. Cell Rep. 26, 209–221.e5. 10.1016/j.celrep.2018.12.022. [DOI] [PubMed] [Google Scholar]
- 17.Hao JW, Wang J, Guo H, Zhao YY, Sun HH, Li YF, Lai XY, Zhao N, Wang X, Xie C, et al. (2020). CD36 facilitates fatty acid uptake by dynamic palmitoylation-regulated endocytosis. Nat. Commun. 11, 4765. 10.1038/s41467-020-18565-8. [DOI] [PMC free article] [PubMed] [Google Scholar]
- 18.Du K, Murakami S, Sun Y, Kilpatrick CL, and Luscher B (2017). DHHC7 Palmitoylates Glucose Transporter 4 (Glut4) and Regulates Glut4 Membrane Translocation. J. Biol. Chem. 292, 2979–2991. 10.1074/jbc.M116.747139. [DOI] [PMC free article] [PubMed] [Google Scholar]
- 19.Shen LF, Chen YJ, Liu KM, Haddad ANS, Song IW, Roan HY, Chen LY, Yen JJY, Chen YJ, Wu JY, and Chen YT (2017). Role of S-Palmitoylation by ZDHHC13 in Mitochondrial function and Metabolism in Liver. Sci. Rep. 7, 2182. 10.1038/s41598-017-02159-4. [DOI] [PMC free article] [PubMed] [Google Scholar]
- 20.Sun Y, and Du K (2022). DHHC17 Is a New Regulator of AMPK Signaling. Mol. Cell Biol. 42, e0013122. 10.1128/mcb.00131-22. [DOI] [PMC free article] [PubMed] [Google Scholar]
- 21.Jang W, Puchkov D, Samsó P, Liang Y, Nadler-Holly M, Sigrist SJ, Kintscher U, Liu F, Mamchaoui K, Mouly V, and Haucke V (2022). Endosomal lipid signaling reshapes the endoplasmic reticulum to control mitochondrial function. Science 378, eabq5209. 10.1126/science.abq5209. [DOI] [PubMed] [Google Scholar]
- 22.Zhu Z, Zhou X, Du H, Cloer EW, Zhang J, Mei L, Wang Y, Tan X, Hepperla AJ, Simon JM, et al. (2023). STING Suppresses Mitochondrial VDAC2 to Govern RCC Growth Independent of Innate Immunity. Adv. Sci. 10, e2203718. 10.1002/advs.202203718. [DOI] [PMC free article] [PubMed] [Google Scholar]
- 23.Zeng S, Wu F, Chen M, Li Y, You M, Zhang Y, Yang P, Wei L, Ruan XZ, Zhao L, and Chen Y (2022). Inhibition of Fatty Acid Translocase (FAT/CD36) Palmitoylation Enhances Hepatic Fatty Acid beta-Oxidation by Increasing Its Localization to Mitochondria and Interaction with Long-Chain Acyl-CoA Synthetase 1. Antioxidants Redox Signal. 36, 1081–1100. 10.1089/ars.2021.0157. [DOI] [PubMed] [Google Scholar]
- 24.Cao Y, Qiu T, Kathayat RS, Azizi SA, Thorne AK, Ahn D, Fukata Y, Fukata M, Rice PA, and Dickinson BC (2019). ABHD10 is an S-depalmitoylase affecting redox homeostasis through peroxiredoxin-5. Nat. Chem. Biol. 15, 1232–1240. 10.1038/s41589-019-0399-y. [DOI] [PMC free article] [PubMed] [Google Scholar]
- 25.Lynes EM, Bui M, Yap MC, Benson MD, Schneider B, Ellgaard L, Berthiaume LG, and Simmen T (2012). Palmitoylated TMX and calnexin target to the mitochondria-associated membrane. EMBO J. 31, 457–470. 10.1038/emboj.2011.384. [DOI] [PMC free article] [PubMed] [Google Scholar]
- 26.Morgenstern M, Peikert CD, Lübbert P, Suppanz I, Klemm C, Alka O, Steiert C, Naumenko N, Schendzielorz A, Melchionda L, et al. (2021). Quantitative high-confidence human mitochondrial proteome and its dynamics in cellular context. Cell Metabol. 33, 2464–2483.e18. 10.1016/j.cmet.2021.11.001. [DOI] [PMC free article] [PubMed] [Google Scholar]
- 27.Kathayat RS, Cao Y, Elvira PD, Sandoz PA, Zaballa ME, Springer MZ, Drake LE, Macleod KF, van der Goot FG, and Dickinson BC (2018). Active and dynamic mitochondrial S-depalmitoylation revealed by targeted fluorescent probes. Nat. Commun. 9, 334. 10.1038/s41467-017-02655-1. [DOI] [PMC free article] [PubMed] [Google Scholar]
- 28.Abrami L, Audagnotto M, Ho S, Marcaida MJ, Mesquita FS, Anwar MU, Sandoz PA, Fonti G, Pojer F, Dal Peraro M, and van der Goot FG (2021). Palmitoylated acyl protein thioesterase APT2 deforms membranes to extract substrate acyl chains. Nat. Chem. Biol. 17, 438–447. 10.1038/s41589-021-00753-2. [DOI] [PMC free article] [PubMed] [Google Scholar]
- 29.Wepy JA, Galligan JJ, Kingsley PJ, Xu S, Goodman MC, Tallman KA, Rouzer CA, and Marnett LJ (2019). Lysophospholipases cooperate to mediate lipid homeostasis and lysophospholipid signaling. J. Lipid Res. 60, 360–374. 10.1194/jlr.M087890. [DOI] [PMC free article] [PubMed] [Google Scholar]
- 30.Won SJ, Davda D, Labby KJ, Hwang SY, Pricer R, Majmudar JD, Armacost KA, Rodriguez LA, Rodriguez CL, Chong FS, et al. (2016). Molecular Mechanism for Isoform-Selective Inhibition of Acyl Protein Thioesterases 1 and 2 (APT1 and APT2). ACS Chem. Biol. 11, 3374–3382. 10.1021/acschembio.6b00720. [DOI] [PMC free article] [PubMed] [Google Scholar]
- 31.Zhang M, Zhou L, Xu Y, Yang M, Xu Y, Komaniecki GP, Kosciuk T, Chen X, Lu X, Zou X, et al. (2020). A STAT3 palmitoylation cycle promotes T(H)17 differentiation and colitis. Nature 586, 434–439. 10.1038/s41586-020-2799-2. [DOI] [PMC free article] [PubMed] [Google Scholar]
- 32.Abrami L, Dallavilla T, Sandoz PA, Demir M, Kunz B, Savoglidis G, Hatzimanikatis V, and van der Goot FG (2017). Identification and dynamics of the human ZDHHC16-ZDHHC6 palmitoylation cascade. Elife 6, e27826. 10.7554/eLife.27826. [DOI] [PMC free article] [PubMed] [Google Scholar]
- 33.Milde S, and Coleman MP (2014). Identification of palmitoyltransferase and thioesterase enzymes that control the subcellular localization of axon survival factor nicotinamide mononucleotide adenylyltransferase 2 (NMNAT2). J. Biol. Chem. 289, 32858–32870. 10.1074/jbc.M114.582338. [DOI] [PMC free article] [PubMed] [Google Scholar]
- 34.Lee RG, Balasubramaniam S, Stentenbach M, Kralj T, McCubbin T, Padman B, Smith J, Riley LG, Priyadarshi A, Peng L, et al. (2022). Deleterious variants in CRLS1 lead to cardiolipin deficiency and cause an autosomal recessive multi-system mitochondrial disease. Hum. Mol. Genet. 31, 3597–3612. 10.1093/hmg/ddac040. [DOI] [PMC free article] [PubMed] [Google Scholar]
- 35.Agajanian MJ, Potjewyd FM, Bowman BM, Solomon S, LaPak KM, Bhatt DP, Smith JL, Goldfarb D, Axtman AD, and Major MB (2022). Protein proximity networks and functional evaluation of the casein kinase 1 gamma family reveal unique roles for CK1gamma3 in WNT signaling. J. Biol. Chem. 298, 101986. 10.1016/j.jbc.2022.101986. [DOI] [PMC free article] [PubMed] [Google Scholar]
- 36.Kong E, Peng S, Chandra G, Sarkar C, Zhang Z, Bagh MB, and Mukherjee AB (2013). Dynamic palmitoylation links cytosol-membrane shuttling of acyl-protein thioesterase-1 and acyl-protein thioesterase-2 with that of proto-oncogene H-ras product and growth-associated protein-43. J. Biol. Chem. 288, 9112–9125. 10.1074/jbc.M112.421073. [DOI] [PMC free article] [PubMed] [Google Scholar]
- 37.Yoo HC, Park SJ, Nam M, Kang J, Kim K, Yeo JH, Kim JK, Heo Y, Lee HS, Lee MY, et al. (2020). A Variant of SLC1A5 Is a Mitochondrial Glutamine Transporter for Metabolic Reprogramming in Cancer Cells. Cell Metabol. 31, 267–283.e12. 10.1016/j.cmet.2019.11.020. [DOI] [PubMed] [Google Scholar]
- 38.Sugars JM, Cellek S, Manifava M, Coadwell J, and Ktistakis NT (1999). Fatty acylation of phospholipase D1 on cysteine residues 240 and 241 determines localization on intracellular membranes. J. Biol. Chem. 274, 30023–30027. 10.1074/jbc.274.42.30023. [DOI] [PubMed] [Google Scholar]
- 39.Sugars JM, Cellek S, Manifava M, Coadwell J, and Ktistakis NT (2002). Hierarchy of membrane-targeting signals of phospholipase D1 involving lipid modification of a pleckstrin homology domain. J. Biol. Chem. 277, 29152–29161. 10.1074/jbc.M112169200. [DOI] [PubMed] [Google Scholar]
- 40.Na U, Yu W, Cox J, Bricker DK, Brockmann K, Rutter J, Thummel CS, and Winge DR (2014). The LYR factors SDHAF1 and SDHAF3 mediate maturation of the iron-sulfur subunit of succinate dehydrogenase. Cell Metabol. 20, 253–266. 10.1016/j.cmet.2014.05.014. [DOI] [PMC free article] [PubMed] [Google Scholar]
- 41.Hirano T, Kishi M, Sugimoto H, Taguchi R, Obinata H, Ohshima N, Tatei K, and Izumi T (2009). Thioesterase activity and subcellular localization of acylprotein thioesterase 1/lysophospholipase 1. Biochim. Biophys. Acta 1791, 797–805. 10.1016/j.bbalip.2009.05.001. [DOI] [PubMed] [Google Scholar]
- 42.Wang A, Johnson CA, Jones Y, Ellisman MH, and Dennis EA (2000). Subcellular localization and PKC-dependent regulation of the human lysophospholipase A/acyl-protein thioesterase in WISH cells. Biochim. Biophys. Acta 1484, 207–214. 10.1016/s1388-1981(00)00020-2. [DOI] [PubMed] [Google Scholar]
- 43.Napoli E, Song G, Liu S, Espejo A, Perez CJ, Benavides F, and Giulivi C (2017). Zdhhc13-dependent Drp1 S-palmitoylation impacts brain bioenergetics, anxiety, coordination and motor skills. Sci. Rep. 7, 12796. 10.1038/s41598-017-12889-0. [DOI] [PMC free article] [PubMed] [Google Scholar]
- 44.Bakare AB, Lesnefsky EJ, and Iyer S (2021). Leigh Syndrome: A Tale of Two Genomes. Front. Physiol. 12, 693734. 10.3389/fphys.2021.693734. [DOI] [PMC free article] [PubMed] [Google Scholar]
- 45.Leary SC, Cobine PA, Kaufman BA, Guercin GH, Mattman A, Palaty J, Lockitch G, Winge DR, Rustin P, Horvath R, and Shoubridge EA (2007). The human cytochrome c oxidase assembly factors SCO1 and SCO2 have regulatory roles in the maintenance of cellular copper homeostasis. Cell Metabol. 5, 9–20. 10.1016/j.cmet.2006.12.001. [DOI] [PubMed] [Google Scholar]
- 46.Mourier A, Ruzzenente B, Brandt T, Kühlbrandt W, and Larsson NG (2014). Loss of LRPPRC causes ATP synthase deficiency. Hum. Mol. Genet. 23, 2580–2592. 10.1093/hmg/ddt652. [DOI] [PMC free article] [PubMed] [Google Scholar]
- 47.Weraarpachai W, Antonicka H, Sasarman F, Seeger J, Schrank B, Kolesar JE, Lochmüller H, Chevrette M, Kaufman BA, Horvath R, and Shoubridge EA (2009). Mutation in TACO1, encoding a translational activator of COX I, results in cytochrome c oxidase deficiency and late-onset Leigh syndrome. Nat. Genet. 41, 833–837. 10.1038/ng.390. [DOI] [PubMed] [Google Scholar]
- 48.Richman TR, Spåhr H, Ermer JA, Davies SMK, Viola HM, Bates KA, Papadimitriou J, Hool LC, Rodger J, Larsson NG, et al. (2016). Loss of the RNA-binding protein TACO1 causes late-onset mitochondrial dysfunction in mice. Nat. Commun. 7, 11884. 10.1038/ncomms11884. [DOI] [PMC free article] [PubMed] [Google Scholar]
- 49.Friederich MW, Elias AF, Kuster A, Laugwitz L, Larson AA, Landry AP, Ellwood-Digel L, Mirsky DM, Dimmock D, Haven J, et al. (2020). Pathogenic variants in SQOR encoding sulfide:quinone oxidoreductase are a potentially treatable cause of Leigh disease. J. Inherit. Metab. Dis. 43, 1024–1036. 10.1002/jimd.12232. [DOI] [PMC free article] [PubMed] [Google Scholar]
- 50.Haack TB, Jackson CB, Murayama K, Kremer LS, Schaller A, Kotzaeridou U, de Vries MC, Schottmann G, Santra S, Büchner B, et al. (2015). Deficiency of ECHS1 causes mitochondrial encephalopathy with cardiac involvement. Ann. Clin. Transl. Neurol. 2, 492–509. 10.1002/acn3.189. [DOI] [PMC free article] [PubMed] [Google Scholar]
- 51.Lake NJ, Compton AG, Rahman S, and Thorburn DR (2016). Leigh syndrome: One disorder, more than 75 monogenic causes. Ann. Neurol. 79, 190–203. 10.1002/ana.24551. [DOI] [PubMed] [Google Scholar]
- 52.Sustarsic EG, Ma T, Lynes MD, Larsen M, Karavaeva I, Havelund JF, Nielsen CH, Jedrychowski MP, Moreno-Torres M, Lundh M, et al. (2018). Cardiolipin Synthesis in Brown and Beige Fat Mitochondria Is Essential for Systemic Energy Homeostasis. Cell Metabol. 28, 159–174.e11. 10.1016/j.cmet.2018.05.003. [DOI] [PMC free article] [PubMed] [Google Scholar]
- 53.Tu C, Xiong H, Hu Y, Wang W, Mei G, Wang H, Li Y, Zhou Z, Meng F, Zhang P, and Mei Z (2020). Cardiolipin Synthase 1 Ameliorates NASH Through Activating Transcription Factor 3 Transcriptional Inactivation. Hepatology 72, 1949–1967. 10.1002/hep.31202. [DOI] [PubMed] [Google Scholar]
- 54.Oudemans-van Straaten HM, Bosman RJ, Treskes M, van der Spoel HJ, and Zandstra DF (2001). Plasma glutamine depletion and patient outcome in acute ICU admissions. Intensive Care Med. 27, 84–90. 10.1007/s001340000703. [DOI] [PubMed] [Google Scholar]
- 55.Poindexter BB, Ehrenkranz RA, Stoll BJ, Wright LL, Poole WK, Oh W, Bauer CR, Papile LA, Tyson JE, Carlo WA, et al. (2004). Parenteral glutamine supplementation does not reduce the risk of mortality or late-onset sepsis in extremely low birth weight infants. Pediatrics 113, 1209–1215. 10.1542/peds.113.5.1209. [DOI] [PubMed] [Google Scholar]
- 56.Marik PE, and Zaloga GP (2008). Immunonutrition in critically ill patients: a systematic review and analysis of the literature. Intensive Care Med. 34, 1980–1990. 10.1007/s00134-008-1213-6. [DOI] [PubMed] [Google Scholar]
- 57.Heyland DK, Wibbenmeyer L, Pollack JA, Friedman B, Turgeon AF, Eshraghi N, Jeschke MG, Bé lisle S., Grau D., Mandell S., et al. (2022). A Randomized Trial of Enteral Glutamine for Treatment of Burn Injuries. N. Engl. J. Med. 387, 1001–1010. 10.1056/NEJMoa2203364. [DOI] [PubMed] [Google Scholar]
- 58.Niihara Y, Miller ST, Kanter J, Lanzkron S, Smith WR, Hsu LL, Gordeuk VR, Viswanathan K, Sarnaik S, Osunkwo I, et al. (2018). A Phase 3 Trial of l-Glutamine in Sickle Cell Disease. N. Engl. J. Med. 379, 226–235. 10.1056/NEJMoa1715971. [DOI] [PubMed] [Google Scholar]
- 59.Asrani V, Chang WK, Dong Z, Hardy G, Windsor JA, and Petrov MS (2013). Glutamine supplementation in acute pancreatitis: a meta-analysis of randomized controlled trials. Pancreatology 13, 468–474. 10.1016/j.pan.2013.07.282. [DOI] [PubMed] [Google Scholar]
- 60.Eelen G, Dubois C, Cantelmo AR, Goveia J, Brüning U, DeRan M, Jarugumilli G, van Rijssel J, Saladino G, Comitani F, et al. (2018). Role of glutamine synthetase in angiogenesis beyond glutamine synthesis. Nature 561, 63–69. 10.1038/s41586-018-0466-7. [DOI] [PubMed] [Google Scholar]
- 61.Cox AG, Hwang KL, Brown KK, Evason K, Beltz S, Tsomides A, O’Connor K, Galli GG, Yimlamai D, Chhangawala S, et al. (2016). Yap reprograms glutamine metabolism to increase nucleotide biosynthesis and enable liver growth. Nat. Cell Biol. 18, 886–896. 10.1038/ncb3389. [DOI] [PMC free article] [PubMed] [Google Scholar]
- 62.Sekine S, Lan BYA, Bedolli M, Feng S, and Hebrok M (2006). Liver-specific loss of beta-catenin blocks glutamine synthesis pathway activity and cytochrome p450 expression in mice. Hepatology 43, 817–825. 10.1002/hep.21131. [DOI] [PubMed] [Google Scholar]
- 63.Wang J, Mauvoisin D, Martin E, Atger F, Galindo AN, Dayon L, Sizzano F, Palini A, Kussmann M, Waridel P, et al. (2017). Nuclear Proteomics Uncovers Diurnal Regulatory Landscapes in Mouse Liver. Cell Metabol. 25, 102–117. 10.1016/j.cmet.2016.10.003. [DOI] [PMC free article] [PubMed] [Google Scholar]
- 64.Le Couteur DG, Solon-Biet SM, Parker BL, Pulpitel T, Brandon AE, Hunt NJ, Wali JA, Gokarn R, Senior AM, Cooney GJ, et al. (2021). Nutritional reprogramming of mouse liver proteome is dampened by metformin, resveratrol, and rapamycin. Cell Metabol. 33, 2367–2379.e4. 10.1016/j.cmet.2021.10.016. [DOI] [PubMed] [Google Scholar]
- 65.Mann G, Mora S, Madu G, and Adegoke OAJ (2021). Branched-chain Amino Acids: Catabolism in Skeletal Muscle and Implications for Muscle and Whole-body Metabolism. Front. Physiol. 12, 702826. 10.3389/fphys.2021.702826. [DOI] [PMC free article] [PubMed] [Google Scholar]
- 66.Mina AI, LeClair RA, LeClair KB, Cohen DE, Lantier L, and Banks AS (2018). CalR: A Web-Based Analysis Tool for Indirect Calorimetry Experiments. Cell Metabol. 28, 656–666.e1. 10.1016/j.cmet.2018.06.019. [DOI] [PMC free article] [PubMed] [Google Scholar]
- 67.Perkins DN, Pappin DJ, Creasy DM, and Cottrell JS (1999). Probability-based protein identification by searching sequence databases using mass spectrometry data. Electrophoresis 20, 3551–3567. . [DOI] [PubMed] [Google Scholar]
- 68.Ritchie ME, Phipson B, Wu D, Hu Y, Law CW, Shi W, and Smyth GK (2015). limma powers differential expression analyses for RNA-sequencing and microarray studies. Nucleic Acids Res. 43, e47. 10.1093/nar/gkv007. [DOI] [PMC free article] [PubMed] [Google Scholar]
- 69.Benaglia T, Chauveau D, Hunter DR, and Young D (2009). mixtools: An R Package for Analyzing Finite Mixture Models. J. Stat. Software 32, 1–29. [Google Scholar]
- 70.Kim DI, Jensen SC, Noble KA, Kc B, Roux KH, Motamedchaboki K, and Roux KJ (2016). An improved smaller biotin ligase for BioID proximity labeling. Mol. Biol. Cell 27, 1188–1196. 10.1091/mbc.E15-12-0844. [DOI] [PMC free article] [PubMed] [Google Scholar]
- 71.Erde J, Loo RRO, and Loo JA (2017). Improving Proteome Coverage and Sample Recovery with Enhanced FASP (eFASP) for Quantitative Proteomic Experiments. Methods Mol. Biol. 1550, 11–18. 10.1007/978-1-4939-6747-6_2. [DOI] [PMC free article] [PubMed] [Google Scholar]
- 72.Mertins P, Tang LC, Krug K, Clark DJ, Gritsenko MA, Chen L, Clauser KR, Clauss TR, Shah P, Gillette MA, et al. (2018). Reproducible workflow for multiplexed deep-scale proteome and phosphoproteome analysis of tumor tissues by liquid chromatography-mass spectrometry. Nat. Protoc. 13, 1632–1661. 10.1038/s41596-018-0006-9. [DOI] [PMC free article] [PubMed] [Google Scholar]
- 73.Meier F, Brunner AD, Koch S, Koch H, Lubeck M, Krause M, Goedecke N, Decker J, Kosinski T, Park MA, et al. (2018). Online Parallel Accumulation-Serial Fragmentation (PASEF) with a Novel Trapped Ion Mobility Mass Spectrometer. Mol. Cell. Proteomics 17, 2534–2545. 10.1074/mcp.TIR118.000900. [DOI] [PMC free article] [PubMed] [Google Scholar]
- 74.Tyanova S, Temu T, and Cox J (2016). The MaxQuant computational platform for mass spectrometry-based shotgun proteomics. Nat. Protoc. 11, 2301–2319. 10.1038/nprot.2016.136. [DOI] [PubMed] [Google Scholar]
- 75.Tyanova S, Temu T, Sinitcyn P, Carlson A, Hein MY, Geiger T, Mann M, and Cox J (2016). The Perseus computational platform for comprehensive analysis of (prote)omics data. Nat. Methods 13, 731–740. 10.1038/nmeth.3901. [DOI] [PubMed] [Google Scholar]
- 76.Wei X, Song H, Yin L, Rizzo MG, Sidhu R, Covey DF, Ory DS, and Semenkovich CF (2016). Fatty acid synthesis configures the plasma membrane for inflammation in diabetes. Nature 539, 294–298. 10.1038/nature20117. [DOI] [PMC free article] [PubMed] [Google Scholar]
- 77.Martino MR, Gutié rrez-Aguilar M., Yiew NKH., Lutkewitte AJ., Singer JM., McCommis KS., Ferguson D., Liss KHH., Yoshino J., Renkemeyer MK., et al. (2022). Silencing alanine transaminase 2 in diabetic liver attenuates hyperglycemia by reducing gluconeogenesis from amino acids. Cell Rep. 41, 111633. 10.1016/j.celrep.2022.111633. [DOI] [PMC free article] [PubMed] [Google Scholar]
Associated Data
This section collects any data citations, data availability statements, or supplementary materials included in this article.
Supplementary Materials
Data Availability Statement
All data reported in this paper will be shared by the lead contact upon request. Source of Western blot images for the figures in the manuscript is available as Data S1. The mass spectrometry proteomics data have been deposited to the ProteomeXchange Consortium via the PRIDE partner repository with the dataset identifier PXD041552 and 10.6019/PXD041552 (http://proteomecentral.proteomexchange.org).
This study did not report original code.
Any additional information required to reanalyze the data reported in this paper is available from the lead contact upon request.