Abstract
The collagen fibers of the corneoscleral shell play a central role in the eye mechanical behavior. Although it is well-known that these fibers form a complex three-dimensional interwoven structure, biomechanical and microstructural studies often assume that the fibers are aligned in-plane with the tissues. This is convenient as it removes the out-of-plane components and allows focusing on the 2D maps of in-plane fiber organization that are often quite complex. The simplification, however, risks missing potentially important aspects of the tissue architecture and mechanics. In the cornea, for instance, fibers with high in-depth inclination have been shown to be mechanically important. Outside the cornea, the in-depth fiber orientations have not been characterized, preventing a deeper understanding of their potential roles. Our goal was to characterize in-depth collagen fiber organization over the whole corneoscleral shell. Seven sheep whole-globe axial sections from eyes fixed at an IOP of 50 mmHg were imaged using polarized light microscopy to measure collagen fiber orientations and density. In-depth fiber orientation distributions and anisotropy (degree of fiber alignment) accounting for fiber density were quantified over the whole sclera and in 15 regions: central cornea, peripheral cornea, limbus, anterior equator, equator, posterior equator, posterior sclera and peripapillary sclera on both nasal and temporal sides. Orientation distributions were fitted using a combination of a uniform distribution and a sum of π-periodic von Mises distributions, each with three parameters: primary orientation μ, fiber concentration factor k, and weighting factor a. To study the features of fibers that are not in-plane, i. e., fiber inclination, we quantified the percentage of inclined fibers and the range of inclination angles (half width at half maximum of inclination angle distribution). Our measurements showed that the fibers were not uniformly in-plane but exhibited instead a wide range of in-depth orientations, with fibers significantly more aligned in-plane in the anterior parts of the globe. We found that fitting the orientation distributions required between one and three π-periodic von Mises distributions with different primary orientations and fiber concentration factors. Regions of the posterior globe, particularly on the temporal side, had a larger percentage of inclined fibers and a larger range of inclination angles than anterior and equatorial regions. Variations of orientation distributions and anisotropies may imply varying out-of-plane tissue mechanical properties around the eye globe. Out-of-plane fibers could indicate fiber interweaving, not necessarily long, inclined fibers. Effects of small-scale fiber undulations, or crimp, were minimized by using tissues from eyes at high IOPs. These fiber features also play a role in tissue stiffness and stability and are therefore also important experimental information.
Keywords: orientation distribution, collagen, cornea, sclera, microstructure
1. Introduction
The biomechanics of the eye corneoscleral shell are important in the basic eye function and are heavily influenced by the collagen fiber organization (Coudrillier et al., 2013; Ethier et al., 2004). Accurate information on the corneoscleral shell collagen fiber organization is thus important to understand the eye’s physiological load-bearing behavior and biomechanics-related diseases, such as glaucoma (Coudrillier et al., 2015b; Grytz et al., 2011).
Many studies have been conducted to study the collagen fiber organization of the corneoscleral shell (Abahussin et al., 2009; Abass et al., 2015; Boote et al., 2006; Coudrillier et al., 2013; Girard et al., 2011; Gogola et al., 2018; Jan et al., 2017b; Koudouna et al., 2018; Pijanka et al., 2012; Winkler et al., 2013; Yang et al., 2018a; Yang et al., 2018b). These studies have revealed that the collagen architecture of corneoscleral shell is a complex 3D anisotropic, interwoven and inhomogeneous structure. The studies have shown, for instance, that the cornea exhibits a layered structure of lamellae. In terms of the overall cornea architecture, the studies have shown that the anterior cornea has no preferred lamella orientation, whereas the middle and posterior parts of the cornea show an orthogonal arrangement of collagen fibers preferentially aligned in the superior-inferior and nasal-temporal axes (Abahussin et al., 2009; Boote et al., 2006). In the limbus, fibers form a circumferential ring (Boote et al., 2006; Newton and Meek, 1998). For the sclera, the studies have shown circumferential fibers surrounding the canal, radial fibers extending out from the canal, and interwoven fibers distributed throughout the thickness. (Girard et al., 2011; Gogola et al., 2018; Jan et al., 2017b).
The vast majority of studies of sclera fiber orientation, while helpful, have centered on characterizing collagen fiber architecture in the tissue plane. For the front and back of the eye this has meant the characterization of fiber orientations on a coronal plane, with analysis of other regions usually involving tissue patches analyzed transversely. Interested readers can consult two good examples of this approach aimed at mapping scleral fiber orientations in rat (Girard et al., 2011) and human (Pijanka et al., 2013). For the cornea we recommend two (Meek and Knupp, 2015; Winkler et al., 2013). Studies of fiber orientation often involve the explicit or implicit assumption that the primary orientation of the fibers is close to that of the tissue plane (e.g. with the fibers exhibiting zero inclination angles relative to the local tissue plane). This is particularly common in numerical modeling of the peripapillary sclera (Voorhees et al., 2018; Zhang et al., 2015). From a mechanical perspective, this allows several convenient simplifications, such as modeling the corneoscleral shell as a thin shell structure, reducing computational demands. (Arciniegas and Amaya, 1986; Kimpton et al., 2021; Watson and Young, 2004). A few studies have explored depth-dependent variations in fiber orientation in both cornea and sclera (Abahussin et al., 2009; Danford et al., 2013; Gogola et al., 2018; Hayes et al., 2012; Pijanka et al., 2012; Pijanka et al., 2015). These have still primarily focused on analyzing the variations in the in-plane fiber orientations across depth, such as the depth-dependent “rotation” of lamellae cross patterns (Koudouna et al., 2018; Latour et al., 2012; Vohnsen and Artal, 2008). The information on these studies often comes from serial coronal section or from optical cross-sectioning in-depth. The characterization is therefore still primarily in-plane, with very limited information about fibers that have an inclination with respect to the tissue plane.
A few studies have been directed at quantifying and understanding collagen fibers that are not the tissue plane. Two notable studies analyzed cornea fiber orientations on the axial plane (Abass et al., 2015; Winkler et al., 2013). The authors noted a population of collagen fibers that are branching, interweaving and transversely inclined in-depth of cornea. The inclined fibers create a high degree of interconnectivity between fiber lamellae layers and appear to be useful for reducing fiber slippage, making the cornea more mechanically stable, and increase cornea stiffness (Morishige et al., 2007; Petsche and Pinsky, 2013; Winkler et al., 2011). Studies looking at longitudinal sections show that in-depth collagen fibers also exist outside of the cornea, with potentially important mechanical roles (Yang et al., 2018b). However, they remain uncharacterized in most of the globe, limiting our ability to understand their roles.
Our goal in this work was to quantify in-depth collagen fiber organization over the corneoscleral shell. These in-depth features of the collagen organization shed light on how fibers are organized within the cross-section of the tissue thickness. Specifically, we quantified collagen fiber orientation distribution, anisotropy, and fiber inclination in 15 regions and over the whole corneoscleral shell. The results of this study represent new quantitative data of in-depth fiber organization that will enhance understanding of the eye tissue collagen fiber organization, and in turn, eye biomechanics.
2. Methods
2.1. Sample preparation
The study was conducted in accordance with the tenets of the Declaration of Helsinki and the Association of Research in Vision and Ophthalmology's statement for the use of animals in ophthalmic and vision research. Seven whole globe axial sections from 3 eyes of 3 sheep were used for the analysis: three sections from one eye, and two sections each from the remaining two eyes. The sections were originally prepared and processed by the University of Pittsburgh Ocular Biomechanics Lab for other purposes, with particular attention given to consistent tissue handling and imaging for all eyes and sections. Histological processing was as described elsewhere (Jan et al., 2017a; Jan et al., 2015; Jan et al., 2017b). Briefly, eyes from healthy sheep were obtained from the local abattoir and processed within 24 hours of death. The episcleral tissues, fat, and muscles were carefully removed. The globes were pressurized to 50 mmHg and immersion fixed in 10% formalin solution overnight. The intact whole globe eyes were embedded in such a way that all eyes lined up in the nasal-temporal anatomical directions for cryo-sectioning. The eyes were cryo-sectioned into axial slices, with a section thickness of 30 μm. For all eyes, the sections were obtained consecutively without loss. For imaging and analysis we selected 7 sections passing through both peripapillary sclera (PPS) and central cornea and free of artifacts, such as folds or bubbles (Figure 1).
Figure 1.
(left and middle) 3D diagrams illustrating the location and orientation of the axial sectioning plane from which the sections analyzed in this study were collected. The axial view traverses both the central cornea and sclera, permitting direct observation of the collagen fibers. (right) Example PLM image of a sheep axial section utilized in the study, enabling investigation of fiber distribution throughout the tissue's thickness.
2.2. Imaging
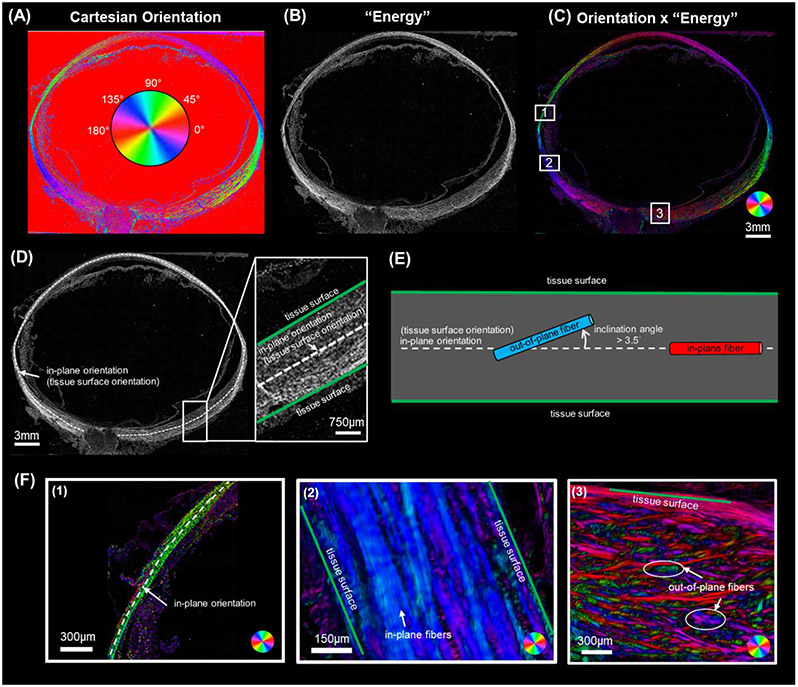
The selected sections were imaged with polarized light microscopy (PLM) using previously reported methods (Jan et al., 2017b) to visualize and quantify the collagen fiber orientations and density. We have shown that PLM is robust in visualizing collagen architecture and measuring localized collagen fiber orientation in eye tissue (Gogola et al., 2018; Jan et al., 2018; Jan et al., 2015). Briefly, the imaging system consisted of two polarized filters (Hoya, Tokyo, Japan), one a polarizer and the other an analyzer, to collect images at four filter orientations 45° apart. The relative changes in intensities at each pixel were used to determine the local collagen fiber orientation and density. The sections were imaged using an Olympus IX83 microscope with an Olympus DP74 camera and a 4x objective (1.49μm/pixel). Because the whole eye section was larger than the field of view, multiple images were captured (10% overlap) and stitched into mosaics to cover the whole section. The PLM images were processed as previously described (Jan et al., 2017a; Jan et al., 2017b) to obtain Cartesian orientation (Figure 2 A) and “energy” images (Figure 2 B). The Cartesian orientation images display the collagen orientation at each pixel in the section plane that ranges from 0 to 180 degrees. The “energy” image value at each pixel ranges from 0 to 1 and reflects the signal strength in each pixel that is proportional to collagen density (Jan et al., 2015). Elsewhere, we have shown that PLM-derived measurements of the type of parameters of interest in this work are not affected by the imaging system, magnification, or mosaicking (Jan et al., 2015).
Figure 2.
(A-C) Example PLM images of an axial section of a sheep eye. (A) Cartesian orientation image. The color at each pixel indicates the local fiber orientation in the image plane estimated from four PLM images with different filter orientations, as per the colorscale in the center. (B) “Energy” image where pixel intensity is proportional to collagen local birefringence. Higher birefringence values indicate higher local density and fibers in the plane of the section. Please see the main text for details of how the energy is computed. (C) The combination of Cartesian orientation map and energy image helps distinguish the tissue collagen fiber architecture from the background and non-birefringent elements. (D-F) These panels are intended to clarify the terminology in this study. (D) An in-plane orientation can be defined at each location over the globe (white dashed line). In-plane orientation was determined by manually tracing a segmented line along the mid-layer, following the globe's overall curvature. This curve thus defines at each point on the shell a local orientation in-plane with the tissue. (E) Schematic diagram defining in-plane orientation, tissue surface orientation, inclination angle, out-of-plane fiber and in-plane fiber. In-plane orientation (white dash line), identical to tissue surface orientation, represents the local tissue surface's orientation. The angle between fibers and the in-plane orientation is termed the inclination angle. Fibers with an inclination angle greater than 3.5° were classified as out-of-plane fibers (blue), while those with inclination angle no more than 3.5° are classified as in-plane fibers (red). (F) Three sub-regions from the Orientation x 'Energy' image in panel C to for illustration (boxes labeled, 1, 2 and 3). Region 1 shows the sclera shell near the anterior equator with the white dashed line representing in-plane orientation. The tissues are very thin in this region. Overall, the sclera fibers are green, indicating that they are closely oriented with the tissue plane. Region 2 also contains predominantly in-plane fibers, although in this region the fibers exhibit more variations as discernible by the various tones of blue and purple. Region 3 in the posterior pole displays numerous out-of-plane fibers inclined relative to the tissue surface. These out-of-plane fibers vary in their inclination angles, from small for purple fibers, larger for red ones, and very large ones for fibers in green. Our goal in this study was to measure the inclination angles of the collagen fibers over the corneoscleral shell. The inclination angles are measured locally with respect to the in-plane orientation, and thus provide a measure of the fiber orientations in-depth and the number of out-of-plane fibers.
2.3. Quantification
2.3.1. Overview
We quantified three types of features of in-depth collagen fiber organization: orientation distribution, anisotropy, and fiber inclination. These in-depth features explore how fibers are arranged within the cross-section of the tissue's thickness, whether they mainly align parallel to the tissue surface or being interwoven/inclined relative to the tissue surface. We first studied the three features in the entire sclera (Figure 3 A), Then we divided the corneoscleral shell into 15 regions in total (Figure 3 B) to study the three features in each region.
Figure 3.
(A) Schematic diagram of an eye showing the entire sclera region, from which we characterized the in-depth collagen fiber organization. (B) To study regional variations, we divided the corneoscleral shell into 15 regions to study the features in each. The sclera region was divided into anterior equator, equator, posterior equator, posterior sclera, and PPS. Rest of the area was divided into central cornea, peripheral cornea and limbus. (C) Orientation x “energy” image of the example whole globe section, having region boundaries overlaid.
All the manual markings in this section were done using Fiji is Just ImageJ (FIJI) (http://imagej.nih.gov/ij/; provided in the public domain by the National Institutes of Health, Bethesda, MD, USA) (Schindelin et al., 2012). The calculations were done in MATLAB v2022 (MathWorks, Natick, MA, USA).
2.3.2. Quantification of orientation distribution
To study the orientation distribution in a region, the boundary of the region was marked manually using FIJI. Cartesian orientations and “energy” values within the region were extracted from the images and processed for quantification.
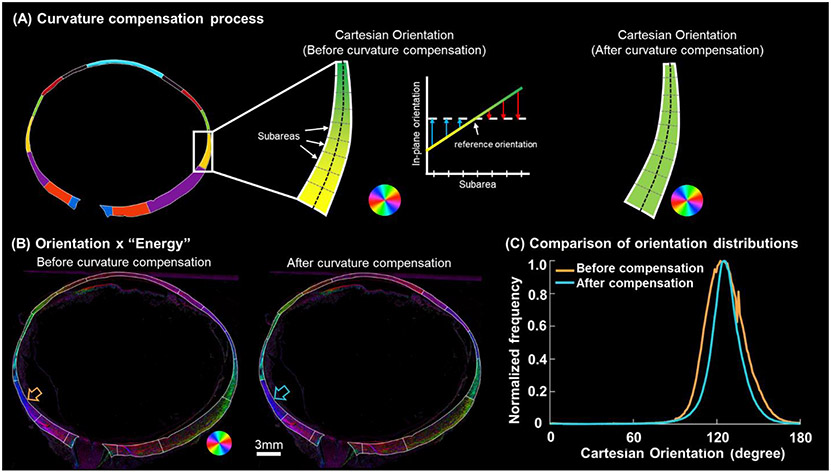
To compensate for the orientation variations introduced by the corneoscleral shell curvature, first, we manually marked a segmented line along the mid-layer of the region to represent the overall curvature and orientation of the tissue surface. Each segment was designed to have a length smaller than 1% of the eyeball average radius (~11mm). Referring to the segmented line, we divided the region into small subareas, with each subarea centered on one of these line segments (Figure 4). The orientation of the tangent line at the center of the curve was selected as reference orientation. To compensate for the curvature-induced orientation variations, we adjusted the Cartesian orientations of all pixels within each subarea by subtracting the difference between their local in-plane orientation and the reference orientation. When characterizing the orientation distributions of entire sclera, we set 0 degree as reference orientation. After correction, the orientation distribution was calculated for each region and weighted by “energy”. The weighting-by-energy was implemented as follows: when constructing the orientation distribution histogram, we assigned each orientation the corresponding energy value, which spans the range from 0 to 1, as its frequency value, rather than assuming all orientations have an equal frequency of 1. The weighing served several purposes. First, it ensured that the measurements are representative of the fibers in the plane of the section, eliminating potentially artefactual angles from fibers at a high angle to the section. Second, it accounted for the regional variations in collagen fiber density (Yang et al., 2018b). These reduce potential measurement noise that could result from the fact that a section only exhibits smaller bits and pieces of the complex structure, by making the measurements better represent the higher quality data.
Figure 4.
Curvature compensation for quantifying orientation distributions around the globe. (A) A demonstration was conducted in an equatorial region along the temporal side. Within this region, the Cartesian orientations exhibit a gradual shift from yellow to green due to tissue curvature. The in-plane orientations within subareas of this equator region were determined using the method in Figure 2D. To “flatten” this region, the Cartesian orientations of all pixels within each subarea were adjusted by subtracting the difference between their respective in-plane orientation and the reference orientation. The adjusted Cartesian orientations within each subarea appear constant. Note that the color of the Cartesian orientations is a schematic diagram and does not account for the diverse range of inclination angles present in the region. (B) Orientation x “Energy” image of an example whole globe axial section before and after curvature compensation. After curvature compensation, orientations in each region were more uniform, showing a more consistent color. (C) Comparison of the orientation distributions in an example region, the posterior equator (highlighted by the arrows in panel B), before and after curvature compensation. After curvature compensation, the orientation distribution became more concentrated with reduced variability.
To quantify orientation distribution, we summed up number of weighted π-periodic von Mises distributions (Gouget et al., 2012) and one uniform distribution to fit the original orientation distribution
| (1) |
where represents fiber orientation values lie in the interval . is the weighting factor associated with each von Mises distribution. is the primary orientation, the angle at the maximum of each von Mises distribution. is the modified Bessel function of the first kind of order zero. is the fiber concentration factor.
To find the parameters that yield the best match with the original experimental orientation distribution, an iterative algorithm was applied (Lagarias et al., 1998). In each iteration, we allowed for updates on the number of von Mises distributions , the three parameters associated with each von Mises distribution (i.e., weighting factor , primary orientation , fiber concentration factor ), and the frequency of the uniform distribution. We defined the cost function as the Euclidean distance between the original and the fitted distributions. This algorithm was terminated when one of the following three criteria was met: 1) the maximum number of the optimization iterations was larger than 100,000, 2) the tolerance on the cost function value was smaller than 1e-4, or 3) the tolerance on the parameter variation was smaller than 1e-4.
2.3.3. Quantification of anisotropy
Anisotropy was calculated to evaluate the overall degree of fiber alignment. Anisotropy ranges from 0 to 1 and is proportional to the circular standard deviation of all orientation values in a region. A high anisotropy value indicates a high degree of fiber alignment, whereas a low anisotropy value indicates low fiber alignment (Gogola et al., 2018). When calculating, we used the Cartesian orientation values after being corrected for curvature and orientation frequencies weighted by “energy”, as described above.
2.3.4. Quantification of fiber inclination
Section 2.3.2 described the general characterization of fiber orientation distributions. Herein we focus on measuring how fibers were oriented relative to the corneoscleral shell surface.
Similar to the process described in Section 2.3.2, we marked a segmented line along the mid-layer of the region following the overall curvature. The orientation of each line segment was considered as the local orientation of the tissue surface (i.e., in-plane orientation). The relative angle between a fiber and the in-plane orientation was defined as the inclination angle, which was calculated as the difference between the local in-plane orientation and the local fiber orientations obtained from the Cartesian orientation map. Inclination angles range from 0 to 90 degrees, where a 0-degree inclination angle represents that the fiber is perfectly in-plane and has no inclination whatsoever, and a 90-degree inclination angle represents a fiber that is perpendicular to the tissue surface.
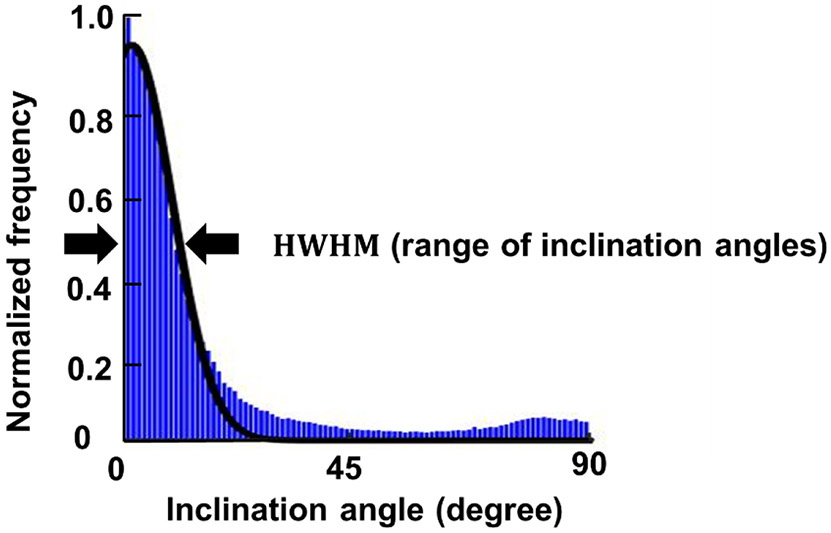
We quantified two parameters of fiber inclination: the range of inclination angles and the percentage of inclined fibers. To determine the range of inclination angles, we plotted the inclination angles as a histogram with frequencies weighted by “energy” values. A half-Gaussian curve was fit to the distribution. The half width at half maximum (HWHM) of the Gaussian distribution was quantified as the range of inclination angles (Figure 5). The range of inclination angles was designed because fibers in the corneoscleral shell can be inclined at different angles. Thus, a parameter was needed to describe the overall variation of inclination angles. The range of inclination angle ranges from 0 to 90 degrees. If the derived HWHM was greater than 90 degrees, which can happen when the distribution was more isotropic, we corrected the range of inclination angles to 90 degrees. A large range of inclination angles means that lots of fibers are inclined at large angles, whereas fibers largely parallel to the tissue surface will result in a smaller range of inclination angles. To compute a percentage of inclined fibers we defined a fiber as inclined if it had an inclination angle greater than 3.5 degrees. We recognize that choosing any specific angle to define inclined fibers is arbitrary. Nevertheless, we posit that selecting a value is useful for understanding the results. We selected the 3.5 degrees value because it corresponds with a study by Winkler et al, on fiber inclinations in the cornea, and therefore it provides a, still arbitrary, but useful level for comparison (Winkler et al., 2013). Later work could look into how important the choice of angle was to the findings.
Figure 5.
The inclination angle distribution (blue) was fit by a half Gaussian curve (black solid line). The range of inclination angles was calculated as the half width at half maximum (HWHM) of the Gaussian distribution.
2.3.5. Statistics
We assessed variations in anisotropy, the percentage of inclined fibers, and the range of inclination angles by conducting ANOVA tests to distinguish inter-specimen and intra-specimen differences. When deciding regional differences of anisotropy, percentage of inclined fibers and range of inclination angles, we used linear mixed effects models (LME) to account for autocorrelations between measurements from the same section and eye. We used a significant level of alpha = 0.01 to check if the three parameters were significantly different between any two regions (Galecki and Burzykowski, 2013). When evaluating the match between the fitted and original orientation distributions, we used R2.
3. Results
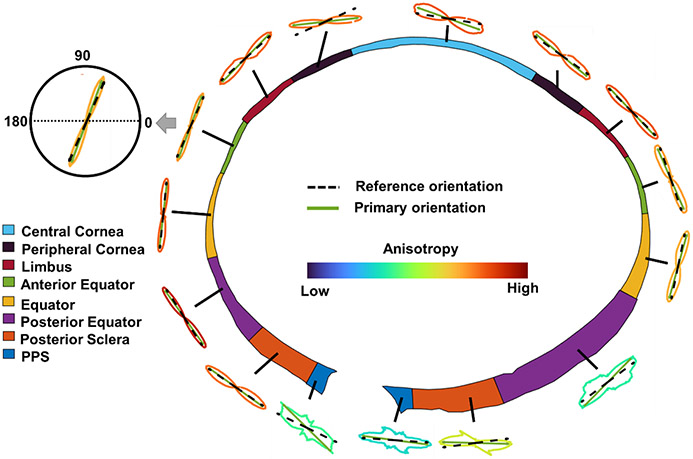
The average anisotropy of fibers in the entire sclera across all eyes was 0.5552 with a standard deviation of 0.0552. Figure 6 shows the orientation distribution and anisotropy of an example sheep eye.
Figure 6.
Orientation distributions of an example eye after curvature compensation. The distributions are shown as polar plots with the lines colored by anisotropy according to the legend in the center. The reference orientation is the in-plane orientation of each region. Primary orientation is the orientation with a maximum frequency in the distribution (the mode).
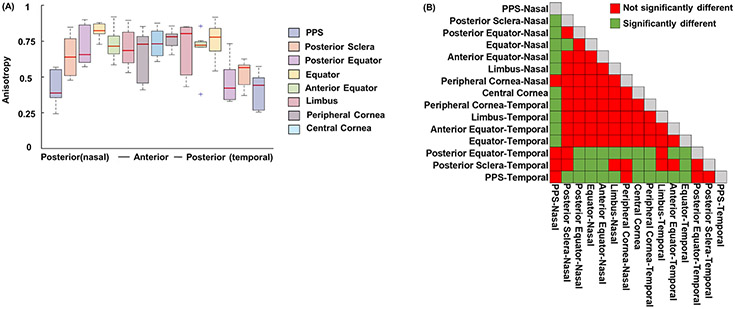
Figure 7 shows the anisotropies of all the regions on both nasal and temporal sides across all eyes. Anisotropy in the eye posterior part (i.e., PPS, posterior sclera, posterior equator on temporal side and PPS on nasal side) was lower than in other regions (p<0.01).
Figure 7.
(A) Anisotropies of the 15 regions on both nasal and temporal sides across all eyes. (B) Matrix of LME tests doing pair-wise comparisons of anisotropy between all regions. PPS, posterior sclera, posterior equator on temporal side and PPS on nasal side had relatively smaller anisotropy that other regions, meaning their fibers were less aligned (p<0.01).
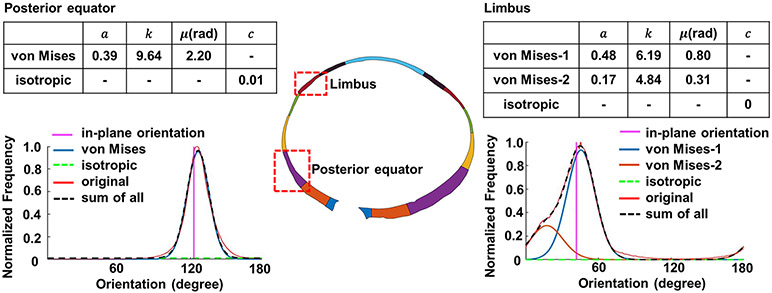
For the curve fitting, we achieved good agreements with R2 > 0.87 between the fitted distribution and the original distribution for all cases. Curves were fit for each region of each eye (15 regions/eye x 7 eyes). For readability, we selected curve fitting results of two example regions, limbus and posterior equator, for an example eye (Figure 8). The curve fitting parameters of all other regions and eyes are provided as a supplemental data file.
Figure 8.
Quantification of the orientation distributions of two example regions, (left) a posterior equator region and (right) and a limbus region of an example eye. The optimized parameters of Equation (1) are shown in the tables of each side. We found that only one von Mises distribution was needed to fit the posterior equator’s orientation distribution, whereas two von Mises distributions were needed to fit the limbus’s orientation distribution. In both cases, the fitted distribution (, black dash line) matched with the original, or experimentally-measured, orientation (red line) at R2 > 0.87. Note that in these plots the angles are absolute values and are therefore not relative to the main plane.
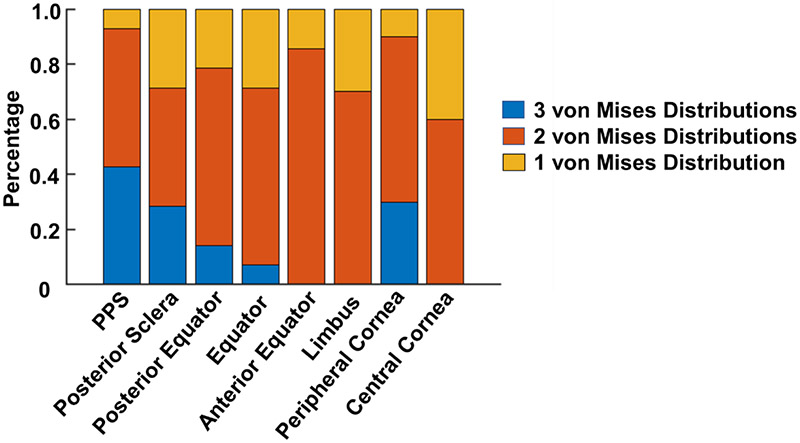
Figure 9 summarizes the number of von Mises distributions that were required to fit the orientations in each region. The posterior pole requires more distributions, suggesting that there are more collagen fiber families or groups in the posterior pole. Recall that these distributions are only accounting for the in-depth fiber distribution. The number of distributions needed for the fibers in-plane is likely different.
Figure 9.
The number of von Mises distributions used to fit the orientation distribution of all regions of all eyes. In PPS, posterior sclera and peripheral cornea, we observed that in more than 20% of the cases, 3 von Mises distributions were needed to fit the original orientation distribution. In anterior equator, limbus and central cornea regions, only one or two von Mises distributions were needed for curve fitting.
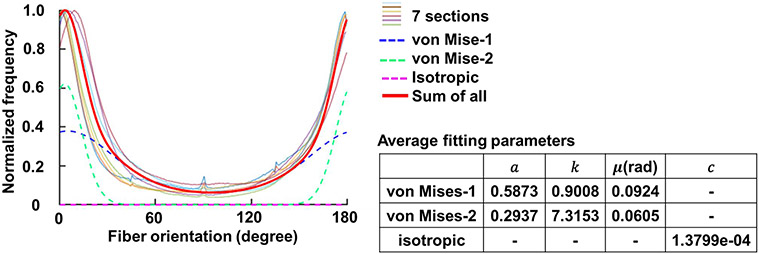
Figure 10 shows the original and fitted orientation distributions of fibers in the entire sclera region for all the sections. The original orientation distributions from all the sections exhibited similar patterns, which could be fit using two von-Mises Distributions. The isotropic component had a value of 1.3799e-04, which for practical purposes is negligible. With the averaged fitting parameters, the fitted distribution had good agreement with the corresponding experimental, or original, distributions of R2 > 0.88.
Figure 10.
Orientation distribution in the entire sclera region of the seven sections. All the seven sections exhibited a similar distribution pattern, with most of the fibers aligned at 0/180-degree direction, which is in-plane and parallel to the tissue surface. We performed curve fitting for each eye. The average fitting parameters were calculated and shown in the table, with which we obtained the average fitting curve (red solid line). The average fitting curve was the combination of two weighted von Mises Distributions (blue and green dash lines) and an isotropic component (magenta dash line). The average fitting curve achieved a fitting with the original orientation distribution of each sample at R2 > 0.88.
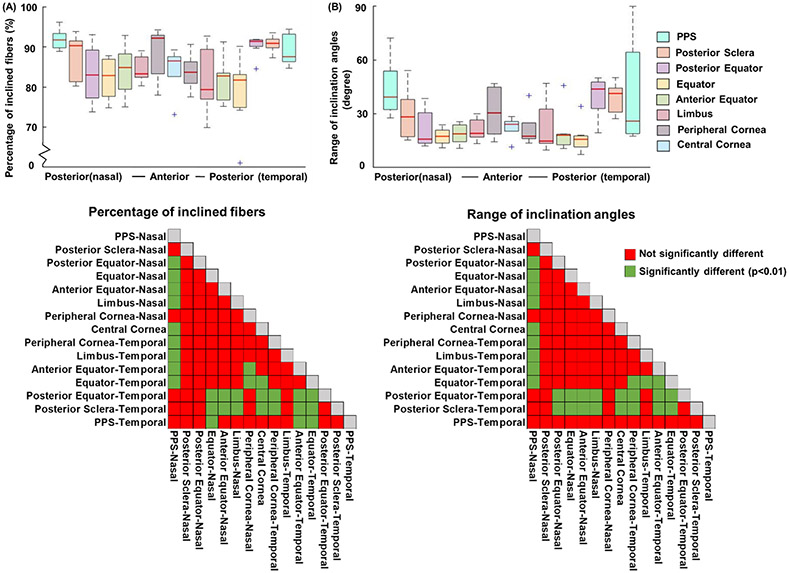
Figure 11 shows the percentage of inclined fibers and range of inclination angles of all 15 regions on both nasal and temporal sides across all eyes. Posterior sclera, posterior equator on temporal side and PPS on nasal side exhibit a larger percentage of inclined fibers (p < 0.01) and a larger range of inclination angles (p < 0.01).
Figure 11.
(A) Percentage of inclined fibers and (B) range of inclination angles. The two matrices of LME tests showed the statistical significance of pairwise comparisons of each parameter between all regions. Fiber inclination was substantial in all regions, whereby even the most aligned region had around 70% of fibers running inclined and exhibited a range of inclination angles of 7 degrees. In general, fibers in posterior sclera and posterior equator on temporal side and PPS on nasal side had more inclined fibers (p < 0.01) and a larger range of inclination angles than other regions (p < 0.01).
We found significant inter-specimen variation in the percentage of inclination angle, indicating differences between eyes (p<0.05). In contrast, intra-specimen variation within sections of the same eye was not significant for this parameter. Additionally, we did not observe significant variations, either inter-specimen or intra-specimen, in the range of inclination angle or anisotropy.
Discussion
We performed a systematic quantification of in-depth collagen fiber organization over the corneoscleral shell of sheep eyes. Specifically, we quantified orientation distribution, anisotropy, and fiber inclination with respect to the local plane, in 15 regions around the eye globe and in entire sclera. The following main results arise from this work: Over the globe, there were fibers with all in-depth orientations, with varying degrees of in-depth anisotropy. While many fibers had orientations close to the tissue plane, fiber inclinations were substantial in all regions. The percentage of inclined fibers and the range of inclination angles were larger in the posterior globe, particularly on the temporal side. Below we discuss these results in more detail.
Over the globe there were fibers oriented with all in-depth orientations, with varying degrees of in-depth anisotropy. Compared between regions, the fibers were less aligned in-depth in the nasal PPS, temporal PPS, posterior sclera and posterior equator. Our observations mean that the actual in-depth collagen organization is more complicated than the commonly assumed thin shell structure with primarily in-plane aligned fibers (Arciniegas and Amaya, 1986; Kimpton et al., 2021; Watson and Young, 2004). Our results suggest that many studies of eye structure and biomechanics, from our lab (Voorhees et al., 2017b; Voorhees et al., 2017c) and others (Coudrillier et al., 2013; Coudrillier et al., 2016; Coudrillier et al., 2015a; Girard et al., 2011; Grytz et al., 2014; Grytz et al., 2020; Grytz et al., 2011; Kollech et al., 2019; Pijanka et al., 2012; Zhang et al., 2015), have substantially underestimated the in-depth variations. It is unclear the consequences. It seems plausible that assuming that all the fibers are in-plane may simultaneously overestimate the in-plane stiffness and underestimate the out-of-plane stiffness of the tissue. Collagen fiber organization is a main factor determining the eye tissue mechanical behaviors (Coudrillier et al., 2013; Fung, 2013; Girard et al., 2009; Pijanka et al., 2012; Spoerl et al., 2005). Having accurate quantitative information about how fibers are organized is thus important. Our intent with this work is to provide the information on in-depth variation that can be incorporated in 3D modeling to improve the predictions of tissue mechanics.
We employed semi-circular von Mises distribution functions to quantify the fiber orientation distributions. These functions capture the distribution of fiber orientations about a preferred orientation and are widely used to describe the unimodal planar organization of fibers (Gouget et al., 2012). Through our analysis, we found that the in-depth orientation distribution is better described by more than one family of fibers with different primary orientations and fiber concentration factors. Specifically in sclera, we found two groups of fibers that fit different von Mises distributions. To the best of our knowledge, the studies using the von Mises distributions for fiber orientations have only applied them to the in-plane distribution of fibers. (Feola et al., 2016; Girard et al., 2009; Schwaner et al., 2020a; Schwaner et al., 2020b). Although our results suggest that assuming fully in-plane fibers is inaccurate, conveniently our results also suggest that the in-depth orientation of the fibers can be well-characterized by between one and three von Mises distributions. Since these functions have already been implemented in several software packages, as demonstrated by publications using them cited above, we trust that using them for the in-depth distribution will not be a major obstacle.
We observed substantial fiber inclination across the entire corneoscleral shell. The effects of fiber inclination has been studied in cornea and was found to have critical biomechanical roles. In this study the authors speculate that inclined fibers can introduce more connections between adjacent fibers, which are likely to prevent fiber slippage, stabilize the cornea shape, and increase cornea stiffness (Petsche et al., 2012; Petsche and Pinsky, 2013; Winkler et al., 2013). In ocular tissues, fiber inclination can also be associated with fiber interweaving. Elsewhere we have shown that interweaving can impact the structural mechanical behavior of sclera (Wang et al., 2020).
To our knowledge, fiber inclination had not been systematically characterized in sclera. The role of fiber inclination in sclera biomechanics is also not clear. One possibility is that fiber inclination may play a similar role as it does in cornea, where more fiber inclination could stabilize sclera structure and increase sclera stiffness. While we have drawn parallels between fiber inclination in the cornea and sclera, we acknowledge the compositional and ultrastructural distinctions between these ocular tissues. These distinctions encompass variations such as collagen fibril characteristics, microfibril orientations, tissue hydration levels, and elastic fiber content (Bell et al., 2018; Boote et al., 2006). It is important to recognize these differences in understanding the specific role of fiber inclination in scleral biomechanics. It is also possible that fiber inclination in sclera has an opposite effect as it does in cornea, where more fiber inclination means the sclera contains more interweaving fibers, thus being less stiff and more susceptible to IOP changes (Wang et al., 2020). If the second hypothesis is true, our observation potentially could explain why in early glaucoma, neural tissue loss occurs predominantly in the inferior-temporal and superior-temporal sides (Kiumehr et al., 2012; Lisboa et al., 2012), since we observed a larger percentage of inclined fibers and a larger range of inclination angles in posterior part of the eye especially on the temporal side. Future studies should evaluate the role of fiber inclination.
It is worth mentioning that fiber inclination is different from fiber crimp (Jan et al., 2018). Crimp is a natural waviness within Type I collagen fibers, whereas fiber inclination is at a larger scale, focusing on measuring the orientation of the macroscale fibers relative to the tissue surface. The eyes that we analyzed were pressurized and fixed at 50 mmHg after most of the fibers have been recruited and the crimp is no longer present (Jan and Sigal, 2018). Therefore, we believe the results from this study were not impacted by the variations caused by the crimp.
Our measurements took place across the entire thickness and ignored depth-dependent features. It is possible that the orientation distribution, anisotropy and fiber inclination vary from the episcleral surface to the inner surface of the corneoscleral shell. Depth-dependent features of collagen fiber organization can be functionally important. For example in human sclera, fibers were found organized in a more highly aligned pattern near the episcleral surface compared with inner surface (Gogola et al., 2018; Jan et al., 2017b; Pijanka et al., 2012; Pijanka et al., 2015; Yan et al., 2011).
We acknowledge a potential concern regarding overparameterization when determining the number of von Mises distributions for fitting the original orientation distribution. To address this, we conducted a manual validation process once the algorithm determined the optimal number of distributions. Our observations consistently showed that removing one distribution significantly worsened the fit, suggesting the model's reduced ability to capture the data. Conversely, adding an extra distribution often maintained a similar fit quality, although there were instances where additional distributions did not improve the fit or even made it worse. While our approach was effective, we recognize room for future refinements. Future research may explore formalized criteria to address overparameterization for a more robust analysis of orientation distribution in complex tissue structures.
When interpreting the findings in this work is important to consider the limitations. First, we studied only sheep eyes. Sheep eyes are similar to human eyes. But they are larger and less symmetric than the human eye, with different axial lengths, equatorial diameters, and more variable tissue thicknesses in the corneoscleral shell (El-Maghraby et al., 1995; Voorhees et al., 2017a). Though it is possible that our characterization found in sheep are not the same in human, it is important to understand sheep as an animal model (Candia et al., 2014; Gerometta et al., 2010). Future work should include additional animal models as well as human eyes. Additionally, the sample size in our study was limited to seven sections obtained from three sheep eyes. This constraint was primarily due to the availability of suitable specimens. A larger sample size could have enhanced the statistical power of our analysis, increasing the likelihood of detecting significant differences or relationships. In future work, it is advisable to consider an expanded sample size, which would improve the generalizability of our findings.
Second, when evaluating the range of inclination angles, we choose to use Gaussian functions to fit the distribution of inclination angles. This is because the distribution of inclination angles was found to follow a normal distribution in more than 95% of the cases. In some regions the distributions of inclination angles were more complicated. In those cases, the HWHM is greater than 90 degrees. We corrected those values to 90 degrees, meaning that the variation of inclination angles could span the whole range. We aim to describe the overall variations of inclination angles in most cases. Future if more accurate quantification is necessary, we could introduce more complex definitions to better fit and describe those exceptional cases.
Third, the tissue sections were of 30μm thickness. The images used for this study provided a measure of the dominant fiber orientation in each pixel (Jan et al., 2015). Especially in complex regions, it is possible that at through the depth of the section the fiber orientation distribution is not constant.
It is worth considering this point when interpreting the observation from this study. In the future, analyzing thinner sections could be useful to reduce the influence of fiber overlapping. The images were acquired from histologically processed tissue, which may have introduced artifacts such as tissue shrinkage or distortion from the fixation and sectioning. We have shown the influence of such artifacts is minimal (Tran et al., 2017).
In conclusion, we reported the first systematic experimental characterization of in-depth collagen fiber organization over the corneoscleral shell. Specifically, we have quantified orientation distribution, anisotropy, and the two parameters of fiber inclination (i.e., percentage of inclined fibers and range of inclination angles). The results from this study will contribute to a better understanding of the collagen fiber in-depth organization of ocular tissue, developing more accurate fiber-based microstructure models of the eye, and understanding the role of collagen microstructure in eye biomechanics.
Supplementary Material
Highlights.
We measured how well corneoscleral fibers are, or not, aligned with the tissue main plane
Throughout the globe the fibers had substantial in-depth inclination
Fiber inclination varied, with the posterior eye having more inclined fibers and larger inclination angles
Fiber degree of alignment (anisotropy) was lower in the posterior pole
Funding:
National Institutes of Health R01-EY031708, R01-EY023966, P30-EY008098 and T32-EY017271 (Bethesda, MD), the Eye and Ear Foundation (Pittsburgh, PA), and Research to Prevent Blindness (unrestricted grant to UPMC ophthalmology, and Stein innovation award to Sigal IA).
Footnotes
Publisher's Disclaimer: This is a PDF file of an unedited manuscript that has been accepted for publication. As a service to our customers we are providing this early version of the manuscript. The manuscript will undergo copyediting, typesetting, and review of the resulting proof before it is published in its final form. Please note that during the production process errors may be discovered which could affect the content, and all legal disclaimers that apply to the journal pertain.
Disclosures: F. Ji, None; M. Quinn, None; Y. Hua, None; P. Lee, None; I.A. Sigal, None. Marissa Quinn is now at the Alabama College of Osteopathic Medicine in Dothan, AL, USA.
Reference
- Abahussin M, Hayes S, Cartwright NEK, Kamma-Lorger CS, Khan Y, Marshall J, Meek KM, 2009. 3D collagen orientation study of the human cornea using X-ray diffraction and femtosecond laser technology. Investigative ophthalmology & visual science 50, 5159–5164. [DOI] [PubMed] [Google Scholar]
- Abass A, Hayes S, White N, Sorensen T, Meek KM, 2015. Transverse depth-dependent changes in corneal collagen lamellar orientation and distribution. Journal of The Royal Society Interface 12, 20140717. [DOI] [PMC free article] [PubMed] [Google Scholar]
- Arciniegas A, Amaya LE, 1986. Mechanical behavior of the sclera. Ophthalmologica 193, 45–55. [DOI] [PubMed] [Google Scholar]
- Bell JS, Hayes S, Whitford C, Sanchez-Weatherby J, Shebanova O, Vergari C, Winlove CP, Terrill N, Sorensen T, Elsheikh A, Meek KM, 2018. The hierarchical response of human corneal collagen to load. Acta Biomater 65, 216–225. [DOI] [PMC free article] [PubMed] [Google Scholar]
- Boote C, Hayes S, Abahussin M, Meek KM, 2006. Mapping Collagen Organization in the Human Cornea: Left and Right Eyes Are Structurally Distinct. Investigative Ophthalmology & Visual Science 47, 901–908. [DOI] [PubMed] [Google Scholar]
- Candia OA, Gerometta RM, Danias J, 2014. Tissue plasminogen activator reduces the elevated intraocular pressure induced by prednisolone in sheep. Experimental eye research 128, 114–116. [DOI] [PMC free article] [PubMed] [Google Scholar]
- Coudrillier B, Boote C, Quigley HA, Nguyen TD, 2013. Scleral anisotropy and its effects on the mechanical response of the optic nerve head. Biomechanics and Modeling in Mechanobiology 12, 941–963. [DOI] [PMC free article] [PubMed] [Google Scholar]
- Coudrillier B, Campbell IC, Read AT, Geraldes DM, Vo NT, Feola A, Mulvihill J, Albon J, Abel RL, Ethier CR, 2016. Effects of Peripapillary Scleral Stiffening on the Deformation of the Lamina Cribrosa. Invest Ophthalmol Vis Sci 57, 2666–2677. [DOI] [PMC free article] [PubMed] [Google Scholar]
- Coudrillier B, Pijanka J, Jefferys J, Sorensen T, Quigley HA, Boote C, Nguyen TD, 2015a. Collagen structure and mechanical properties of the human sclera: analysis for the effects of age. J Biomech Eng 137, 041006. [DOI] [PMC free article] [PubMed] [Google Scholar]
- Coudrillier B, Pijanka JK, Jefferys JL, Goel A, Quigley HA, Boote C, Nguyen TD, 2015b. Glaucoma-related changes in the mechanical properties and collagen micro-architecture of the human sclera. PloS one 10, e0131396. [DOI] [PMC free article] [PubMed] [Google Scholar]
- Danford FL, Yan D, Dreier RA, Cahir TM, Girkin CA, Vande Geest JP, 2013. Differences in the region- and depth-dependent microstructural organization in normal versus glaucomatous human posterior sclerae. Investigative ophthalmology & visual science 54, 7922–7932. [DOI] [PMC free article] [PubMed] [Google Scholar]
- El - Maghraby HM, Nyland TG, Bellhorn RW, 1995. Ultrasonographic and biometric evaluation of sheep and cattle eyes. Veterinary Radiology & Ultrasound 36, 148–151. [Google Scholar]
- Ethier CR, Johnson M, Ruberti J, 2004. Ocular biomechanics and biotransport. Annu. Rev. Biomed. Eng 6, 249–273. [DOI] [PubMed] [Google Scholar]
- Feola AJ, Myers JG, Raykin J, Mulugeta L, Nelson ES, Samuels BC, Ethier CR, 2016. Finite Element Modeling of Factors Influencing Optic Nerve Head Deformation Due to Intracranial Pressure. Investigative Ophthalmology & Visual Science 57, 1901–1911. [DOI] [PubMed] [Google Scholar]
- Fung Y.-c., 2013. Biomechanics: mechanical properties of living tissues. Springer Science & Business Media. [Google Scholar]
- Galecki A, Burzykowski T, 2013. Linear mixed-effects model, Linear mixed-effects models using R. Springer, pp. 245–273. [Google Scholar]
- Gerometta R, Spiga M-G, Borrás T, Candia OA, 2010. Treatment of sheep steroid–induced ocular hypertension with a glucocorticoid-inducible MMP1 gene therapy virus. Investigative ophthalmology & visual science 51, 3042–3048. [DOI] [PMC free article] [PubMed] [Google Scholar]
- Girard MJ, Dahlmann-Noor A, Rayapureddi S, Bechara JA, Bertin BM, Jones H, Albon J, Khaw PT, Ethier CR, 2011. Quantitative mapping of scleral fiber orientation in normal rat eyes. Investigative ophthalmology & visual science 52, 9684–9693. [DOI] [PubMed] [Google Scholar]
- Girard MJ, Downs JC, Burgoyne CF, Suh J-KF, 2009. Peripapillary and posterior scleral mechanics—part I: development of an anisotropic hyperelastic constitutive model. Journal of biomechanical engineering 131. [DOI] [PMC free article] [PubMed] [Google Scholar]
- Gogola A, Jan N-J, Lathrop KL, Sigal IA, 2018. Radial and circumferential collagen fibers are a feature of the peripapillary sclera of human, monkey, pig, cow, goat, and sheep. Investigative ophthalmology & visual science 59, 4763–4774. [DOI] [PMC free article] [PubMed] [Google Scholar]
- Gouget CL, Girard MJ, Ethier CR, 2012. A constrained von Mises distribution to describe fiber organization in thin soft tissues. Biomechanics and modeling in mechanobiology 11, 475–482. [DOI] [PubMed] [Google Scholar]
- Grytz R, Fazio MA, Girard MJ, Libertiaux V, Bruno L, Gardiner S, Girkin CA, Downs JC, 2014. Material properties of the posterior human sclera. Journal of the mechanical behavior of biomedical materials 29, 602–617. [DOI] [PMC free article] [PubMed] [Google Scholar]
- Grytz R, Krishnan K, Whitley R, Libertiaux V, Sigal IA, Girkin CA, Downs JC, 2020. A Mesh-Free Approach to Incorporate Complex Anisotropic and Heterogeneous Material Properties into Eye-Specific Finite Element Models. Comput Methods Appl Mech Eng 358. [PMC free article] [PubMed] [Google Scholar]
- Grytz R, Meschke G, Jonas JB, 2011. The collagen fibril architecture in the lamina cribrosa and peripapillary sclera predicted by a computational remodeling approach. Biomechanics and modeling in mechanobiology 10, 371–382. [DOI] [PubMed] [Google Scholar]
- Hayes S, Khan S, Boote C, Kamma-Lorger CS, Dooley E, Lewis J, Hawksworth N, Sorensen T, Daya S, Meek KM, 2012. Depth profile study of abnormal collagen orientation in keratoconus corneas. Archives of Ophthalmology 130, 251–252. [DOI] [PubMed] [Google Scholar]
- Jan N-J, Brazile BL, Hu D, Grube G, Wallace J, Gogola A, Sigal IA, 2018. Crimp around the globe; patterns of collagen crimp across the corneoscleral shell. Experimental Eye Research 172, 159–170. [DOI] [PMC free article] [PubMed] [Google Scholar]
- Jan N-J, Gomez C, Moed S, Voorhees AP, Schuman JS, Bilonick RA, Sigal IA, 2017a. Microstructural crimp of the lamina cribrosa and peripapillary sclera collagen fibers. Investigative ophthalmology & visual science 58, 3378–3388. [DOI] [PMC free article] [PubMed] [Google Scholar]
- Jan N-J, Grimm JL, Tran H, Lathrop KL, Wollstein G, Bilonick RA, Ishikawa H, Kagemann L, Schuman JS, Sigal IA, 2015. Polarization microscopy for characterizing fiber orientation of ocular tissues. Biomed. Opt. Express 6, 4705–4718. [DOI] [PMC free article] [PubMed] [Google Scholar]
- Jan N-J, Lathrop K, Sigal IA, 2017b. Collagen architecture of the posterior pole: high-resolution wide field of view visualization and analysis using polarized light microscopy. Investigative ophthalmology & visual science 58, 735–744. [DOI] [PMC free article] [PubMed] [Google Scholar]
- Jan N-J, Sigal IA, 2018. Collagen fiber recruitment: a microstructural basis for the nonlinear response of the posterior pole of the eye to increases in intraocular pressure. Acta biomaterialia 72, 295–305. [DOI] [PMC free article] [PubMed] [Google Scholar]
- Kimpton LS, Walker BJ, Hall CL, Bintu B, Crosby D, Byrne HM, Goriely A, 2021. A morphoelastic shell model of the eye. Journal of Elasticity 145, 5–29. [Google Scholar]
- Kiumehr S, Park SC, Dorairaj S, Teng CC, Tello C, Liebmann JM, Ritch R, 2012. In vivo evaluation of focal lamina cribrosa defects in glaucoma. Archives of ophthalmology 130, 552–559. [DOI] [PubMed] [Google Scholar]
- Kollech HG, Ayyalasomayajula A, Behkam R, Tamimi E, Furdella K, Drewry M, Vande Geest JP, 2019. A Subdomain Method for Mapping the Heterogeneous Mechanical Properties of the Human Posterior Sclera. Front Bioeng Biotechnol 7, 129. [DOI] [PMC free article] [PubMed] [Google Scholar]
- Koudouna E, Winkler M, Mikula E, Juhasz T, Brown DJ, Jester JV, 2018. Evolution of the vertebrate corneal stroma. Progress in Retinal and Eye Research 64, 65–76. [DOI] [PubMed] [Google Scholar]
- Lagarias JC, Reeds JA, Wright MH, Wright PE, 1998. Convergence properties of the Nelder--Mead simplex method in low dimensions. SIAM Journal on optimization 9, 112–147. [Google Scholar]
- Latour G, Gusachenko I, Kowalczuk L, Lamarre I, Schanne-Klein MC, 2012. In vivo structural imaging of the cornea by polarization-resolved second harmonic microscopy. Biomed Opt Express 3, 1–15. [DOI] [PMC free article] [PubMed] [Google Scholar]
- Lisboa R, Leite MT, Zangwill LM, Tafreshi A, Weinreb RN, Medeiros FA, 2012. Diagnosing preperimetric glaucoma with spectral domain optical coherence tomography. Ophthalmology 119, 2261–2269. [DOI] [PMC free article] [PubMed] [Google Scholar]
- Meek KM, Knupp C, 2015. Corneal structure and transparency. Prog Retin Eye Res 49, 1–16. [DOI] [PMC free article] [PubMed] [Google Scholar]
- Morishige N, Wahlert AJ, Kenney MC, Brown DJ, Kawamoto K, Chikama T.-i., Nishida T, Jester JV, 2007. Second-harmonic imaging microscopy of normal human and keratoconus cornea. Investigative ophthalmology & visual science 48, 1087–1094. [DOI] [PMC free article] [PubMed] [Google Scholar]
- Newton RH, Meek KM, 1998. Circumcorneal annulus of collagen fibrils in the human limbus. Invest Ophthalmol Vis Sci 39, 1125–1134. [PubMed] [Google Scholar]
- Petsche SJ, Chernyak D, Martiz J, Levenston ME, Pinsky PM, 2012. Depth-Dependent Transverse Shear Properties of the Human Corneal Stroma. Investigative Ophthalmology & Visual Science 53, 873–880. [DOI] [PMC free article] [PubMed] [Google Scholar]
- Petsche SJ, Pinsky PM, 2013. The role of 3-D collagen organization in stromal elasticity: a model based on X-ray diffraction data and second harmonic-generated images. Biomechanics and modeling in mechanobiology 12, 1101–1113. [DOI] [PubMed] [Google Scholar]
- Pijanka JK, Abass A, Sorensen T, Elsheikh A, Boote C, 2013. A wide-angle X-ray fibre diffraction method for quantifying collagen orientation across large tissue areas: application to the human eyeball coat. Journal of Applied Crystallography 46, 1481–1489. [Google Scholar]
- Pijanka JK, Coudrillier B, Ziegler K, Sorensen T, Meek KM, Nguyen TD, Quigley HA, Boote C, 2012. Quantitative Mapping of Collagen Fiber Orientation in Non-glaucoma and Glaucoma Posterior Human Sclerae. Investigative Ophthalmology & Visual Science 53, 5258–5270. [DOI] [PMC free article] [PubMed] [Google Scholar]
- Pijanka JK, Spang MT, Sorensen T, Liu J, Nguyen TD, Quigley HA, Boote C, 2015. Depth-Dependent Changes in Collagen Organization in the Human Peripapillary Sclera. PLOS ONE 10, e0118648. [DOI] [PMC free article] [PubMed] [Google Scholar]
- Schindelin J, Arganda-Carreras I, Frise E, Kaynig V, Longair M, Pietzsch T, Preibisch S, Rueden C, Saalfeld S, Schmid B, 2012. Fiji: an open-source platform for biological-image analysis. Nature methods 9, 676–682. [DOI] [PMC free article] [PubMed] [Google Scholar]
- Schwaner SA, Hannon BG, Feola AJ, Ethier CR, 2020a. Biomechanical properties of the rat sclera obtained with inverse finite element modeling. Biomechanics and Modeling in Mechanobiology 19, 2195–2212. [DOI] [PMC free article] [PubMed] [Google Scholar]
- Schwaner SA, Perry RN, Kight AM, Winder E, Yang H, Morrison JC, Burgoyne CF, Ross Ethier C, 2020b. Individual-Specific Modeling of Rat Optic Nerve Head Biomechanics in Glaucoma. Journal of Biomechanical Engineering 143. [DOI] [PMC free article] [PubMed] [Google Scholar]
- Spoerl E, Boehm AG, Pillunat LE, 2005. The influence of various substances on the biomechanical behavior of lamina cribrosa and peripapillary sclera. Investigative ophthalmology & visual science 46, 1286–1290. [DOI] [PubMed] [Google Scholar]
- Tran H, Jan N-J, Hu D, Voorhees A, Schuman JS, Smith MA, Wollstein G, Sigal IA, 2017. Formalin fixation and cryosectioning cause only minimal changes in shape or size of ocular tissues. Scientific reports 7, 1–11. [DOI] [PMC free article] [PubMed] [Google Scholar]
- Vohnsen B, Artal P, 2008. Second-harmonic microscopy of ex vivo porcine corneas. J Microsc 232, 158–163. [DOI] [PubMed] [Google Scholar]
- Voorhees AP, Ho LC, Jan N-J, Tran H, van der Merwe Y, Chan K, Sigal IA, 2017a. Whole-globe biomechanics using high-field MRI. Experimental eye research 160, 85–95. [DOI] [PMC free article] [PubMed] [Google Scholar]
- Voorhees AP, Jan NJ, Austin ME, Flanagan JG, Sivak JM, Bilonick RA, Sigal IA, 2017b. Lamina Cribrosa Pore Shape and Size as Predictors of Neural Tissue Mechanical Insult. Investigative ophthalmology & visual science 58, 5336–5346. [DOI] [PMC free article] [PubMed] [Google Scholar]
- Voorhees AP, Jan NJ, Hua Y, Yang B, Sigal IA, 2018. Peripapillary sclera architecture revisited: A tangential fiber model and its biomechanical implications. Acta Biomater 79, 113–122. [DOI] [PMC free article] [PubMed] [Google Scholar]
- Voorhees AP, Jan NJ, Sigal IA, 2017c. Effects of collagen microstructure and material properties on the deformation of the neural tissues of the lamina cribrosa. Acta biomaterialia 58, 278–290. [DOI] [PMC free article] [PubMed] [Google Scholar]
- Wang B, Hua Y, Brazile BL, Yang B, Sigal IA, 2020. Collagen fiber interweaving is central to sclera stiffness. Acta Biomaterialia 113, 429–437. [DOI] [PMC free article] [PubMed] [Google Scholar]
- Watson PG, Young RD, 2004. Scleral structure, organisation and disease. A review. Experimental eye research 78, 609–623. [DOI] [PubMed] [Google Scholar]
- Winkler M, Chai D, Kriling S, Nien CJ, Brown DJ, Jester B, Juhasz T, Jester JV, 2011. Nonlinear optical macroscopic assessment of 3-D corneal collagen organization and axial biomechanics. Investigative ophthalmology & visual science 52, 8818–8827. [DOI] [PMC free article] [PubMed] [Google Scholar]
- Winkler M, Shoa G, Xie Y, Petsche SJ, Pinsky PM, Juhasz T, Brown DJ, Jester JV, 2013. Three-Dimensional Distribution of Transverse Collagen Fibers in the Anterior Human Corneal Stroma. Investigative Ophthalmology & Visual Science 54, 7293–7301. [DOI] [PMC free article] [PubMed] [Google Scholar]
- Yan D, McPheeters S, Johnson G, Utzinger U, Geest JPV, 2011. Microstructural differences in the human posterior sclera as a function of age and race. Investigative ophthalmology & visual science 52, 821–829. [DOI] [PMC free article] [PubMed] [Google Scholar]
- Yang B, Brazile B, Jan N-J, Hua Y, Wei J, Sigal IA, 2018a. Structured polarized light microscopy for collagen fiber structure and orientation quantification in thick ocular tissues. Journal of biomedical optics 23, 106001. [DOI] [PMC free article] [PubMed] [Google Scholar]
- Yang B, Jan NJ, Brazile B, Voorhees A, Lathrop KL, Sigal IA, 2018b. Polarized light microscopy for 3-dimensional mapping of collagen fiber architecture in ocular tissues. Journal of biophotonics 11, e201700356. [DOI] [PMC free article] [PubMed] [Google Scholar]
- Zhang L, Albon J, Jones H, Gouget CLM, Ethier CR, Goh JCH, Girard MJA, 2015. Collagen Microstructural Factors Influencing Optic Nerve Head Biomechanics. Investigative Ophthalmology & Visual Science 56, 2031–2042. [DOI] [PubMed] [Google Scholar]
Associated Data
This section collects any data citations, data availability statements, or supplementary materials included in this article.


