

SUMMARY
Many tumors recapitulate the developmental and differentiation program of their tissue of origin, a basis for tumor cell heterogeneity. Although stem-cell-like tumor cells are well studied, the roles of tumor cells undergoing differentiation remain to be elucidated. We employ Drosophila genetics to demonstrate that the differentiation program of intestinal stem cells is crucial for enabling intestinal tumors to invade and induce non-tumor-autonomous phenotypes. The differentiation program that generates absorptive cells is aberrantly recapitulated in the intestinal tumors generated by activation of the Yap1 ortholog Yorkie. Inhibiting it allows stem-cell-like tumor cells to grow but suppresses invasiveness and reshapes various phenotypes associated with cachexia-like wasting by altering the expression of tumor-derived factors. Our study provides insight into how a native differentiation program determines a tumor’s capacity to induce advanced cancer phenotypes and suggests that manipulating the differentiation programs co-opted in tumors might alleviate complications of cancer, including cachexia.
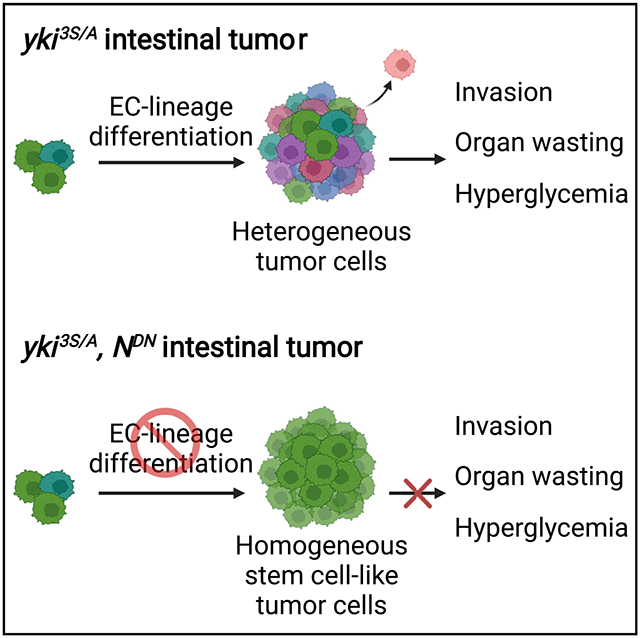
Graphical abstract
In brief
Pranoto et al. reveal that the native cell differentiation program is aberrantly recapitulated in intestinal tumors, resulting in a pronounced heterogeneity within tumor cell populations. The study discovers the essential roles of the tumor cells undergoing differentiation in inducing tumor cell invasion and certain cachexia phenotypes, such as tissue wasting.
INTRODUCTION
The division and differentiation of stem cells generate heterogeneous cells required for tissue development and maintenance.1-7 Recent studies employing single-cell sequencing have highlighted the striking cellular heterogeneity of human cancers and mouse cancer models.8-13 Interestingly, several human cancers and Drosophila tumors have been shown to recapitulate the developmental and/or differentiation programs that form and maintain the tissues of origin.9,10,12,14-17 Along with the concept that dedifferentiation is associated with malignancy, the roles of cancer cell populations with stem-cell-like properties have been extensively studied.18-20 It remains to be determined, however, how these developmental and differentiation programs recapitulated in cancers contribute to the various phenotypes associated with advanced cancers, including metastasis and cachexia, most of which are responsible for the mortality of patients with cancer.
The intestinal epithelium is comprised of 4 cell types: intestinal stem cells (ISCs), enteroblasts (EBs), enterocytes (ECs), and enteroendocrine cells (EEs).4-6,21-23 ISCs are the diploid cells expressing Delta (Dl)–the ligand of the Notch (N) signaling pathway. ISCs divide and, by default, generate themselves, while activation of N drives ISCs to differentiate into their progenitor cells, EBs.4-6,21-23 Subsequent activation of N signaling in EBs triggers differentiation of EBs into ECs, which are the absorptive polyploid cells.5 ISCs also undergo a distinct lineage to generate EEs.24,25 Although midgut tumors can be generated by expressing oncogenes in ISCs and EBs,26-28 it is not clear whether the normal differentiation programs are recapitulated in these tumors to generate a heterogeneous population of tumor cells. Furthermore, it remains unclear how the differentiation programs contribute to the expression of advanced tumor phenotypes in Drosophila and humans.
Oncogenes do not elicit the same tumorigenicity and tumor-related phenotypes across different tissues,29-38 implying that the characteristics of cancers cannot be attributed entirely to the alterations in their genome. Similarly, in Drosophila, the expression of an oncogene often gives rise to different phenotypes in imaginal discs—the developing epithelia inside larvae—and the adult midguts.30,33,39-44 These results suggest that tissue-specific contextual information might play a role in eliciting these tissue-dependent phenotypic differences. We have previously reported that midgut tumors generated by the expression of an active form of Yki (Yki3S/A) induce cachexia-like wasting, manifested by ovary atrophy, muscle degeneration, and metabolic abnormalities.26,33 Here, we attempted to address how the invasive and the cachexia-like wasting phenotypes arise in yki3S/A tumors to gain insights into how the physiology of the tissue of origin contributes to a tumor’s capacity to induce malignant phenotypes.
RESULTS
A portion of yki3S/A cells basally disseminate from the posterior midguts
We previously showed that expression of a mutant Ras (RasV12) in adult ISCs and EBs using the conditional GAL4 driver escargot (esg)ts (esg-GAL4, tub-GAL80ts, UAS-GFP/+; see STAR Method) could induce tumors in the midguts for a short period, but on day 2 of Rasv12 expression, they basally disseminate and apically delaminate, resulting in a removal of most of RasV12 cells from the posterior midguts.30 In contrast, expression of yki3S/A with esgts (esgts>yki3S/A) resulted in midgut tumors that persist over time (Figure 1A and S1A). Unlike RasV12 cells at day 2, yki3S/A cells showed strong Armadillo (Arm)—the Drosophila β-catenin ortholog—signals at the cell-cell junctions, an indication of intact adherens junctions (Figure 1A). Overall, Arm signals were significantly increased in yki3S/A cells compared with control esg+ cells (ISCs and EBs) (Figures 1A and 1B). Consistently, most of the yki3S/A cells stayed at the epithelium and formed tumors (Figure S1A and S1B). Strikingly, a significant number of yki3S/A cells were also detected outside of the visceral muscle (VM) as early as day 4 of yki3S/A expression, a phenotype that progresses over time (Figure 1C and 1D). These observations indicate that a portion of yki3S/A cells can invade and transmigrate across the VM and the extracellular matrix (ECM), while most of yki3S/A cells stay in the epithelium.
Figure 1. A portion of cells in yki3S/A tumors disseminate from the midguts.

(A) Arm signals (red) in the posterior midguts. Cells manipulated by esgts are marked by GFP (green). Nuclei are stained by DAPI (blue). Scale bars, 50 μm (top) and 10 μm (bottom).
(B) Quantification of Arm signals in GFP+ cells. n = 125 cells from 5 esgts>+ midguts and 145 cells from 7 esgts>yki3S/A midguts. Two-tailed unpaired Student’s t test at distance = 0 μm.
(C) Image of a disseminated yki3S/A cell. Phalloidin (red) shows VM. Scale bar, 10 μm.
(D) Quantification of disseminated cells. GFP+, DAPI+ cells detected outside the VM layer in the posterior midguts are counted. Transgenes were induced for indicated days. n (midguts) = esgts>+: 22 (10 days); esgts>yki3S/A: 24 (2 days), 24 (4 days), 32 (6 days), 28 (8 days), and 29 (10 days). **p < 0.01, ***p < 0.001, ANOVA test followed by Tukey’s post hoc test.
(E) Laminin staining (red) of the posterior midguts. Arrows indicate localized degradation of the laminin layer. Scale bar, 50 μm.
(F) Mmp1 staining (red). Scale bar, 50 μm. n = 90 cells from 9 esgts>+ midguts and 110 cells from 11 esgts>yki3S/A midguts. **p < 0.01, ***p < 0.001, two-tailed unpaired Student’s t test.
(G–G″) Mmp1 and puc-lacZ signals. Representative control cells (esgts>+) (G), yki3S/A cells without Mmp1 and puc-lacZ signals (G′), and yki3S/A cells with Mmp1 and puc-lacZ signals (G″) are shown. In the last panels, both Mmp1 (red) and puc-lacZ signals (gray) are shown. Scale bar, 5 μm.
(H–H″) Talin localization in esg+ cells in control (esgts>+) and esgts>yki3S/A midguts. Control cells (H), yki3S/A cells without protrusions (H′), and a yki3S/A cell with protrusions (H″) are shown. Phalloidin (gray) marks VM. “Cell body” panels show z stacks spanning nuclei of GFP+ cells. “Protrusion” panels show a view from the outside. Arrowhead, protrusion; arrow, corresponding cell body. Scale bar, 5 μm. See also Figure S3. Transgenes were induced for 6 days unless indicated using esg-GAL4, UAS-GFP, Tub-GAL80ts (esgts) by shifting to 29°C.
In (B), (D), and (F), mean ± SEMs are shown.
Matrix metalloproteinase 1 (Mmp1) is increased only in a portion of yki3S/A cells
A relatively thick ECM layer exists on the basal side of the midgut epithelium.30,45 yki3S/A cells need to breach the ECM to disseminate across the VM. We assessed if the ECM was compromised by the expression of yki3S/A with esgts by staining with an anti-laminin antibody. In control midguts, a continuous laminin layer was detected on the basal side (Figure 1E). In contrast, expression yki3S/A resulted in a localized partial breach of the laminin layer (Figure 1E, arrows). Next, we assessed Mmp1 levels in control and yki3S/A midguts. In control midguts, Mmp1 signals were detected in ECs; esg+ cells did not show discernable signals (Figure 1F and 1G). Interestingly, expression of yki3S/A with esgts significantly increased Mmp1 signals in ECs (Figure 1F). Notably, only a portion of yki3S/A cells showed elevated Mmp1 signals, while Mmp1 signals were unaltered in most of the yki3S/A cells (Figure 1G′ and 1G″). Thus, overall Mmp1 signals in yki3S/A cells were increased slightly, yet significantly, when compared with control esg+ cells (Figure 1F).
c-Jun N-terminal kinase (JNK) signaling increases Mmp1 in tumors and during wound healing in Drosophila.46-48 To address whether JNK signaling was associated with the elevation of Mmp1, we assessed JNK signaling using puc-lacZ, which expresses nuclear LacZ under the control of the regulatory sequence of puckered (puc)—a feedback regulator of JNK signaling.49 We found that yki3S/A cells with increased Mmp1 signals showed increased LacZ signals (Figure 1G′), while LacZ signals were rarely detected in control esg+ cells (Figure 1G). Note that we attempted to address the role of Mmp1 in the dissemination of yki3S/A cells by expressing an RNAi against Mmp1 (JF01336).50,51 Mmp1 loss decreased the growth of yki3S/A tumors (Figure S2A). Although Mmp1 depletion significantly suppressed the dissemination of yki3S/A cells, the defect in tumor growth likely accounted for the suppression (FigureS2A and S2B).
These results show that expression of yki3S/A with esgts partially degrades the laminin layer and increases Mmp1. Although expression of yki3S/A with esgts significantly increases Mmp1 in most ECs, Mmp1 is elevated only in a portion of yki3S/A cells. Given the role of Mmp1 in cell invasion, our data indicate that only a portion of yki3S/A cells are invasive.
A portion of yki3S/A cells form protrusions across the VM, which are enriched for focal adhesion components
We previously showed that RasV12 cells formed bleb-like protrusions, which penetrate the VM by compromising the VM integrity.30 Here, we found that only a portion of yki3S/A cells formed elaborated protrusions, while the majority did not (Figure 1H-1H″). These protrusions transversed the VM through the gaps between circular muscles without damaging the tissue (Figure S3A), suggesting that they are distinct from the bleb-like protrusions observed in RasV12 cells.
During migration, cells often assemble focal adhesions at the leading edge, which serve as attachments for dragging the cell bodies.52,53 To address whether focal adhesions were assembled at the protrusions transversing the VM, we first checked the localization of integrin—the transmembrane component of focal adhesions. In control cells (esgts>+), myospheroid (Mys)—a β-subunit of Drosophila integrin—was detected on the basal and the lateral sides of the cells (Figure S3B). Similarly, the majority of yki3S/A cells that were not forming protrusions showed Mys signals on the basal and lateral sides Figure S3B′). Intriguingly, in yki3S/A cells forming protrusions, Mys signals disappeared from the basal and the lateral sides of the cell body and accumulated at the protrusions (Figure S3B″, arrows, cell body, and arrowheads, protrusion). Multiple edematous wings (Mew)—an α-subunit of Drosophila integrin—was not readily detectable in control esg+ cells, probably due to low expression (Figure S3C). In contrast, Mew signals were clearly visible on the basal and lateral sides in most yki3S/A cells (Figure S3C′). Notably, in yki3S/A cells forming protrusions, Mew signals were detected mainly at the protrusions (Figure S3C″, arrows, cell body, and arrowheads, protrusion). Additionally, we checked the subcellular localization of Talin—a cytoplasmic protein that links integrins to the actin cytoskeleton. In control esg+ and most of the yki3S/A cells, Talin signals were predominantly detected on the lateral and the basal sides (Figure 1H and H′). In contrast, in yki3S/A cells forming protrusions, strong Talin signals were observed at the protrusions (Figure 1H″, arrows, cell body, and arrowheads, protrusion).
These results indicate that only a portion of yki3S/A cells can produce protrusions that transverse the VM and are enriched for focal adhesion components, again suggesting that only a portion of yki3S/A cells are migratory. The strong presence of Arm at cell-cell junctions of yki3S/A cells indicates that most yki3S/A cells are not migratory (Figure 1A). Considering the assembly of focal adhesion components at the protrusions of yki3S/A cells, these protrusions might serve as attachments for pulling out the cell bodies for cell dissemination.
yki3S/A tumors accumulate aberrantly heterogeneous cells in the EC lineage
Given that the phenotypes associated with cell invasion were only observed in a portion of yki3S/A cells, we speculated that yki3S/A cells were not a homogeneous population. Moreover, yki3S/A cells showing the invasive phenotypes were generally larger compared with control esg+ cells; their nuclei were also larger. During differentiation, EBs increase their size and ploidy. In contrast, EEs are generally smaller. Thus, we hypothesized that measuring their nuclear size might be a way to assess the heterogeneity of yki3S/A cells. In control midguts, esgts-driven GFP marks ISCs and EBs, which are esg+ cells; ECs and EEs are not esg+ or GFP+. Likewise, esgts-driven GFP marks yki3S/A cells. The nuclear size measurement of esg+ cells in the control posterior midguts revealed three peaks (Figure 2A, indicated with brackets and designated as I, II, and III). The main peak (I) was detected at around 11–15 μm2, followed by a nuclei population (II) at around 19–23 μm2 (Figure 2A). Additionally, relatively small nuclei formed a small peak (III) at around 6–9 μm2 (Figure 2A). To understand how ISCs and EBs contribute to the overall distribution of esg+ nuclei, we quantified the nuclear size of cells marked by Dl+—an ISC marker—or Su(H)GBE+—an EB marker. The Su(H)GBE+ nuclei size distribution showed a major peak at 11–15 μm2 and a lagging population at approximately 19–23 μm2 (Figure 2A′, shown by brackets), which were reminiscent of peaks I and II in the esg+ nuclear size distribution. The nuclear size distribution of Dl+ cells showed two peaks at 6–9 and 11–15 μm2 (Figure 2A″, indicated by brackets), which could be overlayed with peaks III and I in the esg+ nuclear size distribution, respectively. These data suggest that both ISCs and EBs can contribute to peak I, while EBs and ISCs mainly contribute to peaks II and III, respectively. We also measured the nuclear size of esg− cells, which revealed two well-separated populations (Figure S4A, arrows). Measuring the nuclear size of EEs, which are marked by an EE marker Prospero (Pros), showed a population of small nuclei (Figure S4B) reminiscent of the esg+ small nuclei population at 6–9 μm2. Thus, we concluded that the large esg− nuclei population represented ECs(Figure S4A). The esg+ peak III overlapped with the distribution of EE nuclei, which raised the possibility that peak III might represent a population of esg+ cells in the EE lineage. Notably, the lagging Su(H)GBE+ population can be placed between the esg+ peak I and the EC nuclei peak at around 30 μm2, suggesting that the lagging esg+ and Su(H)GBE+ populations might represent differentiating EBs. These analyses demonstrate that measuring nuclear size can be utilized to assess the heterogeneity of midgut epithelial cells.
Figure 2. The EC differentiation program is aberrantly recapitulated in yki3S/A tumors, generating heterogeneous types of yki3S/A cells.

(A–A″) Nuclear size distribution of GFP+ (A), Su(H)GBE+ (A′), and Dl+ (A″) cells in control (esgts>+) midguts. Numbered red brackets in (A) indicate three different cell populations described in the text.
(B) Nuclear size distribution of GFP+ (B), Su(H)GBE+ (B′), and Dl+ (B″) cells in esgts>yki3S/A midguts.
(C–C″) Normalized nuclear size distribution. The data are binned by 4 μm starting from 11 μm. Normalized frequency shows the population sizes relative to the population at 11–15 μm. GFP+ cells (C), n = 691 (esgts>+) and 1,869 (esgts>yki3S/A); Su(H)GBE+ cells (C″), n = 179 (esgts>+) and 265 (esgts>yki3S/A); and Dl+ cells (C″), n = 103 (esgts>+) and 264 (esgts>yki3S/A). Chi-squared test.
(D) Su(H)GBE-lacZ staining. GFP marks esg+ cells (green). Arrow indicates a large Su(H)GBE+, yki3S/A cell. Scale bar, 5 μm.
(E) Dl staining. Arrow indicates an extremely large Dl+, yki3S/A cell. Scale bar, 5 μm.
(F) Dl and Su(H)GBE-lacZ co-staining of midguts. Arrow indicates a Dl+, Su(H)GBE+, yki3S/A cell. Scale bar, 5 μm.
(G) Pdm1 staining. Arrow shows a GFP+, Pdm1+ yki3S/A cell. Scale bar, 10 μm. Transgenes were induced for 6 days.
Next, we attempted to describe the population of yki3S/A cells by measuring their nuclear size. As expression of yki3S/A with esgts significantly increased cell division, significantly more GFP+ cells were detected from a selected area in yki3S/A midguts (11.83 ± 0.35 cells per 50 × 50 μm) compared with control midguts (5.65 ± 0.17 cells per 50 × 50 μm). Although yki3S/A nuclei were also populated at 11–15 μm2, we observed a peak afterward (Figure 2B, arrow) and a large lagging population of nuclei (Figure 2B, bracket). Assuming that the population at 11–15 μm2 represents the majority of homeostatic ISCs and EBs, we decided to use the 11–15 μm2 population as an internal reference to bin the data by 4 μm2, starting from 11 μm2, to calculate the population sizes relative to the population at 11–15 μm2 in each genotype (Figure 2C-C″). This revealed a clear increase in the lagging esg+ nuclei population in yki3S/A midguts compared with in control midguts (Figure 2C). Additionally, we observed an increase in the lagging Su(H)GBE+ yki3S/A nuclei population (>15 μm2), which might represent differentiating EB-like cells (Figure 2B′ and 2C′). Intriguingly, large Dl+ nuclei (>15 μm2) were more abundant in yki3S/A midguts (Figure 2B″ and 2C″). Therefore, the accumulation of both large Su(H)GBE+ and Dl+ nuclei accounts for the increase in the lagging population of yki3S/A nuclei. Unexpectedly, a significant portion of Su(H)GBE+ yki3S/A nuclei were determined to be even larger than normal EC nuclei (Figure 2B′ and 2D). Similarly, we also detected Dl+ yki3S/A nuclei even larger than normal EC nuclei (Figures 2B″ and 2E). Strikingly, a subpopulation of the Su(H)GBE+ yki3S/A cells with large nuclei was also Dl+ (Figure 2F), suggesting that these Dl+, Su(H)GBE+ yki3S/A cells might recapitulate the characteristics of ISCs. It appeared that some yki3S/A cells could undergo terminal differentiation, as Pdm1 signals were detected in a portion of large GFP+ cells (Figure 2G). We noticed that EE cells were less frequently detected in regions where yki3S/A cells were populated (Figure S5). Previous studies have shown that driving ISC differentiation toward ECs causes a reduction in EEs.25,54 Nevertheless, it is also possible that EEs might be removed from the epithelium by apical delamination. These observations suggest that yki3S/A midguts still maintain the EC differentiation program even though it is abnormal, resulting in an accumulation of a variety of cell populations, including aberrantly differentiating EB-like cells.
To further confirm that yki3S/A cells still undergo EC differentiation, we generated yki3S/A clones in the midguts. We were able to detect clonal yki3S/A cells positive for Dl, Su(H)GBE-lacZ, or Pdm1 (Figure S6A-S6C). Notably, the nuclear size of a portion of Dl+ or Su(H)GBE+ yki3S/A cells was unusually large (Figures S6D-S6E), indicating that the nuclear size increase phenotype is essentially recapitulated in yki3S/A clones. Interestingly, we found that the nucleus of some wild-type Su(H)GBE+ cells juxtaposed to yki3S/A clones also grew large (Figure S6B, arrows), which suggests a cell non-autonomous effect on nuclear size.
Blocking the EC differentiation program in yki3S/A tumors halts cell dissemination and abrogates JNK activation and Mmp1 expression in yki3S/A cells
Given the accumulation of differentiating EB-like cells in yki3S/A tumors, we decided to test the role of the EC differentiation program in the dissemination of yki3S/A cells. N signaling triggers the generation of EBs and the subsequent differentiation of EBs into ECs.5 If yki3S/A cells use the same mechanism to generate the EB-like cells, inhibition of N signaling should significantly impact their differentiation process. Thus, we expressed dominant-negative N (NDN) in yki3S/A cells and then assessed the nuclear size distribution to gain insights into the changes in yki3S/A cell populations. We found that yki3S/A, NDN tumors grew as big as yki3S/A tumors on day 8 of transgene induction (Figure 3A). However, expression of NDN in yki3S/A cells resulted in a reduction in the lagging large nucleus population (Figure 3B′ and 3C). Most of the extremely large nuclei disappeared when NDN and Yki3S/A were expressed together with esgts (Figure 3B′ and 3C). Thus, yki3S/A, NDN cells appeared to be more homogeneous than yki3S/A cells and were positive for Dl (Figure 3B-3E). Note that we did not detect any yki3S/A, NDN cells that were positive for Su(H)GBE-lacZ (Figure 3F). These observations indicate that inhibition of N signaling in yki3S/A cells efficiently blocked their differentiation and enriched ISC-like yki3S/A cells. Notably, the expression of NDN almost completely abolished the dissemination of yki3S/A cells (Figure 3G). Since a subpopulation of yki3S/A cells showed the phenotypes associated with invasive cell behavior, we tested how blocking the generation of cells in the EC lineage affected Mmp1 expression and JNK signaling in yki3S/A, NDN tumors. As expected, puc-lacZ and Mmp1 signals were detected in a portion of larger yki3S/A cells and in most of the ECs in yki3S/A midguts (Figure 3H and 3I). In contrast, in yki3S/A, NDN midguts, puc-lacZ and Mmp1 signals disappeared from yki3S/A, NDN cells and were detected only in ECs (GFP− cells) (Figure 3H and 3I). Moreover, we saw a partial rescue of the laminin layer in yki3S/A, NDN midguts (Figure S7). Taken together, these results demonstrate that blocking the EC differentiation program in yki3S/A tumors attenuates the invasive behavior of yki3S/A cells.
Figure 3. Arresting yki3S/A cells in the ISC-like state suppresses Mmp1 expression in yki3S/A cells and cell dissemination.

(A) Images of esgts>yki3S/A and esgts >yki3S/A, NDN tumors. yki3S/A and yki3S/A, NDN cells are marked by GFP (green) in (A), (D), (F), and (G). Scale bar, 50 μm.
(B and B′) Nucleus size distribution of GFP+ cells in esgts>yki3S/A (B) and esgts>yki3S/A, NDN midguts (B′) at day 6.
(C) Normalized nuclear size distribution. Nucleus size distribution data shown in (B) and (B′) are binned by 4 μm starting from 11 μm, and then the binned values are normalized to the value at 11–15 μm2 in each genotype. n = 303 (esgts>yki3S/A) and 150 (esgts>yki3S/A, NDN) values are analyzed. Chi-squared test.
(D) Images of GFP+ cells. Dl signals are shown in red. Arrows show GFP+ cells without Dl, and arrowheads indicate GFP+ cells with Dl. Scale bar, 10 μm.
(E) Quantification of GFP+ cells with or without Dl signals. n = 576 cells from 11 esgts>yki3S/A midguts and 1,049 cells from 7 esgts>yki3S/A, NDN midguts. Chi-squared test.
(F) Su(H)GBE-lacZ signals (red). Arrow indicates representative GFP+ cells with Su(H)GBE-lacZ signals. Scale bar, 10 μm.
(G) Quantification of disseminated cells. n = 22 esgts>yki3S/A and 14 esgts>yki3S/A, NDN midguts. Mean ± SEMs are shown. Two-tailed unpaired Student’s t test.
(H) Mmp1 staining (red) after 8 days of transgene induction. Scale bar, 50 μm.
(I) Mmp1 (red) and puc-lacZ (gray) co-staining. Transgenes were induced for 6 days. Arrows show cells with Mmp1 and nuclear puc-lacZ signals, and arrowheads indicate cells lacking both Mmp1 and puc-lacZ signals.
Transgenes were induced for either 6 (D) or 8 days (A, F, and G). Scale bar, 10 μm. See also Figure S7. See also Figure S7.
Blocking the EC differentiation program alters the tumor’s capacity to induce phenotypes associated with cachexia-like wasting
Tumors elicit various adverse effects on the host tissues and physiology in part by expressing secreted proteins.32,33,55-61 yki3S/A midgut tumors express multiple secreted factors, which play key roles in inducing the phenotypes associated with cachexia-like wasting, such as organ degeneration, metabolic abnormalities, and reduced lifespan.33,59,60 Given the observation that blocking the EC differentiation program in yki3S/A tumors suppressed cell invasion, we assessed how the expression of NDN in yki3S/A tumors altered the tumor’s propensity to induce non-tumor-autonomous phenotypes. Blocking the EC differentiation program in yki3S/A tumors significantly suppressed the “bloating syndrome” phenotype—the manifestation of cachexia-like wasting (Figure 4A, top, and 4B). Expression of NDN also fully rescued ovary atrophy (Figure 4A, bottom, and 4C). The adult visceral cavity is filled with the amorphous fat body—the adipose tissue—which makes the ventral side of the abdomen opaquely whiteish yellow.33 Since the fat body significantly degenerated in flies bearing yki3S/A tumors, the abdomen became translucent (Figure 4A, middle). In contrast, the abdomen of flies bearing yki3S/A, NDN tumors mostly remained opaque (Figure 4A, middle), indicating that fat body degeneration is suppressed. These wasting phenotypes are associated with the expression of the secreted antagonist of Drosophila insulin-like peptides (Dilps), ImpL2.,26,33,62 ImpL2 expressed in yki3S/A tumors induced a systemic reduction in insulin/IGF signaling, resulting in hyperglycemia. 33 Of note, expression of NDN in yki3S/A tumors significantly rescued the hyperglycemia phenotype (Figure 4D). However, expression of NDN in yki3S/A midgut tumors did not alleviate all the cachexia-like wasting phenotypes. We assessed muscle degeneration in tumor-bearing flies by measuring their climbing defects. Expression of NDN in the tumors failed to rescue climbing defects (Figure 4E) and further shortened the lifespan of the tumor-bearing flies (Figure 4F and S8). These observations differentiate the roles of the ISC-like and the differentiating EB-like cells in inducing the phenotypes associated with cachexia-like wasting. Thus, we show that the differentiation program recapitulated in yki3S/A tumors plays a key role in shaping the tumor’s capacity to induce various non-tumor-autonomous phenotypes.
Figure 4. Blocking the EC differentiation program in yki3S/A cells alters the phenotypes associated with cachexia-like wasting.

(A) Ventral views and ovary images. Top: ventral views; middle: magnified views of the corresponding fly’s abdominal area; bottom: images of the corresponding fly’s ovaries. The top in esgts>yki3S/A shows representative non-bloated (normal state) (A′), partially bloated (A″), and fully bloated (A″) fly abdominal views.
(B) Quantification of bloating syndrome penetrance. N = 481 (esgts>+), 568 (esgts>yki3S/A), and 375 (esgts>yki3S/A, NDN) flies, pooled from 11 independent experiments. 3 × 3 chi-squared test indicates a significant difference among bloated groups in esgts>+, esgts>yki3S/A, and esgts>yki3SA, NDN. 2 × 2 chi-squared pairwise analyses for all possible pairings are done as post hoc tests with Bonferroni adjustment. There is a significant difference among the partially bloated and fully bloated groups in esgts>yki3S/A and esgts>yki3S/A, NDN (p = 1.31 × 10⁻¹⁶).
(C) Quantification of ovary sizes. N = 19 (esgts>+), 20 (esgts>yki3S/A), and 17 (esgts>yki3S/A, NDN) pairs of ovaries. **p < 0.01, ***p < 0.001, ANOVA test followed by Tukey’s post hoc test.
(D) Relative trehalose levels. Mean ± SEMs are shown. N = 6 flies, 6 biological replicates. **p < 0.01, ***p < 0.001, ANOVA test followed by Tukey’s post hoc test.
(E) Percentages of flies with defective climbing ability on day 14 of transgene induction. 756 esgts>+ flies from 55 independent experiments, 848 esgts>yki3S/A flies from 60 independent experiments, and 250 esgts>yki3S/A, NDN flies from 22 independent experiments are scored. ***p < 0.001, ANOVA test followed by Tukey’s post hoc test.
(F) Survivorship in female flies. The experiment was performed at 29°C to maintain the expression of transgenes. N = 159 esgts>+ flies in 17 replicates, 221 esgts>yki3S/A flies in 17 replicates, and 224 esgts>yki3S/A, NDN flies in 18 replicates. ***p < 0.001, log-rank test. See also Figure S8.
(G) Relative mRNA levels of various wasting factors. N = 20 midguts for each genotype, 3 biological replicates. *p < 0.05, **p < 0.01, ***p < 0.001, ANOVA test followed by Tukey’s post hoc test. Transgenes were induced for 8 days unless indicated.
Mean ± SEMs are shown in (C), (D), (F), and (G).
Previous studies have identified several tumor-derived factors eliciting various non-tumor-autonomous phenotypes.32,33,59-61,63-65 We found that blocking the EC differentiation program in yki3S/A midgut tumors significantly impacted the expression of several tumor-derived factors. Previous studies have shown that tumor-derived ImpL2 and epidermal growth factors (EGFs), such as PDGF- and VEGF-related factor 1 (Pvf1), are required for inducing the wasting phenotypes, including ovary atrophy, hyperglycemia, and bloating syndrome.32,33,59,61 Notably, mRNA levels of ImpL2 and Pvf1 were significantly reduced in yki3S/A, NDN tumors compared with in yki3S/A tumors. An EGF ligand, vein (vn), was shown to function locally to support yki3S/A tumor growth.59 vn mRNA levels were also reduced, while tumor growth was not affected (Figure 4G). Recently, Kim et al. showed that the Drosophila interleukin-6 orthologs Unpaired 2 (Upd2) and Upd3 derived from imaginal disc tumors caused an aberrant permeability of the blood-brain barrier (BBB), which causes a reduction in the lifespan of the tumor-bearing flies. 60 updl mRNA levels were similar in both tumors, while upd2 and upd3 mRNA levels were significantly increased in yki3S/A, NDN tumors (Figure 4G). Yeom et al. have reported that eye tumors induced by an active yki allele (ykiS168A) express a Drosophila homolog of the mammalian insulin-like 3 peptide (INSL3) Dilp8, which induces anorexia in flies.61 Expression of NDN did not significantly change Dilp8 mRNAlevels (Figure 4G). These results indicate that blocking the EC differentiation program in yki3S/A tumors alters the expression of tumor-derived factors, which are responsible for the adverse non-tumor-autonomous or systemic phenotypes.
Given the role of ImpL2 and Pvf1 in inducing various wasting phenotypes, the reduction in ImpL2 and Pvf1 expression might account for the suppression of various wasting phenotypes in flies bearing yki3S/A, NDN tumors. Additionally, the elevated expression of upd2 could be responsible for the further shortening of the lifespan. Importantly, our observations indicate that ImpL2 might be mainly expressed in yki3S/A cells in the EC lineage, even though ISC-like yki3S/A cells also express ImpL2 (Figure 4G). Our previous study showed that ImpL2 depletion in yki3S/A tumors can rescue the severity of bloating syndrome and hyperglycemia without affecting tumor growth.33 Depletion of ImpL2 in yki3S/A, NDN tumors further suppressed bloating syndrome and hyperglycemia (Figure S9), indicating that residual ImpL2 expression in yki3S/A, NDN tumors was responsible for the incomplete suppression of these phenotypes. The elevated expression of upd2 could be a factor responsible for the further shortening of the lifespan in flies bearing yki3S/A, NDN tumors. The significant increase in upd2 mRNA expression in yki3S/A, NDN tumors suggests that Upd2 might be predominantly expressed in ISC-like yki3S/A cells. Notably, depletion of upd2 resulted in complete suppression of yki3S/A, NDN tumor growth (Figure S10). Previous reports have shown that Upd2 is expressed in EBs and ECs during tissue maintenance and regeneration.7,66 Our results suggest a role for the ISC-like yki3S/A cell-derived Upd2 in tumor growth. Altogether, our findings suggest that tumor cell-type-dependent expression of the tumor-derived factors could be the mechanism by which halting the EC differentiation program alters the tumor’s capacity to induce non-tumor-autonomous phenotypes.
Zfh2 is a transcription factor that activates EBs for differentiation into ECs. However, Zfh2 loss is critical for EC terminal differentiation.67 Thus, overexpression of Zfh2 in esg+ cells accumulates EBs.67 In an attempt to increase differentiating tumor cells, we overexpressed Zfh2 in yki3S/A tumors (Figure S11). We noticed that Zfh2 overexpression allowed yki3S/A tumors to grow much faster. Although yki3S/A tumors on day 4 were not fully grown, yki3S/A, zfh2 tumors on day 4 were comparable to yki3S/A tumors on day 6 or later (Figure S11A and A′). Notably, the nuclear size distribution of day 4 yki3S/A, zfh2 tumors was similar to day 6 yki3S/A tumors (Figures S11B, S11C, and 2A-2C). Even though day 4 yki3S/A tumors failed to induce wasting phenotypes, day 4 yki3S/A, zfh2 tumors induced severe bloating syndrome, ovary atrophy, and fat body degeneration (Figures S11D and E). Consistently, the expression of various wasting factors was significantly increased in day 4 yki3S/A, zfh2 tumors (Figure S11F). These results suggest that blocking EC terminal differentiation by maintaining Zfh2 expression can augment yki3S/A tumor growth and cachexia-like wasting phenotypes, further supporting the importance of differentiating yki3S/A cells in eliciting cachexia-like wasting phenotypes. Note that yki3S/A, zfh2 tumors regressed on day 6 of transgene induction (Figure S11A′). Interestingly, yki3S/A, zfh2 cells robustly formed protrusions across the VM (Figure S11G).
DISCUSSION
Recent studies have shown that the developmental and/or differentiation programs that form and maintain the tissues of origin are recapitulated in cancers.9-14 However, it remains unclear how these programs affect tumor progression and the tumor’s capacity to induce non-tumor-autonomous phenotypes, including cachexia. We reveal the heterogeneity of yki3S/A tumor cells and elucidate the key role of the EC differentiation program in tumor cell heterogeneity. Our findings provide us with an opportunity to use Drosophila genetics to discriminate the roles of ISC-like and differentiating tumor cells. Notably, genetic elimination of differentiating tumor cells significantly alters the expression of tumor-derived wasting factors, which rescues a subset of cachexia-like wasting phenotypes. Thus, our observations demonstrate that ISC-like and differentiating tumor cells play distinct roles in shaping a tumor’s capacity to induce various cachexia-like wasting phenotypes.
Our study also shows that eliminating the differentiating tumor cells almost attenuates the cell invasion phenotypes, revealing their unexpected role in cell invasion. Esg is a snail family epithelial-mesenchymal transition (EMT) transcription factor that plays a key role in EC differentiation.68-70 It has been shown that Esg is expressed more in the EBs committed to differentiation than ISCs.68,69 The committed EBs acquire mesenchymal characteristics, such as polarized shape and invasive properties.69 This raises an interesting possibility that the intrinsically invasive properties of the differentiating EBs could be the origin of the invasiveness of yki3S/A cells. Coordination of cell differentiation and migration is a widely spread phenomenon in the development and tissue maintenance.69,71-76 Thus, we propose that accumulation of differentiating tumor cells could be a mechanism by which tumors acquire invasiveness. Alternatively, the accumulation of differentiating yki3S/A cells might create an environment permitting the dissemination of any cells by altering chemical and mechanical cues in the microenvironment. Our attempt to define the identity of invading cells was not fruitful (Figure S12), supporting the idea that any cells can disseminate. Most of the characterized wasting factors also function as growth factors. Thus, the accumulation of these and other growth factors might allow some yki3S/A cells to acquire invasive properties. It is also possible that augmentation of the signaling events normally happening during EC differentiation might contribute to cell dissemination and/or cachexia-like wasting phenotypes. To test the role of N signaling in inducing cachexia-like wasting phenotypes, we ectopically expressed the intracellular domain of N (NICD) in ECs77,78 (Figure S13A). However, we failed to detect bloating syndrome or ovary atrophy (Figure S13A-S13C). Note that expression of NICD in yki3S/A cells resulted in a disappearance of them (Figure S13D-S13G). Considering the complexity of the model, further studies are needed to scrutinize how the EC differentiation program is tied to cell invasion and cachexia-like wasting phenotypes.
Drosophila tumor models have led to the discovery of various fundamental mechanisms underlying the growth of healthy tissues and cancers.61,64,79-83 Notably, Drosophila tumors can also induce various phenotypes reminiscent of those observed in patients with advanced cancer. Since tumors are normally induced for a few days, it is unlikely that they acquire additional genetic alterations, which can confer new properties. Therefore, the ability of tumors to induce certain phenotypes cannot be entirely explained by the gain or loss of an oncogene or a tumor suppressor. Our study provides insights into how a native cell differentiation program can contribute to the tumor’s capacity to induce various phenotypes. Moreover, our study raises the possibility of manipulating the advanced cancer phenotypes by altering the developmental and differentiation programs co-opted in them. Thus, it would be interesting to address how the developmental and differentiation programs recapitulated in cancers contribute to the induction of complications associated with cancers, which might eventually lead to a strategy to treat cancer cachexia.
Limitations of the study
Our investigation aimed to explore the relationship between tumor cell heterogeneity and advanced tumor phenotypes. Specifically, we genetically eliminated differentiating tumor cells to examine their impact on cell invasion and non-tumor autonomous phenotypes. However, we could not investigate the distinct contributions of all tumor cell types in this model. Although we recognize the presence of hybrid tumor cells that simultaneously express multiple markers, we currently lack detailed genetic information about them, hindering our ability to further explore their significance. We expect that single-cell sequencing analysis would provide a comprehensive understanding of the cell types present in this tumor model.
STAR★METHODS
Detailed methods are provided in the online version of this paper and include the following:
RESOURCE AVAILABILITY
Lead contact
Further information and requests for resources and reagents should be directed to the lead contact, Young V Kwon (ykwon7@uw.edu).
Materials availability
All unique fly lines/reagents generated in this study are available from the lead contact, Young V Kwon (ykwon7@uw.edu), without restriction.
Data and code availability
All data reported in this paper will be shared by the lead contact upon request.
This paper does not report original code.
Any additional information to reanalyze the data reported in this paper is available from the lead contact upon request.
EXPERIMENTAL MODEL AND STUDY PARTICIPANT DETAILS
Fly genetics and husbandry
Fly crosses were maintained in vials with standard cornmeal-agar medium and kept at 18°C throughout development and adulthood until ready for temperature-dependent induction. For all experiments, except for climbing and lifespan assays, zero to three-day-old female flies were collected and were shifted to 29°C to induce transgene expression for the indicated number of days prior to dissection. During the 29°C incubation, flies were transferred to fresh food vials every 2 days. To manipulate ISCs and EBs, we used esg-GAL4, tub-GAL80ts, UAS-GFP (referred to as esgts). Fly strains used in this study included: UAS-yki3S/A (w* UAS-yki.S111A.S168A. S250A.V5) (BDSC #28817), Su(H)GBE-lacZ (BDSC #83352), UAS-Mmp1 RNAi JF01336 (BDSC #31489), UAS-ImpL2 RNAi HMC05809 (BDSC #64936), UAS-upd2 RNAi HMS00901 (BDSC #33949), UAS-upd2 RNAi HMS00948 (BDSC #33988), puc-lacZ (laboratory stock), UAS-NotchDN (laboratory stock), Myo1Ats (laboratory stock), Su(H)GBE-lacZ, yki3S/A (laboratory stock), FRT40A MARCM (from the Perrimon Lab), FRT40A (BDSC #5758), and UAS-NICD (from the Lee Lab).
METHOD DETAILS
Antibodies and immunofluorescence imaging
Immunostainings performed in this study used the following primary antibodies: anti-GFP antibody, Alexa Fluor 488 (1:1000; Thermo Fisher Scientific, A-21311; rabbit), anti-Armadillo antibody (1:1000; DSHB, N2 7A1; mouse), anti-laminin B1 antibody (1:1000; Abcam, ab47650; rabbit), anti-Mmp1 antibody (1:100; DSHB, 3B8D12; mouse), anti-Mys antibody (1:1000; DSHB, CF.6G11; mouse), anti-Mew antibody (1:300; DSHB, DK.1A4; mouse), anti-Talin antibody (1:1000; DSHB, A22A; mouse), anti-Delta antibody (1:1000; DSHB, C594.9B; mouse), anti-Pdm1 antibody (1:500; a gift from the Cai Lab; rabbit), anti-β Galactosidase antibody (1:1000; Cappel, 55976; rabbit and 1:1000; DSHB, 40-1a; mouse), anti-Prospero antibody (1:1000; DSHB, MR1A; mouse). All secondary antibodies were obtained from Thermo Fisher Scientific: anti-rabbit IgGs conjugated to Alexa Fluor 594 (1:1000; A-11012; goat), anti-mouse IgGs conjugated to Alexa Fluor 594 (1:1000; A-11005; goat), anti-rabbit IgGs conjugated to Alexa Fluor 647 (1:1000; A-21244; goat), and anti-mouse IgGs conjugated to Alexa Fluor 647 (1:1000; A-21235; goat). Filamentous actin was stained with phalloidin conjugated to Alexa Fluor 594 or 647 (1:1000; Thermo Fisher Scientific, A-12381, A-22287, respectively). Nuclei were stained with DAPI (1:2000; Sigma-Aldrich, D9542).
To remove auto-fluorescing remnants from the midguts, we fed flies 4% sucrose for ~4 h prior to dissection. Midgut samples were dissected in PBS, fixed in 4% paraformaldehyde (PFA) (Electron Microscopy Sciences, RT15710) diluted in PBS for 20 min, and then washed three times with PBST (PBS supplemented with 0.2% Triton X-100) with 5 min intervals. For permeabilization and blocking, we incubated tissue samples in blocking buffer (PBST supplemented with 5% normal goat serum) for 1 h at room temperature. The tissue samples were incubated with primary antibodies in the blocking buffer overnight at 4°C. The samples were washed three times with PBST and then incubated in secondary antibodies for 2 h at room temperature. Stained midguts were washed three times with PBST and preserved in Vectashield (Vector Laboratories, H-1000). Fluorescence images were acquired using a Leica SP8 laser scanning confocal microscope with 40×/1.25 oil objective lens. NIH ImageJ software was used for further adjustment and assembly of the acquired images.
Quantification of Armadillo signals
To measure the distribution and fluorescence intensity of Arm signals, we draw four 50 μm × 50 mm ROIs to cover the posterior midgut captured by 40× objective (290.91 μm × 290.91 μm) and made their Z projections. We drew a line across a GFP+ cell. Mean intensity values of the red channel (Arm signals) along the line were collected using the Plot Profile function on NIH ImageJ software. All GFP+ cells in an ROI were used for quantification. Because Arm signals are mainly at the membrane, the points where the line intersects at the membrane would give the highest signal values. Out of the two distance points where the line intersects the cell boundary, the higher value was then used as 0 μm distance to calibrate the rest of the distance points.
Quantification of disseminated cells
Disseminated cells quantified in this study were defined as GFP+ and DAPI+ cells residing more basally than the visceral muscle (labeled with phalloidin) of the front epithelial leaflet. A series of z stack images were taken to capture the posterior midguts using confocal microscopy. To determine cell positions respective to the visceral muscle layer, we reconstituted orthogonal views from the z-stacks images. The total number of disseminated cells was quantified in 290.91 μm × 290.91 μm confocal microscope fields.
Quantification of Mmp1 intensity
To measure the fluorescence intensity of Mmp1, we imaged the posterior midgut epithelium using confocal microscopy and generated z-projections using NIH ImageJ software. For this quantification, we removed Mmp1 (red) signal from the images to avoid bias, leaving the GFP and DAPI channels on display. We collected measurements of mean intensity values of the red channel (Mmp1 signal) using 2.84 μm × 2.84 mm fields for ten random GFP+ cells and ten random polyploid, GFP− cells (ECs) per intestine along the span of the posterior midgut. The values were then subtracted by the background value, which was obtained by measuring the mean gray value of the outside area surrounding the tissue. All intensity values were normalized to the intensity value of GFP+ cells in esgts intestine.
Nucleus size measurement analysis
To measure nucleus size, we created a z-projection of a 50 μm × 50 μm region capturing the topmost epithelial leaflet from a 290.91 μm × 290.91 mm posterior midgut image. We generated an RGB image of the DAPI channel (nuclei channel) only, made the image to an 8-bit type image, and converted them into a binary image. We applied a feature called Watershed to separate nuclear clusters due to cell crowding. The area of each nucleus was measured by subjecting the final binary image to the Analyze Particles feature on NIH ImageJ software. All area measurements were filtered manually to exclude artifact quantifications by comparing the binary image to the original 50 μm × 50 μm RGB image. At least four-50 μm × 50 μm-regions were created and analyzed for each intestine to cover the span of the posterior midgut. The cell frequency data were normalized to the total number of quantified cells and displayed in histograms of 1 μm2 bin increment with 43 μm2 as the size cap. To show the relative abundance of cell populations within the intestine in comparison to our arbitrary internal control (11–15 μm2 bin), we binned our data into groups with 4 μm2 bin increment and normalized the data to the cell frequency in the 11–15 μm2 bin. We then displayed the relative values as line graphs.
Quantification of Dl+, GFP+ cells
To quantify the number of GFP+ cells with or without Dl signals, we created four- 50 μm × 50 μm z-projections capturing the topmost epithelial leaflet from a 290.91 μm × 290.91 μm posterior midgut image. We scored GFP+ cells with Dl signal on the membrane as Dl+ cells and displayed the counted cells as percentages.
Measurement of trehalose level
To prepare fly lysates for trehalose assays, we homogenized six female flies of each genotype in 400 μL PBST, heated the lysate at 70°C for 5 min, centrifuged the samples at 14,000 rpm for 10 min, and collected the supernatant. Whole-body trehalose levels were measured using a trehalose assay kit (Neogen; K-TREH) according to the manufacturer’s protocol. The final value of trehalose levels was normalized to number of flies and then to trehalose level in control flies to obtain relative trehalose levels for each genotype.
Quantification of flies climbing assay
To assess climbing ability, we used flies at 14 days post-induction. We transferred 10–15 flies into vials with a 2-cm mark from the food surface. To record the climbing ability, we tapped down five times to bring the flies to the bottom and recorded the number of flies that failed to climb to pass the 2-cm mark in 3 s. Each group of flies were measured three times for three technical replicates. Three technical replicates were averaged to obtain one independent measurement. Independent measurements were used to calculate mean and standard errors.
Drosophila lifespan assay
We collected adult female and male flies in separate vials with less than 25 individuals per vial and kept them in a 29°C incubator for transgenes induction. We transferred flies into fresh food vials and recorded deaths every two days.
Quantitative RT-PCR
We isolated total RNA from 20 adult female midguts or six female thoraces at D8 of induction with TRIzol (Invitrogen, Cat# 15596026). We used 1 μg of RNA to produce cDNA with iScript Reverse Transcription Supermix (Bio-Rad, Cat#1725120). The cDNA was subjected to quantitative real-time PCR with iTaq Universal SYBR Green Supermix (Bio-Rad, Cat#1708840) and CFX-96 (Bio-Rad). The fold-changes in RNA transcript levels were normalized against RpL32 gene, and further normalized to the control genotype for relative mRNA expression levels. Primer sequences are the following: Pvf1, CTGTCCGTGTCCGCTGAG, CTCGCCGGACA CATCGTAG; vn, GAACGCAGAGGTCACGAAGA, GAGCGCACTATTAGCTCGGA; dilp8, GGACGGACGGGTTAACCATT, CATCAG GCAACAGACTCCGA; ImpL2, AAGAGCCGTGGACCTGGTA, TTGGTGAACTTGAGCCAGTCG; upd1, CCTACTCGTCCTGCTCCT TG, TGCGATAGTCGATCCAGTTG; upd2, CATCGTCATCCTCATCATCG, ATGTTCCGCAAGTTTTCGAG; upd3, AAATTCGACAA AGTCGCCTG, TTCCACTGGATTCCTGGTTC; RpL32, GCTAAGCTGTCGCACAAATG, GTTCGATCCGTAACCGATGT.
QUANTIFICATION AND STATISTICAL ANALYSIS
We performed two-tailed unpaired Student’s T test statistical analyses using Microsoft Excel. Chi-Square test statistical analyses were done using IBM SPSS Statistics and all pairwise 2x2 Chi-square post-hoc analyses were performed manually using Microsoft Excel. ANOVA and its post-hoc statistical analyses and Mann-Whitney tests were performed using IBM SPSS Statistics. Levels of significance are depicted by asterisks in the figures: *p < 0.05, **p < 0.01, ***p < 0.001. Sample sizes were chosen empirically based on the observed effects and listed in the Figure legends.
Supplementary Material
KEY RESOURCES TABLE
| REAGENT or RESOURCE | SOURCE | IDENTIFIER |
|---|---|---|
| Antibodies | ||
| anti-GFP antibody, Alexa 488 (Rabbit polyclonal) | Thermo Fisher Scientific | Cat# A21311; RRID: AB221477 |
| anti-Armadillo antibody (Mouse monoclonal) | Developmental Studies Hybridoma Bank | Cat# N2 7A1; RRID: AB_528089 |
| anti-laminin B1 antibody (Rabbit polyclonal) | Abcam | Cat# ab47650; discontinued |
| anti-Mmp1 antibody (Mouse monoclonal) | Developmental Studies Hybridoma Bank | Cat# 3B8D12; RRID: AB_579781 |
| anti-Mys antibody (Mouse monoclonal) | Developmental Studies Hybridoma Bank | Cat# CF.6G11; RRID: AB_528310 |
| anti-Mew antibody (Mouse monoclonal) | Developmental Studies Hybridoma Bank | Cat# DK.1A4; RRID: AB_528303 |
| anti-Talin antibody (Mouse monoclonal) | Developmental Studies Hybridoma Bank | Cat# A22A; RRID: AB_10660289 |
| anti-Delta antibody (Mouse monoclonal) | Developmental Studies Hybridoma Bank | Cat# C594.9B; RRID: AB_528194 |
| anti-Pdm1 antibody (Rabbit polyclonal) | A gift from Dr. Yu Cai at Temasek Life Sciences Laboratory | |
| anti-β Galactosidase antibody (Rabbit polyclonal) | Cappel | Cat# 55976; RRID: AB_2313707 |
| anti-β Galactosidase antibody (Mouse monoclonal) | Developmental Studies Hybridoma Bank | Cat# 40-1a; RRID: AB_2314509 |
| anti-Prospero antibody (Mouse monoclonal) | Developmental Studies Hybridoma Bank | Cat# MR1A; RRID: AB_528440 |
| Goat anti-Rabbit IgG, Alexa Fluor 594 | Thermo Fisher Scientific | Cat# A-11012; RRID: AB_ 2534079 |
| Goat anti-Mouse IgG, Alexa Fluor 594 | Thermo Fisher Scientific | Cat# A-11005; RRID: AB_2534073 |
| Goat anti-Rabbit IgG, Alexa Fluor 647 | Thermo Fisher Scientific | Cat# A-21244; RRID: AB_ 2535812 |
| Goat anti-Mouse IgG, Alexa Fluor 647 | Thermo Fisher Scientific | Cat# A-21235; RRID: AB_ 2535804 |
| Chemicals, peptides, and recombinant proteins | ||
| 16% paraformaldehyde | Electron Microscopy Sciences | Cat# RT15710 |
| TRIzol™ Reagent | Invitrogen | Cat# 15596026 |
| Alexa Fluor 594 Phalloidin | Thermo Fisher Scientific | Cat# A-12381 |
| Alexa Fluor 647 Phalloidin | Thermo Fisher Scientific | Cat# A-22287 |
| DAPI | Sigma-Aldrich | Cat# D9542 |
| Vectashield | Vector Laboratories | Cat# H-1000 |
| Critical commercial assays | ||
| iScript™ Reverse Transcription Supermix for RT-PCR | Bio-Rad | Cat# 1708840 |
| iTaq™ Universal SYBR Green Supermix | Bio-Rad | Cat# 1725120 |
| Trehalose Assay Kit | Neogen | Cat# K-TREH |
| Experimental models: Organisms/strains | ||
| D. melanogaster. esgts: esg-GAL4, tub-GAL80ts, UAS-GFP | Lab stock | N/A |
| D. melanogaster. w[*]; P{y[+t7.7] w[+mC] = UAS-yki.S111A.S168A.S250A.V5}attP2 | Bloomington Drosophila Stock Center | BDSC: 28817; FlyBase: FBtp0051046 |
| D. melanogaster: Notch activity reporter Su(H)GBE-lacZ: yw[*]; l(2)*[*]/CyO, P{ry[+t7.2] = en1}wg[en11]; P{ry[+t7.2] = Ddc.E(spl)m8-HLH-lacZ.Gbe}3 | Bloomington Drosophila Stock Center | BDSC: 83352; FlyBase: FBti0207547 |
| D. melanogaster: RNAi of Mmp1: y[1] v[1]; P{y[+t7.7] v[+t1.8] = TRiP.JF01336}attP2 | Bloomington Drosophila Stock Center | BDSC: 31489; FlyBase: FBti0130783 |
| D. melanogaster: UAS-NotchDN | Lab stock | N/A |
| D. melanogaster: puc-lacZ | Lab stock | N/A |
| D. melanogaster. RNAi of ImpL2: y[1] sc[*] v[1] sev[21]; P{y[+t7.7] v[+t1.8] = TRiP.HMC05809}attP2 | Bloomington Drosophila Stock Center | BDSC: 64936; FlyBase: FBti0184022 |
| D. melanogaster. RNAi of Upd2: y[1] sc[*] v[1] sev[21]; P{y[+t7.7] v[+t1.8] = TRiP.HMS00901}attP2 | Bloomington Drosophila Stock Center | BDSC: 33949; FlyBase: FBti0140607 |
| D. melanogaster. RNAi of Upd2: y[1] sc[*] v[1] sev[21]; P{y[+t7.7] v[+t1.8] = TRiP.HMS00948}attP2 | Bloomington Drosophila Stock Center | BDSC: 33988; FlyBase: FBti0140649 |
| D. melanogaster. Myo1Ats: tub-GAL80ts; Myo1A-GAL4, UAS-GFP | Lab stock | N/A |
| D. melanogaster. FRT40A MARCM: yw, hsFlp, tub-GAL4, UAS-nlsGFP; tub-GAL80ts, FRT40A | A gift from Dr. Norbert Perrimon at Harvard University | N/A |
| D. melanogaster. FRT40A: w[*]; al[1] dpy[ov1] b[1] pr[1] P{ry[+t7.2] = neoFRT}40A | Bloomington Drosophila Stock Center | BDSC: 5758; FlyBase: FBti0002071 |
| D. melanogaster. w[*]; P{w[+mC] = GAL4-ninaE.GMR}12/CyO; Mi{Hto-WP}zfh2[EAB] | Bloomington Drosophila Stock Center | BDSC: 56545; FlyBase: FBti0154827 |
| D. melanogaster: UAS-NotchICD | A gift from Dr. Cheng-yu Lee at University of Michigan | N/A |
| Oligonucleotides | ||
| Pvf1 – F: 5′-CTGTCCGTGTCCGCTGAG-3′ | Song et al.59 | N/A |
| Pvf1 – R: 5′-CTCGCCGGACACATCGTAG-3′ | Song et al.59 | N/A |
| vn – F: 5′-GAACGCAGAGGTCACGAAGA-3′ | Song et al.59 | N/A |
| vn – R: 5′-GAGCGCACTATTAGCTCGGA-3′ | Song et al.59 | N/A |
| dilp8 – F: 5′-GGACGGACGGGTTAACCATT-3′ | FlyPrimerBank | PD80018 |
| dilp8 – R: 5′-CATCAGGCAACAGACTCCGA-3′ | FlyPrimerBank | PD80018 |
| ImpL2 – F: 5′-AAGAGCCGTGGACCTGGTA-3′ | Kwon et al.33 | N/A |
| ImpL2 – R: 5′-TTGGTGAACTTGAGCCAGTCG-3′ | Kwon et al.33 | N/A |
| upd1 – F: 5′-CCTACTCGTCCTGCTCCTTG-3′ | Shaw et al.84 | N/A |
| upd1 – R: 5′-TGCGATAGTCGATCCAGTTG-3′ | Shaw et al.84 | N/A |
| upd2 – F: 5′-CATCGTCATCCTCATCATCG-3′ | Shaw et al.84 | N/A |
| upd2 – R: 5′-ATGTTCCGCAAGTTTTCGAG-3′ | Shaw et al.84 | N/A |
| upd3 – F: 5′-AAATTCGACAAAGTCGCCTG-3′ | Shaw et al.84 | N/A |
| upd3 – R: 5′-TTCCACTGGATTCCTGGTTC-3′ | Shaw et al.84 | N/A |
| RpL32 – F: 5′-GCTAAGCTGTCGCACAAATG-3′ | Kwon et al.33 | N/A |
| RpL32 – R: 5′-GTTCGATCCGTAACCGATGT-3′ | Kwon et al.33 | N/A |
| Software and algorithms | ||
| Fiji | ImageJ | http://fiji.sc/ |
| Leica Application Suite X (LAS X) software | Leica | RRID:SCR_013673 |
| Microsoft Excel | Microsoft Office | N/A |
| IBM SPSS Statistics | IBM | https://www.ibm.com/spss |
| Illustrator 2022 v 26.5 | Adobe | https://www.adobe.com/products/illustrator.html |
| ApE | Wayne Davis | https://jorgensen.biology.utah.edu/wayned/ape/ |
Highlights.
The native cell differentiation program is co-opted in yki3S/A intestinal tumors
The native cell differentiation program fosters intestinal tumor cell heterogeneity
Blocking tumor cell differentiation halts tumor cell invasion
Blocking tumor cell differentiation rescues certain cachexia phenotypes
ACKNOWLEDGMENTS
We thank Drs. Andrea Page-McCaw, Cheng-yu Lee, Norbert Perrimon, and Yu Cai for sharing reagents. This work was supported by R35GM128752 to Y.V.K. from the National Institutes of Health.
Footnotes
DECLARATION OF INTERESTS
The authors declare no competing interests.
SUPPLEMENTAL INFORMATION
Supplemental information can be found online at https://doi.org/10.1016/j.celrep.2023.113245.
REFERENCES
- 1.Hwang NS, Varghese S, and Elisseeff J (2008). Controlled differentiation of stem cells. Adv. Drug Deliv. Rev 60, 199–214. [DOI] [PMC free article] [PubMed] [Google Scholar]
- 2.Zakrzewski W, Dobrzyński M, Szymonowicz M, and Rybak Z (2019). Stem cells: Past, present, and future. In Stem Cell Research and Therapy (BioMed Central Ltd.). [DOI] [PMC free article] [PubMed] [Google Scholar]
- 3.Krieger T, and Simons BD (2015). Dynamic Stem Cell Heterogeneity (Development (Cambridge). Company of Biologists Ltd.). [DOI] [PubMed] [Google Scholar]
- 4.Ohlstein B, and Spradling A (2006). The adult Drosophila posterior midgut is maintained by pluripotent stem cells. Nature 439, 470–474. 10.1038/nature04333. [DOI] [PubMed] [Google Scholar]
- 5.Micchelli CA, and Perrimon N (2006). Evidence that stem cells reside in the adult Drosophila midgut epithelium. Nature 439, 475–479. 10.1038/nature04371. [DOI] [PubMed] [Google Scholar]
- 6.Jiang H, Tian A, and Jiang J (2016). Intestinal stem cell response to injury: lessons from Drosophila. Cell. Mol. Life Sci 73, 3337–3349. 10.1007/s00018-016-2235-9. [DOI] [PMC free article] [PubMed] [Google Scholar]
- 7.Jiang H, Patel PH, Kohlmaier A, Grenley MO, McEwen DG, and Edgar BA (2009). Cytokine/Jak/Stat Signaling Mediates Regeneration and Homeostasis in the Drosophila Midgut. Cell 137, 1343–1355. 10.1016/j.cell.2009.05.014. [DOI] [PMC free article] [PubMed] [Google Scholar]
- 8.Lawson DA, Kessenbrock K, Davis RT, Pervolarakis N, and Werb Z (2018). Tumour heterogeneity and metastasis at single-cell resolution. Nat. Cell Biol 20, 1349–1360. 10.1038/s41556-018-0236-7. [DOI] [PMC free article] [PubMed] [Google Scholar]
- 9.Couturier CP, Ayyadhury S, Le PU, Nadaf J, Monlong J, Riva G, Allache R, Baig S, Yan X, Bourgey M, et al. (2020). Single-cell RNA-seq reveals that glioblastoma recapitulates a normal neurodevelopmental hierarchy. Nat. Commun 11, 3406. 10.1038/s41467-020-17186-5. [DOI] [PMC free article] [PubMed] [Google Scholar]
- 10.Goveia J, Rohlenova K, Taverna F, Treps L, Conradi LC, Pircher A, Geldhof V, de Rooij LPMH, Kalucka J, Sokol L, et al. (2020). An Integrated Gene Expression Landscape Profiling Approach to Identify Lung Tumor Endothelial Cell Heterogeneity and Angiogenic Candidates. Cancer Cell 37, 21–36.e13. 10.1016/j.ccell.2019.12.001. [DOI] [PubMed] [Google Scholar]
- 11.Kim N, Kim HK, Lee K, Hong Y, Cho JH, Choi JW, Lee JI, Suh YL, Ku BM, Eum HH, et al. (2020). Single-cell RNA sequencing demonstrates the molecular and cellular reprogramming of metastatic lung adenocarcinoma. Nat. Commun 11, 2285. 10.1038/s41467-020-16164-1. [DOI] [PMC free article] [PubMed] [Google Scholar]
- 12.Wu F, Fan J, He Y, Xiong A, Yu J, Li Y, Zhang Y, Zhao W, Zhou F, Li W, et al. (2021). Single-cell profiling of tumor heterogeneity and the microenvironment in advanced non-small cell lung cancer. Nat. Commun 12, 2540. 10.1038/s41467-021-22801-0. [DOI] [PMC free article] [PubMed] [Google Scholar]
- 13.Yeo SK, Zhu X, Okamoto T, Hao M, Wang C, Lu P, Lu LJ, and Guan JL (2020). Single-cell RNA-sequencing reveals distinct patterns of cell state heterogeneity in mouse models of breast cancer. Elife 9, e58810–e58824. 10.7554/ELIFE.58810. [DOI] [PMC free article] [PubMed] [Google Scholar]
- 14.Fukuzawa R, Anaka MR, Morison IM, and Reeve AE (2017). The developmental programme for genesis of the entire kidney is recapitulated in Wilms tumour. PLoS One 12, e0186333. 10.1371/journal.pone.0186333. [DOI] [PMC free article] [PubMed] [Google Scholar]
- 15.Borczuk AC, Gorenstein L, Walter KL, Assaad AA, Wang L, and Powell CA (2003). Non-small-cell lung cancer molecular signatures recapitulate lung developmental pathways. Am. J. Pathol 163, 1949–1960. 10.1016/S0002-9440(10)63553-5. [DOI] [PMC free article] [PubMed] [Google Scholar]
- 16.Kelleher FC, Fennelly D, and Rafferty M (2006). Common critical pathways in embryogenesis and cancer. Acta Oncol. 45, 375–388. 10.1080/02841860600602946. [DOI] [PubMed] [Google Scholar]
- 17.Genovese S, Clément R, Gaultier C, Besse F, Narbonne-Reveau K, Daian F, Foppolo S, Luis NM, and Maurange C (2019). Coopted temporal patterning governs cellular hierarchy, heterogeneity and metabolism in Drosophila neuroblast tumors. Elife 8, e50375. 10.7554/eLife.50375. [DOI] [PMC free article] [PubMed] [Google Scholar]
- 18.da Silva-Diz V, Lorenzo-Sanz L, Bernat-Peguera A, Lopez-Cerda M, and Muñoz P (2018). Cancer cell plasticity: Impact on tumor progression and therapy response. In Seminars in Cancer Biology (Academic Press; ). [DOI] [PubMed] [Google Scholar]
- 19.Jögi A, Vaapil M, Johansson M, and Påhlman S (2012). Cancer cell differentiation heterogeneity and aggressive behavior in solid tumors. Ups. J. Med. Sci [DOI] [PMC free article] [PubMed] [Google Scholar]
- 20.Chen K, Huang YH, and Chen JL (2013). Understanding and targeting cancer stem cells: Therapeutic implications and challenges. Acta Pharmacol. Sin 34, 732–740. [DOI] [PMC free article] [PubMed] [Google Scholar]
- 21.Boumard B, and Bardin AJ (2021). An amuse-bouche of stem cell regulation: Underlying principles and mechanisms from adult Drosophila intestinal stem cells. Curr. Opin. Cell Biol 73, 58–68. 10.1016/j.ceb.2021.05.007. [DOI] [PubMed] [Google Scholar]
- 22.Miguel-Aliaga I, Jasper H, and Lemaitre B (2018). Anatomy and Physiology of the Digestive Tract of Drosophila melanogaster. Genetics 210, 357–396. 10.1534/genetics.118.300224. [DOI] [PMC free article] [PubMed] [Google Scholar]
- 23.Hou SX, and Singh SR (2017). Stem-Cell-Based Tumorigenesis in Adult Drosophila. Curr. Top. Dev. Biol 121, 311–337. 10.1016/bs.ctdb.2016.07.013. [DOI] [PubMed] [Google Scholar]
- 24.Biteau B, and Jasper H (2014). Slit/Robo signaling regulates cell fate decisions in the intestinal stem cell lineage of Drosophila. Cell Rep. 7, 1867–1875. 10.1016/j.celrep.2014.05.024. [DOI] [PMC free article] [PubMed] [Google Scholar]
- 25.Zeng X, and Hou SX (2015). Enteroendocrine cells are generated from stem cells through a distinct progenitor in the adult Drosophila posterior midgut. Development 142, 644–653. 10.1242/dev.113357. [DOI] [PMC free article] [PubMed] [Google Scholar]
- 26.Lee J, Ng KGL, Dombek KM, Eom DS, and Kwon YV (2021). Tumors overcome the action of the wasting factor ImpL2 by locally elevating Wnt/Wingless. Proc. Natl. Acad. Sci. USA 118, e2020120118. 10.1073/pnas.2020120118. [DOI] [PMC free article] [PubMed] [Google Scholar]
- 27.Markstein M, Dettorre S, Cho J, Neumüller RA, Craig-Müller S, and Perrimon N (2014). Systematic screen of chemotherapeutics in Drosophila stem cell tumors. Proc. Natl. Acad. Sci. USA 111, 4530–4535. 10.1073/pnas.1401160111. [DOI] [PMC free article] [PubMed] [Google Scholar]
- 28.Apidianakis Y, Pitsouli C, Perrimon N, and Rahme L (2009). Synergy between bacterial infection and genetic predisposition in intestinal dysplasia. Proc. Natl. Acad. Sci. USA 106, 20883–20888. 10.1073/pnas.0911797106. [DOI] [PMC free article] [PubMed] [Google Scholar]
- 29.Cook JH, Melloni GEM, Gulhan DC, Park PJ, and Haigis KM (2021). The origins and genetic interactions of KRAS mutations are allele- and tissue-specific. Nat. Commun 12, 1808. 10.1038/s41467-021-22125-z. [DOI] [PMC free article] [PubMed] [Google Scholar]
- 30.Lee J, Cabrera AJH, Nguyen CMT, and Kwon YV (2020). Dissemination of Ras V12-transformed cells requires the mechanosensitive channel Piezo. Nat. Commun 11, 3568. 10.1038/s41467-020-17341-y. [DOI] [PMC free article] [PubMed] [Google Scholar]
- 31.Pagliarini RA, and Xu T (1991). A Genetic Screen in Drosophila for Metastatic Behavior (Weissman; ). www.sciencemag.org/cgi/content/full/302/5648/1223/. [DOI] [PubMed] [Google Scholar]
- 32.Figueroa-Clarevega A, and Bilder D (2015). Malignant Drosophila tumors interrupt insulin signaling to induce cachexia-like wasting. Dev. Cell 33, 47–55. 10.1016/j.devcel.2015.03.001. [DOI] [PMC free article] [PubMed] [Google Scholar]
- 33.Kwon Y, Song W, Droujinine IA, Hu Y, Asara JM, and Perrimon N (2015). Systemic organ wasting induced by localized expression of the secreted Insulin/IGF antagonist ImpL2. Dev. Cell 33, 36–46. 10.1016/j.devcel.2015.02.012. [DOI] [PMC free article] [PubMed] [Google Scholar]
- 34.Tu B, Yao J, Ferri-Borgogno S, Zhao J, Chen S, Wang Q, Yan L, Zhou X, Zhu C, Bang S, et al. (2019). YAP1 oncogene is a context-specific driver for pancreatic ductal adenocarcinoma. JCI Insight 4, e130811. 10.1172/jci.insight.130811. [DOI] [PMC free article] [PubMed] [Google Scholar]
- 35.Yang SA, Portilla JM, Mihailovic S, Huang YC, and Deng WM (2019). Oncogenic Notch Triggers Neoplastic Tumorigenesis in a Transition-Zone-like Tissue Microenvironment. Dev. Cell 49, 461–472.e5. 10.1016/j.devcel.2019.03.015. [DOI] [PMC free article] [PubMed] [Google Scholar]
- 36.Weng AP, Millholland JM, Yashiro-Ohtani Y, Arcangeli ML, Lau A, Wai C, Del Bianco C, Rodriguez CG, Sai H, Tobias J, et al. (2006). c-Myc is an important direct target of Notch1 in T-cell acute lymphoblastic leukemia/lymphoma. Genes Dev. 20, 2096–2109. 10.1101/gad.1450406. [DOI] [PMC free article] [PubMed] [Google Scholar]
- 37.Lowell S, Jones P, Le Roux I, Dunne J, and Watt FM (2000). Stimulation of human epidermal differentiation by delta-notch signalling at the boundaries of stem-cell clusters. Curr. Biol. 10, 491–500. 10.1016/s0960-9822(00)00451-6. [DOI] [PubMed] [Google Scholar]
- 38.Rangarajan A, Talora C, Okuyama R, Nicolas M, Mammucari C, Oh H, Aster JC, Krishna S, Metzger D, Chambon P, et al. (2001). Notch signaling is a direct determinant of keratinocyte growth arrest and entry into differentiation. EMBO J. 20, 3427–3436. 10.1093/emboj/20.13.3427. [DOI] [PMC free article] [PubMed] [Google Scholar]
- 39.Wang C, Yin MX, Wu W, Dong L, Wang S, Lu Y, Xu J, Wu W, Li S, Zhao Y, and Zhang L (2016). Taiman acts as a coactivator of Yorkie in the Hippo pathway to promote tissue growth and intestinal regeneration. Cell Discov. 2, 16006. 10.1038/celldisc.2016.6. [DOI] [PMC free article] [PubMed] [Google Scholar]
- 40.Wittkorn E, Sarkar A, Garcia K, Kango-Singh M, and Singh A (2015). The Hippo pathway effector Yki downregulates Wg signaling to promote retinal differentiation in the Drosophila eye. Development (Camb.) 142, 2002–2013. 10.1242/dev.117358. [DOI] [PMC free article] [PubMed] [Google Scholar]
- 41.Oh H, and Irvine KD (2009). In vivo analysis of Yorkie phosphorylation sites. Oncogene 28, 1916–1927. 10.1038/onc.2009.43. [DOI] [PMC free article] [PubMed] [Google Scholar]
- 42.Pan D. (2010). The hippo signaling pathway in development and cancer. Dev. Cell 19, 491–505. 10.1016/j.devcel.2010.09.011. [DOI] [PMC free article] [PubMed] [Google Scholar]
- 43.Cabrera AJH, Gumbiner BM, and Kwon YV (2023). Remodeling of E-cadherin subcellular localization during cell dissemination. Mol. Biol. Cell 34, ar46. 10.1091/mbc.E23-03-0087. [DOI] [PMC free article] [PubMed] [Google Scholar]
- 44.Pagliarini RA, and Xu T (2003). A genetic screen in Drosophila for metastatic behavior. Science 302, 1227–1231. 10.1126/science.1088474. [DOI] [PubMed] [Google Scholar]
- 45.Howard AM, LaFever KS, Fenix AM, Scurrah CR, Lau KS, Burnette DT, Bhave G, Ferrell N, and Page-McCaw A (2019). DSS-induced damage to basement membranes is repaired by matrix replacement and crosslinking. J. Cell Sci 132, jcs226860. 10.1242/jcs.226860. [DOI] [PMC free article] [PubMed] [Google Scholar]
- 46.Uhlirova M, and Bohmann D (2006). JNK- and Fos-regulated Mmp1 expression cooperates with Ras to induce invasive tumors in Drosophila. EMBO J. 25, 5294–5304. 10.1038/sj.emboj.7601401. [DOI] [PMC free article] [PubMed] [Google Scholar]
- 47.Ma X, Chen Y, Xu W, Wu N, Li M, Cao Y, Wu S, Li Q, and Xue L (2015). Impaired Hippo signaling promotes Rho1-JNK-dependent growth. Proc. Natl. Acad. Sci. USA 112, 1065–1070. 10.1073/pnas.1415020112. [DOI] [PMC free article] [PubMed] [Google Scholar]
- 48.Stevens LJ,and Page-McCaw A (2012). A secreted MMP is required for reepithelialization during wound healing. Mol. Biol. Cell 23, 1068–1079. 10.1091/mbc.E11-09-0745. [DOI] [PMC free article] [PubMed] [Google Scholar]
- 49.Martín-Blanco E, Gampel A, Ring J, Virdee K, Kirov N, Tolkovsky AM, and Martinez-Arias A (1998). Puckered Encodes a Phosphatase that Mediates a Feedback Loop Regulating JNK Activity during Dorsal Closure in Drosophila. www.genesdev.org. [DOI] [PMC free article] [PubMed] [Google Scholar]
- 50.Lee SH, Park JS, Kim YS, Chung HY, and Yoo MA (2012). Requirement of matrix metalloproteinase-1 for intestinal homeostasis in the adult Drosophila midgut. Exp. Cell Res 318, 670–681. 10.1016/j.yexcr.2012.01.004. [DOI] [PubMed] [Google Scholar]
- 51.Glasheen BM, Kabra AT, and Page-McCaw A (2009). Distinct functions for the catalytic and hemopexin domains of a Drosophila matrix metalloproteinase. Proc. Natl. Acad. Sci. USA 106, 2659–2664. 10.1073/pnas.0804171106. [DOI] [PMC free article] [PubMed] [Google Scholar]
- 52.Krakhmal NV, Zavyalova MV, Denisov EV, Vtorushin SV, and Perelmuter VM (2015). Cancer Invasion: Patterns and Mechanisms. Acta Naturae 7, 17–28. [PMC free article] [PubMed] [Google Scholar]
- 53.Pandya P, Orgaz JL, and Sanz-Moreno V (2017). Modes of invasion during tumour dissemination. Mol. Oncol 11, 5–27. 10.1002/1878-0261.12019. [DOI] [PMC free article] [PubMed] [Google Scholar]
- 54.Beebe K, Lee WC, and Micchelli CA (2010). JAK/STAT signaling coordinates stem cell proliferation and multilineage differentiation in the Drosophila intestinal stem cell lineage. Dev. Biol 338, 28–37. 10.1016/j.ydbio.2009.10.045. [DOI] [PubMed] [Google Scholar]
- 55.Porporato PE (2016). Understanding cachexia as a cancer metabolism syndrome. Oncogenesis 5, e200. 10.1038/oncsis.2016.3. [DOI] [PMC free article] [PubMed] [Google Scholar]
- 56.Petruzzelli M, and Wagner EF (2016). Mechanisms of metabolic dysfunction in cancer-associated cachexia. Genes Dev. 30, 489–501. 10.1101/gad.276733.115. [DOI] [PMC free article] [PubMed] [Google Scholar]
- 57.Baracos VE, Martin L, Korc M, Guttridge DC, and Fearon KCH (2018). Cancer-associated cachexia. Nat. Rev. Dis. Prim 4, 17105. 10.1038/nrdp.2017.105. [DOI] [PubMed] [Google Scholar]
- 58.Argilés JM, Busquets S, Stemmler B, and López-Soriano FJ (2014). Cancer cachexia: understanding the molecular basis. Nat. Rev. Cancer 14, 754–762. 10.1038/nrc3829. [DOI] [PubMed] [Google Scholar]
- 59.Song W, Kir S, Hong S, Hu Y, Wang X, Binari R, Tang HW, Chung V, Banks AS, Spiegelman B, and Perrimon N (2019). Tumor-Derived Ligands Trigger Tumor Growth and Host Wasting via Differential MEK Activation. Dev. Cell 48, 277–286.e6. 10.1016/j.devcel.2018.12.003. [DOI] [PMC free article] [PubMed] [Google Scholar]
- 60.Kim J, Chuang HC, Wolf NK, Nicolai CJ, Raulet DH, Saijo K, and Bilder D (2021). Tumor-induced disruption of the blood-brain barrier promotes host death. Dev. Cell 56, 2712–2721.e4. 10.1016/j.devcel.2021.08.010. [DOI] [PMC free article] [PubMed] [Google Scholar]
- 61.Yeom E, Shin H, Yoo W, Jun E, Kim S, Hong SH, Kwon DW, Ryu TH, Suh JM, Kim SC, et al. (2021). Tumour-derived Dilp8/INSL3 induces cancer anorexia by regulating feeding neuropeptides via Lgr3/8 in the brain. Nat. Cell Biol 23, 172–183. 10.1038/s41556-020-00628-z. [DOI] [PubMed] [Google Scholar]
- 62.Honegger B, Galic M, Köhler K, Wittwer F, Brogiolo W, Hafen E, and Stocker H (2008). Imp-L2, a putative homolog of vertebrate IGF-binding protein 7, counteracts insulin signaling in Drosophila and is essential for starvation resistance. J. Biol 7, 10. 10.1186/jbiol72. [DOI] [PMC free article] [PubMed] [Google Scholar]
- 63.Liu Y, Saavedra P, and Perrimon N (2022). Cancer cachexia: lessons from Drosophila. Dis. Model. Mech 15, dmm049298. 10.1242/dmm.049298. [DOI] [PMC free article] [PubMed] [Google Scholar]
- 64.Bilder D, Ong K, Hsi TC, Adiga K, and Kim J (2021). Tumour-host interactions through the lens of Drosophila. Nat. Rev. Cancer 21, 687–700. 10.1038/s41568-021-00387-5. [DOI] [PMC free article] [PubMed] [Google Scholar]
- 65.Lodge W, Zavortink M, Golenkina S, Froldi F, Dark C, Cheung S, Parker BL, Blazev R, Bakopoulos D, Christie EL, et al. (2021). Tumor-derived MMPs regulate cachexia in a Drosophila cancer model. Dev. Cell 56, 2664–2680.e6. 10.1016/j.devcel.2021.08.008. [DOI] [PubMed] [Google Scholar]
- 66.Zhai Z, Kondo S, Ha N, Boquete JP, Brunner M, Ueda R, and Lemaitre B (2015). Accumulation of differentiating intestinal stem cell progenies drives tumorigenesis. Nat. Commun 6, 10219. 10.1038/ncomms10219. [DOI] [PMC free article] [PubMed] [Google Scholar]
- 67.Rojas Villa SE, Meng FW, and Biteau B (2019). zfh2 controls progenitor cell activation and differentiation in the adult Drosophila intestinal absorptive lineage. PLoS Genet. 15, e1008553. 10.1371/journal.pgen.1008553. [DOI] [PMC free article] [PubMed] [Google Scholar]
- 68.Korzelius J, Naumann SK, Loza-Coll MA, Chan JS, Dutta D, Oberheim J, Gläßter C, Southall TD, Brand AH, Jones DL, and Edgar BA (2014). Escargot maintains stemness and suppresses differentiation in Drosophila intestinal stem cells. EMBO J. 33, 2967–2982. 10.15252/embj.201489072. [DOI] [PMC free article] [PubMed] [Google Scholar]
- 69.Antonello ZA, Reiff T, Ballesta-Illan E, and Dominguez M (2015). Robust intestinal homeostasis relies on cellular plasticity in enteroblasts mediated by miR-8–Escargot switch. EMBO J. 34, 2025–2041. 10.15252/embj.201591517. [DOI] [PMC free article] [PubMed] [Google Scholar]
- 70.Loza-Coll MA, Southall TD, Sandall SL, Brand AH, and Jones DL (2014). Regulation of Drosophila intestinal stem cell maintenance and differentiation by the transcription factor Escargot. EMBO J. 33, 2983–2996. 10.15252/embj.201489050. [DOI] [PMC free article] [PubMed] [Google Scholar]
- 71.Peercy BE, and Starz-Gaiano M (2020). Clustered cell migration: Modeling the model system of Drosophila border cells. In Seminars in Cell and Developmental Biology (Elsevier Ltd.). [DOI] [PubMed] [Google Scholar]
- 72.Montell DJ (2003). Border-cell migration: The race is on. Nat. Rev. Mol. Cell Biol 4, 13–24. [DOI] [PubMed] [Google Scholar]
- 73.Vasilyev A, Liu Y, Mudumana S, Mangos S, Lam PY, Majumdar A, Zhao J, Poon KL, Kondrychyn I, Korzh V, and Drummond IA (2009). Collective cell migration drives morphogenesis of the kidney nephron. PLoS Biol. 7, e9. 10.1371/journal.pbio.1000009. [DOI] [PMC free article] [PubMed] [Google Scholar]
- 74.Aalto A, Olguin-Olguin A, and Raz E (2021). Zebrafish Primordial Germ Cell Migration. Front. Cell Dev. Biol 9, 684460. 10.3389/fcell.2021.684460. [DOI] [PMC free article] [PubMed] [Google Scholar]
- 75.Arvidsson A, Collin T, Kirik D, Kokaia Z, and Lindvall O (2002). Neuronal replacement from endogenous precursors in the adult brain after stroke. Nat. Med 8, 963–970. 10.1038/nm747. [DOI] [PubMed] [Google Scholar]
- 76.Parent JM, Valentin VV, and Lowenstein DH (2002). Prolonged seizures increase proliferating neuroblasts in the adult rat subventricular zone-olfactory bulb pathway. J. Neurosci 22, 3174–3188. 20026296. [DOI] [PMC free article] [PubMed] [Google Scholar]
- 77.Kopan R, and Ilagan MXG (2009). The canonical Notch signaling pathway: unfolding the activation mechanism. Cell 137, 216–233. 10.1016/j.cell.2009.03.045. [DOI] [PMC free article] [PubMed] [Google Scholar]
- 78.Hounjet J, and Vooijs M (2021). The Role of Intracellular Trafficking of Notch Receptors in Ligand-Independent Notch Activation. Biomolecules 11, 1369. 10.3390/biom11091369. [DOI] [PMC free article] [PubMed] [Google Scholar]
- 79.Saavedra P, and Perrimon N (2019). Drosophila as a Model for Tumor-Induced Organ Wasting. Adv. Exp. Med. Biol 1167, 191–205. 10.1007/978-3-030-23629-8_11. [DOI] [PubMed] [Google Scholar]
- 80.Enomoto M, Siow C, and Igaki T (2018). Drosophila As a Cancer Model. Adv. Exp. Med. Biol 1076, 173–194. 10.1007/978-981-13-0529-0_10. [DOI] [PubMed] [Google Scholar]
- 81.Dong J, Yu J, Li Z, Gao S, Wang H, Yang S, Wu L, Lan C, Zhao T, Gao C, et al. (2021). Serum insulin-like growth factor binding protein 2 levels as biomarker for pancreatic ductal adenocarcinoma-associated malnutrition and muscle wasting. J. Cachexia Sarcopenia Muscle 12, 704–716. 10.1002/jcsm.12692. [DOI] [PMC free article] [PubMed] [Google Scholar]
- 82.Dong J, Feldmann G, Huang J, Wu S, Zhang N, Comerford SA, Gayyed MF, Anders RA, Maitra A, and Pan D (2007). Elucidation of a universal size-control mechanism in Drosophila and mammals. Cell 130, 1120–1133. 10.1016/j.cell.2007.07.019. [DOI] [PMC free article] [PubMed] [Google Scholar]
- 83.Villegas SN (2019). One hundred years of Drosophila cancer research: no longer in solitude. Dis. Model. Mech 12, dmm039032. 10.1242/dmm.039032. [DOI] [PMC free article] [PubMed] [Google Scholar]
- 84.Shaw RL, Kohlmaier A, Polesello C, Veelken C, Edgar BA, and Tapon N (2010). The Hippo pathway regulates intestinal stem cell proliferation during Drosophila adult midgut regeneration. Development 137, 4147–4158. 10.1242/dev.052506. [DOI] [PMC free article] [PubMed] [Google Scholar]
Associated Data
This section collects any data citations, data availability statements, or supplementary materials included in this article.
Supplementary Materials
Data Availability Statement
All data reported in this paper will be shared by the lead contact upon request.
This paper does not report original code.
Any additional information to reanalyze the data reported in this paper is available from the lead contact upon request.