

Abstract
Pyruvate, an end product of glycolysis, is a master fuel for cellular energy. A portion of cytosolic pyruvate is transported into mitochondria, while the remaining portion is converted reversibly into lactate and alanine. It is suggested that cytosolic lactate and alanine are transported and metabolized inside mitochondria. However, such a mechanism continues to be a topic of intense debate and investigation. As a part of gaining insight into the metabolic fate of the cytosolic lactate and alanine, in this study, the metabolism of mouse skeletal myoblast cells (C2C12) and their isolated mitochondria was probed utilizing stable isotope-labeled forms of the three glycolysis products, viz. [3-13C1]pyruvate, [3-13C1]lactate, and [3-13C1]alanine, as substrates. The uptake and metabolism of each substrate was monitored, separately, in real-time using 1H-13C 2D NMR spectroscopy. The dynamic variation of the levels of the substrates and their metabolic products were quantitated as a function of time. The results demonstrate that all three substrates were transported into mitochondria and each substrate was metabolized to form the other two metabolites, reversibly. These results provide direct evidence for intracellular pyruvate-lactate-alanine cycling, in which lactate and alanine produced by the cytosolic pyruvate are transported into mitochondria and converted back to pyruvate. Such a mechanism suggests a role for lactate and alanine to replenish mitochondrial pyruvate, the primary source for ATP synthesis through oxidation phosphorylation and the electron transport chain. The results highlight the potential of real-time NMR spectroscopy for gaining new insights into cellular and subcellular functions.
Keywords: skeletal muscle myoblast, C2C12 cells, mitochondria, real-time NMR, 1H, 13C, [3-13C1]pyruvate, [3-13C1]lactate, [3-13C1]alanine
Graphical Abstract

Metabolism of live mouse skeletal myoblast cells (C2C12) and their mitochondria were investigated using stable isotope-labeled substrates, [3-13C1]pyruvate, [3-13C1]lactate, and [3-13C1]alanine. The uptake and metabolism of each substrate was monitored separately using 1H-13C 2D NMR spectroscopy in real-time. The results provide direct evidence for intracellular pyruvate-lactate-alanine cycling, where lactate and alanine produced by the cytosolic pyruvate are transported into mitochondria and converted back to pyruvate.
1. INTRODUCTION
Historically, glycolysis was the first metabolic pathway to be elucidated and is a major pathway critical to cellular function.[1–3] Glycolysis produces pyruvate as an end product in the cytoplasm. Pyruvate is the master source of cellular energy; it is transported into mitochondria and converted to acetyl coenzyme A (Acetyl CoA) by pyruvate dehydrogenase (PDH). Acetyl CoA leads to the synthesis of a key energy coenzyme, ATP, as well as other important cellular components, as a part of tricarboxylic acid (TCA) cycle metabolism.[4–6] The cytosolic pyruvate also has other fates: one is conversion to lactate, catalyzed by the enzyme lactate dehydrogenase (LDH). In fact, lactate production is the dominant mechanism under anaerobic conditions since, under such conditions, mitochondrial respiration is reduced, which reduces the need for pyruvate transport into mitochondria. However, under pathological conditions, such as cancer, pyruvate to lactate conversion is dominant even under aerobic conditions. This phenomenon is widely known as the Warburg effect. Another fate of pyruvate is conversion to alanine, catalyzed by the enzyme alanine aminotransferase (ALT). It is estimated that the pyruvate to alanine conversion has an equilibrium constant of approximately 1.0, which indicates that the cellular concentrations of alanine and pyruvate are similar.[7] Since the conversion of cytosolic pyruvate to lactate or alanine is reversible, lactate and alanine are often considered as the major sources of pyruvate in cellular metabolism.[8]
As suggested by Taylor et al., cytosolic lactate and alanine may be transported into mitochondria and metabolized, although detailed knowledge about their mitochondrial transporters is lacking.[9] Inside mitochondria, lactate is thought to be oxidized to pyruvate, catalyzed by the mitochondrial lactate dehydrogenase (mLDH) in the mitochondrial matrix.[10–13] However, such a mechanism is a topic of major contention.[14–16] In particular, Glancy et al. argued that oxidation of lactate inside mitochondria is thermodynamically inconsistent with known observations and that the presence of LDH in mitochondria is not compatible with the cytoplasmic/mitochondrial matrix redox gradient.[16] Separately, a model was suggested that lactate is transported into the mitochondrial intermembrane space via a ‘cytosol-to-mitochondria lactate shuttle’, where it gets oxidized to pyruvate[17] by the action of LDH attached to the outside of the inner mitochondrial membrane.[18, 19] Similarly, it was suggested that the cytosolic alanine is transported into mitochondria and deaminated by the action of the mitochondrial enzyme ALT2 to form pyruvate.[9, 20] In contrast to this mechanism, however, a study categorically suggests that alanine is not metabolized inside mitochondria.[21] Further investigations are therefore required to gain insight into the mitochondrial transport and metabolism of lactate and alanine, which are the major downstream products of glycolysis.
Investigation of the metabolism of live cells and isolated mitochondria in real-time offers an ability to unravel the metabolic fates of the major downstream products of glycolysis, pyruvate, lactate, and alanine. NMR spectroscopy is a unique platform that enables both the identification of metabolites reliably and the measurement of their dynamic changes quantitatively in live cells and mitochondria. To date, a small number of studies have reported investigations of isolated mitochondria using 1D 13C NMR to monitor the TCA cycle and drug metabolism.[22–24] The downside of 1D NMR is, lower sensitivity and poorly resolved metabolite peaks, which deleteriously affect reliable analysis of low-intensity peaks. A combination of 2D NMR and stable isotope-labeled tracers greatly improves sensitivity and resolution and promises investigation of cells and subcellular metabolism in real-time.[25, 26] Using this approach, more recently, we investigated isolated mitochondria from mouse skeletal myoblast cells (C2C12) treated with [3-13C1]pyruvate and showed conversion of pyruvate to lactate and alanine inside mitochondria.[27] In the current study, the metabolism of live mouse skeletal myoblast cells (C2C12) and mitochondria was probed utilizing stable isotope-labeled forms of the three major glycolysis end products, pyruvate, lactate, and alanine. The uptake and metabolism of each substrate were monitored using 1H-13C 2D NMR spectroscopy in real-time. The results provide direct evidence for intracellular pyruvate-lactate-alanine cycling, where lactate and alanine produced by the cytosolic pyruvate are transported into mitochondria and converted back to pyruvate.
2. MATERIALS AND METHODS
2.1. Cells, chemicals, and reagents:
Mouse skeletal myoblast cells (C2C12) were obtained from ATCC (American Type Culture Collection; Manassas, VA, USA). Adenosine diphosphate (ADP), nicotinamide adenine dinucleotide, oxidized (NAD+), coenzyme A (CoA), malic acid, fumaric acid, EGTA (ethylene glycol-bis(β-aminoethyl ether)-N,N,N’,N’-tetraacetic acid), HEPES (N-2-hydroxyethylpiperazine-N’-2-ethanesulfonic acid), phosphate-buffered saline (pH 7.4; Gibco, Los Angeles, CA, USA), potassium chloride (KCl), and monopotassium phosphate (KH2PO4) were obtained from Sigma-Aldrich (St. Louis, MO, USA) or Fisher (Waltham, MA, USA). Stable isotope-labeled compounds including [3-13C1]pyruvate, [3-13C1]lactate, and [3-13C1]alanine, deuterium oxide (D2O), and sodium 3-(trimethylsilyl)propionate (2,2,3,3-d4) (TSP) were purchased from Cambridge Isotope Laboratories (Tewksbury, MA, USA). Mitochondria Isolation Kits (Qproteome, Cat. No. 37612) were procured from Qiagen (Germantown, MD, USA). The BCA Protein Assay Kit was obtained from Thermo Scientific (Waltham, Massachusetts, USA). Milli-Q water was purified using an in-house Synergy Ultrapure Water System from Millipore (Billerica, MA, USA). All chemicals and solvents were used without further purification.
2.2. Cell culture:
Protocols for cell culture were used as described in our recent study.[27] Briefly, cells were cultured at 37 °C with 5% CO2 humidified incubator in DMEM medium (Gibco, Los Angeles, CA, USA) containing 20% fetal calf serum, 2 mM glutamine, and 1% penicillin-streptomycin (Gibco, Grand Island, NY, USA). Once the plates were confluent, they were washed thrice with phosphate-buffered saline (PBS) and suspended in 100 μL respiratory buffer that contained 120 mM KCl, 5 mM KH2PO4, 1 mM EGTA, and 3 mM HEPES,[28] and incubated for 30 min at 37 °C. The solution, which contained ~20 million cells, was transferred to a 5-mm Shigemi NMR tube. A 200 μL solution consisting of [3-13C1]pyruvate (4.95 mM), malate (0.4125 mM), NAD+ (0.4125 mM), ADP (0.165 mM), and CoA (4.95 mM) was added to the NMR tube. D2O (10%) and TSP (4.785 mM) were added to provide a field-frequency lock and chemical shift/quantitative reference, respectively.
2.3. Mitochondria isolation:
Protocols for isolation of mitochondria, and purity and viability assay were used as described in our recent study.[27] Briefly, commercially available kits were used to isolate mitochondria from ~0.5 to 1 × 10⁸ cells following the protocol provided by the manufacturer. The purity and viability of mitochondria isolated using this kit were tested based on Western blot analysis and measurement of fluorescence signal from the membrane potential indicator dye as described in our recent study.[27] The isolated mitochondrial pellet was washed with PBS and suspended in 100 μL respiratory buffer that contained 120 mM KCl, 5 mM KH2PO4, 1 mM EGTA, and 3 mM HEPES,[28] and incubated for 30 min at 37 °C. The solution was then transferred to a 5-mm Shigemi NMR tube. A 200 μL solution consisting of [3-13C1]pyruvate, [3-13C1]lactate, or [3-13C1]alanine (1.25 mM), and malate (0.4125 mM), NAD (0.4125 mM), ADP (0.165 mM), and CoA (4.95 mM) was added to the NMR tube. D2O (10 %) and TSP (4.785 mM) were added to provide a field-frequency lock and chemical shift/quantitative reference, respectively. For each isotope-labeled substrate, two to four replicates were used.
2.4. NMR Experiments:
NMR experiments were performed on a Bruker Avance III 800 MHz spectrometer equipped with a cryogenically cooled probe and z-gradients suitable for inverse detection. The sample temperature was maintained at 37 °C during all NMR experiments. As soon as the labeled substrate was added, 1H-13C HSQC NMR data were acquired as a function of time using the hsqcetgpsisp2.2 pulse sequence. Parameters used were, spectral widths: 12.0 ppm in the 1H dimension and 120.0 ppm in the 13C dimension; time domain points: 1,024 and 128 in 1H and 13C dimensions, respectively; relaxation delay: 1.05 s; and the number of scans: 2 or 4. Each 2D data acquisition required approximately 5 or 10 min; 2D spectra were obtained up to 250 min after the addition of substrate. Separately, to confirm the identity of peaks due to metabolism of [3-13C1]pyruvate, [3-13C1]lactate, and [3-13C1]alanine, 2D spectra were obtained before and after spiking with authentic compounds. The resulting 2D data were zero-filled to 2048 or 4096 and 1024 points in t2 and t1 dimensions, respectively. A 90° or 45° shifted squared sine-bell window function was applied to both dimensions before Fourier transformation. The chemical shift scales were calibrated based on the TSP signal for both 1H and 13C dimensions.
2.5. Metabolite identification and quantitation:
Metabolites were identified based on the combination of literature[29–31] as well as publicly available databases, including the Human Metabolome Database (HMDB),[32] Biological Magnetic Resonance Bank (BMRB),[33] our earlier study on isolated mitochondria,[27] and in combination with the comparison of blank spectra obtained without adding cells or mitochondria. Peaks from isotope-labeled pyruvate, lactate, and alanine were further confirmed by comparing 2D NMR spectra obtained before and after spiking with authentic compounds. Processed 2D spectra were imported using the software program developed for automated integration of 2D NMR peaks from multiple spectra in a single step, as described previously.[27] Metabolites were quantified by integrating 2D NMR peaks and comparing them to the internal standard (TSP).
3. RESULTS
3.1. Pyruvate Metabolism in C2C12 Cells:
The metabolism of pyruvate in C2C12 cells was investigated in real-time using 2D NMR with the cells sample maintained at 37 °C. As soon as the substrate, [3-13C1]pyruvate, was added to the cells, a series of 2D NMR spectra was acquired for 150 min with each 2D NMR spectrum acquisition lasting about 5 min. With increasing time after the addition of the substrate, additional peaks appeared in the spectra when compared to the spectrum of a blank sample that had no cells. These additional peaks arise from the metabolism of pyruvate. Peaks from many metabolites including acetyl-CoA, lactate, alanine, acetate, succinate, and citrate were identified based on a comprehensive analysis. Fig. 1 shows a portion of a typical 2D NMR spectrum of live cells obtained 60 min after the addition of [3-13C1]pyruvate with highlighting peaks from pyruvate, lactate, and alanine. These three metabolites were quantitated in the time series spectra relative to the internal reference, TSP. Fig. 2 shows typical plots of the relative concentrations of the three metabolites. These plots were obtained using the peak areas without corrections for the relaxation effects for individual metabolites. It is well known that 2D NMR peak area depends on many parameters including relaxation times and pulse sequence delays. Pyruvate does not have any adjacent hydrogens unlike lactate and alanine and hence it potentially experiences longer relaxation time. This can result in lower peak area for pyruvate compared to lactate or alanine, especially with a shorter recycle delay as used in this study. The results show that while the levels of pyruvate decreased, the levels of lactate and alanine increased as a function of time.
Figure 1.

A portion of the 2D HSQC spectrum of live mouse skeletal myoblast (C2C12) cells (~20 million) obtained 60 min after treating with [3-13C1]pyruvate with highlighting of peaks from the substrate, [3-13C1]pyruvate, and its products, [3-13C1]lactate and [3-13C1]alanine (indicated by dotted squares).
Figure 2.

Plots showing relative concentrations of [3-13C1]pyruvate, [3-13C1]lactate, and [3-13C1]alanine measured as a function of time in a sample with live C2C12 cells. [3-13C1]pyruvate was used as the substrate and [3-13C1]lactate and [3-13C1]alanine are metabolic products of [3-13C1]pyruvate. Each point in the plots was derived from a separate 1H-13C 2D HSQC spectrum. The numbers in parentheses for each metabolite indicate 1H and 13C NMR chemical shifts (in ppm), respectively, measured with reference to the internal reference, TSP.
3.2. Mitochondrial Metabolism:
Mitochondrial metabolism was also investigated using live mitochondria isolated from the C2C12 cells. The protocol used for isolation of mitochondria was evaluated by (a) testing the purity of mitochondria using Western blot analysis to ensure there was no contamination from the cytoplasm, and (b) testing the viability based on the visualization of images of mitochondria treated with a fluorescent dye under a confocal microscope as described earlier.[27]
Three major downstream products of glycolysis, pyruvate, lactate, and alanine were used as substrates for the investigation of their mitochondrial transport and metabolism. Live mitochondria were treated with [3-13C1]pyruvate, [3-13C1]lactate, or [3-13C1]alanine and, for each substrate, twenty-five 2D NMR spectra were recorded at 37 °C; each 2D spectrum acquisition took ~ 10 min. The appearance of additional peaks in the 2D spectra, when compared to the blank spectrum, reflected the mitochondrial uptake and metabolism of each substrate inside mitochondria. Analysis of the spectra showed that the substrate [3-13C1]pyruvate formed [3-13C1]lactate and [3-13C1]alanine, among other metabolites. Similarly, the substrate [3-13C1]lactate formed [3-13C1]pyruvate and [3-13C1]alanine, and the substrate [3-13C1]alanine formed [3-13C1]pyruvate and [3-13C1]lactate. These results are illustrated in Fig. 3, which shows portions of spectra obtained at about 10 min and 4 hrs. after treating mitochondria with the substrates along with assignment of peaks from [3-13C1]pyruvate, [3-13C1]lactate, and [3-13C1]alanine. Additional peaks in the spectra correspond to other downstream products as well as components from the residual media as described previously. [27] To confirm the assignments of the three metabolites, NMR experiments were performed before and after spiking with [3-13C1]pyruvate, [3-13C1]lactate, or [3-13C1]alanine to mitochondria solutions pretreated with one of the substrates. Fig. 4 shows portions of 2D NMR spectra thus obtained, which confirm the assignments of the three metabolites. Quantitative analysis of the three metabolites was performed based on their peak area. Fig. 5 shows plots of the relative concentrations of the substrates and their metabolic products as a function of time. As with their metabolism in cells (Fig. 2), the levels of the substrates decreased and their metabolic products increased, as a function of time.
Figure 3.
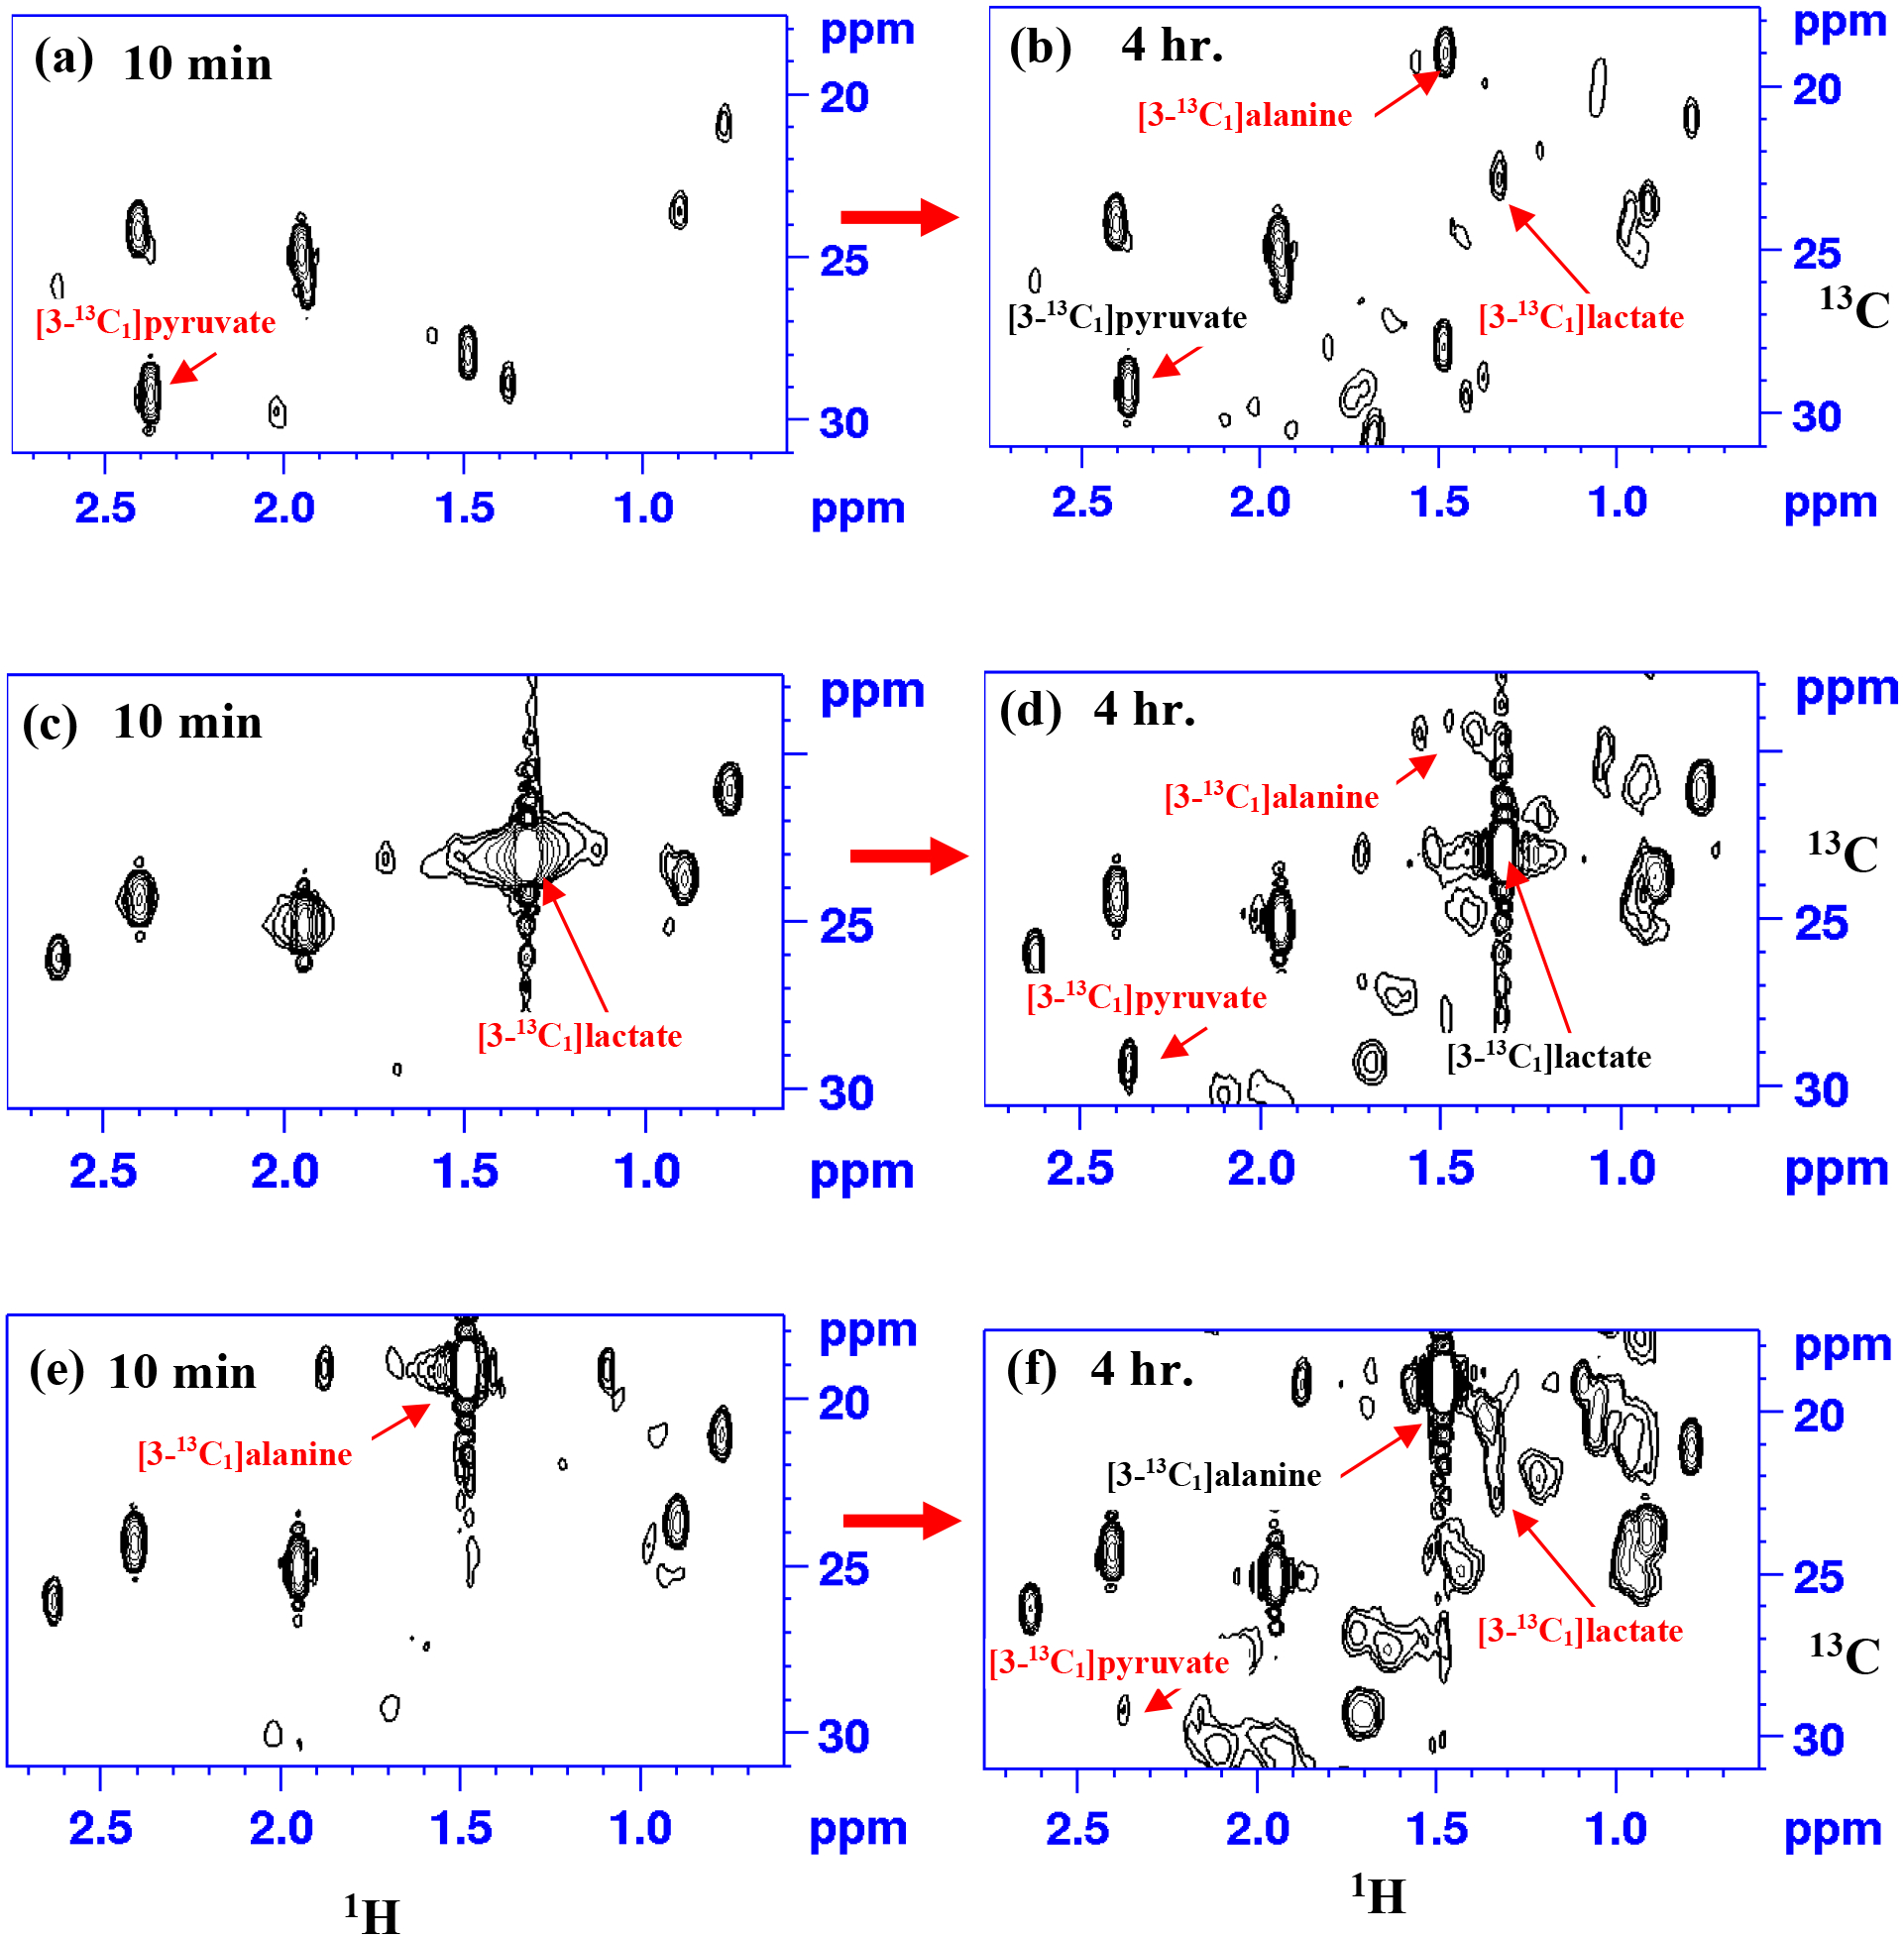
Portions of 2D 1H-13C HSQC spectra of live mitochondria obtained at 10 min and 4 hr. after treating with different isotope-labeled substrate s: [3-13C1]pyruvate (a, b); [3-13C1]lactate (c, d); or [3-13C1]alanine (e, f). Note, while the metabolic products, pyruvate, lactate, and alanine were too low to detect at 10 min after the addition of substrate, they were clearly visible in spectra obtained 4 hr. after the addition of substrate.
Figure 4.

Portions of 2D 1H-13C HSQC spectra of live mitochondria pretreated with [3-13C1]lactate (a, b), or [3-13C1]pyruvate (c-f). The spectra were obtained before and after spiking with the authentic compounds, [3-13C1]pyruvate (a, b); [3-13C1]lactate (c, d); or [3-13C1]alanine (e, f), to confirm assignments of peaks.
Figure 5.

Plots showing mitochondrial uptake and metabolism of: (a) [3-13C1]pyruvate to form (b) [3-13C1]lactate and [3-13C1]alanine; (c) [3-13C1]lactate to form (d) [3-13C1]pyruvate and [3-13C1]alanine; and (e) [3-13C1]alanine to form (e) [3-13C1]pyruvate and [3-13C1]lactate.
4. DISCUSSION
This study describes the investigation of mitochondrial transport and metabolism of pyruvate, lactate, and alanine. Live cells derived from mouse C2C12 skeletal muscle cells and their isolated mitochondria were used to investigate metabolism in real-time using NMR spectroscopy. 13C isotope-labeled pyruvate, lactate, and alanine were used as substrates for investigation of cellular/mitochondria metabolism. In this study, the NMR sensitivity required for the real-time monitoring of metabolism was achieved based on the combination of isotope-labeled substrates, high magnetic field (800 MHz), a cryo-probe, and the sensitivity enhanced 2D HSQC experiment. The dynamic variation of the substrates and their metabolic products in live cells and mitochondria is reflected in the gradual variation of their peak areas in the NMR spectra as a function of time. The results provide direct evidence for the transport into mitochondria and metabolism of the cytosolic lactate and alanine, apart from pyruvate (Figs. 2 and 5).
Pyruvate, lactate, and alanine are the major downstream products of glycolysis in the cytosol that serve as substrates for numerous metabolic pathways. In skeletal muscle, specifically, it is well-known that these three metabolites are the most abundant downstream products of glycolysis, at least during the initial phase of metabolism (up to ~ 1 hr.).[34] Pyruvate is oxidized in the mitochondria to meet the energy demand from the skeletal muscle cells for the synthesis of ATP via the TCA cycle, electron transport chain and oxidative phosphorylation. Lactate and alanine are also known to contribute to the energy production by conversion to pyruvate through the cytosolic enzymes PDH and ALT or to glucose through gluconeogenesis. However, to date, the contribution of lactate and alanine to cellular energy through their transport and metabolism inside mitochondria leading to the formation of pyruvate is contentious or not well-known. In view of this, the evidence provided in the current study that both lactate and alanine are transported into mitochondria and metabolized to form pyruvate is of high significance. (Figs. 3 and 5).
The results that lactate and alanine produced by cytosolic pyruvate are transported into mitochondria and converted back to pyruvate represent intracellular pyruvate-lactate-alanine cycling. To date, circumstances that lead to such intracellular cycling are unclear. However, some studies suggest that alanine, for instance, is transported into mitochondria and metabolized when the mitochondrial pyruvate carrier is impaired or mitochondrial pyruvate levels are low due to cellular stress caused, for example, by starvation.[20] In such a case, pyruvate availability in mitochondria is thought to be sustained by the pyruvate-alanine cycling, in which the cytosolic alanine is imported into the mitochondrial matrix and converted to pyruvate.[35–37] The experimental protocols used in our study mimic the pyruvate impaired condition since no pyruvate was added to the mitochondria samples when lactate and alanine were used as the substrates. Hence, the intracellular pyruvate-lactate-alanine cycling observed in this study suggests a role of replenishing mitochondrial pyruvate, the primary source for ATP synthesis. Further, inside mitochondria, lactate and alanine not only form pyruvate, reversibly, but also get converted to each other (Fig. 5). These results suggest the reversible nature of the intracellular pyruvate-lactate-alanine cycling.
In this study, the investigation of live cells and mitochondrial metabolism was made with no additional supply of oxygen during the analysis. The measurement of the dissolved oxygen level in the NMR tube containing the cells and the mitochondria was made using an oxygen-sensitive fluorescence probe[38] as described recently.[27] The results showed that within about 8 min after the addition of substrate, all the dissolved oxygen was consumed by the cells/mitochondria. Hence, the conditions we have used for live cells and mitochondria for the investigation of real-time metabolism represent a hypoxic environment. This is akin to some pathological conditions such as cancer, where the metabolism of cancer cells/mitochondria occurs under a hypoxic microenvironment. Under such conditions, glycolysis becomes the dominant pathway, which results in the accumulation of lactate and alanine. The higher levels of lactate and alanine in cancer are considered biomarkers for cancer.[39–43] Hence, in the current study, the conditions used for investigation of pyruvate, lactate, and alanine metabolism potentially mimic such pathological conditions.
As seen in Fig.5, the flux from lactate and alanine is lower compared with that from pyruvate. Although the reason for this is unknown, we speculate that a lower mitochondrial transport of lactate and alanine may be contributing to this. Further, flux from pyruvate to lactate is dominant and is in accordance with pyruvate metabolism under hypoxia. This also explains why the flux from lactate prefers pyruvate since the enzyme (LDH) involved is the same for both pyruvate and lactate. We anticipate that alanine flux to pyruvate to be higher than to lactate since alanine is first converted to pyruvate, which then forms lactate. However, our results show that alanine flux to lactate is higher than to pyruvate (Fig. 5(f)). This may be due to a higher rate of conversion of pyruvate to lactate than the rate of conversion of alanine to pyruvate.
5. CONCLUSIONS
This study describes the investigation of metabolism in skeletal muscle cells and mitochondria based on real-time NMR spectroscopy. Isotope-labeled pyruvate, lactate, and alanine, the three major downstream products of glycolysis, were used as substrates to study their metabolism, individually. The study builds on our recent investigation that demonstrated the ability to monitor subcellular metabolism in real-time using NMR spectroscopy.[27] The results demonstrate a novel mechanism of intracellular pyruvate-lactate-alanine cycling, in which lactate and alanine formed from cytosolic pyruvate are transported into mitochondria and converted back to pyruvate. The results also show that as in the cytoplasm, the conversion among pyruvate, lactate, and alanine inside mitochondria are reversible. The phenomenon of the intracellular cycling suggests the role of lactate and alanine in replenishing pyruvate levels inside mitochondria. The direct evidence from NMR for the intracellular cycling is significant considering the skepticism surrounding the lactate and alanine metabolism inside mitochondria. This study was conducted under a hypoxic environment, with no additional supply of oxygen to the cells or mitochondria. Hence, the investigations potentially mimic pathological conditions such as cancer, where tumor cells often experience such environments.
ACKNOWLEDGMENTS
The authors gratefully acknowledge financial support from the NIH (R01GM138465). The authors also thank Daniel Raftery for useful input to the manuscript.
REFERENCES
- 1.Kresge N, Simoni RD, Hill RL. Otto Fritz Meyerhof and the elucidation of the glycolytic pathway. J Biol Chem. 280(4):e3, 2005. [PubMed] [Google Scholar]
- 2.Chandel NS. Glycolysis. Cold Spring Harb Perspect Biol 13(5):a040535, 2021. doi: 10.1101/cshperspect.a040535 [DOI] [PMC free article] [PubMed] [Google Scholar]
- 3.Grüning N-M, Ralser M Glycolysis: How a 300yr long research journey that started with the desire to improve alcoholic beverages kept revolutionizing biochemistry. Curr Opin Syst Biol 28: 100380, 2021. [Google Scholar]
- 4.Bricker DK, Taylor EB, Schell JC, Orsak T, Boutron A, Chen YC, et al. A mitochondrial pyruvate carrier required for pyruvate uptake in yeast, Drosophila, and humans. Science 337: 96–100, 2012. doi: 10.1126/science.1218099. [DOI] [PMC free article] [PubMed] [Google Scholar]
- 5.Divakaruni AS, Murphy AN. Cell biology. A mitochondrial mystery, solved. Science 337: 41–43. (2012). doi: 10.1126/science.1225601. [DOI] [PubMed] [Google Scholar]
- 6.Herzig S, Raemy E, Montessuit S, Veuthey JL, Zamboni N, Westermann B, Kunji ER, Martinou JC. Identification and functional expression of the mitochondrial pyruvate carrier. Science 337: 93–96, 2012. doi: 10.1126/science.1218530. [DOI] [PubMed] [Google Scholar]
- 7.Tiidus P, Tupling AR, Houston M. Biochemistry Primer for Exercise Science, 4thEdn. Champaign,IL:HumanKinetics, p. 250, 2012. [Google Scholar]
- 8.Gray LR, Tompkins SC, Taylor EB. Regulation of pyruvate metabolism and human disease. Cell Mol Life Sci 71(14):2577–604, 2014. doi: 10.1007/s00018-013-1539-2. [DOI] [PMC free article] [PubMed] [Google Scholar]
- 9.Taylor EB. Functional Properties of the Mitochondrial Carrier System. Trends Cell Biol 27(9): 633–644, 2017. doi: 10.1016/j.tcb.2017.04.004. [DOI] [PMC free article] [PubMed] [Google Scholar]
- 10.Brooks GA, Dubouchaud H, Brown M, Sicurello JP, Butz CE. Role of mitochondrial lactate dehydrogenase and lactate oxidation in the intracellular lactate shuttle. Proc Natl Acad Sci U. S. A 96: 1129–34, 1999. doi: 10.1073/pnas.96.3.1129. [DOI] [PMC free article] [PubMed] [Google Scholar]
- 11.Chen Y, Mahieu NG, Huang X, Singh M, Crawford PA, Johnson SL, Gross RW, Schaefer J, Patti1 GJ. Lactate metabolism is associated with mammalian mitochondria. Nat Chem Biol 12:937–943, 2016. doi: 10.1038/nchembio.2172. [DOI] [PMC free article] [PubMed] [Google Scholar]
- 12.Passarella S, Paventi G, Pizzuto R. The mitochondrial L-lactate dehydrogenase affair. Front. Neurosci 8: 407, 2014. doi: 10.3389/fnins.2014.00407. [DOI] [PMC free article] [PubMed] [Google Scholar]
- 13.Young A, Oldford C, Mailloux RJ. Lactate dehydrogenase supports lactate oxidation in mitochondria isolated from different mouse tissues. Redox Biol. 28:101339, 2020. doi: 10.1016/j.redox.2019.101339. [DOI] [PMC free article] [PubMed] [Google Scholar]
- 14.Brooks GA. Cell-cell and intracellular lactate shuttles. J Physiol 587(Pt 23):5591–600, 2009. doi: 10.1113/jphysiol.2009. [DOI] [PMC free article] [PubMed] [Google Scholar]
- 15.Gladden LB. Current trends in lactate metabolism: introduction. Med Sci Sports Exerc 40(3):475–6, 2008. doi: 10.1249/MSS.0b013e31816154c9. [DOI] [PubMed] [Google Scholar]
- 16.Glancy B, Kane DA, Kavazis AN, Goodwin ML, Willis WT, Gladden LB. Mitochondrial lactate metabolism: history and implications for exercise and disease J. Physiol 599(3): 863–888, 2021. doi: 10.1113/JP278930. [DOI] [PMC free article] [PubMed] [Google Scholar]
- 17.Rogatzki MJ, Ferguson BS, Goodwin ML, Gladden LB. Lactate is always the end product of glycolysis. Front Neurosci. 9: 22, 2015. doi: 10.3389/fnins.2015.00022 [DOI] [PMC free article] [PubMed] [Google Scholar]
- 18.Hashimoto T, Hussien R, Brooks GA. Colocalization of MCT1, CD147, and LDH in mitochondrial inner membrane of L6 muscle cells: evidence of a mitochondrial lactate oxidation complex. Am J Physiol Endocrinol Metab 290: E1237–E1244, (2006). doi: 10.1152/ajpendo.00594.2005 [DOI] [PubMed] [Google Scholar]
- 19.Gladden LB. 200th anniversary of lactate research in muscle. Exerc Sport Sci Rev 36:109–115, 2008.doi: 10.1097/JES.0b013e31817c0038 [DOI] [PubMed] [Google Scholar]
- 20.Glinghammar B, Rafter I, Lindström A-K, Hedberg JJ, Andersson HB, Lindblom P, Berg A-L, Cotgreave I. Detection of the mitochondrial and catalytically active alanine aminotransferase in human tissues and plasma. Int J Mol Med 23(5): 621–31, 2009. doi: 10.3892/ijmm_00000173. [DOI] [PubMed] [Google Scholar]
- 21.Guda P, Guda C, Subramaniam S. Reconstruction of Pathways Associated with Amino Acid Metabolism in Human Mitochondria. Genomics Proteomics Bioinformatics. 5(3–4): 166–176, 2007. doi: 10.1016/S1672-0229(08)60004-2. [DOI] [PMC free article] [PubMed] [Google Scholar]
- 22.Offermann W, Fiedler E, Helmle-Kolb C, Hofer W, Kugel H, Reese T, et al. Online monitoring of the krebs cycle in isolated heart mitochondria by carbon 13 nmr spectroscopy. Magn Reason Chem 30(4), 347–358, 1992. [Google Scholar]
- 23.Shieh WR, Gou DM, Liu YC, Chen CS, Chen CY. A 13C NMR study on ibuprofen metabolism in isolated rat liver mitochondria Anal. Biochem 212(1): 143–9, 1993. doi: 10.1006/abio.1993.1304. [DOI] [PubMed] [Google Scholar]
- 24.Perrin A, Gout E, Chambaz EM, Defaye G. Metabolism of malate in bovine adrenocortical mitochondria studied by 13C-NMR spectroscopy. Eur. J. Biochem 223(1): 51–9, 1994. doi: 10.1111/j.1432-1033.1994.tb18965.x. [DOI] [PubMed] [Google Scholar]
- 25.Xu WJ, Wen H, Kim HS, Ko YJ, Dong SM, Park IS, et al. Observation of acetyl phosphate formation in mammalian mitochondria using real-time in-organelle NMR metabolomics Proc Natl Acad Sci U S A. 115(16): 4152–4157. 2018. doi: 10.1073/pnas.1720908115. [DOI] [PMC free article] [PubMed] [Google Scholar]
- 26.Wen H, An YG, Xu WJ, Kang KW, Park S. Real-time monitoring of cancer cell metabolism and effects of an anticancer agent using 2D in-cell NMR spectroscopy. Angew Chem Int Ed Engl 54(18): 5374–7, 2015. doi: 10.1002/anie.201410380. [DOI] [PubMed] [Google Scholar]
- 27.Nagana Gowda GA, Pascua V, Lusk JA, Hong NN, Guo L, Dong J. et al. Monitoring live mitochondrial metabolism in real-time using NMR spectroscopy. Magn Reson Chem 2023. Mar 7. doi: 10.1002/mrc.5341. doi: 10.1002/mrc.5341. Online ahead of print. [DOI] [PMC free article] [PubMed] [Google Scholar]
- 28.Bricker DK, Taylor EB, Schell JC, Orsak T, Boutron A, Chen YC, Cox JE, Cardon CM, Van Vranken JG, Dephoure N, Redin C, Boudina S, Gygi SP, Brivet M, Thummel CS, Rutter J, Science, 2012, 337, 96. [DOI] [PMC free article] [PubMed] [Google Scholar]
- 29.Xu WJ, Wen H, Kim HS, Ko YJ, Dong SM, Park IS, Yook JI, Park S, Proc. Natl. Acad. Sci. U S A 2018, 115(16), 4152. [DOI] [PMC free article] [PubMed] [Google Scholar]
- 30.Nagana Gowda GA, Gowda YN, Raftery D, Anal. Chem 2015, 87(1), 706. [DOI] [PMC free article] [PubMed] [Google Scholar]
- 31.Nagana Gowda GA, Abell L, Tian R, Anal. Chem 2019, 91(3), 2464. [DOI] [PMC free article] [PubMed] [Google Scholar]
- 32.Wishart DS, Guo A, Oler E, Wang F, Anjum A, Peters H, Dizon R, Sayeeda Z, Tian S, Lee BL, Berjanskii M, Mah R, Yamamoto M, Jovel J, Torres-Calzada C, Hiebert-Giesbrecht M, Lui VW, Varshavi D, Varshavi D, Allen D, Arndt D, Khetarpal N, Sivakumaran A, Harford K, Sanford S, Yee K, Cao X, Budinski Z, Liigand J, Zhang L, Zheng J, Mandal R, Karu N, Dambrova M, Schiöth HB, Greiner R, Gautam V, Nucleic Acids Res. 2022, 50D1, D622. [DOI] [PMC free article] [PubMed] [Google Scholar]
- 33.Romero PR, Kobayashi N, Wedell JR, Baskaran K, Iwata T, Yokochi M, Maziuk D, Yao H, Fujiwara T, Kurusu G, Ulrich EL, Hoch JC, Markley JL, Methods Mol. Biol 2020, 2112, 187. [DOI] [PMC free article] [PubMed] [Google Scholar]
- 34.Jucker BM, Rennings AJ, Cline GW, Petersen KF, Shulman GI. In vivo NMR investigation of intramuscular glucose metabolism in conscious rats. Am J Physiol. 273(1 Pt 1):E139–48, 1997. doi: 10.1152/ajpendo.1997.273.1.E139. [DOI] [PubMed] [Google Scholar]
- 35.Gray LR, Sultana MR, Rauckhorst AJ, Oonthonpan L, Tompkins SC, Sharma A, et al. Hepatic Mitochondrial Pyruvate Carrier 1 Is Required for Efficient Regulation of Gluconeogenesis and Whole-Body Glucose Homeostasis. Cell Metab 22(4):669–81, 2015. doi: 10.1016/j.cmet.2015.07.027. [DOI] [PMC free article] [PubMed] [Google Scholar]
- 36.McCommis KS, Chen Z, Fu X, McDonald WG, Colca JR, Kletzien RF, et al. Loss of Mitochondrial Pyruvate Carrier 2 in the Liver Leads to Defects in Gluconeogenesis and Compensation via Pyruvate-Alanine Cycling. Cell Metab 22(4):682–94, 2015. doi: 10.1016/j.cmet.2015.07.028. [DOI] [PMC free article] [PubMed] [Google Scholar]
- 37.Divakaruni AS, Wallace M, Buren C, Martyniuk K, Andreyev AY, Li E, et al. Inhibition of the mitochondrial pyruvate carrier protects from excitotoxic neuronal death. J Cell Biol 216(4):1091–1105, 2017. doi: 10.1083/jcb.201612067. [DOI] [PMC free article] [PubMed] [Google Scholar]
- 38.Kamat V, Robbings BM, Jung S-R, Kelly J, Hurley JB, Bube K, Sweet IR. 2021, eLife. 10:e66716. Doi: 10.7554/eLife.66716. [DOI] [PMC free article] [PubMed] [Google Scholar]
- 39.Ivashkiv LB, Nat Rev Immunol. 2020, 20(2), 85. [DOI] [PMC free article] [PubMed] [Google Scholar]
- 40.Albers MJ, Bok R, Chen AP, Cunningham CH, Zierhut ML, Zhang VY, et al. Hyperpolarized 13C Lactate, Pyruvate, and Alanine: Noninvasive Biomarkers for Prostate Cancer Detection and Grading. Cancer Res. 68(20): 8607–8615, 2008. doi: 10.1158/0008-5472.CAN-08-0749 [DOI] [PMC free article] [PubMed] [Google Scholar]
- 41.Cornel EB, Smits GA, Oosterhof GO, Karthaus HF, Deburyne FM, Schalken JA, Heerschap A. Characterization of human prostate cancer, benign prostatic hyperplasia and normal prostate by in vitro1H and 31P magnetic resonance spectroscopy. J Urol. 150:2019–24, 1993. doi: 10.1016/s0022-5347(17)35957-8. [DOI] [PubMed] [Google Scholar]
- 42.Swanson MG, Zektzer AS, Tabatabai ZL, Simko J, Jarso S, Keshari KR, Schmitt L, Carroll PR, Shinohara K, Vigneron DB, Kurhanewicz J. Quantitative analysis of prostate metabolites using 1H HR-MAS spectroscopy. Magn Reson Med. 55:1257–64, 2006. doi: 10.1002/mrm.20909. [DOI] [PubMed] [Google Scholar]
- 43.Tessem MB, Swanson MG, Keshari KR, Albers MJ, Joun D, Tabatabai ZL, Simko JP, Shinohara K, Nelson SJ, Vigneron DB, Gribbestad IS. Kurhanewicz John et al. Evaluation of lactate and alanine as metabolic biomarkers of prostate cancer using 1H HR-MAS; spectroscopy of biopsy tissues. Magn Reson Med. 60:510–6, 2008. doi: 10.1002/mrm.21694. [DOI] [PMC free article] [PubMed] [Google Scholar]