

Abstract
Objectives
Compared to Oklahoma, 33 states have higher all-cause cancer incidence rates, but only three states have higher all-cause cancer mortality rates. Given this troubling gap between Oklahoma’s cancer incidence and mortality rankings, in-depth examination of cancer incidence, staging, and mortality rates among this state’s high-risk populations is warranted. This study provides in-depth information on overall and cause-specific cancer incidence and mortality for the rural and urban Oklahoma populations classified by Rural-Urban Continuum Codes (RUCC).
Methods
Data were publicly available and de-identified, accessed through Oklahoma Statistics on Health Available for Everyone (OK2SHARE). Statistical analysis included calculating age-specific rates, age-adjusted rates, and percentages, as well as assessing temporal patterns using average annual percent change with 95% confidence intervals determined by Joinpoint regression analysis.
Findings
Urban areas had a higher proportion of female breast cancer cases, while large and small rural areas had higher rates of lung and bronchus cancer. Urban residents were more likely to have private insurance and less likely to have Medicare compared to rural residents. Cancer incidence rates increased with age, and men had higher mortality rates than women. Lung and bronchus cancer was the leading cause of cancer death, with lower rates in urban areas compared to rural areas.
Conclusions
Findings demonstrate the need to improve the early detection of cancer among the rural populations of Oklahoma. Additionally, the high mortality rates for most types of cancer experienced by the state’s rural population underscores the need to improve cancer detection and treatment in these locations.
Keywords: Health Disparities, Rural, Urban
1. Introduction
Compared to urban populations in the United States (U.S.), rural populations have worse outcomes for cancer treatment1–4, survival5,6, and mortality,6–8 and the rural-urban gap in cancer mortality may even be increasing.6,7,9 In contrast, studies of the rural-urban differences in cancer incidence6,8,10 and staging5 show mixed results. One study using data from 2009 to 2013 showed that the age-adjusted, all-cause cancer incidence rate was higher in urban populations than rural ones for most of the US, except for the U.S. South Census Region states (Alabama, Arkansas, Delaware, Florida, Georgia, Kentucky, Louisiana, and Maryland).11 This same study also showed that while many cancer incidence rates were similar or lower compared to their urban counterparts, rural populations had higher incidence rates for tobacco-associated, HPV-associated, and colorectal cancers across most U.S. locations.11
Marked regional differences in the rural-urban cancer gap have been reported. In Appalachia, cancer incidence rates are higher in rural populations than urban ones.12 A more recent study noted that rural Appalachians had lower rates of early-stage breast cancer diagnoses than their urban non-Appalachian counterparts.6 In Utah, patients from rural counties were more likely to be older, American Indian/Alaskan Native, non-Hispanic, male, and diagnosed with cancer at more advanced stages.13 Age-adjusted cancer incidence rates in Utah’s rural counties were lower by 11.9/100,000 per year (449.2/100,000 in rural counties vs. 461.1/100,000 in metropolitan counties).14
Rural cancer disparities reflect the circumstances of rural populations in the US, which include multiple socioeconomic and healthcare challenges that increase cancer risk and impede access to timely diagnosis and treatment. Rural populations are characterized by higher rates of poverty,15 lower levels of educational attainment,16 and lower rates of health insurance coverage.17 Among modifiable cancer risk factors, many rural populations have high rates of tobacco use18 and obesity.19 Rural populations face a relative shortage of healthcare providers and services17,20, which results in long-distance travel and, sometimes, the need for overnight lodging to access cancer care services provided in urban centers.21
The present study focuses on Oklahoma, a highly rural state. In 2020, 34% (1,337,318) of the state’s population resided in nonmetropolitan (rural) locations.22 The poverty rate among rural Oklahomans was 16.8% compared to 13.1% among urban Oklahomans, and 11.4% for the U.S. population.22 Additionally in 2020, 21.6% of rural Oklahoma adults reported current smoking, compared to 19.1% of adults in the entire state, and 15.5% adults in the U.S.23 In 2020, 37.7% of rural Oklahoma adults were obese, compared to 36.4% of adults in Oklahoma and 31.9% adults in the US.23 Among U.S. states, Oklahoma falls in the lowest quintile of per capita oncologist supply.24
Compared to Oklahoma, 33 states have higher all-cause cancer incidence rates, but only three states have higher all-cause cancer mortality rates.25 Several potential explanation include case mix-Oklahoma having a higher incidence of lower survival cancer such as Lung and Bronchus cancer; Oklahoma may be finding cancer at a later stage; Oklahoma may have limited access to treatment particularly given the rural nature of the state. Given this troubling gap between Oklahoma’s cancer incidence and mortality rankings, in-depth examination of cancer incidence, staging, and mortality rates among this state’s high-risk populations is warranted. The aim of this study is to provide detailed information on overall and cause-specific cancer incidence and mortality for the rural and urban populations of Oklahoma classified by Rural-Urban Continuum Codes (RUCC).
2. Materials and Methods
2.1. Study Population/Data Sources
Cancer incidence data for 2016 to 2020 were obtained from the Oklahoma Central Cancer Registry (OCCR) and cancer mortality data for 2016 to 2020 were obtained from Oklahoma Vital Statistics (OVS). OCCR and OVS are surveillance systems designed and implemented to collect all incident cancer cases and all deaths in Oklahoma respectively. All data sources were publicly available through Oklahoma Statistics on Health Available for Everyone (OK2SHARE), a web-based query system that allows public health datasets analysis (https://www.health.state.ok.us/) and provided de-identified data. For trend data 1997 was the first year incidence data are available for Oklahoma; for mortality these data begin in 1999 with the change to the death certificate in Oklahoma. The population denominator used was the bridged population estimates available from SEER (https://seer.cancer.gov/popdata/).
To ensure the stability of estimates and confidentiality, OCCR rates were suppressed if fewer than ten counts were reported in a specific category and OVS rates were suppressed if fewer than five deaths. Incident cancers for all sites include in situ cancers, except bladder and cervix. All incidence and mortality rates are per 100,000 population. Staging for this study used the SEER summary stage. Hispanic persons were categorized as Hispanic regardless of race. All individuals in this study were categorized into one of the following ethnic and racial groups: Hispanic, Non-Hispanic (NH) White, Black/African American, American Indian/Alaska Native (AIAN), and Asian and Pacific Islander. Except for staging, for all analyses unknown values were excluded and resulting percentages were weighted averages estimated from the sample and population sizes.
To measure rurality, the United States Department of Agriculture (USDA) Economic Research Service’s (ERS) 2013 Rural-Urban Continuum Codes (RUCC) were used.26 These codes refer to the gradual transition and interdependence between rural and urban areas along a spectrum, encompassing various degrees of population density, economic activities, and infrastructure development.26 These codes are applied at the county level. To analyze different levels of rural Oklahoma, in this study, large rural counties included RUCC 4–6 group, and small rural counties in the RUCC 7–9 group. Urban refers to counties in the RUCC 1–3 group. Among the 77 counties in Oklahoma, 18 are urban counties (2,652,414), 28 are large rural counties (925,121), and 31 are small rural counties (385,021).
2.2. Statistical Analysis
Age-specific, age-adjusted rates, and percentages (insurance and stage) were calculated. Standard errors were calculated to account for variability and to test for statistical significance. All age-adjusted rates were adjusted to the 2000 U.S. standard population. Temporal patterns were assessed using average annual percent change (AAPC) in rates with 95% confidence interval (CI) using Joinpoint regression analysis.27
3. Results
3.1. Incidence
From 2016 through 2020, a total of 113,528 cancer cases were diagnosed in Oklahoma. Of these, 72,586 lived in urban areas, 29,315 lived in large rural areas, and 11,627 lived in small rural areas. The overall crude incidence rates were urban at 555.8 (95% CI 551.8–559.8); large rural at 620.4 (95% CI 613.3–627.5); and small rural at 592.7(95% CI 581.9–603.5). The corresponding overall age-adjusted incidence cancer rates were urban at 493.5 (95% CI 489.9–497.1); large rural at 486.7 (95% CI 481.1–492.3); and small rural at 471.4 (95% CI 462.8–480.0).
Among the urban population, incidence rates increased by age group (Table 1). Among both the large and small rural populations, incidence rates increased in each age group up to the 70–79 year one, with persons aged 80 and over having slightly lower incidence rates. Cancer incidence rates for both the male and female populations were lowest in small rural areas and highest in urban areas. The pattern held for race and ethnicity with one exception. The Asian/Pacific Islander population in large rural locations had slightly higher incidence rates than in urban locations (Table 1). The AIAN population had the highest incidence rate overall, and Black or African American persons had the next highest rate followed by Whites and Asian/Pacific Islander. The Non-Hispanic population had higher incidence rates than the Hispanic population regardless of geographic location.
Table 1:
Age-specific, age-adjusted cancer incidence rates and 95% confidence intervals by urban, large rural, and small rural settings Oklahoma 2016–2020
| Urban | Large Rural | Small Rural | ||||
|---|---|---|---|---|---|---|
| Age-specific Rate | 95% CI | Age-specific Rate | 95% CI | Age-specific Rate | 95% CI | |
| 0–19 | 20.2 | 18.7–21.7 | 17.3 | 15.0–19.6 | 23.0 | 18.9–27.1 |
| 20–39 | 94.4 | 91.3–97.5 | 92.3 | 86.9–97.7 | 90.9 | 82.6–99.2 |
| 40–49 | 335.3 | 326.2–344.4 | 349.9 | 333.9–365.9 | 312.7 | 289.3–336.1 |
| 50–59 | 794.2 | 780.4–808.0 | 818.2 | 795.1–841.3 | 802.9 | 767.2–838.6 |
| 60–69 | 1526.2 | 1505.8–1546.6 | 1560.1 | 1527.4–1592.8 | 1521.8 | 1471.0–1572.6 |
| 70–79 | 2276.2 | 2243.7–2308.7 | 2166.8 | 2119.8–2213.8 | 2165.1 | 2090.7–2239.5 |
| 80+ | 2294.5 | 2249.9–2339.1 | 2126.7 | 2064.1–2189.3 | 1936.6 | 1845.2–2028.0 |
| Age-adjusted Rate | 95% CI | Age-adjusted Rate | 95% CI | Age-adjusted Rate | 95% CI | |
| Gender | ||||||
| Male | 525.9 | 520.5–531.3 | 518.2 | 509.9–526.5 | 512.6 | 499.8–525.4 |
| Female | 475.1 | 470.2–480.0 | 467.3 | 459.7–474.9 | 443.1 | 431.4–454.8 |
| Race | ||||||
| White | 474.7 | 470.9–478.5 | 459.5 | 453.6–465.4 | 448.7 | 439.8–457.6 |
| Black | 457.6 | 445.6–469.6 | 450.4 | 418.7–482.1 | 401.6 | 358.0–445.2 |
| American Indian | 647.7 | 630.5–664.9 | 620.1 | 601.6–638.6 | 606.2 | 572.7–639.7 |
| Asian | 331.6 | 312.7–350.5 | 346.7 | 295.0–398.4 | 309.3 | 222.7–395.9 |
| Ethnicity | ||||||
| Non-Hispanic | 496.8 | 493.1–500.5 | 487.9 | 482.2–493.6 | 477.1 | 468.2–486.0 |
| Hispanic | 361.7 | 348.2–375.2 | 327.7 | 301.8–353.6 | 302.9 | 273.4–332.4 |
In each of the rural locations, Medicare was the most common type of insurance coverage, followed by private insurance coverage (Figure 1). Oklahomans who reside in urban areas were more likely to have private insurance compared to those residing in large or small rural locations, 34.5% (95% CI 33.5–35.5) vs 26.3% (95% CI 24.8–27.9) and 27.3% (95% CI 26.8–27.7) respectively. Those living in urban areas were less likely to have Medicare as their primary paying source for cancer diagnosis or treatment compared to those living in large or small rural areas 46.3% (95% CI 45.5–47.1) vs 50.6% (95% CI 49.3–51.9) and 49.4% (95% CI 49.0–49.9) respectively (Table 4). While not statistically significant there are more Oklahomans using Indian Health Services as their primary payer source in large and small rural areas compared to urban areas (Table 1).
Figure 1:
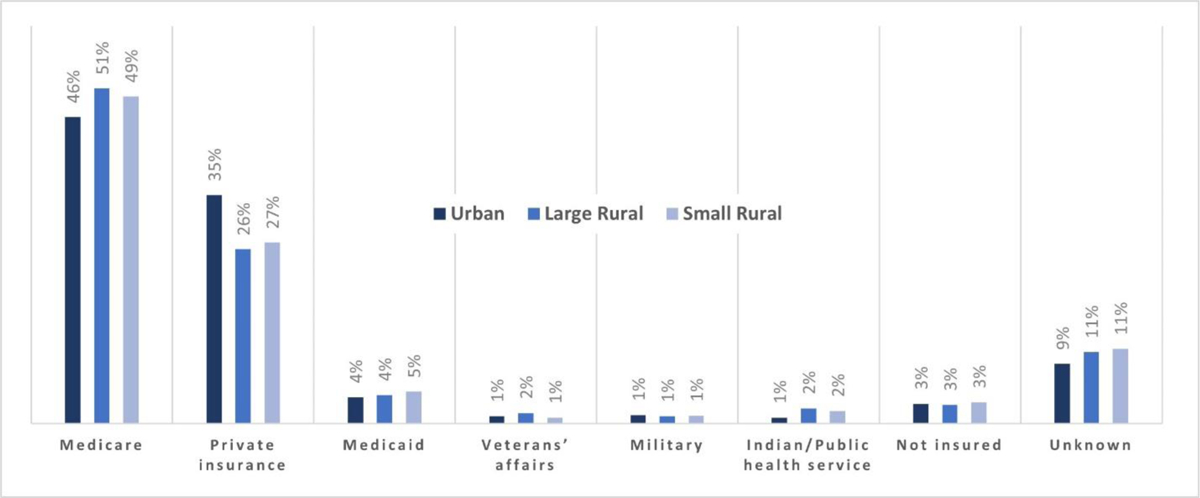
Percent of cancer by insurance status by urban, large rural, and small rural settings Oklahoma 2016–2020
Table 4:
Number, percent, and 95% confidence intervals of specific cancer by stage at diagnosis by urban, large rural, and small rural Oklahoma settings 2016–2020
| Urban | Large Rural | Small Rural | |||||||
|---|---|---|---|---|---|---|---|---|---|
| Cancers | % State Cancers | 95% CI | Cancers | % State Cancers | 95% CI | Cancers | % State Cancers | 95% CI | |
| Female Breast | |||||||||
| In Situ | 1657 | 14.4% | 13.5–15.3 | 477 | 12.0% | 10.6–13.4 | 181 | 12.4% | 10.0–14.8 |
| Localized | 6124 | 53.2% | 51.3–55.1 | 2116 | 53.4% | 50.1–56.7 | 732 | 50.3% | 44.8–55.8 |
| Regional | 2662 | 23.1% | 19.9–26.3 | 891 | 22.5% | 17.1–27.9 | 314 | 21.6% | 13.3–29.9 |
| Distant | 660 | 5.7% | 3.4–8.0 | 226 | 5.7% | 2.8–8.6 | 95 | 6.5% | 2.3–10.7 |
| Unknown * | 404 | 4.1% | 3.7–4.5 | 249 | 6.3% | 5.5–7.1 | 132 | 9.1% | 7.6–10.6 |
| Cervix | |||||||||
| Localized | 228 | 37.4% | 33.3–41.5 | 101 | 38.3% | 32.0–44.6 | 28 | 31.8% | 20.7–42.9 |
| Regional | 208 | 34.2% | 30.1–38.3 | 92 | 34.8% | 28.6–41.0 | 30 | 34.1% | 22.9–45.3 |
| Distant | 110 | 18.1% | 14.7–21.5 | 46 | 17.4% | 12.4–22.4 | 16 | 18.2% | 8.8–27.6 |
| Unknown | 63 | 10.3% | 7.9–12.7 | 25 | 9.5% | 6.0–13.0 | 14 | 15.9% | 8.3–23.5 |
| Colorectal | |||||||||
| In Situ | 113 | 2.0% | 1.6–2.4 | 67 | 2.6% | 1.9–3.3 | 16 | 1.4% | 0.6–2.2 |
| Localized * | 1846 | 33.1% | 31.8–34.4 | 737 | 28.4% | 26.5–30.3 | 332 | 29.6% | 26.5–32.7 |
| Regional | 1870 | 33.5% | 32.2–34.8 | 904 | 34.9% | 32.9–36.9 | 367 | 32.7% | 29.5–35.9 |
| Distant | 1215 | 21.8% | 20.6–23.0 | 542 | 20.9% | 19.1–22.7 | 212 | 18.9% | 16.2–21.6 |
| Unknown | 537 | 9.6% | 8.8–10.4 | 342 | 13.2% | 11.9–14.5 | 194 | 17.3% | 15.1–19.5 |
| Lung | |||||||||
| In Situ | 16 | 0.2% | 0.1–0.3 | ||||||
| Localized * | 2150 | 23.6% | 22.6–24.6 | 969 | 21.3% | 19.9–22.7 | 341 | 19.8% | 17.5–22.1 |
| Regional | 1886 | 20.7% | 19.8–21.6 | 966 | 21.2% | 19.8–22.6 | 334 | 19.4% | 17.1–21.7 |
| Distant | 4021 | 44.2% | 43.1–45.3 | 1891 | 41.5% | 39.9–43.1 | 713 | 41.4% | 38.8–44.0 |
| Unknown | 1026 | 11.3% | 10.7–11.9 | 732 | 16.1% | 15.0–17.2 | 333 | 19.3% | 17.4–21.2 |
| Prostate | |||||||||
| In Situ | Suppressed | Suppressed | Suppressed | ||||||
| Localized * | 5506 | 70.0% | 69.0–71.0 | 1624 | 60.9% | 59.1–62.7 | 697 | 59.4% | 56.6–62.2 |
| Regional | 857 | 10.9% | 10.1–11.7 | 312 | 11.7% | 10.2–13.2 | 134 | 11.4% | 9.1–13.7 |
| Distant * | 577 | 7.3% | 6.7–7.9 | 241 | 9.0% | 7.7–10.3 | 83 | 7.1% | 5.2–9.0 |
| Unknown | 924 | 11.7% | 11.0–12.4 | 489 | 18.3% | 16.8–19.8 | 260 | 22.1% | 19.7–24.5 |
statistically significant difference;
3.2. Mortality
Overall, there were 41,401 deaths from cancer between 2016 to 2020 in Oklahoma: 24,886 of these were among persons from urban areas; 11,748 were among those from large rural areas; and 4,728 were among those from small rural areas. Crude all-cause mortality rates were 190.6 (95% CI 188.2–193.0) for the urban population, 248.9 (95% CI 244.4–253.4) for the large rural population, and 241.1 (95% CI234.2–248.0) for the small rural population. The corresponding age-adjusted, all-cause mortality rates were 169.0 (95% CI 166.9171.1) in the urban population, 187.4 (95% CI 184.0–190.8) in the large rural population, and 183.3 (95% CI 178.1–188.5) in the small rural population.
The age-specific rates for cancer mortality increased with each age group regardless of geographic setting (Table 2). The male population in both large and small rural locations were more likely to die from cancer than the male population in urban locations. Among all racial groups in Oklahoma, the populations located in urban settings were less likely to die from cancer than those living in large or small rural settings (Table 2). The AIAN population had the highest mortality rates (243.4/100,000 (95% CI 232.4–254.4) overall) in all settings, and the Black or African American population had the next highest rate in all settings (187.7 (95% CI 179.8–195.6)), followed by the White population (164.2 (95% CI 162.0–166.4)) and Others (111.3 (95% CI 99.5–123.1)). The Non-Hispanic population had the higher mortality rates (172.0 (95% CI169.8–174.2)) than the Hispanic population (104.2 (95% CI 96.2–112.2)).
Table 2:
Age-specific and age-adjusted cancer mortality rates by urban, large rural, and small rural settings Oklahoma 2016–2020
| Urban | Large Rural | Small Rural | ||||
|---|---|---|---|---|---|---|
| Age-specific Rate | 95% CI | Age-specific Rate | 95% CI | Age-specific Rate | 95% CI | |
| 0–19 | 2.6 | 2.2–3.0 | 2.8 | 1.9–3.7 | 1.7 | 0.6–2.8 |
| 20–39 | 10.9 | 9.8–12.0 | 12.8 | 10.8–14.8 | 12.5 | 9.4–15.6 |
| 40–49 | 57.0 | 53.3–60.7 | 69.8 | 62.7–76.9 | 59.8 | 49.6–70.0 |
| 50–59 | 204.6 | 197.6–211.6 | 252.3 | 239.4–265.2 | 240.0 | 220.5–259.5 |
| 60–69 | 471.7 | 460.4–483.0 | 550.0 | 530.6–569.4 | 543.7 | 513.4–574.0 |
| 70–79 | 877.1 | 856.9–897.3 | 947.9 | 916.8–979 | 964.7 | 915.1–1014.3 |
| 80+ | 1434.9 | 1399.6–1470.2 | 1468.2 | 1416.1–1520.3 | 1412.6 | 1334.4–1490.8 |
| Age-adjusted Rate | 95% CI | Age-adjusted Rate | 95% CI | Age-adjusted Rate | 95% CI | |
| Gender | ||||||
| Male | 199.8 | 196.4–203.2 | 224.8 | 219.3–230.3 | 221.1 | 212.7–229.5 |
| Female | 146.2 | 143.6–148.8 | 158.1 | 153.8–162.4 | 153.5 | 146.9–160.1 |
| Race | ||||||
| White | 164.2 | 162.0–166.4 | 178.6 | 175.0–182.2 | 177.1 | 171.7–182.5 |
| Black | 184.2 | 176.3–192.1 | 208.3 | 186.7–229.9 | 196.0 | 164.6–227.4 |
| American Indian | 243.4 | 232.4–254.4 | 258.6 | 246.3–270.9 | 261.4 | 238.8–284.0 |
| Other | 111.3 | 99.5–123.1 | 86.5 | 60.3–112.7 | 83.3 | 39.7–126.9 |
| Ethnicity | ||||||
| Non-Hispanic | 172.0 | 169.8–174.2 | 189.7 | 186.3–193.1 | 187.8 | 182.4–193.2 |
| Hispanic | 104.2 | 96.2–112.2 | 104.5 | 88.8–120.2 | 94.9 | 77.5–112.3 |
3.3. Specific Cancers
Age-adjusted incidence rates by specific cancers that were significantly higher in urban compared to large or small rural areas included: female breast cancer (excluding in situ) (urban 68.7 (95% CI 67.3–70.1), large rural 61.0 (95% CI 59.0–72.4) and small rural 54.1 (95% CI 51.1–57.1)); female breast cancer (in situ) (11.5 (95% CI 11.0–12.0) 8.3 (95% CI 7.6–9.0) and 7.4 (95% CI 6.3–8.5)); and prostate cancer (49.3 (95% CI 48.2–50.4), 40.3 (95% CI 38.8–41.8) and 43.7 (95% CI 41.2–46.2)) (Table 3). For colorectal cancer, the age-adjusted incidence rates for both rural locations were higher than for the urban location (urban 38.6 (95% CI 37.6–39.6), large rural 43.5 (95% CI 41.8–45.2) and small rural 45.7 (95% CI 43.0–48.4)). For lung and bronchus cancer, the incidence rate was highest in the large rural location (70.4 (95% CI 68.4–72.4), vs 68.7 (95% CI 67.3–70.1) urban, and 64.7 (95% CI 61.6–67.8) small rural).
Table 3:
Top 15 cancer incidence, mortality rates, and 95% confidence intervals by urban, large rural, and small rural location Oklahoma 2016–2020
| Incidence | ||||||||
|---|---|---|---|---|---|---|---|---|
| Urban | Large Rural | Small Rural | ||||||
| Cancer | AAIR | 95% CI | Cancer | AAIR | 95% CI | Cancer | AAIR | 95% CI |
| Female Breast (Excluding In Situ) | 68.7 | 67.3–70.1 | Lung and bronchus | 70.4 | 68.4–72.4 | Lung and bronchus | 64.7 | 61.6–67.8 |
| Lung and bronchus | 60.2 | 59.0–61.4 | Female Breast (Excluding In Situ) | 61.0 | 59.0–63.0 | Female Breast (Excluding In Situ) | 54.1 | 51.1–57.1 |
| Prostate | 49.3 | 48.2–50.4 | ColoRectal | 43.5 | 41.8–45.2 | ColoRectal | 45.7 | 43.0–48.4 |
| Melanomas of the skin | 42.0 | 40.9–43.1 | Prostate | 40.3 | 38.8–41.8 | Prostate | 43.7 | 41.2–46.2 |
| ColoRectal | 38.6 | 37.6–39.6 | Melanomas of the skin | 35.1 | 33.6–36.6 | Melanomas of the skin | 30.9 | 28.7–33.1 |
| Kidney and renal pelvis | 20.5 | 19.8–21.2 | Kidney and renal pelvis | 22.0 | 20.8–23.2 | Kidney and renal pelvis | 23.1 | 21.2–25.0 |
| Other, ill-defined, and unknown | 18.7 | 18.0–19.4 | Other, ill-defined, and unknown | 20.2 | 19.1–21.3 | Bladder | 18.7 | 17.0–20.4 |
| Bladder | 18.5 | 17.8–19.2 | Bladder | 18.4 | 17.3–19.5 | Other, ill-defined, and unknown | 17.4 | 15.8–19.0 |
| Non-Hodgkin Lymphoma | 17.4 | 16.7–18.1 | Non-Hodgkin Lymphoma | 16.1 | 15.1–17.1 | Non-Hodgkin Lymphoma | 17.0 | 15.4–18.6 |
| Corpus uteri | 12.5 | 11.9–13.1 | Corpus uteri | 13.3 | 12.4–14.2 | Pancreas | 13.2 | 11.8–14.6 |
| Thyroid | 12.5 | 11.9–13.1 | Thyroid | 12.7 | 11.7–13.7 | Corpus uteri | 12.2 | 10.8–13.6 |
| Pancreas | 11.9 | 11.4–12.4 | Pancreas | 12.1 | 11.2–13.0 | Thyroid | 10.8 | 9.3–12.3 |
| Female Breast (In Situ only) | 11.5 | 11.0–12.0 | Other nervous system | 9.5 | 8.7–10.3 | Liver and bile duct | 8.7 | 7.6–9.8 |
| Other nervous system | 9.7 | 9.2–10.2 | Liver and bile duct | 9.0 | 8.3–9.7 | Other nervous system | 7.9 | 6.7–9.1 |
| Liver and bile duct | 8.7 | 8.2–9.2 | Female Breast (In Situ only) | 8.3 | 7.6–9.0 | Female Breast (In Situ only) | 7.4 | 6.3–8.5 |
| Mortality | ||||||||
| Cancer | AAMR | 95% CI | Cancer | AAMR | 95% CI | Cancer | AAMR | 95% CI |
| Lung & bronchus | 43.2 | 42.1–44.3 | Lung & bronchus | 53.1 | 51.3–54.9 | Lung & bronchus | 48.8 | 46.1–51.5 |
| Colon & rectum | 15.4 | 14.8–16.0 | Colon & rectum | 18.0 | 16.9–19.1 | Colon & rectum | 17.6 | 16.0–19.2 |
| Other, Ill-defined & Unknown | 13.5 | 12.9–14.1 | Other, Ill-defined & Unknown | 15.8 | 14.8–16.8 | Other, Ill-defined & Unknown | 15.6 | 14.1–17.1 |
| Female Breast | 12.6 | 12.0–13.2 | Female Breast | 12.0 | 11.1–12.9 | Pancreas | 13.1 | 11.7–14.5 |
| Pancreas | 10.7 | 10.2–11.2 | Pancreas | 11.4 | 10.6–12.2 | Female Breast | 11.8 | 10.5–13.1 |
| Prostate | 8.3 | 7.8–8.8 | Prostate | 8.1 | 7.4–8.8 | Prostate | 9.5 | 8.3–10.7 |
| Leukemias | 7.0 | 6.6–7.4 | Leukemias | 7.5 | 6.8–8.2 | Leukemias | 6.9 | 5.9–7.9 |
| Non-Hodgkin Lymphoma | 6.0 | 5.6–6.4 | Liver | 6.7 | 6.1–7.3 | Liver | 6.5 | 5.5–7.5 |
| Liver | 5.9 | 5.5–6.3 | Non-Hodgkin Lymphoma | 5.9 | 5.3–6.5 | Non-Hodgkin Lymphoma | 6.2 | 5.2–7.2 |
| Brain & Other Nervous System | 4.9 | 4.5–5.3 | Bladder | 5.3 | 4.7–5.9 | Kidney & renal pelvis | 5.9 | 5.0–6.8 |
| Bladder | 4.6 | 4.2–5.0 | Kidney & renal pelvis | 5.2 | 4.6–5.8 | Brain & Other Nervous System | 5.7 | 4.7–6.7 |
| Kidney & renal pelvis | 4.4 | 4.1–4.7 | Brain & Other Nervous System | 4.8 | 4.2–5.4 | Ovary | 4.2 | 3.4–5.0 |
| Esophagus | 4.0 | 3.7–4.3 | Esophagus | 4.5 | 4.0–5.0 | Esophagus | 4.1 | 3.3–4.9 |
| Ovary | 4.0 | 3.7–4.3 | Ovary | 3.7 | 3.2–4.2 | Bladder | 3.5 | 2.8–4.2 |
| Other digestive organs | 3.4 | 3.1–3.7 | Oral Cavity & Pharynx | 3.4 | 2.9–3.9 | Other digestive organs | 3.4 | 2.7–4.1 |
AAIR=Age-adjusted incidence rate; AADR=Age-adjusted mortality rate
The mostly common cause of cancer death among all Oklahomans in each geographic setting was lung and bronchus cancer (Table 3). Lung and bronchus death rates were significantly lower in the urban population than in the large rural and small rural populations (43.2 (95% CI 42.1–44.3), 53.1 (95% CI 51.3–54.9), 48.8 (95% CI 46.1–51.5)) (Table 3). Colorectal cancer (18.0 (95% CI 16.9–19.1) for large rural area vs 15.4 (95% CI 14.8–16.0) for urban area) and other, ill-defined, and unknown cancer (15.8 (95% CI 14.8–16.8) for large rural area vs 13.5 (95% CI 12.9–14.1) for urban area) show a difference between large rural and urban but not in the small rural area (Table 3).
3.4. Staging
Table 4 shows stage at diagnosis for a selected set of cancers (female breast, cervix, colorectal, lung and bronchus, and prostate) for which screening can detect cancer at early, more treatable stages (e.g., the localized proportion alone, and for cancers in which in situ cases are recorded, the in situ and localized proportions combined). For breast cancer, lung cancer, and prostate cancer, the localized proportions (or localized plus in situ proportions, where applicable) decreased as rurality increased. For colorectal cancer the localized/in situ proportions were lowest in both the large rural and small rural populations. For cancer of the cervix, the localized proportion at diagnosis was lowest in the small rural population, but lower in the urban population than in the large rural one. In most instances, unknown stage at diagnosis occurred more frequently as rurality increased.
3.5. Trends
There were two trend lines that make up all of the trend in incidence rate in Oklahoma by geographic setting: for the urban population from 1997–2006, the APC was 1.16 (95% CI 0.5;2.8; p-value 0.006), a modest increase in incidence, and for 2006 to 2020 the APC was −0.60 (95% CI −1.2; 0.3; p-value 0.002), a slight decrease; for the large rural population from 1997–2004, the APC was 1.72 (95% CI 0.5;5.5; p-value 0.017), which was an increase in incidence and for 2004 to 2020 the APC was −0.39 (95% CI −1.2; −0.1; p-value 0.038), a slight decrease; for the small rural population from 1997–2006 the APC was 1.17 (95% CI 0.2;4.9; p-value 0.023), a modest increase in incidence rates and for 2006 to 2020 the APC was −0.67 (95% CI −2.5; −0.2; p-value 0.011), a small decrease (Figure 2a). From 1999 to 2020 mortality rates declined for the three geographic areas, but the decline was greatest in the urban population (urban area AAPC −1.04% (95% CI −1.2, −0.9; p-value <0.001); the large rural area AAPC −0.54% 95% CI −0.7, −0.4; p-value <0.001); and the small rural area AAPC −0.42% (95% CI −0.7, −0.1; p-value 0.009) Figure 2b).
Figure 2:
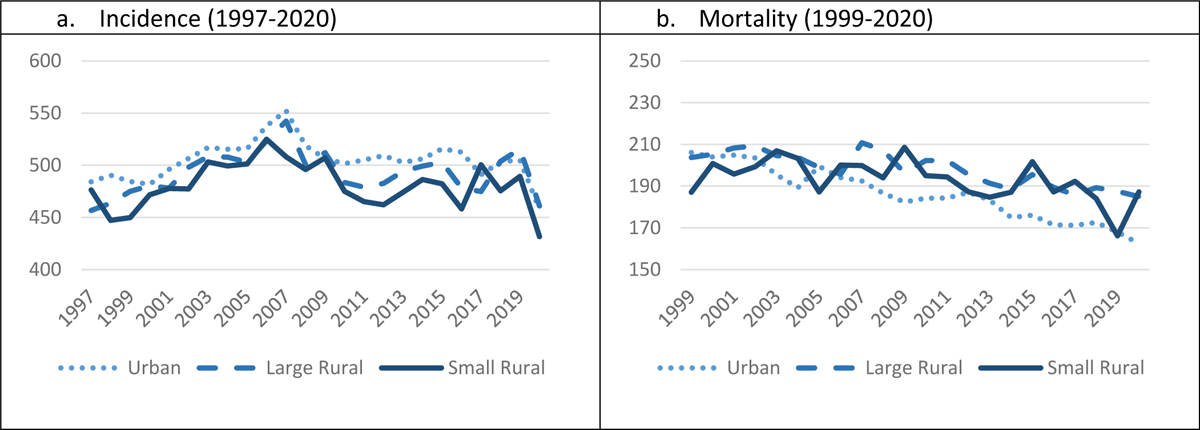
Age-adjusted incidence rates by urban, large rural, and small rural Oklahoma settings
Discussion
In Oklahoma, the age-adjusted all-cause cancer incidence rate was higher among the urban-dwelling population than among populations living in rural locations. This incidence rate was also higher in the population residing in large rural counties compared to small rural ones. This pattern held for most specific types of cancers, including cancers for which screening is effective (lung and bronchus, female breast, colorectal, and prostate). Conversely for mortality, the all-cause age-adjusted mortality rate was lower in urban Oklahoma than in rural Oklahoma. Within rural Oklahoma few differences in mortality were observed between large rural and small rural counties.
Findings from this study demonstrate the need to address the disparate overall cancer mortality rates for the rural population of Oklahoma. The state’s large rural and small rural populations each had higher mortality rates for ten of the top 15 cancers. In particular, the rural population experienced lower incidence rates and higher mortality rates among types of cancers that can be detected early through screening (e.g., female breast, lung and bronchus, prostate, colorectal). To improve cancer outcomes and mitigate disparities, one approach is to increase use of evidence-based cancer screenings. Compared to their national counterparts, both the rural and the urban populations of Oklahoma reported lower screening rates for cancer.28 Screening rates for female breast and colorectal cancer were especially low in the rural population of Oklahoma.28 For rural populations, barriers to accessing cancer screening include higher rates of poverty,15 lower levels of educational attainment,16 and lower rates of health insurance coverage.17 Transportation barriers for rural populations, including the need to travel long distances to receive screening tests also adversely impact rural screening rates.29,30 In Oklahoma, financial barriers to screening and treatment for many rural and urban residents were reduced in 2021 when voters passed Initiative 802 to expanded Medicaid coverage through the Affordable Care Act; although it is too soon to know if Medicaid expansion will help reduce the disparity in cancer mortality experienced by rural Oklahomans. Moreover, many rural residents in Oklahoma still face distance barriers to screening, diagnosis, and treatment, which have been exacerbated by a wave of rural hospital and clinic closures that have affected the state in recent years.31 To address distance barriers, mobile outreach to rural communities, such as is currently being conducted statewide for mammography, could be expanded to include additional evidence-based cancer prevention and screening services.
Furthermore, the rural-urban gap in cancer mortality can be explained at least in part by delays in diagnosis leading to late-stage presentation for some cancers (lung and bronchus). Reduced access to care and specialist services increases the risk of advanced or unknown stage at diagnosis.32 Financial concerns cause many individuals with symptoms to delay health care, which can be devastating in terms of cancer outcomes.33 Importantly, the aforementioned expansion of Medicaid coverage in Oklahoma for individuals between the ages of 19–64 through the Affordable Care Act will help reduce financial barriers to cancer-related care for many low-income individuals in the state, and particularly in rural areas where poverty rates are highest. Additionally, campaigns to increase public awareness of when to seek health care when specific-cancer related symptoms arise could be directed towards rural populations to reduce late or unknown stage at the time of initial diagnosis.
Efforts to improve the quality of cancer treatment in rural populations are warranted. For example, clinical trials advance cancer treatment and persons participating in clinical trials have been shown to receive high-quality care.34 Rural people are less likely to participate in clinical trials.35–38 This is why it is imperative that clinical trials enroll participants from diverse backgrounds, including those who live in rural areas. Funding for research should be directed in ways that ensure diversity among patients enrolled into cancer clinical trials. Reduce the burden of clinical trials and research particularly for those living in rural areas. One way to do accomplish greater clinical trials participation among cancer patients from rural locations would be to develop and support partnerships between academic centers with expertise in clinical trials research and community oncology practices.
One strength of this study is the source of data. The OCCR is a part of the National Program of Central Registries (NPCR) of the Centers for Disease Control and Prevention (CDC), which has been designated a high-quality database. Another strength of this study is that Oklahoma has a sizeable rural population in large rural (RUCC 4–6) and small rural (RUCC 7–9) locations, which enabled meaningful analysis of cancer rates in the rural setting. Although these data are of high quality, there are a few limitations. First, the RUCC are county based, which means the whole county is designed as a single RUCC when areas of the county may be another code according to a different classification systems. Oklahoma City, for example, has a large boundary that encompasses relatively rural areas within several counties that are classified as urban (RUCC 1–3). Second, RUCC codes created by the USDA have not been updated since 2013, so they may be outdated for locations experiencing rapid population growth.39 Third, in contrast to most cancer types that have percentages of missing data that are below 15%, the cancer staging data have high levels of missing data.
Conclusions
There is a complex pattern of cancer incidence, staging, and mortality affecting urban and rural populations in Oklahoma. Findings demonstrate the pressing need to improve the early detection of cancer, including through screening, among both the urban and rural populations of Oklahoma. Additionally, the disproportionately high mortality rates for most types of cancer experienced by the state’s large rural and small rural populations underscores the need to improve cancer detection and treatment for the residents of these locations.
Highlights.
Urban areas had a higher rates of female breast cancer cases compared to urban areas
Large and small rural areas had higher rates of lung cancer than urban areas
Urban residents were more likely to report private insurance compared to rural residents
Urban residents were less likely to report Medicare compared to rural residents
Urban areas have higher incidence rates than rural areas, but lower mortality rates
Funding:
Research is supported by National Institute of General Medical Sciences, Grant/Award Number: U5GM104938 awarded to the University of Oklahoma Health Sciences Center and the National Cancer Institute Cancer Center Support Grant P30CA225520 awarded to the University of Oklahoma Stephenson Cancer Center and used the Stephenson Cancer Center Biostatistics and Research Design Shared Resource. The content is solely the responsibility of the authors and does not necessarily represent the official views of the National Institutes of Health or the Stephenson Cancer Center.
Footnotes
Publisher's Disclaimer: This is a PDF file of an unedited manuscript that has been accepted for publication. As a service to our customers we are providing this early version of the manuscript. The manuscript will undergo copyediting, typesetting, and review of the resulting proof before it is published in its final form. Please note that during the production process errors may be discovered which could affect the content, and all legal disclaimers that apply to the journal pertain.
Declaration of interests
The authors declare that they have no known competing financial interests or personal relationships that could have appeared to influence the work reported in this paper.
Consent to Participate: This was a secondary data analysis of de-identified online surveillance data. Therefore, informed consent was deemed unnecessary.
Availability of data and material (data transparency):
Data are available from the Oklahoma Statistics on Health Available for Everyone (OK2SHARE) and are publicly available.
References:
- 1.Charlton M, Schlichting J, Chioreso C, Ward M, Vikas P. Challenges of Rural Cancer Care in the United States. Oncology (Williston Park). Sep 2015;29(9):633–40. [PubMed] [Google Scholar]
- 2.Levit LA, Byatt L, Lyss AP, et al. Closing the Rural Cancer Care Gap: Three Institutional Approaches. JCO Oncol Pract Jul 2020;16(7):422–430. doi: 10.1200/OP.20.00174 [DOI] [PubMed] [Google Scholar]
- 3.Modesitt SC, Huang B, Shelton BJ, Wyatt S. Endometrial cancer in Kentucky: the impact of age, smoking status, and rural residence. Gynecol Oncol. Oct 2006;103(1):300–6. doi: 10.1016/j.ygyno.2006.03.009 [DOI] [PubMed] [Google Scholar]
- 4.Meilleur A, Subramanian SV, Plascak JJ, Fisher JL, Paskett ED, Lamont EB. Rural residence and cancer outcomes in the United States: issues and challenges. Cancer Epidemiol Biomarkers Prev. Oct 2013;22(10):1657–67. doi: 10.1158/1055-9965.EPI-13-0404 [DOI] [PMC free article] [PubMed] [Google Scholar]
- 5.Rogers CR, Blackburn BE, Huntington M, et al. Rural-urban disparities in colorectal cancer survival and risk among men in Utah: a statewide population-based study. Cancer causes & control : CCC. Mar 2020;31(3):241–253. doi: 10.1007/s10552-020-01268-2 [DOI] [PMC free article] [PubMed] [Google Scholar]
- 6.Yao N, Alcala HE, Anderson R, Balkrishnan R. Cancer Disparities in Rural Appalachia: Incidence, Early Detection, and Survivorship. J Rural Health. Sep 2017;33(4):375–381. doi: 10.1111/jrh.12213 [DOI] [PubMed] [Google Scholar]
- 7.Moy E, Garcia MC, Bastian B, et al. Leading Causes of Death in Nonmetropolitan and Metropolitan Areas- United States, 1999–2014. MMWR Surveill Summ. Jan 13 2017;66(1):1–8. doi: 10.15585/mmwr.ss6601a1 [DOI] [PMC free article] [PubMed] [Google Scholar]
- 8.Henley SJ, Anderson RN, Thomas CC, Massetti GM, Peaker B, Richardson LC. Invasive Cancer Incidence, 2004–2013, and Deaths, 2006–2015, in Nonmetropolitan and Metropolitan Counties - United States. MMWR Surveill Summ. Jul 7 2017;66(14):1–13. doi: 10.15585/mmwr.ss6614a1 [DOI] [PMC free article] [PubMed] [Google Scholar]
- 9.Cosby AG, McDoom-Echebiri MM, James W, Khandekar H, Brown W, Hanna HL. Growth and Persistence of Place-Based Mortality in the United States: The Rural Mortality Penalty. Am J Public Health. Jan 2019;109(1):155–162. doi: 10.2105/AJPH.2018.304787 [DOI] [PMC free article] [PubMed] [Google Scholar]
- 10.Blake KD, Moss JL, Gaysynsky A, Srinivasan S, Croyle RT. Making the Case for Investment in Rural Cancer Control: An Analysis of Rural Cancer Incidence, Mortality, and Funding TrendsMaking the Case for Investment in Rural Cancer Control. Cancer Epidemiology, Biomarkers & Prevention. 2017;26(7):992–997. [DOI] [PMC free article] [PubMed] [Google Scholar]
- 11.Zahnd WE, James AS, Jenkins WD, et al. Rural-Urban Differences in Cancer Incidence and Trends in the United States. Cancer Epidemiol Biomarkers Prev. Nov 2018;27(11):1265–1274. doi: 10.1158/1055-9965.EPI-17-0430 [DOI] [PMC free article] [PubMed] [Google Scholar]
- 12.Wingo PA, Tucker TC, Jamison PM, et al. Cancer in Appalachia, 2001–2003. Cancer. Jan 1 2008;112(1):181–92. doi: 10.1002/cncr.23132 [DOI] [PubMed] [Google Scholar]
- 13.Fowler B, Samadder NJ, Kepka D, Ding Q, Pappas L, Kirchhoff AC. Improvements in Colorectal Cancer Incidence Not Experienced by Nonmetropolitan Women: A Population-Based Study From Utah. J Rural Health. Mar 2018;34(2):155–161. doi: 10.1111/jrh.12242 [DOI] [PMC free article] [PubMed] [Google Scholar]
- 14.Hashibe M, Kirchhoff AC, Kepka D, et al. Disparities in cancer survival and incidence by metropolitan versus rural residence in Utah. Cancer Med. Apr 2018;7(4):1490–1497. doi: 10.1002/cam4.1382 [DOI] [PMC free article] [PubMed] [Google Scholar]
- 15.Dobis EA, Krumel T, Cromartie J, Conley KL, Sanders A, Ortiz R. Rural America at a glance: 2021 edition. 2021;
- 16.Cohen AK, Syme SL. Education: a missed opportunity for public health intervention. Am J Public Health. Jun 2013;103(6):997–1001. doi: 10.2105/AJPH.2012.300993 [DOI] [PMC free article] [PubMed] [Google Scholar]
- 17.Gong G, Phillips SG, Hudson C, Curti D, Philips BU. Higher US Rural Mortality Rates Linked To Socioeconomic Status, Physician Shortages, And Lack Of Health Insurance. Health Aff (Millwood). Dec 2019;38(12):2003–2010. doi: 10.1377/hlthaff.2019.00722 [DOI] [PubMed] [Google Scholar]
- 18.Doogan NJ, Roberts ME, Wewers ME, et al. A growing geographic disparity: Rural and urban cigarette smoking trends in the United States. Prev Med. Nov 2017;104:79–85. doi: 10.1016/j.ypmed.2017.03.011 [DOI] [PMC free article] [PubMed] [Google Scholar]
- 19.Lundeen EA, Park S, Pan L, O’Toole T, Matthews K, Blanck HM. Obesity prevalence among adults living in metropolitan and nonmetropolitan counties—United States, 2016. Morbidity and Mortality Weekly Report. 2018;67(23):653. [DOI] [PMC free article] [PubMed] [Google Scholar]
- 20.Shih YT, Kim B, Halpern MT. State of Physician and Pharmacist Oncology Workforce in the United States in 2019. JCO Oncol Pract. Jan 2021;17(1):e1–e10. doi: 10.1200/OP.20.00600 [DOI] [PMC free article] [PubMed] [Google Scholar]
- 21.Lam O, Broderick B, Toor S. How far Americans live from the closest hospital differs by community type. 2018; [Google Scholar]
- 22.US Census Bureau. American FactFinder2. Accessed 05/15/2023. http://factfinder2.census.gov/
- 23.Prevention CfDCa. Behavioral risk Factor Surviellance System Survey Data. 05/15/2023, 2023. https://www.cdc.gov/brfss/data_tools.htm
- 24.American Society of Clinical Oncology. Key Trends in Tracking Supply of and Demand for Oncologists. 2018. https://old-prod.asco.org/sites/new-www.asco.org/files/content-files/practice-and-guidelines/documents/2018-ASCO-Workforce-Information-System.pdf
- 25.Center for Disease Control and Prevention. CDC Wonder. Center for Disease Control and Prevention. Accessed March 1, 2022. https://wonder.cdc.gov/
- 26.Economic Research Service U.S. Department of Agriculture. Rural-Urban Continuum Codes. USDA. Accessed 06/05/2023, 2023. https://www.ers.usda.gov/data-products/rural-urban-continuum-codes/ [Google Scholar]
- 27.Joinpoint Regression Program, Version 4.9.1.0. Version 4.9.1.0. 2022. Accessed May 10 2022. https://surveillance.cancer.gov/help/joinpoint
- 28.Sambo A, Campbell J, Hunsucker L, Pharr S, Doescher M. Cancer in Rural Oklahoma. Vol. 2. 2022. Cancer in Oklahoma Data Brief Series. Accessed 07/31/2023.
- 29.Shete S, Deng YY, Shannon J, et al. Differences in Breast and Colorectal Cancer Screening Adherence Among Women Residing in Urban and Rural Communities in the United States. Jama Network Open. Oct 4 2021;4(10):e2128000–e2128000. doi:ARTN e2128000 10.1001/jamanetworkopen.2021.28000 [DOI] [PMC free article] [PubMed] [Google Scholar]
- 30.Chandak A, Nayar P, Lin G. Rural-Urban Disparities in Access to Breast Cancer Screening: A Spatial Clustering Analysis. J Rural Health. Mar 2019;35(2):229–235. doi: 10.1111/jrh.12308 [DOI] [PubMed] [Google Scholar]
- 31.McCarthy S, Moore D, Smedley WA, et al. Impact of Rural Hospital Closures on Health-Care Access. J Surg Res. Feb 2021;258:170–178. doi: 10.1016/j.jss.2020.08.055 [DOI] [PubMed] [Google Scholar]
- 32.Tracey E, McCaughan B, Badgery-Parker T, Young J, Armstrong B. Distance from accessible specialist care and other determinants of advanced or unknown stage at diagnosis of people with non-small cell lung cancer: A data linkage study. Lung Cancer. Oct 2015;90(1):15–21. doi: 10.1016/j.lungcan.2015.07.018 [DOI] [PubMed] [Google Scholar]
- 33.Thibodeau S, Jalink M, Paulin G. Mortality due to cancer treatment delay: A systematic review and meta-analysis. 2020; [DOI] [PMC free article] [PubMed]
- 34.Weber JS, Levit LA, Adamson PC, et al. Reaffirming and Clarifying the American Society of Clinical Oncology’s Policy Statement on the Critical Role of Phase I Trials in Cancer Research and Treatment. J Clin Oncol. Jan 10 2017;35(2):139–140. doi: 10.1200/JCO.2016.70.4692 [DOI] [PMC free article] [PubMed] [Google Scholar]
- 35.Davis TC, Arnold CL, Mills G, Miele L. A Qualitative Study Exploring Barriers and Facilitators of Enrolling Underrepresented Populations in Clinical Trials and Biobanking. Front Cell Dev Biol. 2019;7:74. doi: 10.3389/fcell.2019.00074 [DOI] [PMC free article] [PubMed] [Google Scholar]
- 36.Unger JM, Vaidya R, Hershman DL, Minasian LM, Fleury ME. Systematic Review and Meta-Analysis of the Magnitude of Structural, Clinical, and Physician and Patient Barriers to Cancer Clinical Trial Participation. J Natl Cancer Inst. Mar 1 2019;111(3):245–255. doi: 10.1093/jnci/djy221 [DOI] [PMC free article] [PubMed] [Google Scholar]
- 37.Yabroff KR, Han X, Zhao J, Nogueira L, Jemal A. Rural cancer disparities in the United States: a multilevel framework to improve access to care and patient outcomes. American Society of Clinical Oncology; 2020. [DOI] [PubMed] [Google Scholar]
- 38.Marrie RA, Chataway J, Bierer BE, et al. Enhancing diversity of clinical trial populations in multiple sclerosis. Mult Scler. Aug 2023;29(9):1174–1185. doi: 10.1177/13524585231189677 [DOI] [PMC free article] [PubMed] [Google Scholar]
- 39.U.S. Department of Agriculture, Economic Research Service. Degree of rurality influences recent U.S. county population growth and decline. Accessed 08/14, 2023. https://www.ers.usda.gov/data-products/chart-gallery/gallery/chart-detail/?chartId=78136
Associated Data
This section collects any data citations, data availability statements, or supplementary materials included in this article.
Data Availability Statement
Data are available from the Oklahoma Statistics on Health Available for Everyone (OK2SHARE) and are publicly available.