

Abstract
Background:
Urban green spaces have been consistently shown to have important human health benefits across a range of outcomes. These benefits are thought to be achieved, in part, because urban greenness provides opportunities for participation in recreational activity. However, the findings from studies that have assessed links between exposure to greenness and physical activity have been mixed. To date, few studies have examined association between greenness and specific types of recreational physical activities.
Objective:
We evaluated associations between measures of greenness and specific types of recreational physical activities. Moreover, we explored the extent to which these associations were modified by socioeconomic conditions, and regionally.
Methods:
We analyzed cross-sectional data from 49,649 women in the Sister Study and assigned three residentially-based measures of greenness based on national land cover data at buffer distances of 250 m and 500 m. Data on participation in up to ten specific recreational physical activities, including time spent in each activity were collected. Logistic regression was used to estimate odds ratios (OR) and their 95% confidence intervals (CI) controlling for confounders.
Results:
Compared to those in the lowest tertile of greenness, participants in the upper tertile of greenness within a 500 m buffer, were more likely to garden (OR = 1.46, 95% CI = 1.25,1.69), participate in sports (OR = 1.28, 95% CI = 1.19,1.38), run (OR = 1.15, 95% CI = 1.04,1.27), walk (OR = 1.11, 95% CI = 1.06,1.16), and engage in conditioning exercises (OR = 1.10, 95% CI = 1.05,1.16) at least once a week for at least one month over the past year. These associations were modified by household income and US region.
Discussion:
Our findings suggest a beneficial effect of greenness on physical activity and provide additional information to inform planning of green environments that contribute to better health and wellbeing.
Keywords: Greenness, Physical Activity, Exercise, Cross-sectional study, Effect modifier, Epidemiologic
Graphical Abstract

1. Introduction
Exposure and access to greenness (i.e., parks, green spaces, nature) likely improves physical and mental health.1,2 The beneficial effects of exposure to greenness have been reported for a variety of human health outcomes including all-cause and stroke-specific mortality, cardiovascular disease morbidity, cardiometabolic factors, mental health, low birth weight, sleep quality, cognitive function and brain activity, and physical activity.2–6 In contrast, inconsistent associations have been reported with cancer.2,7
Greenness exposure is thought to benefit human health through a variety of pathways including reducing harm from environmental exposures (i.e., mitigating air pollution, noise, and heat exposure), restorative capacities (i.e., stress recovery) and building capacities (i.e., increasing social contact and promoting physical activity).5,8,9 Among the multiple pathways connecting greenness and health outcomes, the role of physical activity has been reported as a key mediator for mental and physical health outcomes.10–12 For instance, Villeneuve et al.13, reported that physical activity attenuated the association between greenness and obesity by 32% in a cross-sectional analysis of women enrolled in the US Sister Study. Similarly, in a study of the association between proximity to greenness and depressive symptoms among pregnant women, the mediating effect of physical activity explained from 5.6% (within 500m buffer) to 7.8% (within 100 m buffer) of the total protective effect of greenness.14 While there are several plausible pathways whereby exposure to greenness may improves health15, because increased participation in physical activity has been linked to obesity and several chronic disease outcomes, it represents a critical pathway for investigation.
Studies reporting the relationship between greenness exposure and physical activity have reported mostly positive associations with some contradictory findings.1,3,16 Residential greenness based on 250 m and 500 m buffers was positively associated with an increased number of metabolic equivalent (MET) hours per week of self-reported physical activity in a cohort of US women.13 Similarly, a study conducted in working female adults in US reported an association between higher activity space greenness and greater number of steps per week using accelerometer-based measurements.17 Positive associations have been also reported for Hispanic/Latino adults living in US.18 An US study using objective measures of physical activity and geographic position have reported that momentary contact with green space was associated with increased physical activity in children.19 In Canada, using a national representative sample, McMorris et al.20, found that participants that live in the highest quintile of greenness based on a 500 m buffer, were 34% more likely to participate in leisure-time physical activity. Similarly, in a longitudinal study of adults aged 45 and older, those living in greener neighborhoods reported higher amounts of physical activity.21 Furthermore, a systematic review of studies among Canadian adults with low-socioeconomic status also reported consistent positive associations.22 In a cohort of Finnish ageing workers, the higher level of neighborhood greenness was associated with higher level of total physical activity.23 Another Finnish study using objective metrics of greenness and accelerometers also found positive associations with light physical activity in men and women but did not find associations with moderate to vigorous physical activity in women.24
Even though the literature generally shows that those who reside in greener neighborhoods are more physically active, some studies have reported negative or no associations. For example, a cross-sectional study in adults living in Catalonia, Spain, reported no association between greenness within 300 m and physical activity, despite evidence that exposure to greener spaces was associated with better self-perceived general health.25 Similarly, a study conducted in late middle-aged adults in Belgium reported that the amount of time spent in non-green areas was associated with more moderate-to-vigorous physical activity in men but less for females.26 A population-based cohort in Stockholm that sought to evaluate whether moving to an areas with different greenness was related to changes in physical activity found that participants moving to greener areas were 42% more likely to decrease their levels of walking/cycling.27 In college students from Austria, Loder et al.28, reported no associations between perceived greenness at home or university and physical activity. Similarly, a study conducted in adult civil servants at university campuses in Rio de Janeiro, Brazil, did not find associations between two different greenness exposure metrics and non-work physical activity.29 These contradictory findings suggest that geographical and sociodemographic conditions might modify the association between greenness and physical activity and that the associations might also differ by the specific type of physical activity, age, and gender.
To date, most studies assessing the association between greenness and physical activity have used summary measures of physical activity, with few examining associations with specific recreational physical activities such as walking, cycling, running, and exercise.17,27,30–32 It is likely that the presence of green spaces differentially impacts participation in some outdoor recreational activities relative to activities done indoors, or during winter. Previous systematic reviews on this topic have identified research gaps including the need for the identification of the adequate buffer distance metric, relevant greenness exposure, and the exploration of associations with specific physical activities and other potential mediators and effect modifiers of the greenness-health association.1,5 Addressing these research gaps will provide evidence based findings to inform policy-makers on how green environments might be used/intervened to increase participation in specific physical activities which encompass overall health benefits.
In this study, we evaluated the association between residentially-based measures of greenness and specific types of recreational physical activities in a cross-sectional analysis of approximately fifty thousand women enrolled in the US wide Sister Study. Further, we explored potential effect-measure modification by sociodemographic and geographical conditions such as area of residence (rural/urban), age, income, and region.
2. Materials and Methods
2.1. Study population
The study population for this national analysis consisted of participants in the US Sister Study, a prospective cohort study of 50,884 women focused on the evaluation of environmental, lifestyle and genetic risk factors for breast cancer. The methods and participant characteristics of the Sister Study have been described elsewhere.33 Women who were between 35-74 years of age at enrollment were eligible to participate in this study if they had a sister with breast cancer and no previous breast cancer diagnosis themselves. Women residing in the US (including Puerto Rico) were recruited between 2003 and 2009. At baseline, all participants completed a computer-assisted telephone interview which collected information on demographic and reproductive characteristics, medical history, residential history, environmental exposures, and lifestyle factors, including physical activity. All 53,374 addresses in the residential history of participants were geocoded using exact address (95%), the nearest intersection (4.6%) or zip code (0.4%) using ArcGIS software ®. We restricted our study population to those who were living in the contiguous US and selected one residential address per participant, using the address reported as main place of residence (n = 49,649). Participants reported if their residences were located within an urban, suburban, small town or rural area (area of residence), and by linking geolocation with census data we obtained the census region, division, and census tract population size for each participant.34
All participants provide written informed consent. The study was approved by the National Institute of Environmental Health Sciences, National Institute of Health, and the Copernicus Group Institutional Review Boards (protocol number 02-E-N271).
2.2. Greenness exposure measurement
We used the US National Land Cover Database (NLCD) to assign residential measures of greenness for the primary residential addresses for all participants. We obtained land cover data from the Multi-Resolution Land Characteristics Consortium for 2006 and 2011 at a resolution of 30 m using the NLCD 20-class land-cover classification that was defined using a decision-tree method based on Landsat satellite data between 2006 and 2011.35,36 The were no size constraints for land cover parcels to be included and these data did not included information on public access to green spaces. The greenness metrics we used have previously been described 13. Briefly, we created three types of greenness exposure based on land cover classes: 1) Green1 (G1) that includes the forest, shrubland, and herbaceous land covers; 2) Green2 (G2) that includes classes within G1 as well as developed open spaces which are areas with a mixture of some constructed materials, but mostly vegetation in the form of lawn grasses with less than 20% of land cover corresponding to impervious surfaces; and 3) Impervious surfaces which are mainly artificial structures such as pavements (i.e., roads, sidewalks, driveways and parking lots) that are covered by impenetrable materials (i.e., asphalt, concrete, brick, stone, rooftops). For each participant’s residential addresses, we estimated the percentage of the area described by these three greenness exposure metrics across six different buffer categories between 30 m and 2000 m. For the purpose of this study, we focused on buffer distances of 250 m and 500 m which correspond to an approximate 10–15-minute walking distance around residential addresses representing a proximal space that could be used for recreational physical activities. These buffer distances where chosen to facilitate comparison with previous studies.13,20,31
2.3. Physical activity assessment
Self-reported details about participation in recreational physical activities were collected at baseline from all participants. Participants could report up to ten specific sport/exercise recreational activities they participated in for at least once per week for at least one month during the past 12 months. As described in previous reports13,37, for each specific recreational physical activity reported, women were asked to report the number of months they did the activity, the number of days per week during those months, and the amount of time (minutes) spent on average each day that they did the activity. This information was used to estimate the total of hours/week per specific recreational physical activity and the total average hours/week for all activities combined over the past 12 months. We also calculated the percentage of time spent doing each specific activity. For the purpose of this study, these calculations did not include the time spent on daily life physical activities (i.e., walking to work or while shopping, home chores).
The self-reported specific list of recreational physical activities was categorized using the heading dictionary of the Compendium of Physical Activities Tracking Guide.38 We also calculated MET (metabolic equivalent) hours per week as an alternative metric of physical activity that incorporates information on the intensity and duration of the activity. One MET-activity represents the resting metabolic rate when sitting quietly and an activity with MET value of 4 represents that it requires four times the energy expenditure as the resting metabolic rate.38 For each specific activity, we used the MET values provided by the Compendium to derive the METs-hour per week for each participant.
2.4. Other covariates
The interview questionnaire at baseline included items for a number of factors that could confound or modify the association between greenness and recreational physical activities. For the purpose of this study, we extracted from the baseline questionnaire data related to age, marital status, ethnicity, and household income per capita.
2.5. Statistical analysis
We described the characteristics of the study population across categories of greenness and impervious surfaces using tertiles of exposure. Odds ratios (OR) and 95% confidence intervals (CI) for performing (Yes-No) specific recreational physical activities were determined using multivariable logistic regression. We classified the measures of greenness and impervious surfaces into tertiles, and the lowest tertile was used as the reference category for each exposure metric. Cut-points for tertiles at 500 m buffer were 1.031 and 18.33 for Green 1 (G1), 19.5 and 46.9 for Green 2 (G2) and 14.3 and 32.64 for impervious surfaces. We ran independent models for each specific recreational physical activity. All models were adjusted for potential confounders of the association between greenness and physical activity including age, ethnicity, household income per capita, and marital status. We also adjust the models for the census division to account for spatial clustering. We conducted an additional analysis classifying the participants as being physically active in each specific recreational activity if they had expended at least 8.33 MET-hours/week doing the activity which correspond to the minimum level of the recommendation of physical activity for Americans.39
To assess whether the association between greenness and participation in physical activities was modified by other factors, we performed stratified analyses by area of residence, age groups, income, census region, and size of census tract population. To formally test for these interaction effects, we included first order interaction terms in the main models and used the Wald test to assess statistical significance (p-value <0.05). For these analyses we estimated the odds ratios for two area of residence categories (urban/suburban and small town/rural areas), four age-groups (35,<45, 45,<55, 55,<65, 65 or more years of age), four income categories (<$15,000, $15,000,<$37,500, $37,500,<$50,000, and $50,000 or more annual income), four census regions (Northeast, Midwest, South, and West), and three census tract population categories (<4162, 4162,6006, and >6006). Data were analyzed using SAS 9.4 (SAS Institute, 2020).
3. Results
The demographic characteristics of the participants at baseline, along with the mean percentage of greenness and impervious areas within a 250 m buffer from the residential address are presented in Table 1. The spatial distribution of the residential addresses of participants and the mean distribution of greenness and impervious areas within a 500 m buffer have been reported previously.13 The distribution of the mean percentage of greenness (G1 and G2) within 250 m and 500 m buffer was similar across age, body mass index, income, and smoking status categories. In contrast, there were notable differences by ethnicity, marital status, BMI, and residency type. Participants who were Black or Hispanic, never married or divorced/separated, with BMI of 35 or higher, and those living in urban/suburban areas tended to live in less green areas when compared to participants who were White, married, with BMI less than 25, and those living in small towns or rural areas, respectively. The mean percentage of greenness within 250 m buffer was 15.8% lower for residents in urban/suburban areas compared to rural/small town areas. Other notable differences in mean percentage of greenness were observed across ethnicity (difference of 12.7% between White and Hispanic participants) and marital status (difference of 12.5% between married and never married). There was a positive gradient in the mean percentage of greenness (G2) across categories of total hours and the total MET-hours of recreational physical activity per week.
Table 1.
Mean percentage of greenness and impervious area across selected characteristics based on 250m buffer from the place of residence among Sister Study participants at baseline.
| Characteristic | N | % | Greenness* | Impervious (%) |
||
|---|---|---|---|---|---|---|
| G1 (%) | G2 (%) | |||||
| Age (years) | 35-44 | 6425 | 12.9 | 13.8 | 33.3 | 27.8 |
| 45-54 | 17,081 | 34.4 | 15.3 | 35.2 | 26.6 | |
| 55-64 | 17,445 | 35.1 | 16.1 | 36.4 | 26.1 | |
| 65-74 | 8698 | 17.5 | 14.9 | 35.1 | 27.6 | |
| Ethnicity | White | 42,259 | 85.13 | 16.0 | 36.3 | 25.6 |
| Black | 4454 | 9.0 | 10.5 | 30.7 | 32.8 | |
| Hispanic | 1634 | 3.3 | 8.9 | 23.6 | 38.5 | |
| Other | 1292 | 2.6 | 17.2 | 36.2 | 27.0 | |
| Marital Status | Married | 37,157 | 74.8 | 16.9 | 37.6 | 24.4 |
| Never Married | 2671 | 5.4 | 8.6 | 25.1 | 37.8 | |
| Divorced/Separated | 7320 | 14.8 | 10.5 | 28.7 | 33.4 | |
| Widowed | 2491 | 5.0 | 13.1 | 32.3 | 29.3 | |
| Income | < $15,000 | 4822 | 9.7 | 14.9 | 34.1 | 27.6 |
| $15,000- <$37,500 | 16,981 | 34.2 | 14.6 | 33.3 | 27.6 | |
| $37,500- <50,000 | 13,049 | 26.3 | 16.9 | 37.1 | 24.6 | |
| ≥50,000 | 14,797 | 29.8 | 14.9 | 36.5 | 27.3 | |
| Total hours of recreational physical activity | <0.562 | 12,155 | 25.0 | 15.3 | 34.4 | 26.7 |
| 0.562- <2.044 | 12,687 | 25.0 | 15.0 | 34.8 | 26.6 | |
| 2.044- <4.080 | 12,373 | 25.0 | 15.0 | 35.4 | 26.8 | |
| ≥4.080 | 12,434 | 25.0 | 16.0 | 36.6 | 26.7 | |
| <2.248 | 12,293 | 25.0 | 15.3 | 34.5 | 26.8 | |
| Total MET hours recreational physical activity | 2.248- <8.993 | 12,119 | 25.0 | 15.0 | 34.9 | 26.6 |
| 8.993- <19.952 | 12,824 | 25.0 | 15.1 | 35.5 | 26.7 | |
| ≥19.952 | 12,413 | 25.0 | 15.9 | 36.5 | 26.7 | |
| Residence area | Urban/Suburban | 28,794 | 58.1 | 8.5 | 28.8 | 33.7 |
| Rural/Small town | 20,625 | 41.6 | 24.9 | 44.6 | 16.8 | |
| Other | 142 | 0.3 | 10.9 | 26.0 | 35.5 | |
Where G1 represents forest, shrubland and herbaceous land characteristics and G2 represents forest, shrubland and herbaceous land characteristics and developed open spaces.
Among all participants, 83.5% reported participating in at least one recreational physical activity at least once a week for at least one month during the past 12 months. Walking (65.1%) and practicing any kind of conditioning exercises (i.e., yoga, pilates) (40.7%) were the most common specific recreational physical activities. The distribution of recreational physical activities across tertiles of residential greenness (G2) based on a 500m buffer is presented in Figure 1. There was a positive gradient in these percentages across tertiles of residential greenness for specific physical activities such as walking, conditioning exercises, sports, running, gardening, and winter activities. In contrast, a negative gradient was observed for mean percentage of bicycling across tertiles of greenness. Supplemental Figure A1 shows a similar distribution of specific recreational physical activities based on a 250 m buffer.
Figure 1.

Distribution of participation in recreational physical activities responses over the past year across tertiles of greenness based on a 500m buffer from the place of residence among Sister Study participants at baseline. Note: Data labels shown for upper tertile category.
The average total hours per week spent on the most commonly reported recreational physical activities across tertiles of greenness and impervious areas are presented in Table 2. Participants who lived in greener areas including open spaces (G2) tended to spend more time in recreational physical activities such as walking, conditioning exercises, sports, running, and gardening. In contrast, participants who lived in areas with more impervious areas tended to spend less time in these activities but more time bicycling and doing water activities (i.e., swimming). The greatest difference between the upper and lower tertile of greenness was observed for practicing sports (0.09 hours/week). Supplemental Tables A1 and A2 show similar findings when considering the total weekly number of MET-hours and the proportion of time spent in specific recreational physical activities across tertiles of greenness and impervious areas.
Table 2.
Average total hours per week spent on main recreational physical activities over the past year across tertiles of greenness and impervious area based on a 500 m buffer from the place of residence among Sister Study participants at baseline
| Physical activities | Tertiles * | Mean hours per week |
||
|---|---|---|---|---|
| Greenness* | Impervious | |||
|
| ||||
| G1 | G2 | |||
| Walking | Lowest | 1.35 | 1.35 | 1.33 |
| Middle | 1.37 | 1.35 | 1.38 | |
| Upper | 1.36 | 1.38 | 1.37 | |
| Conditioning exercise | Lowest | 0.74 | 0.73 | 0.68 |
| Middle | 0.75 | 0.73 | 0.78 | |
| Upper | 0.72 | 0.76 | 0.75 | |
| Sports | Lowest | 0.20 | 0.16 | 0.24 |
| Middle | 0.20 | 0.22 | 0.23 | |
| Upper | 0.23 | 0.25 | 0.16 | |
| Dancing | Lowest | 0.14 | 0.13 | 0.13 |
| Middle | 0.14 | 0.14 | 0.14 | |
| Upper | 0.13 | 0.14 | 0.14 | |
| Bicycling | Lowest | 0.10 | 0.10 | 0.07 |
| Middle | 0.08 | 0.08 | 0.08 | |
| Upper | 0.71 | 0.07 | 0.10 | |
| Water activities | Lowest | 0.09 | 0.09 | 0.07 |
| Middle | 0.07 | 0.07 | 0.08 | |
| Upper | 0.07 | 0.08 | 0.09 | |
| Running | Lowest | 0.10 | 0.10 | 0.11 |
| Middle | 0.11 | 0.11 | 0.12 | |
| Upper | 0.12 | 0.13 | 0.11 | |
| Gardening | Lowest | 0.04 | 0.04 | 0.07 |
| Middle | 0.04 | 0.05 | 0.04 | |
| Upper | 0.07 | 0.06 | 0.05 | |
Where G1 represents forest, shrubland and herbaceous land characteristics and G2 represents forest, shrubland and herbaceous land characteristics and developed open spaces
The odds ratios for the association between tertiles of greenness including developed open spaces (G2) and the practice of specific recreational physical activities are presented in Figure 2. Participant women with residential addresses in the upper tertile of greenness within a 500 m buffer were most likely to garden (OR = 1.46, 95% CI = 1.25,1.69), participate in sports (OR = 1.28, 95% CI = 1.19,1.38), run (OR = 1.15, 95% CI = 1.04,1.27), walk (OR = 1.11, 95% CI = 1.06,1.16), or engage in conditioning exercises (OR = 1.10, 95% CI = 1.05,1.16) at least once a week for at least one month over the past year compared to those in the lowest tertile of greenness. An inverse association with greenness tertiles was observed for bicycling (OR = 0.79, 95% CI = 0.73,0.87). Supplemental Figure A2 shows similar results describing the OR of being active for specific recreational physical activities (≥8,33 MET-Hours per week) across tertiles of greenness (G2) based on a 500 m buffer.
Figure 2.
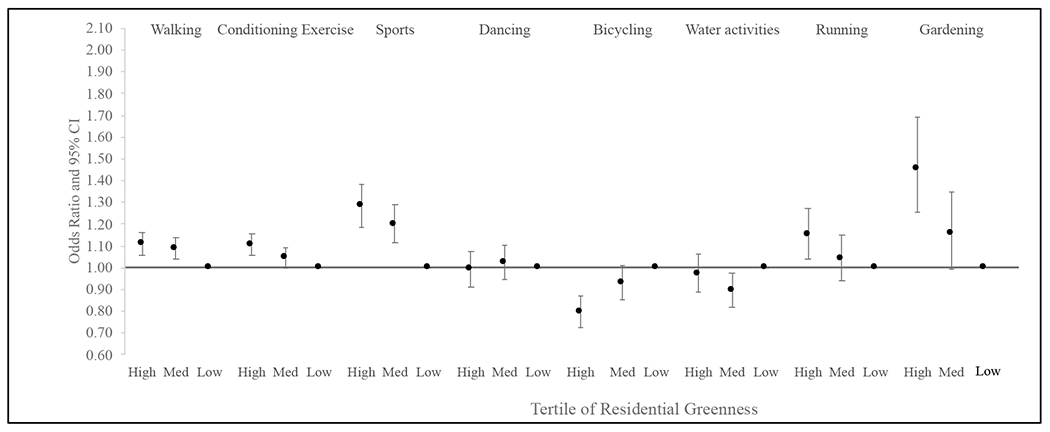
Odds ratios* (OR) of practicing specific physical activities by tertiles of residential greenness based on 500 m buffers among Sister Study participants at baseline
*Those who report practicing each physical activity (Yes - 1, No - 0). Odds ratio estimated for greenness metric based on forest, shrubland and herbaceous land characteristics and developed open spaces (G2) and adjusted for age, ethnicity, marital status, and census division.
The findings from the stratified analysis, by area of residency are presented in Table 3. When comparing the upper and lower tertiles of greenness including open spaces (G2), there were similar odds of gardening across rural and urban areas but higher odds of practicing sports, running, walking, and doing conditioning exercises in urban areas. Those who resided in the upper tertile of greenness in urban/suburban areas had 42% higher odds of practicing sports comparing to the lower tertile (G2 OR = 1.42, 95% CI = 1.28,1.57) while for those in the upper tertile of greenness in the small town/rural areas the odds are 22% higher (G2 OR = 1.22, 95% CI = 1.08,1.39). The inverse association between greenness tertiles and bicycling was similar in rural and urban areas. The interaction between greenness (G2) and area of residency, however, were not statistically significant for any specific physical activitiy.
Table 3.
Odds ratiosa (OR) of practicing main recreational physical activities based on selected land characteristics based on a 500 m buffer among Sister Study participants by area of residency at baseline
| Land cover characteristic |
Walking OR (95% CI) |
Exerciseb OR (95% CI) |
Sports OR (95% CI) |
Bicycling OR (95% CI) |
Running OR (95% CI) |
Gardening OR (95% CI) |
|---|---|---|---|---|---|---|
| Urban / Suburban areas | ||||||
|
| ||||||
| G1 | ||||||
| Lowest tertile | 1.0 | 1.0 | 1.0 | 1.0 | 1.0 | 1.0 |
| Middle tertile | 1.12 (1.06,1.18) | 1.07 (1.02,1.13) | 1.04 (0.95,1.13) | 0.85 (0.77,0.95) | 1.01 (0.90,1.13) | 1.15 (0.95,1.40) |
| Upper tertile G2 | 1.04 (0.98,1.11) | 1.13 (1.06,1.20) | 1.24 (1.12,1.37) | 0.73 (0.65,0.83) | 1.084 (0.95,1.23)) | 1.33 (1.07,1.65) |
| Lowest tertile | 1.0 | 1.0 | 1.0 | 1.0 | 1.0 | 1.0 |
| Middle tertile | 1.10 (1.04,1.17) | 1.06 (1.00,1.12) | 1.23 (1.12,1.35) | 0.97 (0.87,1.08) | 1.04 (0.92,1.17) | 1.11 (0.91,1.36) |
| Upper tertile Impervious | 1.14 (1.07,1.22) | 1.22 (1.14,1.30) | 1.42 (1.28,1.57) | 0.78 (0.68,0.88) | 1.26 (1.10,1.43) | 1.33 (1.07,1.66) |
| Lowest tertile | 1.0 | 1.0 | 1.0 | 1.0 | 1.0 | 1.0 |
| Middle tertile | 0.98 (0.91,1.06) | 0.96 (0.89,1.03) | 0.86 (0.78,0.96) | 1.02 (0.89,1.18) | 0.88 (0.76,1.01) | 0.91 (0.71,1.16) |
| Upper tertile | 0.93 (0.86,1.00) | 0.84 (0.78,0.90) | 0.69 (0.61,0.77) | 1.05 (0.91,1.22) | 0.79 (0.68,0.92) | 0.79 (0.61,1.02) |
|
| ||||||
| Rural areas / Small towns | ||||||
|
| ||||||
| G1 | ||||||
| Lowest tertile | 1.0 | 1.0 | 1.0 | 1.0 | 1.0 | 1.0 |
| Middle tertile | 0.96 (0.88,1.05) | 1.05 (0.97,1.14) | 0.92 (0.80,1.05) | 0.74 (0.63,0.86) | 1.20 (0.97,1.49) | 1.01 (0.78,1.30) |
| Upper tertile | 0.99 (0.91,1.07) | 1.05 (0.97,1.13) | 0.95 (0.84,1.08) | 0.65 (0.57,0.75) | 1.36 (1.12,1.66) | 1.33 (1.06,1.67) |
| G2 | ||||||
| Lowest tertile | 1.0 | 1.0 | 1.0 | 1.0 | 1.0 | 1.0 |
| Middle tertile | 1.06 (0.98,1.15) | 1.10 (1.02,1.20) | 1.18 (1.04,1.35) | 0.86 (0.74,0.99) | 1.19 (0.97,1.44) | 1.08 (0.85,1.36) |
| Upper tertile | 1.09 (1.01,1.18) | 1.17 (1.08,1.26) | 1.22 (1.08,1.39) | 0.78 (0.68,0.90) | 1.32 (1.09,1.59) | 1.30 (1.04,1.62) |
| Impervious Lowest tertile | 1.0 | 1.0 | 1.0 | 1.0 | 1.0 | 1.0 |
| Middle tertile | 1.05 (0.98,1.12) | 1.14 (1.06,1.22) | 0.99 (0.89,1.10) | 1.19 (1.05,1.35) | 1.07 (0.91,1.24) | 0.70 (0.57,0.85) |
| Upper tertile | 1.01 (0.93,1.10) | 1.01 (0.93,1.10) | 0.93 (0.81,1.07) | 1.24 (1.06,1.45) | 0.88 (0.71,1.08) | 0.53 (0.40,0.69) |
Those who report practicing each physical activity (Yes , 1, No , 0). Odds ratio adjusted for age, ethnicity, marital status, population of census tract, and census area. n G1 lowest = 16598, Middle = 16521, Upper = 16528; G2 lowest = 16561, Middle = 16550, Upper = 16536; impervious lowest = 16459, Middle = 16459, Upper = 16459.
Conditioning exercise
The findings from stratified analysis by age, income, region, and census tract population groups are presented in supplemental Figures A3–A6, respectively. The positive association between greenness tertiles (G2) on a 500 m buffer was similar across all age-groups for walking, conditioning exercises, and sports. For gardening the association was stronger for the oldest group (≥65 years) and not statistically significant for the youngest group (35-44 years). In contrast, the positive association with running was statistically significant only for the upper tertile of greenness in the youngest group. The inverse association between the tertile of greenness and bicycling was present for all age groups except for the youngest group (35-44 years). Overall, there were no statistically significant interactions across age-groups. Regarding income categories, the strongest positive associations between greenness and gardening were observed for those in intermediate income categories (between $15,000 and $50,000 annually) while for practicing sports the strongest associations were observed for the extremes of the income categories (interaction p-value=0.002). According to geographical regions, the positive associations between greenness and walking or conditioning exercise were observed for all regions. However, the positive association with gardening was not observed for those living in the midwest region (interaction p-value=0.009), the inverse association with bicycling was stronger in the south region (interaction p-value<0.001), and the association with sports participation was not observed for those living in south region of US (interaction p-value<0.001). Finally, we explored the effect of the population size of the census tract and found that the positive association between greenness and gardening was strongest in the intermediate group (census tract population size between 4162 and 6006 OR = 1.69, 95% CI = 1.31,2.18, interaction p-value=0.047)).
4. Discussion
Sister Study participants who lived in greener residential areas were more likely to engage in several specific recreational physical activities, including gardening, sports, running, conditioning exercises, and walking. These associations persisted after adjusting for age, ethnicity, marital status, and census area. Furthermore, we found that the association with sports, running, walking, and conditioning exercises was stronger in urban areas while the association with gardening was stronger in the oldest age group. The associations were consistent across US regions except for lack of association with gardening in the Midwest and with sports in the south region. We also found an inverse association between greenness and bicycling that was present across age, income, and region. This study provides information of the association and effect modification for specific physical activities that adds to the current literature to inform the planning of public interventions and messages aimed to increases the practice of physical activity and its related health benefits.
A previous cross-sectional analysis of the Sister Study13 found a positive association between residential greenness and general physical activity (including daily life physical activities) that was similar across residential areas (urban/rural), age-groups and income categories, and stronger in the western US region13. Our findings complement these data by providing in-depth information of the variation in direction and magnitude of the association between greenness and specific recreational physical activities as well as the differential effect across socio-demographic and geographical conditions. Unlike the earlier study, our findings here focus on association between residential greenness and specific activities, and not an accumulation of time across all activities.
There is consistent evidence of the benefit of recreational physical activity on different health outcomes including cancer.40 A prospective analysis of the Sister Study with an average follow-up of 8.4 years found that higher hours/week and MET-hours/week of total recreational physical activity were associated with an average reduction of postmenopausal breast cancer risk of 23% and 25%, respectively.37 Furthermore, a systematic review and meta-analysis of 38 cohort studies reported that the relative risk (RR) for breast cancer was 0.88 (95%CI 0.85,0.91) for total recreational physical activity.41 However, reported associations between greenness and cancer have been inconsistent.2,7 In this context, it is recognized that mediation by physical activity is a key pathway for the association between greenness and health benefits.10–12 Considering our results, we hypothesize that one potential explanation for the inconsistent results between greenness and cancer outcomes might be related to variations of the association between greenness and specific recreational physical activities.
The quantity and the quality of the residential green spaces might have a different role in health outcomes.5 We used a greenness measure that was able to captured quantity and type the green space at the exact address level of nearly all participants. The NLCD is a satellite-based measure similar to the widely used Normalized Difference Vegetation Index (NDVI) in that it is capable of quantifying the overall amount of green space; in addition, by using two different greenness metrics (G1 and G2) based on NLCD we were also able to captured, to some extent, the quality of the green space. Our findings suggest that women who lived in the upper tertile of green spaces including open spaces (G2) spent more time in almost all recreational physical activities, with exception of bicycling and gardening, compared to those living in upper areas of green spaces only (G1). In this regard, Wang et al.42, used different metrics of greenness in Guangzhou, China, and found that for mental health outcomes, the green space quantity (measured with NDVI and street view quantity) might be due to reducing harm from air pollution, while the green space quality (measured with street view quality and self-reported questionnaire) might action through restoring and building capacities pathways. Specifically, factors such as stress, social cohesion, life satisfaction, and physical activity mediated the association between green space quality and mental health. A recent study conducted in postpartum women in South California used a variety of green space measures including street-view based measures and vegetation types (e.g., street tree and grass), satellite-based measures (e.g. NDVI, NLCD, tree canopy cover), and proximity to parks. Their findings showed that almost all green space indicators, except for street view grass, were associated with physical activity during pregnancy. Only street view-based green space and tree coverage (tree street view and tree canopy cover) were, however, associated with a decreased risk of postpartum depression.43
Most studies assessing the association between greenness and specific physical activities have considered walking as the activity.17,30–32,44 The self-perception of being surrounded by greenness was associated with 19% increase in recreational walking and 84% increased chance of maintaining it.30 Similarly, eye-level street-level greenery has been associated with higher odds of walking and walking time.44 It has been also reported that a higher proportion of surrounding greenness during a walk with someone is associated with greater self-reports of calmness, which is in favor of the restoring and building capacity pathways that explain the associations between greenness and health effects.32 An European study found that dog owners walked more and spent more time in natural outdoor environments when compared to those with no dogs, particularly those living in greener areas45 leading tho the conclusion that dog walking is an effective means to promote physical activity.
Few studies have assessed the association between greenness with recreational physical activities other than walking. Jia et al.31, reported that people with moderate/high levels of physical activity such as walking/square dancing, exercises/Tai Chi, running/biking/climbing, and ball sports lived in areas with higher NDVI index compared to those with low levels of physical activity and that the walking/square dancing and higher NDVI independently reduced the risk of hypertension and cardiac heart disease. Our results are different for bicycling as we found and inverse association with greenness that was consistent across greenness measures. The findings here also are different than in Spain where greenness along bicycle commuting routes was positively associated with higher propensity to bicycling.46 This difference might be due to the heightened crash risks cyclist face near parks in some US cities, likely due to inadequate biking infrastructure and higher traffic density near parks.47 Moreover, women in the US bicycle at 1/3 the rate of men, so possibly the numbers here were too small to derive reliable associations.48 This question merits further research to understand what accounts for differences between our findings and those found in Europe. Some positive associations with other recreational physical activities have been reported for specific populations. For instance, in patients recovering from coronary artery bypass, higher levels of NDVI residential greenness were associated with higher levels of exercise-related physical activity.49 In marathon runners, the greenness was considered one of the most attractive characteristics of the environment of the route.50
There are some limitations worth noting. First, the cross-sectional analyses do not allow us to identify causal effects and potential changes of associations over time, and cross-sectional analyses are not conducive to mediation analyses. Further analyses of this cohort will incorporate longitudinal measures to provide more rigorous conclusions as to how and whether exposure to greenness and type of physical activity can influence health outcomes such as cancer. There is also the possibility of some degree of misclassification of the participants’ physical activity levels derived from the use of self-reported questionnaires; however, if present, it is unlikely to be differential by levels of greenness, and therefore, unlikely to bias our findings.
There are also several strengths of our study worth mentioning. First, we were able to identify up to ten specific recreational physical activities for each participant with standardized assessment of timing for each activity. This makes this study unique in terms of the variety of specific activities reported by women from all US regions and the inclusion of the most completed spectrum of exposure to recreational physical activities. Second, the large sample size of the study allowed the assessment of associations between greenness and the less common physical activities such as gardening, even across different strata of type of area, age group, income, and region. Lastly, as we mentioned earlier, the use of NLCD allowed the assessment of the quantity and to some extent the quality of the residential greenness in terms of land cover characterization. Despite the NLCD might underestimate tree canopy in urban areas by 9.9%51 the use of three different land cover metrics (G1-G2-impervious) allowed us to identify differences in their association with specific physical activities. In our analysis, the potential NLCD measurement error would be present particularly in the G1-G2 measures of greenness and its effect would tend to move the estimates towards the null value; however, our analyses found associations of G1 and G2 with different specific physical activities which suggest that correcting for the vegetation measurement error in the NLCD data will probably results in stronger associations than those reported here.
5. Conclusions
Our study provides the first attempt to characterize the associations between residential greenness exposure and a variety of specific recreational physical activities using a large national US cohort of women. Our findings suggest that women living in places surrounded by higher level of greenness are more likely to garden, play sports, run, engage in conditioning exercises, and walk, but less likely to bike. In addition, we found that some of these associations differ by household income, and region. In the practice, our results might contribute to shape messages and activities aimed to promote specific physical activities according to the close social and natural environment of women. Our findings suggest that public policy should continue the effort for developing and maintaining green spaces, particularly in urban areas, while tailoring messages for promoting recreational physical activity based on sociodemographic and geographical conditions.
Supplementary Material
Highlights.
There are few studies of greenness and participation in specific physical activities
Women who lived in greener residential areas were more likely to garden and walk
The impact of residential greenness on sports was modified by income
Funding
The Sister Study is funded by the Intramural Program of the NIH, National Institute of Environmental Health Sciences (Z01-ES044005 to DPS). This research did not receive any specific grant from funding agencies in the public, commercial or not-for-profit sectors.
Declaration of competing interest
Dale P. Sandler declares funding for the Sister Study from the Intramural Program of the NIH, National Institute of Environmental Health Sciences. All other authors declare they have nothing to disclose.
Footnotes
Publisher's Disclaimer: This is a PDF file of an unedited manuscript that has been accepted for publication. As a service to our customers we are providing this early version of the manuscript. The manuscript will undergo copyediting, typesetting, and review of the resulting proof before it is published in its final form. Please note that during the production process errors may be discovered which could affect the content, and all legal disclaimers that apply to the journal pertain.
Declaration of interests
The authors declare that they have no known competing financial interests or personal relationships that could have appeared to influence the work reported in this paper.
References
- 1.Fong KC, Hart JE, James P. A Review of Epidemiologic Studies on Greenness and Health: Updated Literature Through 2017. Curr Environ Health Rep. Mar 2018;5(1):77–87. doi: 10.1007/s40572-018-0179-y [DOI] [PMC free article] [PubMed] [Google Scholar]
- 2.Yang BY, Zhao T, Hu LX, et al. Greenspace and human health: An umbrella review. Innovation (Camb). Nov 28 2021;2(4):100164. doi: 10.1016/j.xinn.2021.100164 [DOI] [PMC free article] [PubMed] [Google Scholar]
- 3.Jimenez MP, DeVille NV, Elliott EG, et al. Associations between Nature Exposure and Health: A Review of the Evidence. Int J Environ Res Public Health. Apr 30 2021;18(9)doi: 10.3390/ijerph18094790 [DOI] [PMC free article] [PubMed] [Google Scholar]
- 4.Gascon M, Sanchez-Benavides G, Dadvand P, et al. Long-term exposure to residential green and blue spaces and anxiety and depression in adults: A cross-sectional study. Environ Res. Apr 2018;162:231–239. doi: 10.1016/j.envres.2018.01.012 [DOI] [PubMed] [Google Scholar]
- 5.James P, Banay RF, Hart JE, Laden F. A Review of the Health Benefits of Greenness. Curr Epidemiol Rep. Jun 2015;2(2):131–142. doi: 10.1007/s40471-015-0043-7 [DOI] [PMC free article] [PubMed] [Google Scholar]
- 6.Kondo MC, Fluehr JM, McKeon T, Branas CC. Urban Green Space and Its Impact on Human Health. Int J Environ Res Public Health. Mar 3 2018;15(3)doi: 10.3390/ijerph15030445 [DOI] [PMC free article] [PubMed] [Google Scholar]
- 7.Masdor NA, Abu Bakar MF, Hod R, Mohammed Nawi A. Green space exposure and colorectal cancer: A systematic review. Heliyon. May 2023;9(5):e15572. doi: 10.1016/j.heliyon.2023.e15572 [DOI] [PMC free article] [PubMed] [Google Scholar]
- 8.Markevych I, Schoierer J, Hartig T, et al. Exploring pathways linking greenspace to health: Theoretical and methodological guidance. Environ Res. Oct 2017;158:301–317. doi: 10.1016/j.envres.2017.06.028 [DOI] [PubMed] [Google Scholar]
- 9.Kruize H, van Kamp I, van den Berg M, et al. Exploring mechanisms underlying the relationship between the natural outdoor environment and health and well-being - Results from the PHENOTYPE project. Environ Int. Jan 2020;134:105173. doi: 10.1016/j.envint.2019.105173 [DOI] [PubMed] [Google Scholar]
- 10.Dzhambov AM. Residential green and blue space associated with better mental health: a pilot follow-up study in university students. Arh Hig Rada Toksikol. Dec 1 2018;69(4):340–349. doi: 10.2478/aiht-2018-69-3166 [DOI] [PubMed] [Google Scholar]
- 11.Dzhambov AM, Browning M, Markevych I, Hartig T, Lercher P. Analytical approaches to testing pathways linking greenspace to health: A scoping review of the empirical literature. Environ Res. Jul 2020;186:109613. doi: 10.1016/j.envres.2020.109613 [DOI] [PubMed] [Google Scholar]
- 12.Fan Y, Das KV, Chen Q. Neighborhood green, social support, physical activity, and stress: assessing the cumulative impact. Health Place. Nov 2011;17(6):1202–11. doi: 10.1016/j.healthplace.2011.08.008 [DOI] [PubMed] [Google Scholar]
- 13.Villeneuve PJ, Jerrett M, Su JG, Weichenthal S, Sandler DP. Association of residential greenness with obesity and physical activity in a US cohort of women. Environ Res. Jan 2018;160:372–384. doi: 10.1016/j.envres.2017.10.005 [DOI] [PMC free article] [PubMed] [Google Scholar]
- 14.McEachan RR, Prady SL, Smith G, et al. The association between green space and depressive symptoms in pregnant women: moderating roles of socioeconomic status and physical activity. J Epidemiol Community Health. Mar 2016;70(3):253–9. doi: 10.1136/jech-2015-205954 [DOI] [PMC free article] [PubMed] [Google Scholar]
- 15.Nieuwenhuijsen MJ, Khreis H, Triguero-Mas M, Gascon M, Dadvand P. Fifty Shades of Green: Pathway to Healthy Urban Living. Epidemiology. Jan 2017;28(1):63–71. doi: 10.1097/EDE.0000000000000549 [DOI] [PubMed] [Google Scholar]
- 16.Zhang R, Wulff H, Duan Y, Wagner P. Associations between the physical environment and park-based physical activity: A systematic review. J Sport Health Sci. Sep 2019;8(5):412–421. doi: 10.1016/j.jshs.2018.11.002 [DOI] [PMC free article] [PubMed] [Google Scholar]
- 17.Marquet O, Hirsch JA, Kerr J, et al. GPS-based activity space exposure to greenness and walkability is associated with increased accelerometer-based physical activity. Environ Int. Jul 2022;165:107317. doi: 10.1016/j.envint.2022.107317 [DOI] [PMC free article] [PubMed] [Google Scholar]
- 18.Carlson JA, Sallis JF, Jankowska MM, et al. Neighborhood built environments and Hispanic/Latino adults’ physical activity in the U.S.: The Hispanic community health study/study of Latinos community and surrounding areas study. Prev Med. Jul 2022;160:107073. doi: 10.1016/j.ypmed.2022.107073 [DOI] [PMC free article] [PubMed] [Google Scholar]
- 19.Almanza E, Jerrett M, Dunton G, Seto E, Pentz MA. A study of community design, greenness, and physical activity in children using satellite, GPS and accelerometer data. Health Place. Jan 2012;18(1):46–54. doi: 10.1016/j.healthplace.2011.09.003 [DOI] [PMC free article] [PubMed] [Google Scholar]
- 20.McMorris O, Villeneuve PJ, Su J, Jerrett M. Urban greenness and physical activity in a national survey of Canadians. Environ Res. Feb 2015;137:94–100. doi: 10.1016/j.envres.2014.11.010 [DOI] [PubMed] [Google Scholar]
- 21.Klicnik I, Putman A, Doiron D, et al. Neighborhood greenness, but not walkability, is associated with self-rated measures of health in older adults: An analysis of the Canadian Longitudinal Study on Aging. Prev Med Rep. Dec 2022;30:102018. doi: 10.1016/j.pmedr.2022.102018 [DOI] [PMC free article] [PubMed] [Google Scholar]
- 22.Christie CD, Consoli A, Ronksley PE, Vena JE, Friedenreich CM, McCormack GR. Associations between the built environment and physical activity among adults with low socioeconomic status in Canada: a systematic review. Can J Public Health. Feb 2021;112(1):152–165. doi: 10.17269/s41997-020-00364-9 [DOI] [PMC free article] [PubMed] [Google Scholar]
- 23.Halonen JI, Pulakka A, Pentti J, et al. Cross-sectional associations of neighbourhood socioeconomic disadvantage and greenness with accelerometer-measured leisure-time physical activity in a cohort of ageing workers. BMJ Open. Aug 16 2020;10(8):e038673. doi: 10.1136/bmjopen-2020-038673 [DOI] [PMC free article] [PubMed] [Google Scholar]
- 24.Puhakka S, Lankila T, Pyky R, et al. Satellite Imaging-Based Residential Greenness and Accelerometry Measured Physical Activity at Midlife-Population-Based Northern Finland Birth Cohort 1966 Study. Int J Environ Res Public Health. Dec 9 2020;17(24)doi: 10.3390/ijerph17249202 [DOI] [PMC free article] [PubMed] [Google Scholar]
- 25.Triguero-Mas M, Dadvand P, Cirach M, et al. Natural outdoor environments and mental and physical health: relationships and mechanisms. Environ Int. Apr 2015;77:35–41. doi: 10.1016/j.envint.2015.01.012 [DOI] [PubMed] [Google Scholar]
- 26.Dewulf B, Neutens T, Van Dyck D, et al. Associations between time spent in green areas and physical activity among late middle-aged adults. Geospat Health. Nov 16 2016;11(3):411. doi: 10.4081/gh.2016.411 [DOI] [PubMed] [Google Scholar]
- 27.Persson A, Moller J, Engstrom K, Sundstrom ML, Nooijen CFJ. Is moving to a greener or less green area followed by changes in physical activity? Health Place. May 2019;57:165–170. doi: 10.1016/j.healthplace.2019.04.006 [DOI] [PubMed] [Google Scholar]
- 28.Loder AKF, van Poppel MNM. Sedentariness of College Students Is Negatively Associated with Perceived Neighborhood Greenness at Home, but Not at University. Int J Environ Res Public Health. Dec 28 2019;17(1)doi: 10.3390/ijerph17010235 [DOI] [PMC free article] [PubMed] [Google Scholar]
- 29.Faerstein E, da Silveira IH, Boclin KLS, Curioni CC, Castro IRR, Junger WL. Associations of neighborhood socioeconomic, natural and built environmental characteristics with a 13-year trajectory of non-work physical activity among civil servants in Rio de Janeiro, Brazil: The Pro-Saude Study. Health Place. Sep 2018;53:110–116. doi: 10.1016/j.healthplace.2018.07.014 [DOI] [PubMed] [Google Scholar]
- 30.Sugiyama T, Giles-Corti B, Summers J, du Toit L, Leslie E, Owen N. Initiating and maintaining recreational walking: a longitudinal study on the influence of neighborhood green space. Prev Med. Sep 2013;57(3):178–82. doi: 10.1016/j.ypmed.2013.05.015 [DOI] [PubMed] [Google Scholar]
- 31.Jia X, Yu Y, Xia W, et al. Cardiovascular diseases in middle aged and older adults in China: the joint effects and mediation of different types of physical exercise and neighborhood greenness and walkability. Environ Res. Nov 2018;167:175–183. doi: 10.1016/j.envres.2018.07.003 [DOI] [PubMed] [Google Scholar]
- 32.Bollenbach L, Schmitz J, Niermann C, Kanning M. How do people feel while walking in the city? Using walking-triggered e-diaries to investigate the association of social interaction and environmental greenness during everyday life walking. Front Psychol. 2022;13:970336. doi: 10.3389/fpsyg.2022.970336 [DOI] [PMC free article] [PubMed] [Google Scholar]
- 33.Sandler DP, Hodgson ME, Deming-Halverson SL, et al. The Sister Study Cohort: Baseline Methods and Participant Characteristics. Environ Health Perspect. Dec 20 2017;125(12):127003. doi: 10.1289/EHP1923 [DOI] [PMC free article] [PubMed] [Google Scholar]
- 34.Bureau UC. Census Regions and Divisions of the United States. Vol. 2017. 2017. [Google Scholar]
- 35.Homer C, et al. Completion of the 2011 National land cover database for the Conterminous United States - representing a decade of land cover change information. Photogramm Eng Remote Sens. 2015;81:345–354. [Google Scholar]
- 36.Multi-Resolution Land Characteristics Consortium. National Land Cover Database 2006. Vol. Vol. 2017. 2016. [Google Scholar]
- 37.Niehoff NM, Nichols HB, Zhao S, White AJ, Sandler DP. Adult Physical Activity and Breast Cancer Risk in Women with a Family History of Breast Cancer. Cancer Epidemiol Biomarkers Prev. Jan 2019;28(1):51–58. doi: 10.1158/1055-9965.EPI-18-0674 [DOI] [PMC free article] [PubMed] [Google Scholar]
- 38.Ainsworth BE, Haskell WL, Whitt MC, et al. Compendium of physical activities: an update of activity codes and MET intensities. Med Sci Sports Exerc. Sep 2000;32(9 Suppl):S498–504. doi: 10.1097/00005768-200009001-00009 [DOI] [PubMed] [Google Scholar]
- 39.Centers for Disease Control and Prevention. Physical activity Guidelines for Americans. 2018.
- 40.Warburton DER, Bredin SSD. Health benefits of physical activity: a systematic review of current systematic reviews. Curr Opin Cardiol. Sep 2017;32(5):541–556. doi: 10.1097/HCO.0000000000000437 [DOI] [PubMed] [Google Scholar]
- 41.Chen X, Wang Q, Zhang Y, Xie Q, Tan X. Physical Activity and Risk of Breast Cancer: A Meta-Analysis of 38 Cohort Studies in 45 Study Reports. Value Health. Jan 2019;22(1):104–128. doi: 10.1016/j.jval.2018.06.020 [DOI] [PubMed] [Google Scholar]
- 42.Wang R, Feng Z, Pearce J, Liu Y, Dong G. Are greenspace quantity and quality associated with mental health through different mechanisms in Guangzhou, China: A comparison study using street view data. Environ Pollut. Aug 17 2021;290:117976. doi: 10.1016/j.envpol.2021.117976 [DOI] [PubMed] [Google Scholar]
- 43.Sun Y, Molitor J, Benmarhnia T, et al. Association between urban green space and postpartum depression, and the role of physical activity: a retrospective cohort study in Southern California. Lancet Reg Health Am. May 2023;21:100462. doi: 10.1016/j.lana.2023.100462 [DOI] [PMC free article] [PubMed] [Google Scholar]
- 44.Lu Y. The Association of Urban Greenness and Walking Behavior: Using Google Street View and Deep Learning Techniques to Estimate Residents’ Exposure to Urban Greenness. Int J Environ Res Public Health. Jul 25 2018;15(8)doi: 10.3390/ijerph15081576 [DOI] [PMC free article] [PubMed] [Google Scholar]
- 45.Zijlema WL, Christian H, Triguero-Mas M, et al. Dog ownership, the natural outdoor environment and health: a cross-sectional study. BMJ Open. May 27 2019;9(5):e023000. doi: 10.1136/bmjopen-2018-023000 [DOI] [PMC free article] [PubMed] [Google Scholar]
- 46.Cole-Hunter T, Donaire-Gonzalez D, Curto A, et al. Objective correlates and determinants of bicycle commuting propensity in an urban environment. Transportation Research Part D. 2015;40:132–143. doi: 10.1016/j.trd.2015.07.004 [DOI] [Google Scholar]
- 47.Jerrett M, Su JG, MacLeod KE, Hanning C, Houston D, Wolch J. Safe Routes to Play? Pedestrian and Bicyclist Crashes Near Parks in Los Angeles. Environ Res. Nov 2016;151:742–755. doi: 10.1016/j.envres.2016.07.029 [DOI] [PMC free article] [PubMed] [Google Scholar]
- 48.Buehler R, Pucher J, Bauman A. Physical activity from walking and cycling for daily travel in the United States, 2001–2017: Demographic, socioeconomic, and geographic variation. Journal of Transport & Health. 2020;16(100811):1–14. doi: 10.1016/j.jth.2019.100811 [DOI] [Google Scholar]
- 49.Sadeh M, Brauer M, Chudnovsky A, Ziv A, Dankner R. Residential greenness and increased physical activity in patients after coronary artery bypass graft surgery. Eur J Prev Cardiol. Sep 20 2021;28(11):1184–1191. doi: 10.1177/2047487319886017 [DOI] [PubMed] [Google Scholar]
- 50.Deelen I, Janssen M, Vos S, Kamphuis CBM, Ettema D. Attractive running environments for all? A cross-sectional study on physical environmental characteristics and runners’ motives and attitudes, in relation to the experience of the running environment. BMC Public Health. Apr 2 2019;19(1):366. doi: 10.1186/s12889-019-6676-6 [DOI] [PMC free article] [PubMed] [Google Scholar]
- 51.Pourpeikari Heris M, Bagstad KJ, Troy AR, O’Neil-Dunne JPM. Assessing the Accuracy and Potential for Improvement of the National Land Cover Database’s Tree Canopy Cover Dataset in Urban Areas of the Conterminous United States. Remote Sensing. 2022; 14(5):1219. 10.3390/rs14051219 [DOI] [Google Scholar]
Associated Data
This section collects any data citations, data availability statements, or supplementary materials included in this article.