

Abstract
Pyridoxine 4-dehydrogenase (PdxI), a NADPH-dependent pyridoxal reductase, is one of the key players in the Escherichia coli pyridoxal 5’-phosphate (PLP) salvage pathway. This enzyme, which catalyses the reduction of pyridoxal into pyridoxine, causes pyridoxal to be converted into PLP via the formation of pyridoxine and pyridoxine phosphate. The structural and functional properties of PdxI were hitherto unknown, preventing a rational explanation of how and why this longer, detoured pathway occurs, given that, in E. coli, two pyridoxal kinases (PdxK and PdxY) exist that could convert pyridoxal directly into PLP. Here, we report a detailed characterisation of E. coli PdxI that explains this behaviour. The enzyme efficiently catalyses the reversible transformation of pyridoxal into pyridoxine, although the reduction direction is thermodynamically strongly favoured, following a compulsory-order ternary-complex mechanism. In vitro, the enzyme is also able to catalyse PLP reduction and use NADH as an electron donor, although with lower efficiency. As with all members of the aldo-keto reductase (AKR) superfamily, the enzyme has a TIM barrel fold; however, it shows some specific features, the most important of which is the presence of an Arg residue that replaces the catalytic tetrad His residue that is present in all AKRs and appears to be involved in substrate specificity. The above results, in conjunction with kinetic and static measurements of vitamins B6 in cell extracts of E. coli wild-type and knockout strains, shed light on the role of PdxI and both kinases in determining the pathway followed by pyridoxal in its conversion to PLP, which has a precise regulatory function.
Keywords: Vitamin B6 salvage pathway, PdxI, aldo-keto reductase superfamily, kinetic mechanism, X-ray crystallography
Graphical Abstract

PdxI, a NADPH-dependent pyridoxal reductase catalysing the reduction of pyridoxal into pyridoxine, is a key player in Escherichia coli pyridoxal 5’-phosphate (PLP) homeostasis. The concerted action of PdxI and both the PdxK and PdxY kinases determines a detoured pathway taken by pyridoxal in its conversion to PLP. The precise regulatory function of this pathway is to limit the toxic accumulation of PL and at the same time control PLP formation.
Introduction
Vitamin B6 is a group of six interconvertible compounds, or vitamers: pyridoxine (PN), pyridoxal (PL), pyridoxamine (PM) and their 5’-phosphate derivatives PNP, PLP and PMP. The catalytically active form, pyridoxal 5′-phosphate, serves as a coenzyme for several enzymes, whose genes represent 1.5% of many prokaryotic genomes [1]. Vitamin B6 is endowed with other important biological properties: PLP and PN bind to steroid receptors and play a role in membrane ion transport [2–4]; B6 vitamers act as reactive oxygen species scavengers [5, 6] and as resistance factors to biotic and abiotic stress in plants [7, 8] and in Plasmodium falciparum [9]; PLP has been described as an important virulence factor in Helicobacter pylori, Mycobacterium tuberculosis and Actinobacillus pleuropneumoniae [10–12]; moreover PLP acts as effector molecule for a group of bacterial transcriptional regulators, called MocR transcription factors [13].
Plants and bacteria are generally able to synthesise PLP using one or the other of two mutually exclusive pathways [14], whereas many organisms, including humans, must acquire B6 vitamers from the environment and then transform them into PLP via a recycling or salvage pathway [15]. Escherichia coli synthesizes PLP through the 7-step deoxyxylulose-5-phosphate (DXP)-dependent pathway, in which 3-amino-1-hydroxyacetone 1-phosphate and DXP are condensed by pyridoxine 5’-phosphate synthase, encoded by pdxJ, to yield PNP. The final step of PLP biosynthesis is catalysed by PdxH, an FMN-dependent enzyme, which oxidises PNP to PLP using oxygen as the final electron acceptor [15]. This enzyme also forms PLP from pyridoxamine 5′-phosphate (PMP). E. coli can also recycle B6 vitamers coming from the environment or from protein turnover via a salvage pathway (Scheme 1), whose components are PdxH, non-specific or specific phosphatases such as YbhA [16], the kinase PdxK, which phosphorylates PL, PN, and PM to PLP, PNP and PMP, respectively [17], and the kinase PdxY, which is specific for phosphorylating PL to PLP [18]. Moreover, PdxI, a PL reductase, which converts PL to PN, has been recently proposed as an important component of the salvage pathway [19]. All these enzymes contribute to the maintenance of vitamin B6 homeostasis inside the cell.
Scheme 1.

Vitamin B6 salvage pathway in Escherichia coli. PN, pyridoxine; PL, pyridoxal; PNP, pyridoxine 5’-phosphate; PLP, pyridoxal 5’-phosphate; PdxI, pyridoxal reductase; PdxK and PdxY, pyridoxal kinase; PdxH, pyridoxine 5’-phosphate oxidase; PdxJ, pyridoxine 5’-phosphate synthase; YbhA, pyridoxal 5’-phosphate phosphatase. Created with BioRender.com.
PdxI belongs to the large superfamily of NAD(P)H-dependent aldo-keto reductases (AKR), comprising about 200 members classified into 16 families and distributed in nearly all phyla (https://akrsuperfamily.org/). AKRs catalyse the reduction of carbonyl substrates such as sugars and lipid aldehydes, ketosteroids, ketoprostaglandins and various chemical carcinogens [20]. PdxI was first purified from the budding yeast Saccharomyces cerevisiae [21] and the fission yeast Schizosaccharomyces pombe [22]. In E. coli, PdxI was initially identified in a large-scale metabolomics screen for enzymatic activities of uncharacterized proteins [23], and then proposed to be involved in the vitamin B6 salvage pathway [24]. It has been proposed that the yeast PL reductase catalyses also the reverse reaction (conversion of PN to PL in the presence of NADP+), although with low efficiency [21, 25], whereas this activity was not detected in a partially characterised E. coli PdxI [24].
Here we report a detailed functional and structural characterisation of E. coli PdxI from the perspective of its role in the vitamin B6 salvage pathway, in which the substrate binding and catalytic properties, the kinetic mechanism, the crystal structure of the unliganded enzyme, of the binary and tertiary substrate complexes, and the cellular physiological role of the enzyme were analysed. Our investigation rationalises the pivotal role of PdxI in E. coli vitamin B6 salvage pathway.
Results
Binding of substrates to PdxI
The recombinant His-tagged E. coli PdxI was purified to homogeneity (>95% purity) with a molecular weight of ~33kD, as judged by SDS-PAGE analysis. Analytical ultra-centrifugation (AUC) analysis showed that PdxI is in the monomeric form (data not shown). The thermal stability of PdxI, analysed by differential scanning fluorimetry (DSF), was evaluated in 50 mM potassium phosphate (KPi) buffer at different pH values (from 6.9 to 8.0) showing no significant changes (data not shown). The melting temperature (Tm; 47.0 ± 0.1 °C) does not change upon the addition of either NaCl or MgCl2 (data not shown). Therefore, we decided to perform all the following biochemical analyses in 20 mM KPi pH 7.3. Binding of ligands to PdxI was analysed by testing the effect of substrates on thermal stability (Fig. 1). PL, PN and PLP vitamers, as well as NAD+ and NADH, have no effect when added alone (Fig. 1A). No effect on Tm is observed even when vitamer and dinucleotide substrates (either NAD+ and PL or NADH and PN) are added together (Fig. 1A). On the other hand, increasing concentrations of either NADP+ or NADPH induce an increase of thermal stability (up to 9°C; Figs. 1B and C). The changes of Tm as a function of NADP(H) concentration allowed us to evaluate an apparent dissociation constant for NADP+ (856 ± 490 μM) which is 10 times that for NADPH (81 ± 16 μM) (Fig 1D). The addition of vitamer substrates (200 μM either PL or PN) to a pre-incubated mixture of PdxI and dinucleotide substrates (in particular, PL was added to PdxI-NAD(P)+ and PN to PdxI-NAD(P)H) did not further increase Tm (Fig. 1D).
Figure 1.

DSF analysis of PdxI thermal stability in different conditions. (A) Relative fluorescence as a function of temperature in the presence of PL, PN and PLP vitamers (100 μM), and NAD+ or NADH (400 μM). Relative fluorescence as a function of temperature in the presence of increasing NADP+ (B) or NADPH (C) concentration. Data are shown as the average of three independent measurements. D) Melting temperatures (Tm) of PdxI (2 μM) as a function of NADP+ (red), NADPH (green), NAD+ (black), and NADH (blue). Values are represented as the average Tm ± the standard error of the mean (SEM) and were obtained from the analysis of denaturation profiles shown in the previous panels. The solid lines are nonlinear least squares fits to the experimental data obtained according to a hyperbolic equation. At the highest dinucleotide concentration (400 μM), 200 μM either PL or PN were also added (large symbols: green triangle, PN; red square, PL; blue triangle, PN; black circle, PL), but no change in melting temperature was observed.
A similar difference in binding affinity between NADP+ and NADPH was obtained when the binding of ligands to PdxI was evaluated by isothermal titration calorimetry (ITC) (Table 1). Binding of B6 vitamers alone (PL, PN, or PLP) could not be detected, whereas addition of both NADP+ and NADPH alone gave measurable signals. Again, KD for NADP+ binding (46.3 ± 1.97 μM) was much larger than that for NADPH (4.20 ± 0.35 μM). It should be noticed that the values of apparent dissociation constant for NADP+ and NADPH obtained with the DSF are much larger. However, it should be kept in mind that DSF measurements depend on the thermal stability of the protein, and therefore only indirectly report changes due to ligand binding. In this case, binding of PL could be detected when this vitamer was added to a pre-incubated mixture of PdxI and NADPH, revealing a KD of 0.024 ± 0.01 μM and suggesting that PL is binding to the protein only when NADPH is already bound to it. However, it should be considered that with these ligands the PL reduction by NADPH is catalysed by the enzyme, and therefore a mixture of substrates and products is generated. No detectable binding was observed when PN was added to a pre-incubated mixture of PdxI and NADP+. Notably, the binding of either NADPH or NADP+ (binary complexes) and of both PL and NADPH (ternary complex) to the enzyme exhibit exothermic reactions; however, the ternary complex is significantly less exothermic (−3.7 ± 0.15 KJ mol−1) compared to the binary complexes (−12.40 ± 0.14 and −21.6 ± 0.56 KJ mol−1). On the other hand, ΔS is negative for the binary complexes (−18 ± 1 and −54 ± 2 J mol−1/deg) and positive for the ternary complex (22 ± 1 J mol−1/deg). These results indicate that the formation of the binary complexes is accompanied by a decrease of entropy and therefore is driven by the negative change in enthalpy, whereas the formation of the ternary complex is associated to an increase of entropy. The N value measured for the formation of the binary complexes reveal that one molecule of NAD(P)H binds to one enzyme subunit. The lower N value (0.61) measured for the formation of the ternary complex is most likely due to the fact that PL was added to a 1:1 pre-incubated mixture of PdxI and NADPH, in which PdxI was not fully saturated by the dinucleotide substrate.
Table 1.
ITC analysis of PdxI with B6 vitamers and NADP(H)
| Reactants | KD (μM) | N value | ΔH (KJ mol−1) |
ΔS (J mol−1/deg) |
|---|---|---|---|---|
| PdxI/PL | NB | |||
| PdxI/PN | NB | |||
| PdxI/PLP | NB | |||
| PdxI/NADPH | 4.20 ± 0.35 | 1.13 ± 0.05 | −12.40 ± 0.14 | −18 ± 1 |
| PdxI/NADP + | 46.3 ± 1.97 | 0.99 ± 0.09 | −21.60 ± 0.56 | −54 ± 2 |
| PdxI/NADPH/PL | 0.024 ± 0.01 | 0.61 ± 0.02 | −3.70 ± 0.15 | 22 ± 1 |
| PdxI/NADP + /PN | NB |
NB: non-binding ligand
The reported values are the average ± the standard deviation of 2–4 replicates.
Reactions catalysed by PdxI
It has been reported that E. coli PdxI in vitro had no detectable activity with either PLP or PM; also, the activity of the reverse reaction (conversion of PN into PL in the presence of NADP+) was not detected [24]. We tested the activity of our purified recombinant PdxI by using PL and NADPH, PL and NADH, PLP and NADPH, PN and NADP+, PM and NADP+ and PNP and NADP+ as substrates. The course of the reactions was followed by means of a discontinuous assay in which substrates and products were separated and quantified by HPLC. (Fig. 2). The results showed that in our experimental conditions PdxI preferentially catalyses the interconversion of PL and PN using either NADPH or NADP+, respectively as electron donor and acceptor. Starting with PL and NADPH, when the reaction reached the equilibrium, 96 ± 1.7 % PL was converted into PN (Fig. 2A). The reverse reaction (started with PN and NADP+) occurred on the same time scale, but only 5 ± 1.3 % PN was converted to PL (Fig. 2C). The reaction started with PL and NADH was 10 times slower than that with NADPH, but similarly, at equilibrium, 98.3 ± 2.6 % of PL was converted into PN (Fig. 2B). PdxI can also slowly convert PLP into PNP using NADPH (Fig. 2D). In this case, the conversion of PLP into PNP was apparently complete. Accordingly, the reverse reaction (PNP to PLP) could not be detected under our experimental conditions. Additionally, the conversion of PM to PL using NADP+ as electron acceptor could not be detected either (data not shown).
Figure 2.

Reactions catalysed by PdxI. A) Time course of the reaction carried out using 200 μM PL, 400 μM NADPH and 0.2 μM PdxI. B) Time course of the reaction carried out using 200 μM PL, 400 μM NADH and 0.2 μM PdxI. C) Time course of the reaction carried out using 200 μM PN, 400 μM NADP+ and 1 μM PdxI. D) Time course of the reaction carried out using 200 μM PLP, 400 μM NADPH and 0.2 μM PdxI. Experimental values are the average ± SEM of three independent measurements. The solid lines are nonlinear least squares fits to the experimental data obtained according to an exponential equation.
Kinetic characterization of the catalysed reactions
The DSF and ITC analyses described above indicate that PdxI is able to bind either NADPH or NADP+ alone (in the absence of a B6 vitamer), whereas it is not capable to bind any of the B6 vitamers if a dinucleotide substrate is not present. These observations suggest either a compulsory-order ternary-complex mechanism or a substituted-enzyme mechanism for the reaction catalysed by PdxI [26]. However, since PdxI has apparently no cofactors, and further we observed that the absorption spectrum of a NADPH solution does not change when an equimolar amount of PdxI is added to it (data not shown), only the compulsory-order ternary-complex mechanism seems to be appropriate. In order to discriminate between a compulsory-order ternary-complex and a substituted-enzyme mechanism, a complete kinetic characterization of PL reduction to PN was carried out (Fig. 3) by measuring spectrophotometrically the initial velocity of NAD(P)H oxidation. Because the absorption spectra of B6 vitamers and NAD(P)H are mostly superimposed (data not shown), the absorbance change at 360 nm, where mainly NAD(P)H absorbs, was followed. Firstly, a series of saturation curves were obtained by varying the concentration of one substrate (either PL or NADPH) while keeping the other substrate fixed at different concentrations (Fig. 3A and 4E). For each saturation curve, KMapp and Vmaxapp values were determined by analysing the data with the Michaelis-Menten equation. As shown in figure 3B and 3F, the slopes (KMapp/Vmaxapp) of the straight lines in the corresponding Lineweaver-Burk plots change as a function of the concentration of the fixed substrate, definitively excluding a substituted-enzyme mechanism, which typically gives a series of parallel lines [26]. Consistently, apparent kinetic parameters obtained from the analysis of the saturation curves give secondary plots of Vmaxapp/KMapp that describe rectangular hyperbolas through the origin (Fig. 3C and 3G). Analysis of the dependence of Vmaxapp on the concentration of the fixed substrate gave estimate of Vmax of approximately 174 μM min−1 (Fig. 3C and 3G) and therefore a kcat of about 3500 min−1 (58 s−1). Moreover, secondary plots of fixed substrate concentration/Vmaxapp against the concentration of the same fixed substrate are straight lines, leading to a KM for PL of 38 ± 2 μM and a KM for NADPH of 12 ± 4 μM (Fig. 3D and 3H).
Figure 3.

Kinetic characterization of the conversion of PL to PN catalysed by PdxI. A) The initial velocity of the reaction was measured with 0.05 μM PdxI, varying NADPH concentration while keeping PL fixed at different concentrations (6.25, 12.5, 25, 50, 100, 150, and 300 μM). Experimental values are the average ± SEM of three independent measurements. The obtained saturation curves were fitted to the Michaelis-Menten equation obtaining KMapp and Vmaxapp values as a function of PL concentration. B) Lineweaver-Burk plot of the data reported in A fitted to a linear equation. C) Dependence of Vmaxapp and Vmaxapp/KMapp on PL concentration. In both cases, values were fitted to an equation describing a hyperbolic curve, obtaining a Vmax of 175 ± 5 μM min−1. D) Secondary plot of PL concentration/Vmaxapp against PL concentration. The intercept on the X-axes gives a value of KM for PL of 38 ± 2 μM. E) The initial velocity of the reaction was measured with 0.05 μM PdxI, varying PL concentration while keeping NADPH fixed at different concentrations (6.25, 12.5, 25, 50, 100, 150, and 200 μM). Experimental values are the average ± SEM of three independent measurements. The obtained saturation curves were fitted to the Michaelis-Menten equation obtaining KMapp and Vmaxapp values as a function of NADPH concentration. F) Lineweaver-Burk plot of the data reported in E fitted to a linear equation. G) Also in this, dependence of Vmaxapp and Vmaxapp/KMapp on NADPH concentration were fitted to a hyperbolic curve, obtaining a Vmax of 174 ± 13 μM min−1. H) Secondary plot of NADPH concentration/Vmaxapp against NADPH concentration. The intercept on the X-axes gives a value of KM for NADPH of 12 ± 4 μM.
Figure 4.
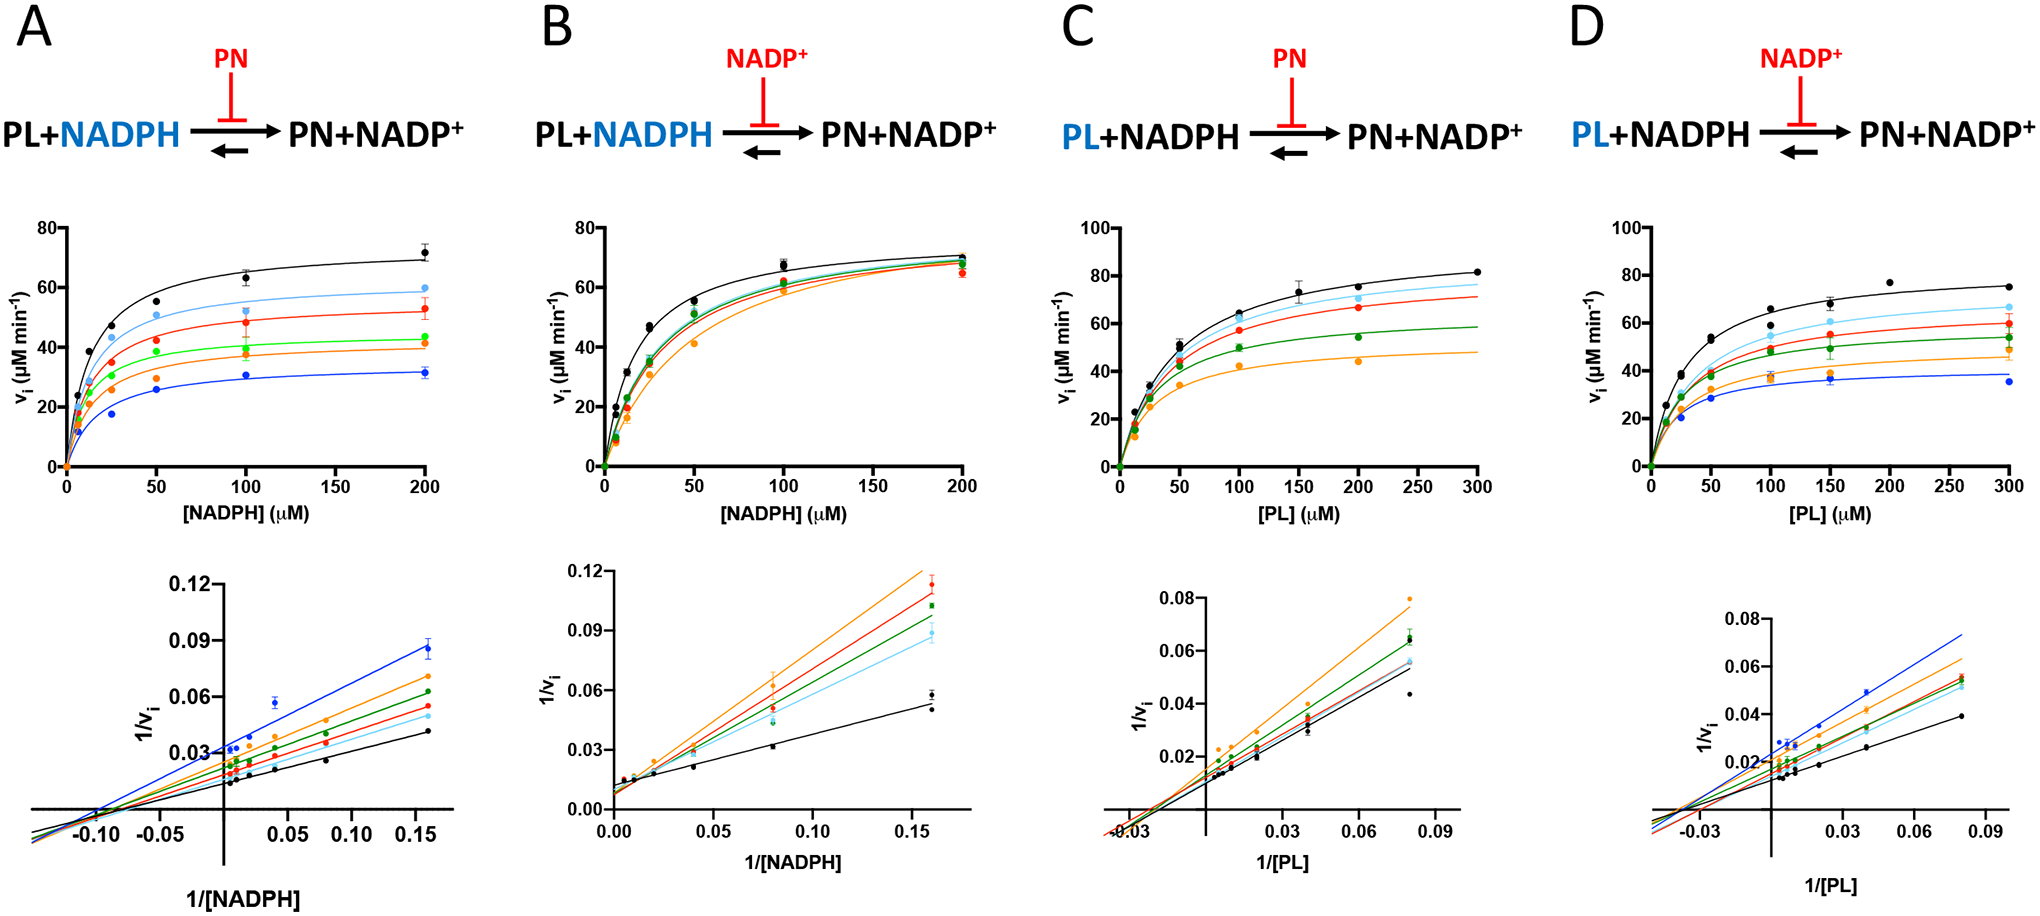
Kinetic analysis of product inhibition. Model (upper panels), saturation curves (middle panels) and Lineweaver-Burk plots (lower panels) of reactions carried out with 0.05 μM PdxI and: A) varying NADPH concentration, while keeping PL fixed at 39 μM in the presence of different concentrations of PN (0, 100, 200, 400, 600 and 800 μM); B) varying NADPH concentration, while keeping PL fixed at 39 μM in the presence of different concentrations of NADP+ (0, 50, 75, 100, and 200 μM); C) varying PL concentration, while keeping NADPH fixed at 12 μM in the presence of different concentrations of PN (0, 50, 100, 200, 400 and 800 μM); D) varying PL concentration, while keeping NADPH fixed at 12 μM in the presence of different concentrations of NADP+ (0, 50, 75, 100, and 200 μM). All experimental values are the average ± SEM of three independent measurements.
The described kinetic data clearly indicate that the mechanism of the PdxI-catalysed reaction is not a substituted-enzyme mechanism (and is therefore a ternary-complex mechanism) but do not allow discrimination between a compulsory-order and a random-order mechanism. Therefore, to settle the matter, product inhibition experiments were carried out (Fig. 4). Two series of saturation curves were obtained by adding either PN or NADP+ products at fixed concentrations to reaction mixtures in which NADPH was varied while keeping PL fixed at 38 μM (corresponding to the KM value for this substrate) (Fig. 4A and 4B). Two further series of data were analogously obtained by varying PL while NADPH was kept fixed at 12 μM (value of KM for NADPH) (Fig. 4C and 4D). From this analysis, it is clear that NADP+ is a competitive inhibitor with respect to NADPH, whereas in all other cases a mixed inhibition is observed. This pattern of product inhibition indicates that the reaction catalysed by PdxI follows a compulsory-order mechanism [26].
Since PdxI can also convert PLP to PNP using NADPH as electron donor (Fig. 2D), we tried to determine the kinetic parameters of this reaction, but we encountered several experimental problems. First, using a diode-array spectrophotometer, we observed a rapid photodegradation of PLP that affected the measurement of the absorbance change at 360 nm [27], which was avoided by using a UV filter with a cutoff at 310 nm. As mentioned above, compared to PL, the reaction with PLP was much slower (Fig. 2 and 5A). Moreover, since the molar absorptivity of PLP at 360 nm is much higher than that of PL and the KM value for PLP is much higher than that of PL, it was impossible to use concentrations of PLP high enough to determine the KM value for PLP since the high absorbance was causing an unacceptably low signal-to-noise ratio. However, the obtained data indicate a KM for PLP higher than 1.2 mM (Fig. 5B). On the other hand, saturation curves obtained by varying the concentration of NADPH, keeping PLP fixed at different concentrations (Fig. 5C), gave KMapp values in the range of those observed when using PL.
Figure 5.

Kinetic characterization of the conversion of PLP to PNP catalysed by PdxI. A) Comparison of time course of reaction with 0.2 mM PL (green) and PLP (blue) in the presence of 0.2 mM NADPH. The change in absorbance at 360 nm is reported. B) The initial velocity of the reaction was measured with 0.05 μM PdxI, varying NADPH concentration while keeping PLP fixed at different concentrations (150, 300, 450, 600, and 1250 μM). C) The initial velocity of the reaction was measured with 0.05 μM PdxI, varying PLP concentration while keeping NADPH fixed at different concentrations (4.68, 9.37, 18.75, 37.5, 75, 150, and 300 μM). Experimental values are the average ± SEM of three independent measurements. The obtained saturation curves were fitted to the Michaelis-Menten equation.
Structure determination of PdxI and overall analyses
We have crystallized and solved the crystal structures of unliganded PdxI, its binary complex with NADPH, and ternary complex with NADPH and PL. To determine the structure of unliganded PdxI, we used the homology-modelling server Swiss-Model [28] to identify AKR TM1743 from Thermotoga maritima in complex with NADP(H) (PDB: 5DAN) [29], as a suitable search model for molecular replacement (MR). The structure was determined to a resolution of 2.2 Å. Data collection and refinement statistics are reported in Table 2. Analysis of the crystallographic structure suggests minimal contacts between monomers, consistent with analytical ultracentrifuge (AUC) study that indicated PdxI exists as a monomer in solution. It is worthwhile to note that over 50% of characterized aldo-keto reductases (AKR) function as monomeric proteins, while others can form dimeric or tetrameric functional structures [30]. A comparison between the crystal structures of PdxI and 5DAN, which have sequence identity of 31%, reveals a relatively low rmsd of 1.9 Å. Similar to all AKR superfamily proteins, PdxI adopts a TIM barrel fold (Fig. 6). Interestingly, the barrel appears to consist of only 6 β-strands (β3, β4, β7, β8, β9, and β10), instead of the usual 8 β-strands, surrounded by 8 α-helices (α1, α2, α3, α4, α5, α6, α8, and α9) [20, 31]. Residues 16–20 and 248–252, which presumably correspond to the two missing β-strands in the barrel, are part of extended Loop 2 (15–32) and Loop 17 (245–257), respectively. It should be noted that Loop 2 and Loop 17 are well-ordered with low B-factors when compared to other parts of the structure. The two conserved β strands, β1 and β2, cap the bottom of the barrel, while two additional strands, β5 and β6, lie adjacent to the barrel entrance. Two additional but conserved helical structures, α7 and α10, are also located adjacent to the barrel entrance, but opposite to strands β5 and β6.
Table 2.
Crystallographic data and refinement statistics for PdxI with or without ligands
| Data Collection Statistics | Unliganded PdxI | PdxI-NADPH | PdxI-NADPH-PL |
|---|---|---|---|
| PDB ID | 8TE8 | 8TEZ | 8TF1 |
| Space group | P21 | P21 | P21212 |
| Unit cell (Ǻ) | 46.52, 74.92, 85.13 90, 98.33, 90 |
48.71, 76.06, 85.76 90, 98.69, 90 |
91.95, 75.75, 43.09 |
| Monomer/AU | 2 | 2 | 1 |
| Resolution (Ǻ) | 27.99–2.20 (2.27–2.20) | 26.49–2.30 (2.38–2.30) | 27.18–2.00 (2.05–2.00) |
| Measured Reflections | 172237 (14089) | 183688 (18133) | 147270 (10752) |
| Unique Reflection | 29498 (2563) | 27634 (2700) | 21054 (1562) |
| Completeness (%) | 99.9 (100) | 99.9 (100) | 100.0 (100) |
| Average I/σ(I) | 10.6 (3.8) | 11.8 (4.0) | 23.8 (4.2) |
| Redundancy | 5.8 (5.5) | 6.6 (6.7) | 7.0 (6.9) |
| Rmerge (%)a | 9.9 (35.8) | 10.4 (40.5) | 6.2 (40.6) |
| Refinement Statistics | Unliganded PdxI | PdxI-NADPH | PdxI-NADPH-PL |
| Resolution (Ǻ) | 27.99–2.20 (2.28–2.20) | 26.48–2.30 (2.38–2.30) | 27.18–2.00 (2.11–2.00) |
| No. of reflections | 29420 (2900) | 27587 (2735) | 21010 (2937) |
| R work (%) c | 17.98 (21.56) | 21.04 (22.63) | 17.86 (18.47) |
| R free (%) d | 24.76 (33.54) | 28.34 (33.25) | 23.67 (24.45) |
| RMSD bonds (Ǻ) | 0.008 | 0.008 | 0.008 |
| RMSD angles (°) | 1.11 | 1.18 | 1.23 |
| Rama most favored (%) | 96.6 | 96.3 | 97.2 |
| Rama allowed (%) | 2.9 | 3.4 | 2.5 |
| Ave. B-factor (Å 2 )/Atoms | 26.5/4614 | 27.9/4567 | 23.1/2529 |
| Ave. B-factors (Å 2 )/Proteins | 26.2/4267 | 27.6/4267 | 21.8/2159 |
| Ave. B-factors (Å 2 )/Ligand | N/A | 36.0/98 | 30.5/61 |
| Ave. B-factors (Å 2 )/Solvent | 30.6/347 | 29.8/202 | 31.4/309 |
Values for the outmost shells are given in parentheses.
Rmerge = Σ|I - <I>|/Σ I, where I is the integrated intensity of a given reflection.
Rwork = Σ [||Fo| - |Fc|| Σ |Fo|.
For R free calculations 5% of data was excluded from refinement.
Figure 6.

Overall structure of ternary PdxI-NADPH-PL complex showing the ribbon representation of the TIM-barrel fold in two orientations (A and B). Helices are coloured in cyan. The 6 β-strands (β3, β4, β7, β8, β9, and β10) that form the barrel are coloured in magenta. The β-strands β1 and β2 that cap the bottom of the barrel are coloured brown. The β-strands β5 and β6 that are located adjacent to the barrel entrance are coloured in purple. The loops and unstructured regions are mostly coloured cyan, however residues 16–20 and 248–252 which are part of Loop 2 and Loop 17, respectively, are coloured magenta (see paragraph “Structure determination of PdxI and overall analyses”). The NADPH is shown as a yellow stick, and PL as a green stick. The Mg2+ ion is shown as a red sphere. Not all loop regions are labelled. The figures were generated using PyMOL (Version 2.0 Schrödinger, LLC., New York, NY, USA).
Attempts were made to co-crystallize PdxI with either PL or NADPH, as well as with a mixture of both substrates, using the same crystallization conditions that resulted in unliganded PdxI crystals. The protein with PL formed crystals with an orthorhombic space group P21212 and one monomer in the asymmetric unit. However, the solved crystal structure did not reveal any bound PL molecule. On the other hand, the protein with NADPH, also in the orthorhombic space group P21212 led to a crystal structure of PdxI with NADPH bound. Meanwhile, the unliganded PdxI monoclinic crystals were also utilized for soaking with NADPH, leading to the successful determination of the crystal structure of the binary PdxI-NADPH complex at a resolution of 2.3 Å. The two PdxI-NADPH structures were indistinguishable and the monoclinic structure with the higher resolution chosen for refinement. Subsequently, PdxI-NADPH orthorhombic crystals were used for soaking with a mixture of PL and NADPH to obtain the ternary PdxI-NADPH-PL crystal structure at a resolution of 2.0 Å. Both complexes showed bound ligands electron densities that were modelled with the respective molecules for structure refinements. It is worth mentioning that attempts to soak the monoclinic or orthorhombic crystals with an excess of PL did not yield a bound PL in the structures. These observations confirm that while NADPH could bind independently to the protein, the binding of PL requires the presence of NADPH, consistently with the biophysical binding results and the proposed compulsory-order mechanism. Given that the ternary complex structure was obtained by soaking PdxI crystals with NADPH and PL, it is conceivable that the bound ligands in the ternary complex could be a mixture of substrates (NADPH and PL) and products (NADP+ and PN). It is worth noting that while a large number of unliganded or binary AKR structures have been solved to date, only a few ternary AKR structures with NADPH or NADP+ along with the carbonyl or alcohol have been reported in the literature. Three notable examples are human aldose reductase with bound NADP+ and D-glyceraldehyde (AKR-NADP+-GAL) (PDB: 3V36)[32], human aldose reductase with bound NADP+ and glucose-6-phosphate (AKR-NADP+-G6P) (PDB: 2ACQ)[33], and yeast Debaryomyces nepalensis xylose reductase in complex with a NADP and 2,3-dihydroxy-1,4-dithiobutane (PDB: 5ZCM)[34].
The unliganded PdxI, binary PdxI-NADPH, and ternary PdxI-NADPH-PL structures superimpose with each other with rmsd of ~0.25Å (Fig. 7). The most significant structural movement due to NADPH and PL binding occurs with strand β3 (residues 52–55), strand β10-Loop 15 (residues 208–217) and strand β5-Loop 7-strand β6 (residues 89–99), presumably due to Asp54, Phe209, Phe210, Pro211 and Trp95 moving as a consequence of NADP(H) and vitamer binding. Phe209 and Trp95 make key π-stacking interactions with the NADP(H) nicotinamide ring and vitamer pyridine ring, respectively, that help position the two ligands for productive hydride transfer (Fig. 7B and Fig. 8; also see next paragraph).
Figure 7.

Comparison of PdxI overall structures. Protein is shown in ribbon and stick. Bound NADPH and PL in the ternary PdxI-NADPH-PL complex are shown as yellow and green sticks, respectively. Bound NADPH in the binary PdxI-NADPH complex is shown as brown stick. Mg2+ ion in the ternary PdxI-NADPH-PL and binary PdxI-NADPH complexes is shown as cyan and magenta sphere, respectively. Not all binding site residues are shown. (A) Superposition of unliganded PdxI (gray), binary PdxI-NADPH complex (magenta), and ternary PdxI-NADPH-PL complex (cyan). (B) Close-up view of the NADPH and PL binding pockets of the superposed unliganded PdxI (gray) and ternary PdxI-NADPH-PL complex (cyan) structures. The figures were generated using PyMOL (Version 2.0 Schrödinger, LLC., New York, NY, USA).
Figure 8.

PdxI substrate and NADP(H) binding pocket. Superposition of ternary PdxI-NADPH-PL complex (gray) and unliganded PdxI (cyan). Protein residues are shown in sticks, NADPH in yellow stick, and PL in green stick. The figure was generated using PyMOL (Version 2.0 Schrödinger, LLC., New York, NY, USA).
Structural analysis of substrate binding and specificity
As observed with other AKRs, the binding of vitamer and NADP(H) substrates involves several key interactions, including π-stacking, hydrophobic contacts, and hydrogen bonding, which are illustrated in Figure 8, and briefly described below. It is important to note that the binding environment of NADP(H), and associated interactions with the protein, are very similar between the binary and ternary complexes. The adenine moiety of NADP(H), which is mostly exposed to the solvent, engages a face-to-face π-stacking interaction with the imidazole of His260, a hydrophobic interaction with Met235, a hydrogen-bond interaction with Asn264 (~2.8 Å), as well as several water-mediated hydrogen-bond interactions with the protein residues. To make the face-to-face π-stacking interaction, the side-chain of His260 undergoes a rotation of ~120° from its position in the unliganded PdxI (Fig. 8). The 2’ phosphate of NADP(H) ribose makes direct hydrogen-bond interactions with His260 (2.6 Å), Ser256 (~2.8 Å), and Thr255 (2.6 Å), and several water-mediated interactions with the protein, while the ribose makes a water-mediated hydrogen-bond interaction with Gln22. Although, the NADP(H) pyrophosphate bridge makes only limited interactions with the protein (water-mediated interaction with Gln22, and a direct hydrogen-bond interaction with Phe210), its binding occurs with significant movement of Phe210 side chain (5Å) to prevent steric contact with the pyrophosphate (Fig. 8). Interestingly, we observed a very strong difference electron density adjacent to the pyrophosphate, which did not refine well with a water molecule, but did with a Mg2+ ion that likely came from the crystallization buffer (Fig. 8). The Mg2+ ion makes interactions with the pyrophosphate, ribose, the side-chain of Gln22, and the amide of Gly254 (1.9 – 3.7 Å). The binary PdxI-NADPH complex also shows a similar Mg2+ ion binding (Fig. 7), but not the unliganded PdxI. There is no report of a metal-dependent NADPH binding or catalysis in the AKR superfamily of proteins. The pyrophosphate environment in AKRs is devoid of any anionic residues, suggesting no structural requirement for a metal with NADPH binding. Kinetic studies, in which MgCl2 (1 mM) was either present or absent in the buffer, do not support the requirement of a Mg2+ for catalysis (data not shown).
The nicotinamide ribose makes a hydrogen-bond interaction with Asp54 (2.8 Å), while the nicotinamide ring, which is sandwiched between Phe209 and Met21, makes an almost face-to-face π-stacking interaction with Phe209, as well as a hydrophobic interaction with Met21 (Fig. 8). A notable observation is the rotation and movement of the side-chain of Phe209 (typically Tyr in AKRs) by ~1Å from its position in the unliganded PdxI structure. This structural change allows for the π-stacking interaction between Phe209 and the nicotinamide ring of NADPH. Additionally, there is a hydrogen-bond interaction between the carboxamide of the nicotinamide and Ser162 (2.8 Å), as well as a bidentate hydrogen-bond interaction between the same carboxamide and the guanidinium group of Arg126 (~2.9 Å). These interactions are expected to play a crucial role in orienting the nicotinamide moiety towards PL in preparation for the hydride transfer process. Notably, in PdxI, Arg126 replaces the universally conserved catalytic tetrad His residue found in AKRs (Fig. 9). This replacement of His by Arg126 is here proposed to provide specificity and recognition of PL over other substrates, contributing to the unique characteristics of PdxI in relation to its substrate specificity.
Figure 9.

Multiple alignment of PdxI from various sources. The alignment was obtained using the Clustal Omega program of the EMBL’s European Bioinformatics Institute (https://www.ebi.ac.uk/Tools/msa/clustalo/). Protein sequences of the aligned pyridoxal reductases that are named after their accession numbers are from: PLR1|S_pom (S. pombe); PLR1_S_cer (S. cerevisiae); PdxI|E_col (E. coli); T_mar|5DAN (T. maritima; PDB: 5DAN); P_som|7MBF (P. somniferum; PDB: 7MBF); H_sap|3V36 (H. sapiens; PDB: 3V36). Residues highlighted in bold red are those of the catalytic tetrad, while those in bold black are residues mentioned in the text.
Most of the immediate residues surrounding the vitamer substrate (either PL or PN) only show minor movement upon binding. PL is sandwiched between Trp95 and Arg126, with Trp95 engaging in a face-to-face π-stacking interaction with PL, while Arg126 makes hydrogen-bond interactions with the methyl alcohol of PL (3.2 Å). Additionally, there is a close interaction between the NADPH nicotinamide and the methyl hydroxyl group of PL (3.1 Å). This interaction contributes to the stabilization of PL binding, and partially explains the requirement of NADPH for PL binding. The collective interactions between PL, NADPH nicotinamide, and the protein ensure that both PL and nicotinamide are optimally positioned in proximity to facilitate catalysis. Notably, the NADPH hydrogen-donating atom and the carbonyl carbon of PL are separated at a distance of 3.1 Å. Similar distance between NADPH and other carbonyl substrates have been reported in AKRs [34].
In AKRs, the carbonyl substrate and the NADPH nicotinamide moiety are positioned in close proximity to the four highly conserved catalytic tetrad residues: Asp, Tyr, Lys and His [34–39]. In the PdxI structure, Asp, Tyr and Lys residues are strictly conserved (specifically Asp54, Tyr59, Lys84), while the His residue in AKRs is replaced by Arg126 in PdxI (Figs. 8 and 9). The arrangement of the Tyr and His residues, together with the nicotinamide moiety of NADPH, creates an anion hole that facilitates the reduction of the aldehyde or ketone substrate to the corresponding alcohol [33, 40]. The Tyr residue has been proposed to donate a proton to the carbonyl substrate during catalysis, while the Asp and Lys residues play a role in lowering the pKa of the Tyr residue, thereby facilitating proton donation [31]. Upon superposition with the ternary AKR-NADP+-GAL complex (PDB: 3V36), some positional differences of Tyr59 can be observed (Fig. 10). Nevertheless, in both structures the phenoxy hydroxyl group of Tyr59 forms hydrogen-bond interactions with the respective substrates. In PdxI, the interaction is between the hydroxyl group of Tyr59 and the carbonyl oxygen atom of PL (3.4 Å).
Figure 10.

PdxI catalytic pocket. Superposition of the catalytic tetrads of the ternary PdxI-NADPH-PL complex (gray) and AKR-NADP-GAL complex (3V36) (cyan). All the catalytic residues are strictly conserved in both structures except residue 126, which is Arg in PdxI and His in 3V36. The figure was generated using PyMOL (Version 2.0 Schrödinger, LLC., New York, NY, USA).
Of particular interest is the different position of the side-chains of Arg126 in PdxI compared to the corresponding His residue in other AKRs (Fig. 10), which is associated with substrate specificity. In the AKR-NADP+-GAL ternary complex, His126 is located beneath D-glyceraldehyde, making a hydrogen-bond interaction with this substrate (Fig. 10B). In PdxI, the side-chain of Arg126 must have a different orientation to avoid steric clashes with PL. Nonetheless, Arg126 remains in close proximity with PL, forming a hydrogen-bond interaction with the methyl hydroxyl of PL (3.1 Å) (Fig. 10). It is clear from the PdxI crystal structure that if position 126 was occupied by a His residue, which lacks the ability to rotate like Arg, it would result in steric hindrance with the methyl hydroxyl of PL. This would prevent PL from attaining an optimal catalytic position. A multiple alignment including E. coli PdxI and yeast pyridoxal reductases, that however have a low percentage of identity with PdxI (around 22%), shows that an Arg residue is actually present in a position that closely corresponds to that of Arg126 (Fig. 9). We found that in a superimposition of 3D AlphaFold models (https://alphafold.ebi.ac.uk/) of pyridoxal reductases from Schizosaccharomyces pombe (UniProtKB/Swiss-Prot: O14295) and Saccharomyces cerevisiae (PLR1; UniProtKB/Swiss-Prot: Q06494) [21], belonging to the AKR family 8 [22], with PdxI, an arginine residue is present in correspondence of Arg126. This suggests that the substitution of His with Arg may be crucial for determining the specificity for PL. Additionally, other residues surrounding PL, including Lys84, Met128, Phe58 and Met21, particularly the latter three non-conserved residues, may also contribute to substrate specificity.
Effect of vitamer supplementation on bacterial growth and gene expression
We compared the bacterial growth of wild type and pdxI knockout E. coli strains in the BW25113 background in M9 glucose-based minimal growth medium, and tested the effects of PL and PN supplementation (Fig. 11). In all conditions, the pdxI strain showed a longer lag with respect to wild type (3h vs 1h; Fig. 11A). Moreover, the effect of PL and PN supplementation on growth was quite different in the two strains. A small concentration of PL (up to 0.1 mM) is beneficial to the growth of the wild type strain (Fig. 11A). Increasing PL concentration up to 1 mM abolish this beneficial effect, and higher concentrations become toxic: 1.4 mM PL has a negative effect on bacterial growth, a huge lag is observed with 2 mM PL, and a complete arrest of growth is observed when the medium contains 2.5 mM PL (Fig. 11B). PN supplementation also shows a beneficial effect up to 1 mM concentration, while no toxic effect is observed even at 10 mM concentration (Fig. 11A and 11B). The beneficial effect of low concentrations of PL and PN are not visible in the pdxI strain (Fig. 11C). The pdxI strain also appears less tolerant to high PL concentrations: in fact, toxicity of PL is observed at 1 mM concentration and bacterial growth is nearly arrested with 2 mM PL (Fig. 11C).
Figure 11.

Effect of PL and PN supplementation on the E. coli BW25113 wild type and pdxI knock out strains. Growth curves of wild type and pdxI knock out strains were obtained by measuring the optical density at 600 nm. The E. coli strains were grown in M9 minimal medium containing 0.4% glucose as sole carbon source supplemented with PL or PN, at the indicated concentrations. Each curve represents the average ± SEM of 3 independent experiments each performed in triplicate. The continuous line results from fitting to a four-parameters growth equation. A) comparison of growth curves obtained with wild type and pdxI strains in M9 minimal medium supplemented with either 0.1 mM PL or PN. The effect of higher concentrations of either PN or PL on both strains are shown in panels B (wild type) and C (pdxI).
We measured the content of PL, PN, PLP and PNP vitamers in cell extracts of wild type and pdxI strains grown to late exponential phase in M9 glucose-based minimal medium supplemented or without either PL or PN (Fig. 12A and 12B). In both strains grown in unsuplemented medium, intracellular PN and PL levels are either very low or undetectable. Supplementation with an increasing concentration of PL, from 1 μM up to the toxic concentration of 1.5 mM, determines a progressive increase of intracellular PL, which in the wild type strain is paralleled by an increase in PN (Fig. 12A). As expected, such PN increase is not observed in pdxI (Fig. 12B), which is not able to convert PL into PN and as a consequence further accumulates PL. However, in both strains, the increasing supplementation of PL results in a gradual, moderate increase of PLP, whose levels seem to stabilize at constant values when supplemented PL reaches concentration above 1 mM. The same behaviour is seen with PNP, which however reaches much lower levels than PLP. Supplementation with 0.1 mM PN results in a large increase of intracellular PN in both strains, against a PL level that only undergoes a minimal increase. As an apparent consequence of this increase in PN, PLP levels rise significantly (by 1.5/1.8-fold), although this increase is far lower than that observed for PN. PNP, which in unsuplemented medium is barely detectable, also undergoes a statistically significant increase in both WT and pdxI strains.
Figure 12.

Measurement of B6 vitamers levels in cell extracts. E. coli BW25113 wild type (A) and pdxI knock out (B) strains were grown to late exponential phase in M9 glucose-based minimal medium, or M9 supplemented with either PL (from 1 μM to 1.5 mM) or 0.1 mM PN. Vitamers were measured as explained in Materials and methods, and normalized on the basis of the amount of total cellular proteins. Each bar represents the average ± SEM of 3 independent experiments each performed in duplicate. Statistical significance was determined using the Student’s t-test. P values are < 0.0005 (***), < 0.005 (**), and < 0.05 (*). Measurements of intracellular vitamin B6 levels were also carried out at time intervals after addition of 0.1 mM PL to wild type (C) and pdxI (D) cells, as detailed in the methods section. Experimental values are the average ± SEM of 3 independent experiments each performed in duplicate.
In the attempt to follow the conversion of supplemented PL into the other vitamers once they enter the cell, experiments were conducted in which bacteria were grown to late exponential phase in M9 glucose-based minimal medium and 0.1 mM PL was added to the growth medium. Then, at time intervals (from 5 to 50 minutes), aliquots of the culture were centrifuged, the cells lysed and the vitamers measured. Concerning the wild type strain, it is clear that PL enters the cells (Fig. 12C) and is converted into PN and PNP. PLP formation is much slower and shows a lag. Different results are seen with the pdxI strain. In this case, as expected, once PL has entered the cell it is not converted into PN, whose levels remain undetectable. However, PLP increase is faster than what observed with the wild type strain, but also reaches a lower level. PNP levels stay low and constant (Fig. 12D).
It is clear that the PdxK and PdxY kinases play a crucial role in recycling exogenous PL. This aspect was analysed in depth by measuring B6 vitamers in experiments in which knockout strains were grown in M9 medium supplemented with PL. Compared to the wild type strain, the growth of the pdxK strain (which is still able to express PdxY) has a bigger lag (about 4 h), although the ODmax reaches the same level (Fig. 13). The growth curve of the pdxY strain (which is still able to express PdxK) also shows a prolonged lag, but it reaches an ODmax that is higher than that of the wild type strain. The pdxKY strain has the same behaviour of the single pdxK strain. PL toxicity is observed in all these strains when this vitamer is supplemented at 1.4 mM concentration or higher. The prolonged lag observed in the growth of all these strains highlight the importance of both kinases in vitamin B6 recycling pathway. As observed in the wild type strain, PL supplementation in the pdxK strain results in high levels of intracellular PL and PN (Fig. 14). However, in this case PNP remains under the detection level even upon supplementation with PL. On the other hand, PLP levels, similar to those of wild type when the bacteria were grown in unsuplemented medium, seem to increase, although not in a statistically significant way, upon PL supplementation. The behaviour observed with the pdxY strain is similar to that of the wild type strain, with the difference that PLP and PNP levels in all conditions are moderately lower in absolute terms. In the double knockout pdxKY strain, PLP levels in cells grown in unsuplemented medium are similar to those of wild type. It should be noticed that in this strain PLP can only come from the de novo DXP-dependent biosynthesis pathway. PN levels are unusually high compared to wild type. This latter feature may be a consequence of the complete absence of B6 vitamer kinases that prevents phosphorylation of PL and PN but does not affect conversion of PL into PN by PdxI. Interestingly, PL supplementation increases PL and PN cellular levels but has the effect of decreasing PLP, possibly as a consequence of a so far unknown mechanism of regulation of the DXP-dependent biosynthesis pathway that senses PL and PN levels. In the triple knockout pdxKYI strain grown in unsuplemented medium, PLP levels are lower than wild type, but the striking feature is an unusually high level of PL, that possibly comes from dephosphorylation of PLP, that cannot be converted back into PLP because of the complete block of the recycling pathway. Supplementation with PL results in its large accumulation in the cell, without the appearance of PN and PNP, and with a decrease in PLP, again possibly due to some effect on the DXP-dependent biosynthesis pathway.
Figure 13.

Effect of PL supplementation on the E. coli pdxK, pdxY, pdxKY and pdxKYI knock out strains. The E. coli strains were grown in M9 minimal medium containing 0.4% glucose supplemented with PL at the indicated concentrations. Growth curves were obtained by measuring the optical density at 600 nm. Each curve represents the average ± SEM of 3 independent experiments each performed in triplicate. The continuous lines result from fitting to a four-parameters growth equation described in Materials and Methods section.
Figure 14.

Comparison of B6 vitamers levels in cell extracts of E. coli BW25113 wild type, pdxK, pdxY, pdxKY and pdxKYI strains grown to late exponential phase in M9 glucose-based minimal medium, or M9 supplemented with PL (1 mM and 1.5 mM). Vitamers were measured as explained in Materials and methods, and normalized on the basis of the amount of total cellular proteins. Each bar represents the average ± SEM of 3 independent experiments each performed in duplicate. Statistical significance of measurements carried out in cell extracts of bacteria grown in the presence of PL with respect to the same strain grown in M9 glucose-based minimal medium was determined using the Student’s t-test. P values are < 0.0005 (***), < 0.005 (**), and < 0.05 (*). In the case of the mutant strains, statistical significance was also determined with respect to the wild-type strain grown in M9 glucose-based minimal medium using the Student’s t-test. In this latter case, P values are < 0.005 (°°), and < 0.05 (°).
We also analysed the relative expression of the genes involved in PLP biosynthesis and salvage pathways (pdxB, pdxJ, pdxH, pdxK, pdxY, ybhA and pdxI) by RT-qPCR in the E. coli BW25113 strain grown to exponential phase in M9 minimal medium containing or not containing either 0.1 mM PL or PN (Table 3). Only in the case of pdxI, supplementation of PL causes a small, but significant, increase of expression.
Table 3.
Relative expression level of vitamin B6 metabolism genes in E. coli BW25113 cells grown in glucose-based M9 minimal medium without supplementation or with 0.1 mM either PL or PN.
| Expression level | |||
|---|---|---|---|
| Gene | M9 | M9+PL | M9+PN |
| pdxB | 100% | 97% | 103% |
| pdxJ | 100% | 86% | 88% |
| pdxH | 100% | 110% | 95% |
| pdxK | 100% | 105% | 107% |
| pdxY | 100% | 118% | 115% |
| ybhA | 100% | 110% | 108% |
| pdxI | 100% | 134% (*) | 98% |
P-value, calculated using the Student’s t-test, was < 0.01 (*).
DISCUSSION
The catalytic activity of PdxI (originally annotated as YdbC) was first identified during the screening of 1,275 functionally uncharacterized E. coli proteins with a high-throughput mass spectrometry approach that led to the discovery of 241 potential novel enzymes, and was named after its capability to catalyse the NADPH-dependent reduction of PL to PN [23]. Other authors have already carried out a partial characterization of the catalytic properties of PdxI [24]. This previous investigation had missed the capability of PdxI to use in vitro NADH as dinucleotide substrate (although with a much higher KM with respect to NADPH) and PLP as aldehyde substrate (also in this case with a much higher KM with respect to PL), and to catalyse the oxidation of PN to PL using NADP+ as electron acceptor. Considering the results that we have obtained in this respect, we can assume that these capabilities of PdxI are unlikely to play a significant role in vivo.
Our equilibrium binding experiments, carried out by DSF and ITC, together with the kinetic and crystallographic analyses, are in agreement in showing that PdxI, as all AKRs [20], catalyses a sequential ordered bi-bi reaction, in which the dinucleotide substrate binds first and leaves last. The results obtained with ITC measurements indicate that binding of NADPH to form a binary complex is driven by bond formation resulting in a negative change of enthalpy, and is accompanied by a decrease of entropy of the system (Table 1). This suggests that a conformational change of the protein is taking place upon NADPH binding, which is needed to generate the PL binding site. Although our crystallographic analysis failed to provide the structural basis of this mechanism, as it did not reveal any major conformational differences among the unliganded, the binary PdxI-NADPH and the ternary PdxI-NADPH-PL complexes, it highlighted an important structural feature that seems associated with substrate specificity. In fact, in PdxI an Arg residue is present in the position where the His residue of the catalytic tetrad is found in all other AKRs (Fig. 8 and Fig. 10), and possibly provides specificity and recognition of PL over other substrates. As argued in the results section, this hypothesis is supported by the presence of a corresponding arginine residue in yeast pyridoxal reductase (PLR1). On the basis of the PdxI crystal structure, we propose a mechanism of PL reduction to PN, which is quite similar to the previously proposed AKR catalytic mechanism [20]. As shown in our ternary PdxI crystal structure (Fig. 8 and Fig. 10), as well as in the AKR-NADP+-GAL complex [32], Tyr59 is at hydrogen bond distance from the carbonyl oxygen of the substrate (~3 Å in both structures), and is therefore expected to act as an acid in protonating the oxyanion that forms following the hydride transfer from the nicotinamide to the carbonyl group (Fig. 15). Tyr59 also makes a hydrogen bond interaction with Lys84 (3.0 Å in both structures), which in turn makes a hydrogen bond interaction with Asp54 (~2.7 Å in both structures). Asp54 makes a hydrogen bond interaction with the nicotinamide ribose (~2.8 Å in both structures). These interactions are expected to lower the pKa of the phenolic oxygen of Tyr59, making for easy transfer of the proton to the PL carbonyl [20, 33, 38]. As noted above, NADPH and PL are optimally positioned relative to each other with a distance of 3.1Å between the NADPH hydride-donating carbon atom and the carbonyl carbon of PL for the transfer of hydride. A similar distance of 3.1 Å is also observed in AKR-NADP+-GAL between the glyceraldehyde carbonyl oxygen and the donor C4N atom of NADP+, and 2.9 Å from the OH group of the catalytic residue Tyr48 [32].
Figure 15.

Proposed reaction mechanisms of PdxI catalysis for the formation of PN from PL. The arrangement of catalytic residues and their interactions with the co-factor NADPH and the substrate PL, as observed in the structure of the PdxI-NADPH-PL complex. Hydrogen bonds interactions are shown as dashed lines.
The crucial role played by PdxI in vitamin B6 recycling pathway has been first suggested by Ito and Downs [24]. These authors proposed that PL would be converted into PLP via a detoured, much longer route than previously assumed. Under this hypothesis, instead of being directly converted into PLP by the vitamin B6 kinases, PL would be preferentially converted to PN by PdxI, phosphorylated to PNP by PdxK, and then oxidised to PLP by PdxH (Scheme 1). Our results show that this is actually the main stream pathway for PL conversion into PLP when this vitamer is supplemented in the medium, and that PdxK plays a fundamental role in making this happen. We showed that supplemented PL, once entered the cell, is rapidly converted into PN and PNP. However, the further conversion of PNP into PLP is much slower (Fig. 12C), most probably because of the very low kcat of PdxH [41]. On the other hand, in a pdxI strain, PL is actually directly and more rapidly converted into PLP by the kinases, although in this case PLP reaches lower levels (Fig. 12D). We show that the knockout of the pdxI gene results in a prolonged lag in the growth curve with respect to wild type (3h vs 1h; Fig. 11A) when bacteria are grown in a M9 glucose-based minimal medium. This observation reveals that PdxI is not only pivotal to PL salvage when this vitamer is supplemented in the medium, but it plays an important basic role in the recycling of vitamin B6 that is necessary to the normal turnover of cellular B6 vitamers. On the other hand, we show that PL supplementation causes the overexpression of pdxI to cope with the increase availability of this vitamer (Table 3).
Measurements of B6 vitamers in wild type and pdxI strains cast doubts on whether the accumulation of PLP is actually responsible for the toxic effect observed upon PL supplementation, as suggested by other authors [16]. A substantial increase of PLP levels is observed when both strains are grown in minimal medium supplemented with a toxic concentration of PL that significantly slows cell growth (Fig. 12). However, a similar increase of PLP is also observed when 0.1 mM PN is added to the medium, which has no toxic effect on growth. Likewise, it seems implausible that PNP accumulation is responsible for the toxic effect of PL, since supplementation with 0.1 mM PN (that does not have toxic effects) leads to an increased PNP level that is comparable to that obtained with supplementation of 1.5 mM PL (that causes a toxic effect). Moreover, our experiments also show that, in both the wild type and pdxI strains, PL supplementation up to 1 mM (a non-toxic concentration), causes an increase in PLP and PNP that reach a maximum level that is not exceeded even by a further increase of PL in the medium, which instead causes a large increase in intracellular PL. The observation that the pdxI strain is less tolerant to toxic PL concentration, coupled with the fact that the same strain accumulates more PL than the wild type strain, suggests that PL itself, or a metabolite deriving from it, is responsible for the toxicity. It should be noticed that PL levels increase about 800-fold in the wild type strain and about 3400-fold in pdxI strain when the medium is supplemented with 1.5 mM PL. This view is corroborated by our findings with the pdxK, pdxY and pdxKY strains. In all these strains PL toxicity is evident with 1.4 mM PL supplementation, while PLP levels keep below those measured with the wild type strain.
The importance of PdxK and PdxY kinases in the vitamin B6 recycling pathway is well highlighted by our findings that should be interpreted in the light of the results published by Winkler and collaborators, suggesting on a genetic basis that PdxY and PdxK are the only physiologically important B6 vitamer kinases in E. coli, and that PdxY is specific for PL whereas PdxK uses both PN and PL as substrates [18]. When the wild type strain is grown under PL supplementation, PN accumulates and PNP levels rise, causing a concomitant increase of PLP. In the same conditions, PNP is undetectable in the pdxK strain and only a moderate, not statistically significant, increase of PLP is observed (Fig. 14). This observation confirms that PdxY does not phosphorylate PN and points to a more relevant role of PdxK in PL salvage with respect to PdxY. This interpretation seems to be confirmed by the behaviour observed with the pdxY strain, which is very similar to that of the wild type. Considering that in the pdxKY and pdxKYI strains the only source of PLP is the DXP-dependent biosynthesis pathway, the observed decrease of PLP levels upon PL supplementation is, to our knowledge, the first evidence of some form of regulation of this biosynthesis pathway.
The question arises as to why the detoured and longer pathway of PL salvage mediated by PdxI takes place and is the preferential route in the conversion of PL into PLP. Here we show that the NADPH-dependent reduction of PL to PN is strongly favoured thermodynamically over the reverse reaction. This makes the PL to PN conversion basically irreversible, allocating PL for conversion to PLP via PdxK and PdxH. Yet, since PdxK and PdxY compete with PdxI for PL as substrate, the route followed by PL will depend on the relative concentrations of the three enzymes, their regulatory properties and kinetic parameters. It is known that PdxK is inhibited by both PL and PLP [42, 43]. However, when bacteria grow in unsuplemented minimal medium, intracellular PL levels are barely detectable and most PLP is expected to be bound to proteins. PdxK inhibition may therefore become more relevant under PL supplementation, directing this vitamer towards the PdxI-catalysed conversion into PN. A comparison between the kinetic parameters of PdxI (KM for PL = 38 μM; kcat = 58 s−1) and PdxK (KM for PL = 100 μM; kcat = 2.3 s−1; [17]) shows that, only on this basis, PL salvage through the PdxI route would be preferred. Unfortunately, the catalytic properties and kinetic parameters of PdxY are unknown, since the purified recombinant enzyme do not show any catalytic activity [44], making the role of this kinase in the recycling pathway unclear and mysterious. All these observations, combined with the inefficient action of PdxY on PL salvage outlined by our experiments, explain the prevalence of the longer route of PL salvage involving PdxI under PL supplementation. We have shown that PdxH activity is under fine allosteric control by PLP acting as a retroactive inhibitor [45, 46]. From this point of view, directing PL towards PN and thus the action of PdxH could be a way to limit the accumulation of PL and at the same time regulate PLP formation.
Materials and methods
Materials and media for bacterial growth
Ingredients for bacterial growth, chemicals and enzyme substrates in pure form were from Merck, (Darmstadt, Germany). PNP was obtained from pyridoxal 5-phosphate (98% pure; Merck) according to the method of Kazarinoff and McCormick [47]. HisTrap affinity columns (Ni-NTA) for purification of the 6xHis-tagged protein were from Cytiva (Marlborough, MA, USA). Bacteria were grown in Luria- Bertani (LB) (Tryptone 10g L− 1, Yeast extract 5g L− 1, NaCl 10g L− 1) or M9 minimal medium (Cold Spring Harbor Protocols, Cold Spring Harbor, NY, USA) at 37°C, unless otherwise specified. Growth media were solidified with agar (17 g L− 1) for the preparation of plates.
Expression and purification of E. coli PdxI
The coding sequence of pdxI was amplified by PCR using the primers PdxI-for (5’-ATTCCATATGAGCAGCAATACATTTACTCTCG-3’) and PdxI-rev (5’-CGGAATTCTTATTCTCGCGAAATACCATCC-3’), genomic DNA from E. coli BW25113 as template and Q5® High-Fidelity DNA Polymerase (New England Biolabs, Ipswich, MA, USA). The amplicon was inserted into a pET28b(+) vector between NdeI and EcoRI restriction sites to obtain the pET28pdxI plasmid, which allows the expression of PdxI with a His-tag at the N-terminal end.
For the purification, an overnight culture (40 mL) of E. coli HMS174(DE3) cells transformed with pET28pdxI plasmid was used to inoculate 4 L of LB medium, containing kanamycin (40 μg mL−1). Bacteria were allowed to grow at 37°C until their OD600 reached to ~ 0.6, then the growing temperature was lowered to 28°C and the expression of PdxI induced with 0.2 mM isopropyl thio-β-D-galactoside (IPTG). Bacteria were harvested after 18 h and suspended in 50 mL of 20 mM KPi pH 7.3 buffer containing 2 mg/mL lysozyme. Cell lysis was carried out with three freezing/defrosting cycles and by sonication on ice (3-min in short 20-s pulses with 20-s intervals). Lysate was centrifuged at 12000 g for 30 min and the supernatant was loaded onto a 10 mL Ni-NTA Superflow (QIAGEN, Germantown, MD) column, previously equilibrated with 20 mM KPi pH 7.3 containing 150 mM NaCl (buffer A), the column was washed with 50 mL of buffer A and eluted with a linear 0 to 500 mM imidazole gradient (the buffer containing imidazole was adjusted to pH 7.3 using HCl). Fractions containing PdxI, as judged by SDS-PAGE analysis, were collected and dialyzed against buffer A. Recombinant PdxI with the His tag has a molecular weight of 32869 Da and the concentration was calculated using a theoretical extinction coefficient at 280 nm of 19940 M−1 cm−1 (calculated with the Expasy PROTPARAM tool; http://web.expasy.org/protparam).
Analytical ultracentrifuge (AUC) analysis
A sedimentation velocity (SV) experiment using absorbance and interference detectors was carried out using a Proteome Lab XL-I analytical ultracentrifuge (AUC; Beckman Coulter, Brea, CA, USA) as previously described [48]. PdxI (1.5 mg) in 0.1 M Tris-HCl and 0.15 M NaCl was loaded into AUC cell assemblies in PBS, pH 7.4 and centrifuged at 40,000 rpm, for 9h at 20°C. The resulting SV data was analysed using the continuous c(s) module in SEDFIT version16.36 as described in Schuck et al. [49].
Differential Scanning Fluorimetry (DSF) assays
DSF assays were performed on a Real Time PCR Instrument (CFX Connect Real Time PCR system, Bio-Rad, Hercules, CA, USA). In a typical experiment, 2 μM PdxI in 20 mM KPi pH 7.3, and Sypro Orange (5x, Thermo Scientific, Waltham, MA, USA) were mixed with various ligands (total volume of 25 μL) in a 96-well PCR plate. Fluorescence was measured from 25 °C to 95 °C in 0.4 °C/30 sec steps (excitation 450–490 nm; detection 560–580 nm). All samples were run in triplicate. Denaturation profiles were analyzed as described in [50].
Isothermal calorimetry (ITC)
The binding affinity between PdxI and its substrates (NADPH and/or PL), products (PN and/or NADP+) or PLP were measured using the MICROCAL PEAQ-ITC isothermal titration calorimeter (Malvern Panalytical, Malvern, UK). To optimize the experimental conditions, a series of preliminary assays were conducted at three different temperatures: 20°C, 25°C, and 30°C, and 20°C was determined to be the most suitable for conducting the PdxI experiments. Additionally, buffer-to-buffer and buffer-to-reactants experiments were performed to select the optimal buffer system. PdxI was subjected to dialysis in a buffer solution consisting of 50 mM K2HPO4, 150 mM NaCl, at pH 7.4. The protein was subsequently used as the cell component at concentration of either 22 or 25 μM. The ITC experiments were conducted by employing NADPH, NADP+, PL, PLP or PN as the titrant, which were freshly prepared in the PdxI dialysis buffer and then introduced into the syringe at a 20-fold concentration compared to PdxI (440 or 500 μM, respectively). In another set of experiments, PdxI was incubated with either NADPH or NADP+ at equimolar concentrations for a duration of 30 minutes. Subsequently, PL, PLP or PN was titrated at a 10-fold concentration compared to that of the protein. These concentrations were carefully chosen to ensure an appropriate stoichiometry for the ITC analysis.
Measurements of B6 vitamers by HPLC
Separation and quantification of vitamers substrates and products of PdxI reaction were performed using mixtures containing 200 μM PL, PN, PLP or PNP, 400 μM NADPH, NADH or NADP+ and 0.2 or 1 μM PdxI. Aliquots of reaction were stopped by adding 4M KOH, then 25% HClO4 was added and the mixture was centrifuged. The supernatant diluted in H2O was analysed by HPLC. For the measurement of vitamers in bacterial cells, the pellet, collected from 10 ml of bacterial cultures grown in the indicated conditions, was resuspended in 100 μl 50 mM KPi, pH 7.5 and sonicated. An aliquot of supernatant was used to determine the total protein concentration with Bradford assay, whereas the rest was treated with 4M KOH and 25% HClO4. The mixture was centrifuged and an aliquot analysed by HPLC. The separation of vitamers was performed using an HPLC system (Vanquish Core, ThermoFisher Scientific), equipped with both an UV (290 and 340 nm) and a fluorescence detector (excitation 290 nm, emission 395 nm), and using a C18 Acclaim column (4.6 × 150 mm, particle size 5μm, ThermoFisher Scientific) with 33 mM phosphoric acid and 8 mM 1-octanesulfonic acid, adjusted to pH 2.2 with KOH, as mobile phase A, and 80% acetonitrile (vol/vol), as mobile phase B. The linear gradient was from 1% mobile phase B to 2% B for 5 min, 2% B to 20% B for 10 min, 20% B to 30% B for 5 min, and 30% B to 90% B for 5 min. For quantification of vitamers, 10 μM pure PL, PN, PLP or PNP, treated as the samples, were used as standard.
Kinetic studies and data analysis
Kinetic measurements were performed at 37 °C in 20 mM KPi pH 7.3 using a Hewlett-Packard 8453 diode-array spectrophotometer (Agilent Technologies, Santa Clara, CA, USA). Concentration of vitamer substrates were calculated as described in [51]. Reduction of either PL or PLP into PN and PNP, respectively, was evaluated by following oxidation of NADPH at 360 nm (as detailed in the text), using an extinction coefficient of 4227 M−1 cm−1. Experimental conditions are described in the main text and in the figure legends. Saturation curves obtained from initial velocity measurements carried out either in the absence or presence of product inhibitors were analysed using the Michaelis-Menten equation. The obtained values of apparent Vmax and KM were plotted and further analysed as detailed in the text. All data were analysed using the software Prism (GraphPad Software Inc., San Diego, CA).
Crystallization and structure determination
PdxI stock (21 mg/mL) was used to screen for initial crystallization conditions using a wide range of conditions with the Crystal Gryphon robot. Screening was performed at room temperature using the vapor diffusion technique. Best crystals of unliganded PdxI were obtained using the crystallization condition 0.1M MgCl2, 0.1M MES/NaOH, pH 6.5, and 30% PEG 400. Co-crystals of PdxI-NADPH complex were obtained by either co-crystallization with PdxI or soaking PdxI unliganded crystals with 11 mM of NADPH. Crystals of unliganded PdxI were also used to soak with PL (9 mM) for 9 hours to obtain the PdxI-PL complex, and crystals of PdxI-NADPH to soak with a mixture of NADPH and PL (11 mM each) to obtain the ternary PdxI-NADPH-PL complex. Crystals were cryoprotected using the mother liquid solution (0.1M MES/NaOH, pH 6.5, 30% PEG-400, and 0.1M MgCl2) plus 2 mM of the corresponding substrate before flash cooling in a cryogenic nitrogen stream. Diffraction data from the crystals were collected at 100 K using Rigaku MicroMax™ 007HF X-ray Generator, Eiger R 4M Detector and Oxford Cobra Cryo-system (The Woodlands, TX). The diffraction data was processed using the CrisAlisPro software (Rigaku) and the CCP4 suite of programs [52]. The unliganded PdxI structure was first solved using molecular replacement with the Phenix program [53, 54], and the crystal structure of aldo-keto reductase TM1743 from Thermotoga maritima (PDB: 5DAN) [29] as the search model. The structure was refined using Phenix and COOT [53, 54]. Subsequently, the unliganded structure was used to solve the structures of the binary PdxI-PL and PdxI-NADPH, and the ternary PdxI-NADPH-PL complexes. The structures were refined to resolutions of 2.0–2.3 Å.
Growth curves of E. coli BW25113 and its derivatives
The E. coli strains used in this work are: BW25113 (F− DE(araD-araB)567 lacZ4787(del)::rrnB-3 LAM− rph−1 DE(rhaD-rhaB)568 hsdR514) from the Coli Genetics Stock Center, pdxI, pdxK, pdxY (from Keio collection [55]), pdxKY and pdxKYI from [56]. The growth medium was Minimal medium M9 containing 0.4% glucose and the indicated vitamers. The temporal growth profile of all the E. coli strains was determined by measuring the optical density of cultures at 600 nm using a plate reader (ThermoScientific Multiskan GO). Each curve represents the average of 3 independent experiments each performed in triplicate and was fitted to a four-parameters growth equation.
where ODi is the OD600nm at time 0, ODf is the maximal OD600nm reached from the culture, r is the rate of growth, whereas l is the lag time.
Transcriptional analysis
RNA was isolated from three independent cultures (three biological replicates), grown to exponential or stationary phase, using the NucleoSpin RNA kit from Macherey and Nagel (Hoerdt Cedex, France). RNA quality and concentration were evaluated by measuring the OD at 260 nm and the 260/280 nm ratio in 0.1 M NaOH, and by electrophoresis on 1.2% agarose gels. RT-qPCR reactions were performed in two steps. Reverse transcription of DNase-treated RNAs (0.5 μg) was carried out using the OneScript® Plus cDNA Synthesis Kit (ABM, Richmond, BC, Canada) with the random primers provided in the kit. Real Time PCR was performed on a Real Time PCR Instrument (CFX Connect Real Time PCR system, Bio-Rad) with a two-step reaction using SYBR green ExcelTaq™ Master Mix (SMOBIO, Hsinchu, Taiwan) and the following oligonucleotides:
pdxB: ATTGGTTTTTCCGCTGCACC and CGCGCTGGACTAACTCATCC
pdxJ: TGACCATATCGCTACGCTGC and CCAGGCAGCAAAAATGTGGC
pdxH: ATGGTGGTCGCTACCGTGG and CTATCACGCGGGCGGCTATG
pdxK: TGCCGTGCCTGCTATCAAAC and AGGATGGTCTTTGCGTAGCG
pdxY: AATGGACTGGCTGCGTGATG and GCACATGAAACTCTGCGACACC
ybhA: GCTTCTCTGGCTGAAACGGC and AAGTTATCGCCGAATGCCACG
pdxI: CCCAGCGGAAGGATCGATTG and CCATCGTGGGCCAAAGCATC
The relative expression of each target gene was determined by the Pfaffl method using the recA gene as normalizer. The fold induction resulting from the different pairs of samples was averaged and the P-value was calculated using the Student’s t-test.
Acknowledgements:
this work was supported by grants from Istituto Pasteur Italia – Fondazione Cenci Bolognetti (Research Grant “Anna Tramontano” 2020) to RC, from Sapienza University of Rome (grants RM11916B51484C08, RM120172A76E4B78, RM12117A610B653E, RM122181618E2878 to RC), from the National Institutes of Health (GM129793 grant to MKS). Structural biology resources were provided by NIH Shared Instrumentation Grant S10-OD021756 to MKS.
Abbreviations:
- PN
pyridoxine
- PL
pyridoxal
- PM
pyridoxamine
- PLP
Pyridoxal 5’-phosphate
- PNP
Pyridoxine 5’-phosphate
- PdxI
pyridoxal reductase
- PL kinase
pyridoxal kinase
- PNPO
pyridoxine 5’-phosphate oxidase
- NADPH
reduced nicotinamide adenine dinucleotide phosphate
- NADP+
oxidised nicotinamide adenine dinucleotide phosphate
- NAD(P)H
either NADH or NADPH
- NADP(H)
either NADP+ or NADPH
Footnotes
Conflicts of interest: The authors declare that there is no conflict of interests regarding the publication of this paper.
Data availability statement
The atomic coordinates of the unliganded PdxI and of the PdxI-NADPH and PdxI-NADPH-PL complexes have been deposited in the Protein Data Bank as entries 8TE8, 8TEZ and 8TF1, respectively.
References
- 1.Percudani R & Peracchi A (2003) A genomic overview of pyridoxal-phosphate-dependent enzymes, EMBO Rep. 4, 850–4. [DOI] [PMC free article] [PubMed] [Google Scholar]
- 2.Lambrecht G, Braun K, Damer M, Ganso M, Hildebrandt C, Ullmann H, Kassack MU & Nickel P (2002) Structure-activity relationships of suramin and pyridoxal-5’-phosphate derivatives as P2 receptor antagonists, Curr Pharm Des. 8, 2371–99. [DOI] [PubMed] [Google Scholar]
- 3.Dakshinamurti K, Lal KJ & Ganguly PK (1998) Hypertension, calcium channel and pyridoxine (vitamin B6), Mol Cell Biochem. 188, 137–48. [PubMed] [Google Scholar]
- 4.Salhany JM, Rauenbuehler PB & Sloan RL (1987) Alterations in pyridoxal 5’-phosphate inhibition of human erythrocyte anion transport associated with osmotic hemolysis and resealing, J Biol Chem. 262, 15974–8. [PubMed] [Google Scholar]
- 5.Ehrenshaft M, Bilski P, Li MY, Chignell CF & Daub ME (1999) A highly conserved sequence is a novel gene involved in de novo vitamin B6 biosynthesis, Proc Natl Acad Sci U S A. 96, 9374–8. [DOI] [PMC free article] [PubMed] [Google Scholar]
- 6.Matxain JM, Padro D, Ristila M, Strid A & Eriksson LA (2009) Evidence of high *OH radical quenching efficiency by vitamin B6, J Phys Chem B. 113, 9629–32. [DOI] [PubMed] [Google Scholar]
- 7.Bilski P, Li MY, Ehrenshaft M, Daub ME & Chignell CF (2000) Vitamin B6 (pyridoxine) and its derivatives are efficient singlet oxygen quenchers and potential fungal antioxidants, Photochem Photobiol. 71, 129–34. [DOI] [PubMed] [Google Scholar]
- 8.Dell’Aglio E, Boycheva S & Fitzpatrick TB (2017) The pseudoenzyme PDX1.2 sustains vitamin B6 biosynthesis as a function of heat stress, Plant Physiol. [DOI] [PMC free article] [PubMed] [Google Scholar]
- 9.Knockel J, Muller IB, Butzloff S, Bergmann B, Walter RD & Wrenger C (2012) The antioxidative effect of de novo generated vitamin B6 in Plasmodium falciparum validated by protein interference, Biochem J. 443, 397–405. [DOI] [PubMed] [Google Scholar]
- 10.Grubman A, Phillips A, Thibonnier M, Kaparakis-Liaskos M, Johnson C, Thiberge JM, Radcliff FJ, Ecobichon C, Labigne A, de Reuse H, Mendz GL & Ferrero RL (2010) Vitamin B6 is required for full motility and virulence in Helicobacter pylori, MBio. 1. [DOI] [PMC free article] [PubMed] [Google Scholar]
- 11.Dick T, Manjunatha U, Kappes B & Gengenbacher M (2010) Vitamin B6 biosynthesis is essential for survival and virulence of Mycobacterium tuberculosis, Mol Microbiol. 78, 980–8. [DOI] [PubMed] [Google Scholar]
- 12.Xie F, Li G, Wang Y, Zhang Y, Zhou L, Wang C, Liu S, Liu S & Wang C (2017) Pyridoxal phosphate synthases PdxS/PdxT are required for Actinobacillus pleuropneumoniae viability, stress tolerance and virulence, PLoS One. 12, e0176374. [DOI] [PMC free article] [PubMed] [Google Scholar]
- 13.Tramonti A, Nardella C, di Salvo ML, Pascarella S & Contestabile R (2018) The MocR-like transcription factors: pyridoxal 5’-phosphate-dependent regulators of bacterial metabolism, FEBS J. 285, 3925–3944. [DOI] [PubMed] [Google Scholar]
- 14.Fitzpatrick TB, Amrhein N, Kappes B, Macheroux P, Tews I & Raschle T (2007) Two independent routes of de novo vitamin B6 biosynthesis: not that different after all, Biochem J. 407, 1–13. [DOI] [PubMed] [Google Scholar]
- 15.di Salvo ML, Contestabile R & Safo MK (2011) Vitamin B(6) salvage enzymes: mechanism, structure and regulation, Biochim Biophys Acta. 1814, 1597–608. [DOI] [PubMed] [Google Scholar]
- 16.Sugimoto R, Saito N, Shimada T & Tanaka K (2018) Identification of YbhA as the pyridoxal 5’-phosphate (PLP) phosphatase in Escherichia coli: Importance of PLP homeostasis on the bacterial growth, J Gen Appl Microbiol. 63, 362–368. [DOI] [PubMed] [Google Scholar]
- 17.di Salvo ML, Hunt S & Schirch V (2004) Expression, purification, and kinetic constants for human and Escherichia coli pyridoxal kinases, Protein Expr Purif. 36, 300–6. [DOI] [PubMed] [Google Scholar]
- 18.Yang Y, Tsui HC, Man TK & Winkler ME (1998) Identification and function of the pdxY gene, which encodes a novel pyridoxal kinase involved in the salvage pathway of pyridoxal 5’-phosphate biosynthesis in Escherichia coli K-12, J Bacteriol. 180, 1814–21. [DOI] [PMC free article] [PubMed] [Google Scholar]
- 19.Ito T & Downs DM (2020) Pyridoxal reductase, PdxI, is critical for salvage of pyridoxal in, J Bacteriol. [DOI] [PMC free article] [PubMed] [Google Scholar]
- 20.Penning TM (2015) The aldo-keto reductases (AKRs): Overview, Chem Biol Interact. 234, 236–46. [DOI] [PMC free article] [PubMed] [Google Scholar]
- 21.Guirard BM & Snell EE (1988) Physical and kinetic properties of a pyridoxal reductase purified from bakers’ yeast, Biofactors. 1, 187–92. [PubMed] [Google Scholar]
- 22.Nakano M, Morita T, Yamamoto T, Sano H, Ashiuchi M, Masui R, Kuramitsu S & Yagi T (1999) Purification, molecular cloning, and catalytic activity of Schizosaccharomyces pombe pyridoxal reductase. A possible additional family in the aldo-keto reductase superfamily, J Biol Chem. 274, 23185–90. [DOI] [PubMed] [Google Scholar]
- 23.Sevin DC, Fuhrer T, Zamboni N & Sauer U (2017) Nontargeted in vitro metabolomics for high-throughput identification of novel enzymes in Escherichia coli, Nat Methods. 14, 187–194. [DOI] [PubMed] [Google Scholar]
- 24.Ito T & Downs DM (2020) Pyridoxal Reductase, PdxI, Is Critical for Salvage of Pyridoxal in Escherichia coli, J Bacteriol. 202. [DOI] [PMC free article] [PubMed] [Google Scholar]
- 25.Morita T, Takegawa K & Yagi T (2004) Disruption of the plr1+ gene encoding pyridoxal reductase of Schizosaccharomyces pombe, J Biochem. 135, 225–30. [DOI] [PubMed] [Google Scholar]
- 26.Cornish-Bowden A (2012) Fundamentals of enzyme kinetics, 4th completely rev. and greatly enl. edn, Wiley-VCH, Weinheim. [Google Scholar]
- 27.Reiber H (1972) Photochemical reactions of vitamin B 6 compounds, isolation and properties of products, Biochim Biophys Acta. 279, 310–5. [DOI] [PubMed] [Google Scholar]
- 28.Waterhouse A, Bertoni M, Bienert S, Studer G, Tauriello G, Gumienny R, Heer FT, de Beer TAP, Rempfer C, Bordoli L, Lepore R & Schwede T (2018) SWISS-MODEL: homology modelling of protein structures and complexes, Nucleic Acids Res. 46, W296–W303. [DOI] [PMC free article] [PubMed] [Google Scholar]
- 29.Zhang C, Min Z, Liu X, Wang C, Wang Z, Shen J, Tang W, Zhang X, Liu D & Xu X (2020) Tolrestat acts atypically as a competitive inhibitor of the thermostable aldo-keto reductase Tm1743 from Thermotoga maritima, FEBS Lett. 594, 564–580. [DOI] [PubMed] [Google Scholar]
- 30.Lapthorn AJ, Zhu X & Ellis EM (2013) The diversity of microbial aldo/keto reductases from Escherichia coli K12, Chem Biol Interact. 202, 168–77. [DOI] [PubMed] [Google Scholar]
- 31.Jez JM, Bennett MJ, Schlegel BP, Lewis M & Penning TM (1997) Comparative anatomy of the aldo-keto reductase superfamily, Biochem J. 326 (Pt 3), 625–36. [DOI] [PMC free article] [PubMed] [Google Scholar]
- 32.Zheng X, Zhang L, Chen W, Chen Y, Xie W & Hu X (2012) Partial inhibition of aldose reductase by nitazoxanide and its molecular basis, ChemMedChem. 7, 1921–3. [DOI] [PubMed] [Google Scholar]
- 33.Harrison DH, Bohren KM, Ringe D, Petsko GA & Gabbay KH (1994) An anion binding site in human aldose reductase: mechanistic implications for the binding of citrate, cacodylate, and glucose 6-phosphate, Biochemistry. 33, 2011–20. [DOI] [PubMed] [Google Scholar]
- 34.Paidimuddala B, Mohapatra SB, Gummadi SN & Manoj N (2018) Crystal structure of yeast xylose reductase in complex with a novel NADP-DTT adduct provides insights into substrate recognition and catalysis, FEBS J. 285, 4445–4464. [DOI] [PubMed] [Google Scholar]
- 35.Wilson DK, Bohren KM, Gabbay KH & Quiocho FA (1992) An unlikely sugar substrate site in the 1.65 A structure of the human aldose reductase holoenzyme implicated in diabetic complications, Science. 257, 81–4. [DOI] [PubMed] [Google Scholar]
- 36.Chen M, Jin Y & Penning TM (2015) In-Depth Dissection of the P133R Mutation in Steroid 5beta-Reductase (AKR1D1): A Molecular Basis of Bile Acid Deficiency, Biochemistry. 54, 6343–51. [DOI] [PMC free article] [PubMed] [Google Scholar]
- 37.Chen M, Jin Y & Penning TM (2015) The rate-determining steps of aldo-keto reductases (AKRs), a study on human steroid 5beta-reductase (AKR1D1), Chem Biol Interact. 234, 360–5. [DOI] [PMC free article] [PubMed] [Google Scholar]
- 38.Sanli G, Dudley JI & Blaber M (2003) Structural biology of the aldo-keto reductase family of enzymes: catalysis and cofactor binding, Cell Biochem Biophys. 38, 79–101. [DOI] [PubMed] [Google Scholar]
- 39.Dreanic MP, Edge CM & Tuttle T (2017) New Insights into the Catalytic Mechanism of Aldose Reductase: A QM/MM Study, ACS Omega. 2, 5737–5747. [DOI] [PMC free article] [PubMed] [Google Scholar]
- 40.Carr SC, Torres MA, Morris JS, Facchini PJ & Ng KKS (2021) Structural studies of codeinone reductase reveal novel insights into aldo-keto reductase function in benzylisoquinoline alkaloid biosynthesis, J Biol Chem. 297, 101211. [DOI] [PMC free article] [PubMed] [Google Scholar]
- 41.Zhao G & Winkler ME (1995) Kinetic limitation and cellular amount of pyridoxine (pyridoxamine) 5’-phosphate oxidase of Escherichia coli K-12, J Bacteriol. 177, 883–91. [DOI] [PMC free article] [PubMed] [Google Scholar]
- 42.di Salvo ML, Nogues I, Parroni A, Tramonti A, Milano T, Pascarella S & Contestabile R (2015) On the mechanism of Escherichia coli pyridoxal kinase inhibition by pyridoxal and pyridoxal 5’-phosphate, Biochim Biophys Acta. 1854, 1160–6. [DOI] [PubMed] [Google Scholar]
- 43.Ghatge MS, Contestabile R, di Salvo ML, Desai JV, Gandhi AK, Camara CM, Florio R, Gonzalez IN, Parroni A, Schirch V & Safo MK (2012) Pyridoxal 5’-phosphate is a slow tight binding inhibitor of E. coli pyridoxal kinase, PLoS One. 7, e41680. [DOI] [PMC free article] [PubMed] [Google Scholar]
- 44.Safo MK, Musayev FN, Hunt S, di Salvo ML, Scarsdale N & Schirch V (2004) Crystal structure of the PdxY Protein from Escherichia coli, J Bacteriol. 186, 8074–82. [DOI] [PMC free article] [PubMed] [Google Scholar]
- 45.Barile A, Nogués I, di Salvo ML, Bunik V, Contestabile R & Tramonti A (2020) Molecular characterization of pyridoxine 5’-phosphate oxidase and its pathogenic forms associated with neonatal epileptic encephalopathy, Sci Rep. 10, 13621. [DOI] [PMC free article] [PubMed] [Google Scholar]
- 46.Barile A, Battista T, Fiorillo A, di Salvo ML, Malatesta F, Tramonti A, Ilari A & Contestabile R (2021) Identification and characterization of the pyridoxal 5’-phosphate allosteric site in Escherichia coli pyridoxine 5’-phosphate oxidase, J Biol Chem. 296, 100795. [DOI] [PMC free article] [PubMed] [Google Scholar]
- 47.Kazarinoff MN & McCormick DB (1975) Rabbit liver pyridoxamine (pyridoxine) 5’-phosphate oxidase. Purification and properties, J Biol Chem. 250, 3436–42. [PubMed] [Google Scholar]
- 48.Aljahdali AS, Musayev FN, Burgner JW 2nd, Ghatge MS, Shekar V, Zhang Y, Omar AM & Safo MK (2022) Molecular insight into 2-phosphoglycolate activation of the phosphatase activity of bisphosphoglycerate mutase, Acta Crystallogr D Struct Biol. 78, 472–482. [DOI] [PMC free article] [PubMed] [Google Scholar]
- 49.Schuck P, Zhao H, Brautigam CH & Ghirlando R (2016) Basic Principles of Analytical Ultracentrifugation, CRC Press. [Google Scholar]
- 50.Nardella C, Barile A, di Salvo ML, Milano T, Pascarella S, Tramonti A & Contestabile R (2020) Interaction of Bacillus subtilis GabR with the gabTD promoter: role of repeated sequences and effect of GABA in transcriptional activation, FEBS J. 287, 4952–4970. [DOI] [PubMed] [Google Scholar]
- 51.Peterson EA & Sober HA (1954) Preparation of Crystalline Phosphorylated Derivatives of Vitamin B6, J Am Chem Soc. 76, 161–169. [Google Scholar]
- 52.Winn MD, Ballard CC, Cowtan KD, Dodson EJ, Emsley P, Evans PR, Keegan RM, Krissinel EB, Leslie AG, McCoy A, McNicholas SJ, Murshudov GN, Pannu NS, Potterton EA, Powell HR, Read RJ, Vagin A & Wilson KS (2011) Overview of the CCP4 suite and current developments, Acta Crystallogr D Biol Crystallogr. 67, 235–42. [DOI] [PMC free article] [PubMed] [Google Scholar]
- 53.Echols N, Grosse-Kunstleve RW, Afonine PV, Bunkoczi G, Chen VB, Headd JJ, McCoy AJ, Moriarty NW, Read RJ, Richardson DC, Richardson JS, Terwilliger TC & Adams PD (2012) Graphical tools for macromolecular crystallography in PHENIX, J Appl Crystallogr. 45, 581–586. [DOI] [PMC free article] [PubMed] [Google Scholar]
- 54.Adams PD, Afonine PV, Bunkoczi G, Chen VB, Echols N, Headd JJ, Hung LW, Jain S, Kapral GJ, Grosse Kunstleve RW, McCoy AJ, Moriarty NW, Oeffner RD, Read RJ, Richardson DC, Richardson JS, Terwilliger TC & Zwart PH (2011) The Phenix software for automated determination of macromolecular structures, Methods. 55, 94–106. [DOI] [PMC free article] [PubMed] [Google Scholar]
- 55.Baba T, Ara T, Hasegawa M, Takai Y, Okumura Y, Baba M, Datsenko KA, Tomita M, Wanner BL & Mori H (2006) Construction of Escherichia coli K-12 in-frame, single-gene knockout mutants: the Keio collection, Mol Syst Biol. 2, 2006.0008. [DOI] [PMC free article] [PubMed] [Google Scholar]
- 56.Babor J, Tramonti A, Nardella C, Deutschbauer A, Contestabile R & de Crecy-Lagard V (2023) 4’-Deoxypyridoxine disrupts vitamin B(6) homeostasis in Escherichia coli K12 through combined inhibition of cumulative B(6) uptake and PLP-dependent enzyme activity, Microbiology (Reading). 169. [DOI] [PMC free article] [PubMed] [Google Scholar]
Associated Data
This section collects any data citations, data availability statements, or supplementary materials included in this article.
Data Availability Statement
The atomic coordinates of the unliganded PdxI and of the PdxI-NADPH and PdxI-NADPH-PL complexes have been deposited in the Protein Data Bank as entries 8TE8, 8TEZ and 8TF1, respectively.