

Abstract
CD247, also known as CD3ζ, is a crucial signaling molecule that transduces signals delivered by T cell receptor (TCR) through its 3 ITAMs. CD3ζ is required for successful thymocyte development. Three additional alternatively spliced variants of murine CD247 have been described, CD3ι, CD3θ, and CD3η, that differ from CD3ζ in the C-terminus such that the third ITAM is lost. Previous studies demonstrated defects in T cell development in mice expressing CD3η, but the TCR signaling pathways affected by CD3η and the impacts of the CD3ι and CD3θ on T cell development were not explored. Here we used a retrovirus-mediated gene transfer technique to express these three isoforms individually and examined the roles of them on T cell development and activation. Rag1−/− mice reconstituted with CD3θ-expressing bone marrow failed to develop mature T cells. CD3ι-expressing T cells exhibited similar development and activation as cells expressing CD3ζ. In contrast, thymic development was severely impaired in CD3η-reconstituted mice. Single positive but not double positive (DP) CD3η-expressing thymocytes had reduced TCR expression and CD5 expression was decreased at DP stage, suggesting a defect in positive selection. Peripheral CD3η-expressing T cells had expanded CD44Hi populations and upregulation of exhaustion markers seen by flow cytometry and RNA-Seq analysis. Analysis of early signaling events demonstrated significantly reduced activation of both PLCγ1 and Akt/mTOR signaling pathways. There was also a reduction in the frequency of activation of CD3η-expressing T cells. These studies reveal the importance of the CD3ζ C-terminal region in T cell development and activation.
Introduction
The α/β T cell receptor (TCR) recognizes antigen in the form of peptide bound to a major histocompatibility complex (pMHC) presented by antigen-presenting cells (APCs) (1, 2). The TCR complex also consists of six CD3 family members, one CD3γ, one CD3δ, two CD3ε and two CD3ζ, as transmembrane adaptor proteins to propagate signals from the triggered TCR (3). The key signaling element in all CD3 proteins is the immunoreceptor tyrosine-based activation motif (ITAM) (4, 5). The two tyrosine residues within an ITAM are phosphorylated upon TCR engagement with pMHC by the tyrosine kinase Lck, thus serving as docking sites for SH2 domain-containing proteins, such as tyrosine protein kinase Zap70. ITAM-bound Zap70, activated by Lck, then phosphorylates multiple tyrosine residues on the scaffold proteins, LAT and SLP-76, providing a platform to recruit many molecules that activate downstream signaling pathways required for the T cell response (6, 7).
As the initiation molecules of TCR-induced signaling, CD3γ, CD3δ, and CD3ε each contain one ITAM, while each CD3ζ contains three ITAMs. So, a CD3ζ dimer within the TCR complex possesses 6 of the 10 ITAMs in total, indicating its importance for optimal signal transduction. CD3ζ is one of four alternatively spliced variants of murine CD247 gene (8–12). CD3ζ is essential for the expression of TCR complex on the cell surface, as the surface level of TCR is markedly reduced in CD247−/− mice (13). It has been reported that CD247−/− mice have a significant reduction in numbers of CD4+CD8+ (double positive, DP), CD4+CD8− and CD4−CD8+ (single positive, SP) thymocytes (13–15).
Besides CD3ζ, CD247 RNA undergoes alternative splicing to generate several other splice variants, known as CD3ι, CD3θ, and CD3η. CD3ζ protein consists of 164 amino acids (aa), is the shortest of the four isoforms, and contains 3 canonical ITAMs. The other isoforms all differ from CD3ζ in the C-terminal region. CD3ι is 177 aa long and, although there are two tyrosine residues in the C-terminus, the spacing between these does not follow the consensus sequence of an ITAM. CD3θ has 188 aa and only one tyrosine residue in the C-terminal region. As the longest isoform of 206 aa, CD3η also has two ITAMs, and is missing the C-terminal ITAM (Fig. 1A). Although reduced TCR expression and impaired T cell development were observed in genetically modified mice that only express CD3η (16), the TCR-dependent signaling pathways remain obscure. In addition, the impacts of the other two isoforms, CD3ι and CD3θ, on T cell development and activation have yet to be explored. Here we used a retrovirus-mediated stem cell gene transfer technique to express these isoforms individually. Our data demonstrate that CD3θ-expressing thymocytes were blocked at an early developmental stage, and no peripheral T cells emerged. CD3ι-expressing T cells had almost normal development and activation, like that seen with CD3ζ. CD3η expression resulted in impaired thymocyte development, though mature T cells were observed peripherally at a reduced level. Peripheral mature CD3η-expressing T cells demonstrated an expansion of CD44Hi populations and overexpression of some T-cell exhaustion markers. PLCγ1 activation and Akt/mTOR signaling pathway were reduced in CD3η-expressing T cells following in vitro stimulation. The proportion of T cells induced to activate was negatively regulated by CD3η but those that did activate exhibited normal differentiation into T helper 1 (Th1) cells and proliferation. These studies illustrate the critical role for C-terminal region of CD247 isoforms on T cell development and activation.
Figure 1.
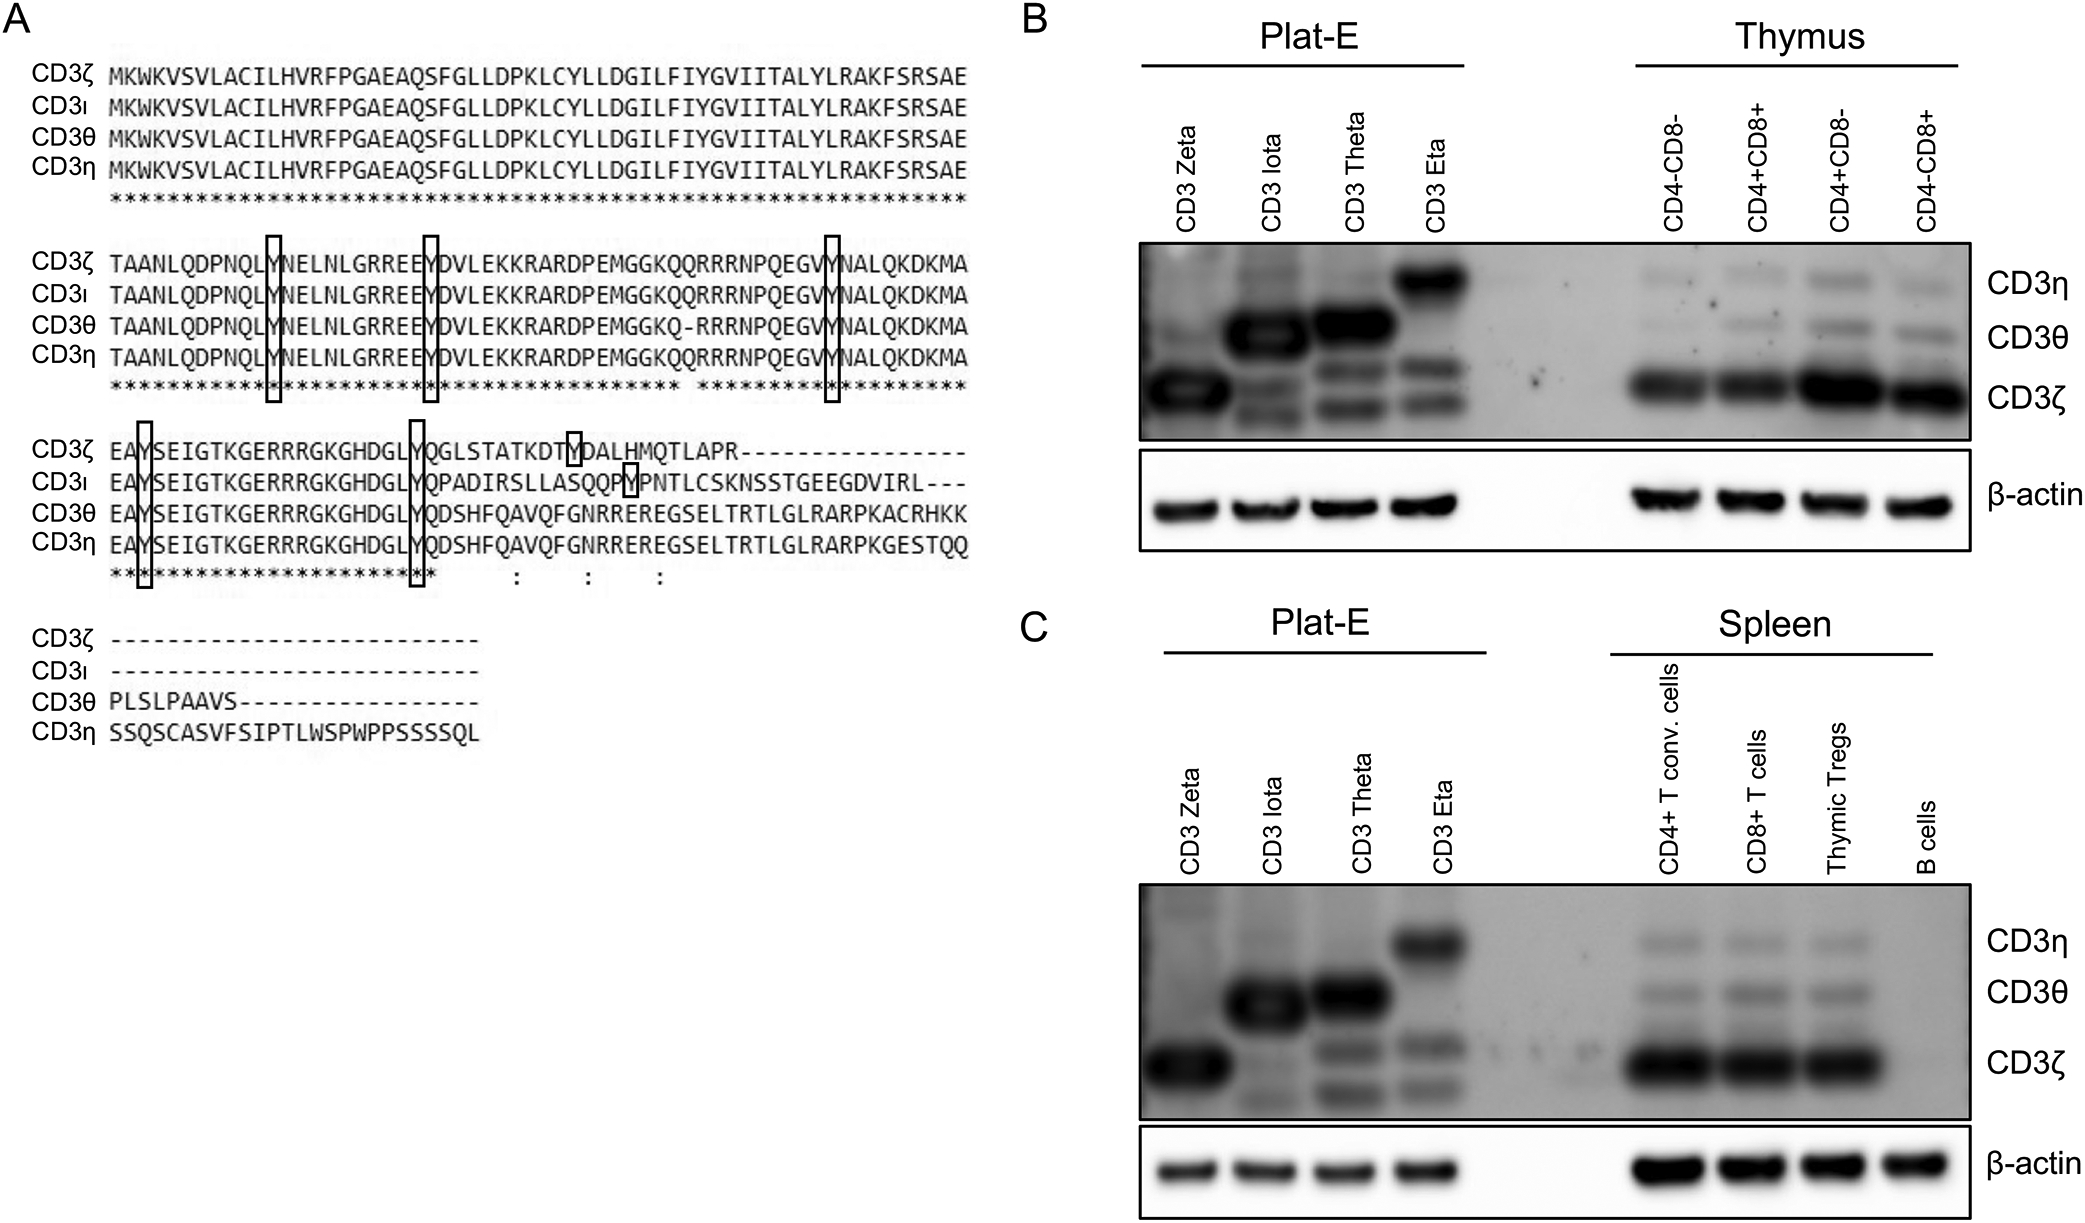
Sequence alignment and expression of CD247 splice variants. (A) Amino acid sequence alignment of CD3ζ, CD3ι. CD3θ, and CD3η; the four alternatively spliced variants of CD247. The position of the tyrosine residues in three ITAMS are shown in boxes. (B) Expression pattern of CD247 variants in the thymus. Thymic populations were sorted based on CD4 and CD8 expression. Western blot was performed using an antibody that recognizes all four isoforms. On the left is a Western blot analysis of Plat-E cells expressing individual variants, and blotted with the same antibody, to indicate the respective sizes of the variants. (C) Expression pattern of CD247 splice variants in sorted CD4+, CD8+ and Treg cells as determined by Western blot. B cells were included as a negative control. β-actin is used as a loading control. The blots shown are representative of three independent experiments.
Materials and Methods
Mice
CD247−/− mice (B6.129S4-Cd247tm1Lov/J) and Rag1−/− mice (B6.129S7-Rag1tm1Mom/J) were purchased from Jackson Laboratory. All mice were housed in specific pathogen-free facilities at the University of Pittsburgh. Mice were handled under Institutional Animal Care and Use Committee (IACUC)-approved protocols.
Cell lines and reagents
Platinum-E (Plat-E) retroviral packaging cell line and NIH/3T3 cell line were kind gifts from Dr. Dario Vignali (University of Pittsburgh). Both cell lines were cultured in high glucose DMEM supplemented with 10% fetal bovine serum (FBS), 100 units/mL penicillin, 100 μg/mL streptomycin, 4 mM L-Glutamine, 1 mM pyruvate, 20 mM HEPES, 100 μM nonessential amino acids and 55 μM β-Mercaptoethanol. Both cell lines were maintained at 37°C and 5% CO2.
Constructs and retroviral packaging
Murine stem cell virus (MSCV) retroviral vector and pCL-Eco packaging vector were obtained from Dr. Dario Vignali (University of Pittsburgh). DNA fragments of coding sequence of CD3ζ, CD3ι, CD3θ, and CD3η were synthesized (Integrated DNA Technologies), and were subcloned into MSCV vectors, which included the GFP reporter for CD3ζ and the mCherry reporter for the others. QIAGEN Plasmid Mega or Maxi kits were used to prepare plasmids. TransIT-LT1 transfection reagent (Mirus) were used to co-transfect MSCV vector and pCL-Eco vector into Plat-E retroviral packaging cell line according to the manufacturer’s instructions. Cell culture supernatants containing viral particles were collected 36 and 60 hours post transfection. Viral titers were determined by adding sequential diluted viral supernatant into cultured NIH 3T3 cells followed by flow cytometric analysis of the reporter expression.
Generation of retrogenic mice
5-Fluorouracil (Millipore Sigma, 0.15 mg/gram of weight) was injected into the peritoneum of CD247−/− mice. Three days later, the BM of CD247−/− mice was harvested and cultured in DMEM supplemented with 20% FBS and 50 μg/mL mIL-6, 20 μg/mL mIL-3, and 50 μg/mL mSCF (STEMCELL Technologies). On day 2, approximate 2 × 10⁶ bone marrow (BM) cells were mixed with viral supernatant (MOI=5) in each well of 6-well plates (Falcon). Those sealed plates were centrifuged at 1000 g, 37°C for 90 minutes. After centrifugation, viral supernatant was replaced with fresh culture medium supplemented with the 3 cytokines. These steps were repeated on the following day. After 3 days of culture the retrovirus-transduced BM cells were washed and resuspended in PBS and were injected via tail vein into irradiated (600 rad) Rag1−/− mice (2–3 × 10⁶/mouse). Tissues of reconstituted Rag1−/− mice were harvested approximately 8 weeks post intravenous injection.
Pan T-cell isolation and stimulation
Pan T cells were purified from spleens of reconstituted mice by using a negative selection kit (Miltenyi Biotec). Isolated T cells were plated at 1 × 10⁵ per well in U-bottom 96-well plates (Falcon). Cells were stimulated with 5 μg/mL plate-bound anti-CD3 (17A2, BioLegend) and 2 μg/mL soluble anti-CD28 (37.51, BioLegend) for no longer than 2 hours, or stimulated by 2 μg/mL plate-bound anti-CD3 and 1 μg/mL soluble anti-CD28 for 2 or 3 days. CellTrace CFSE or CellTrace Blue reagent (Thermo Fisher Scientific) was used to label isolated T cells for cell proliferation analysis. In order to enhance intracellular cytokine production and accumulation, T cells cultured in the 96-well plates were restimulated with 50 ng/mL phorbol 12-myristate 13-acetate (PMA) (Sigma-Aldrich) and 500 ng/mL ionomycin (Sigma-Aldrich) with endoplasmic reticulum (ER)-Golgi protein trafficking inhibitors brefeldin A (BD Biosciences) and monensin (BD Biosciences) for 2.5 hours before cell collection.
Flow cytometry
After red blood cell lysis or cell collection from plates, Fc block was performed by staining with anti-CD16/32 to avoid nonspecific binding. Zombie NIR Fixable Viability Kit (BioLegend) was used to distinguish live or dead cells. Surface staining was performed at 4°C for 30 minutes in PBS containing designated antibody cocktail. For intracellular staining of cytokine (IFN-γ) and transcription factor (T-bet), cells were fixed and permeabilized using Foxp3 Transcription Factor Staining Buffer Set (Thermo Fisher Scientific). For phosphorylated proteins (phospho-S6) staining, cells were fixed and permeabilized using Cytofix/Cytoperm Fixation Permeabilization Kit (BD Biosciences). All flow cytometric data were acquired on Aurora Full Spectrum Flow Cytometers (Cytek Biosciences) and analyzed by FlowJo software (v.10.8.1). The routine gating strategy is singlets/live cells/reporter-positive/B220-/CD4 x CD8. Flow antibodies used were as follows: B220 APC-eFluor 780 (RA3–6B2, eBioscience), TCRβ BV605 (H57–597, BD), CD4 BV786 (GK1.5, BD), CD8a PE-Cy5 (53–6.7, eBioscience), CD44 BUV737 (IM7, BD), CD62L BV650 (MEL-14, BD), CD25 PE-Cy7 (PC61, BD), GITR APC (DTA-1, eBioscience), CD5 PE (53–7.3, BD), PD-1 PE (RMP1–30, BioLegend), Tim3 BV421 (RMT3–23, BioLegend), T-bet PerCP-Cy5.5 (4B10, eBioscience), phospho-S6 (S235/236) APC (D57.2.2E, Cell Signaling Technology), IFN-γ Alexa Fluor 488 (XMG1.2, eBioscience).
Western blot
Cell lysates were prepared by using lysis buffer (#9803, Cell Signaling Technology). Western blot analyses were performed using antibodies (Cell Signaling Technology) against phospho-PLCγ1 (Y783) (D6M9S), phospho-Zap70 (Y319) (#2701), phospho-Erk1/2 (T202/Y204) (D13.14.4E), phospho-Akt (S473) (D9E), PLCγ1 (D9H10), Zap70 (99F2), Erk1/2 (#9102), Pan Akt (C67E7), β-actin (8H10D10), HRP-linked anti-rabbit IgG (#7074), HRP-linked anti-mouse IgG (#7076). Primary antibody targeting identical N-terminal region of all CD3ζ isoforms was purchased from Abcam (ab190728). 5% nonfat dry milk or 5% bovine serum albumin was used for blocking and antibody dilution. All images were acquired by ChemiDoc Imaging System (Bio-Rad).
Bulk RNA-Sequencing
Spleens from mice reconstituted with CD3ζ or CD3η-expressing BM were harvested on week 8 post donor cell transfer. After live/dead staining and surface staining was performed, reporter-positive CD4+ and CD8+ T cell subsets were sorted. All RNA molecules longer than 200 nucleotides from sorted cells was extracted using RNeasy Plus Mini Kit (QIAGEN). After a step of quality control, reverse transcription of isolated RNA was performed followed by cDNA amplification (Health Sciences Sequencing Core at Children’s Hospital of Pittsburgh). Sequencing libraries were prepared from 50 ng of cDNA and sequenced by Illumina NextSeq 500 High Output Kit using 100 bp paired-end. After initial QC and adapter trimming, the sequence data was quantified using Kallisto (17) to obtain transcript level abundances using mm10 (UCSC) as reference. Post quantification differentially expressed genes and transcripts between the CD3ζ or CD3η-expressing BM in CD4+ and CD8+ T cell subsets were identified using Sleuth (18). Significant differentially expressed transcripts were defined using a q-value (Benjamini-Hochberg adjusted p-value) threshold of <0.05. Over-representation analysis (ORA) were performed using clusterProfiler (19) R package to identify enrichment of the genes in specific pathways described in Kyoto Encyclopedia of Genes and Genomes (KEGG) (20) database.
Statistics
All statistics were calculated in the GraphPad Prism (v.9.5.1). Student’s t-test, one-way ANOVA or two-way ANOVA was used based upon various data sets.
Results
Thymic and splenic expression patterns of CD247 isoforms in wild-type (WT) mice
To examine the expression levels of the four isoforms, we performed Western blot analysis of thymic and splenic tissue using an antibody that recognizes a region that is conserved between the four isoforms. Western blot of Plat-E cells individually transduced with the four CD247 isoforms indicates the size differences between them (Fig. 1B). Thymic subsets were sorted based on the expression of CD4 and CD8. Western blot analysis showed that CD3ι was barely detectable (Fig. 1B). The protein expression of CD3θ or CD3η was reduced compared to CD3ζ throughout thymic development (Fig. 1B). We also compared the protein levels within splenic CD4+ T cells, CD8+ T cells and thymic-derived CD4+ regulatory T cells (Tregs). Again, we did not observe CD3ι protein (Fig. 1C). CD3ζ was expressed more abundantly than CD3θ and CD3η within these peripheral populations (Fig. 1C). Thus, CD3ζ is the predominant isoform expressed during development and in peripheral T cell populations.
Expression of CD3ζ rescued T cell development whereas CD3θ caused a severe defect
In order to dissect the roles of each individual CD247 gene isoform on T-cell development and activation, we utilized a retrovirus-mediated transgenic (retrogenic) method to ensure the expression of single CD247 isoform in hematopoietic stem cells (21). In general, CD247-deficient BM-derived cells, which were transduced with retroviruses carrying the coding region of one isoform, were transferred into sub-lethally irradiated Rag1 KO mice. We confirmed that there was no significant difference in transduction efficiency of BM among the four isoforms since we observed no significant difference in the percentages of reporter-positive B cells generated in these mice (Fig. S1A).
The total thymocyte number was significantly reduced in empty vector-reconstituted mice compared to those with CD3ζ expression (Fig. 2A). Although a high proportion of CD3ζ-deficient thymocytes progressed to the DP stage, most of them failed to proceed to SP stage, substantiating the requirement for CD3ζ during T-cell development (Fig. 2B,D). Like empty vector-reconstituted mice, mice reconstituted with CD3θ-expressing BM generated significantly fewer thymocytes (Fig. 2A). In contrast to empty vector controls, CD3θ expression led to an accumulation of thymocytes at the CD4−CD8− (double negative, DN) stage, a decrease in the proportion of DP thymocytes (Fig. 2B,C), and a more than 50-fold reduction in the numbers of SP thymocytes compared to CD3ζ (Fig. 2D). Within the DN population of CD3θ-expressing thymocytes, most cells were arrested at DN3 (CD44−CD25+) phase, resulting in a significant reduction in the percentage of thymocytes that proceeded to DN4 (CD44−CD25−) phase (Fig. 2E), suggesting a severe defect in the TCRβ-selection checkpoint caused by CD3θ. Empty vector-reconstituted mice had a normal distribution of DN populations, suggesting the defect occurred later in development (Fig. 2E). In addition, we performed Western blot analysis to confirm the expression of CD3θ protein in the thymic tissues of retrogenic mice (Fig. S1B). In general, CD3θ was unable to support the generation of mature thymocytes.
Figure 2.

CD3ζ rescues T cell development in CD247−/− BM whereas CD3θ causes a defective thymic development. (A) Total thymocyte numbers in retrogenic Rag1−/− mice reconstituted with CD247−/− BM transduced with empty vector, CD3ζ or CD3θ. (B) Representative flow cytometric analysis of CD4 and CD8 expression in the thymus from retrogenic mice reconstituted with empty vector, CD3ζ or CD3θ. Cells were first gated on expression of the relevant reporter in each case. (C) Quantification of the percentages of thymic populations in empty vector, CD3ζ or CD3θ mice. (D) The numbers of CD4 and CD8 SP thymocytes in retrogenic empty vector, CD3ζ or CD3θ mice. (E) Left, representative flow cytometric analysis of CD44 and CD25 expression in DN thymocytes from retrogenic mice reconstituted with empty vector, CD3ζ or CD3θ; right, quantification of the percentages of DN thymic populations in empty vector, CD3ζ or CD3θ mice. Each dot represents a single mouse and 3 mice per group were analyzed. Error bars, mean ± SEM; statistical analysis was determined by either one-way ANOVA (A) or two-way ANOVA (C,D,E) with Sidak post-test correction. *p<0.05, **p<0.01, ***p<0.001, ****p<0.0001.
No significant difference in the ability of CD3ζ and CD3ι to support T cell development and function
Next, we compared the roles of CD3ζ and CD3ι in thymic and peripheral lymphoid tissues. Our results showed that the total thymocyte number in CD3ζ or CD3ι-expressing mice was similar (Fig. 3A), and the percentages of thymocytes at DN, DP, SP stages were not significantly different (Fig. 3B). In addition, the proportions of thymocytes at four phases within DN stage between these two types of mice showed no discrepancy (Fig. 3C). In the periphery, both CD3ζ and CD3ι-reconstituted mice produced similar numbers of mature T cells (Fig. 3D). Surface TCRβ expression on either CD4+ or CD8+ T cells, and the proliferation of these T cell subsets in vitro were not different (Fig. 3E,F). It seems that CD3ζ and CD3ι had similar impacts on T cell development and activation, and that CD3ι was able to substitute for CD3ζ.
Figure 3.

CD3ι-expressing retrogenic mice have normal T cell development and function. (A) Total thymocyte numbers in retrogenic Rag1−/− mice reconstituted with CD247−/− BM expressing CD3ζ or CD3ι. (B) Left, representative flow cytometric analysis of CD4 and CD8 expression in the thymus from retrogenic mice expressing CD3ζ or CD3ι. Cells were first gated on expression of the relevant reporter in each case; right, summary of the percentages of thymic populations showing normal distribution in CD3ζ- and CD3ι-expressing retrogenic mice. (C) Left, representative flow cytometric analysis of CD44 and CD25 expression in DN thymocytes from retrogenic mice expressing CD3ζ or CD3ι; right, quantification of the percentages of DN thymic populations in CD3ζ or CD3ι mice. (D) The numbers of CD4+ and CD8+ T cells in spleen was determined following flow cytometry gated on reporter positive cells. (E) CD3ι-expressing CD4+ and CD8+ have normal levels of TCR expression as determined by the MFI of TCRβ expression. (F) Purified splenic T cells from CD3ζ or CD3ι retrogenic mice were labeled with cell trace blue and stimulated in vitro with anti-CD3 and anti-CD28 mAbs. After 3 days the cells were analyzed by flow cytometry for their proliferative response. Results shown are representative flow plots from three independent experiments. Each dot represents a single mouse and 3 mice per group were analyzed. Error bars, mean ± SEM; statistical analysis was determined by unpaired Student’s t-test (A) or two-way ANOVA (B-E) with Sidak post-test correction. ns: not significant.
CD3η impaired thymocyte development
The expression of CD3η resulted in an approximately 30-fold decrease in total thymocyte numbers (Fig. 4A), a reduced proportion of DP thymocytes (Fig. 4B), and significantly fewer CD4 SP and CD8 SP thymocytes (Fig. 4C). Further analysis showed that there was a significant increase in the proportion of CD3η-expressing thymocytes at DN1 (CD44+CD25−) phase along with a significant reduction of the DN4 population (Fig. 4D). In contrast to CD3θ-reconstituted mice, those reconstituted with CD3ζ or CD3η had equivalent percentages of the DN3 subset (Fig. 4D). Interestingly, we found that surface TCRβ expression was down-regulated by CD3η at the SP stage, but not at the DP stage (Fig. 4E), suggesting developmental defects during positive selection. In addition, we observed that the surface expression of CD5, an indicator for TCR signal strength (22, 23), was significantly reduced on CD3η-expressing DP thymocytes (Fig. 4F). We speculate that the developmental defects caused by CD3η are possibly due to insufficient TCR signal strength during positive selection.
Figure 4.

T cell development is abnormal in CD3η-expressing retrogenic mice. (A) Total thymocyte numbers in retrogenic Rag1−/− mice reconstituted with CD247−/− BM expressing CD3ζ or CD3η. (B) Left, representative flow cytometric analysis of CD4 and CD8 expression in the thymus from retrogenic mice expressing CD3ζ or CD3η. Cells were first gated on expression of the relevant reporter in each case; right, quantification of the percentages of thymic populations in CD3ζ or CD3η mice. (C) The numbers of CD4 and CD8 SP thymocytes in retrogenic CD3ζ or CD3η mice. (D) Representative flow cytometric analysis and quantification of the percentages of CD44 and CD25 expression in DN thymocytes from retrogenic mice expressing CD3ζ or CD3η. (E) Representative flow plot and the summary of TCRβ MFI in DP, CD4 and CD8 SP thymocytes in retrogenic CD3ζ or CD3η mice. (F) Quantification of CD5 MFI in DP thymocytes in retrogenic CD3ζ or CD3η mice. Results shown are the mean ± SEM of 5–9 mice per group and each dot represents a single retrogenic mouse. Statistical analysis was determined by unpaired Student’s t-test (A,F) or two-way ANOVA (B-E) with Sidak post-test correction. *p<0.05, **p<0.01, ****p<0.0001; ns: not significant.
Mature CD3η-expressing T cells displayed an CD44Hi phenotype at steady state
We noticed that the 2-fold reduction in CD3η-expressing splenic T cell numbers (Fig. 5A) was not as significant as the more than 10-fold decrease in CD3η-expressing SP thymocytes numbers (Fig. 4C). Intriguingly, phenotypic analysis of peripheral T cells revealed that CD3η-expressing T cells had expanded CD44HiCD62LLo populations within both CD4+ and CD8+ T cell compartments (Fig. 5B). The increase in the percentages of these effector T cells was accompanied by a reduction in the percentages of CD44LoCD62LHi naive T cells, suggesting the expansion of CD44Hi populations without exposure to foreign antigens. To further investigate this phenotype, we performed bulk RNA-Seq on sorted reporter-positive CD4+ and CD8+ T cells from the spleen of retrogenic mice expressing CD3η or CD3ζ. Principal component analysis (PCA) showed that the gene expression data can segregate CD3η-expressing CD4+ or CD8+ T cells samples from CD3ζ-expressing cells (Fig. 5C) indicating differences in their expression profiles. Further analysis revealed that 1066 and 2119 genes were differentially expressed in CD3η-expressing CD4+ (Suppl Table 1) and CD8+ (Suppl Table 2) T cells, respectively. Cell cycle related and immune-related genes are enriched in both CD3η-expressing CD4+ and CD8+ T cells as demonstrated by gene set over-representation analysis (Fig. 5D). Further analysis revealed that several T-cell exhaustion-related genes were expressed at a higher level in CD3η-expressing CD8+ T cells (Fig. 5E) and by statistical analysis of normalized expression levels (Fig. S1C). A caveat of these studies is that the differences in transcription that we are seeing may reflect the fact that starting phenotype of the cells is very different and the cells from two groups are at distinct differentiation stages.
Figure 5.
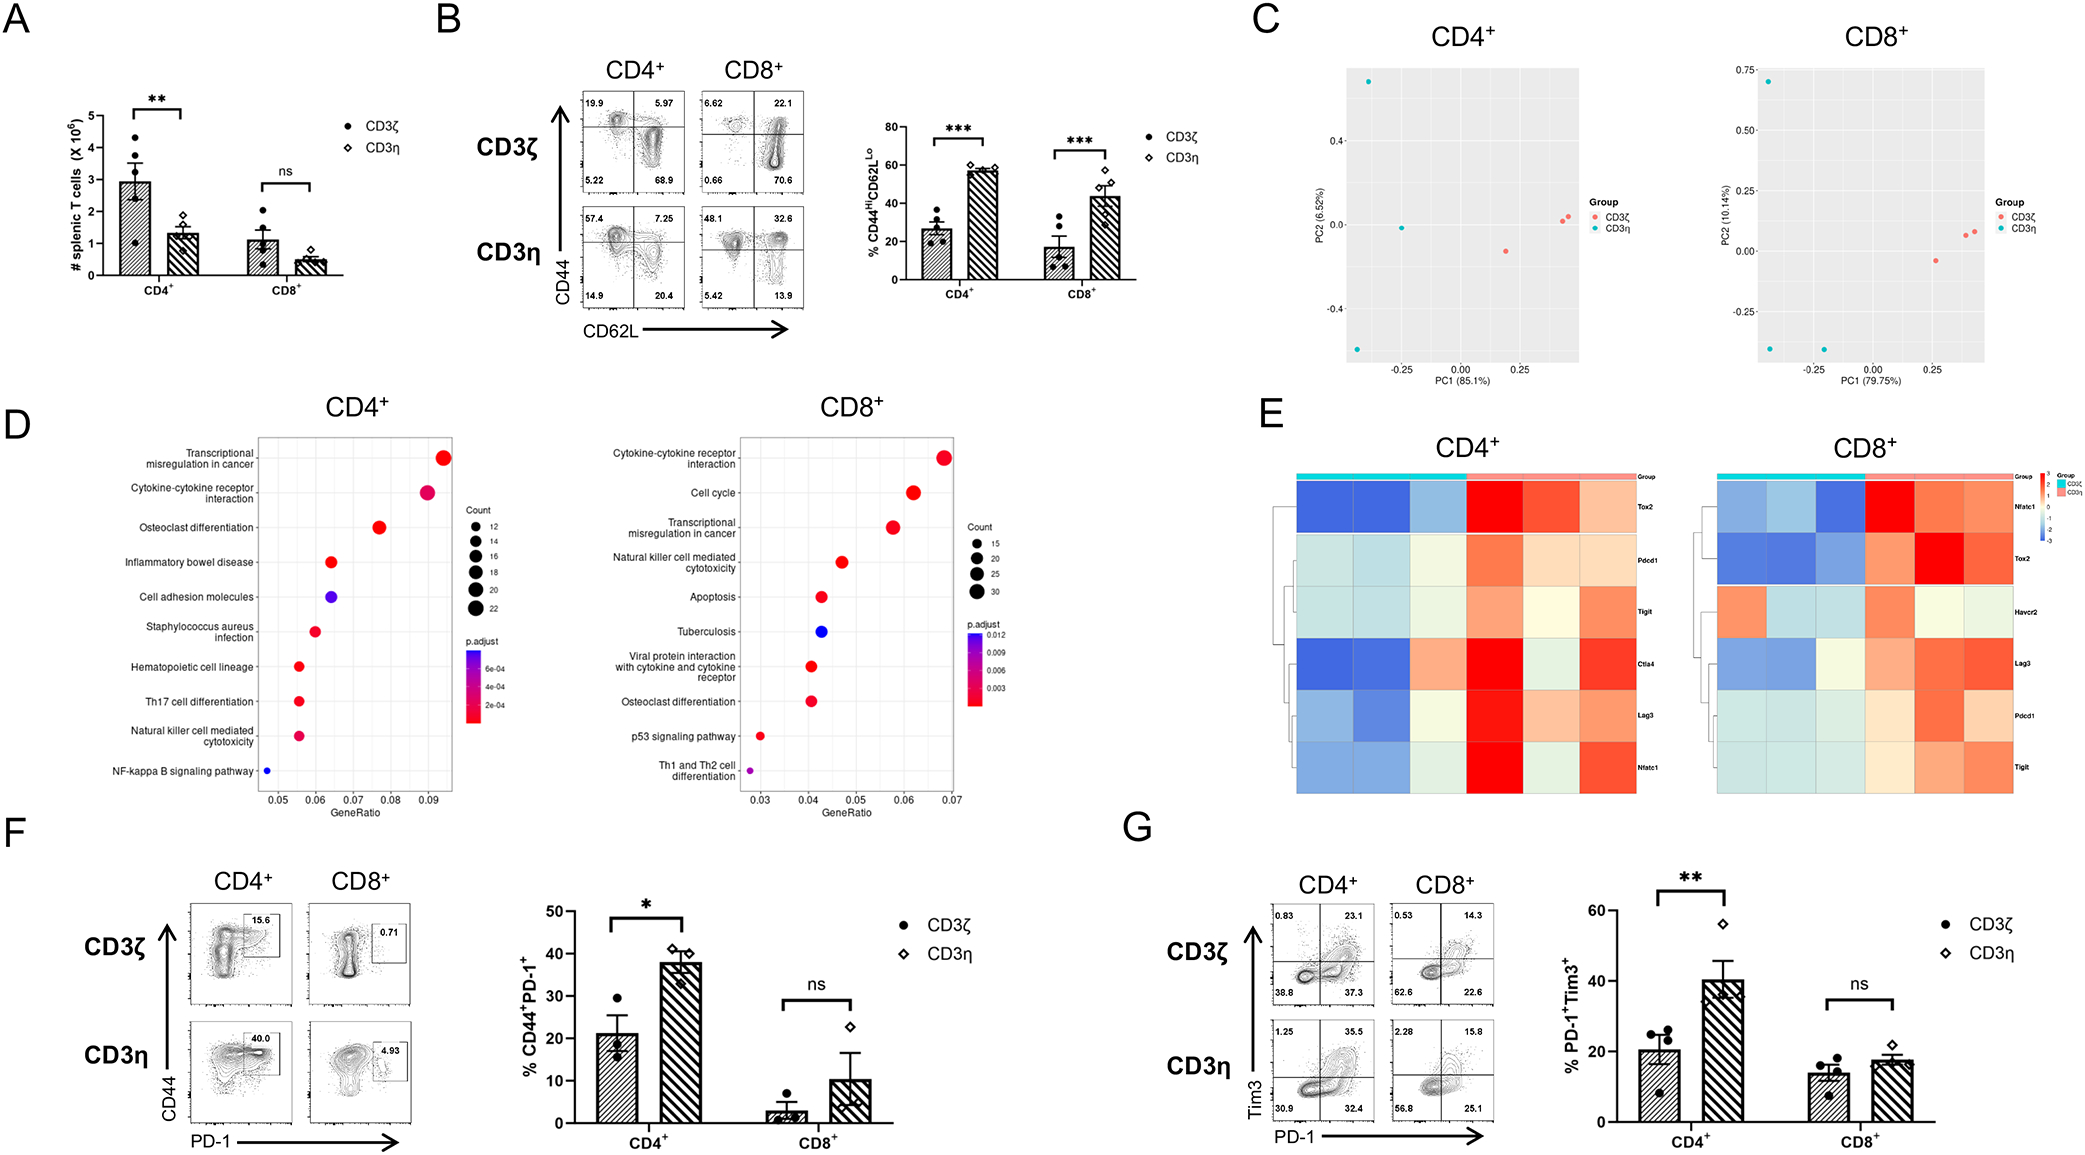
CD3η-expressing peripheral T cells show evidence of homeostatic proliferation and increased expression of exhaustion markers at steady state and following activation. (A) The numbers of CD4+ and CD8+ T cells in the spleen of retrogenic Rag1−/− mice reconstituted with CD247−/− BM expressing CD3ζ or CD3η. (B) Representative flow cytometric analysis and quantification of the percentages of CD44 and CD62L expression in CD4+ and CD8+ T splenocytes from retrogenic mice expressing CD3ζ or CD3η. CD3η-expressing T cells had significantly increased percentages of CD44HiCD62LLo populations. (C) Bulk RNA-Seq analysis was performed on sorted reporter positive CD4+ and CD8+ T cells from three CD3ζ and three CD3η retrogenic mice. Principal component analysis reveals that T cells from CD3ζ and CD3η mice form distinct clusters. (D) Pathways (KEGG) enriched in CD4+ or CD8+ T cells from CD3η mice compared to CD4+ or CD8+ T cells from CD3ζ mice. (E) Heatmap of differentially expressed exhaustion markers in CD4+ or CD8+ T cells from retrogenic mice expressing CD3ζ or CD3η. (F) Representative flow cytometric analysis and quantification of the percentages of CD44 and PD-1 expression in CD4+ and CD8+ T splenocytes in retrogenic CD3ζ or CD3η mice. (H) Purified total T cells were stimulated in vitro with anti-CD3 and anti-CD28 mAbs for 2 days. Representative flow cytometric analysis and quantification of the percentages of Tim-3 and PD-1 expression in gated CD4+ and CD8+ T splenocytes in retrogenic CD3ζ or CD3η mice following 2 days of activation. Each dot represents a single mouse (A,B,F); or data pooled from two independent experiments with 2 mice per group (G). Results shown are the mean ± SEM; statistical analysis was determined by two-way ANOVA (A,B,F,G) with Sidak post-test correction. *p<0.05, **p<0.01, ***p<0.001; ns not significant.
Next, we performed flow cytometry to determine whether the upregulation of T-cell exhaustion markers was also evident at the protein level. Our results showed that CD3η-expressing CD4+ but not CD8+ T cells exhibited an increase in the percentage of cells co-expressing CD44 and PD-1 at steady state (Fig. 5F). To examine whether other surface exhaustion markers could be induced following activation, we stimulated purified T cells with anti-CD3 and anti-CD28 antibodies for 2 days. Again, we observed an increase in the PD-1+Tim3+ population within CD3η-expressing CD4+ but not CD8+ T cells (Fig. 5G). In general, mature CD3η-expressing T cells may proliferate more rapidly than CD3ζ-expressing T cells to reconstitute the peripheral compartment of Rag1−/− mice, which stimulated these cells to up-regulate the expression of CD44 and some exhaustion markers.
Activation of PLCγ1 and Akt/mTOR signaling pathway were diminished in CD3η-expressing T cells upon in vitro stimulation
Consistent with the reduction in the expression of surface TCRβ on both SP thymic subsets caused by CD3η, this decreased level of surface TCRβ was maintained in peripheral T cells (Fig. 6A). Since the presence of surface TCR was reduced and CD3η loses one ITAM, we were interested in determining whether early TCR signaling (i.e. Zap70 and PLCγ1) and downstream pathways (i.e. Erk and Akt/mTOR) were altered. We isolated Pan T cells from these two types of mice and stimulated them with anti-CD3 and anti-CD28 antibodies for short periods. Western blot analyses showed that phosphorylation of PLCγ1 at Tyr783, one key activation site phosphorylated by ITK (24), was diminished in CD3η-expressing T cells at early time points upon strong stimulation in vitro (Fig. 6B,C), suggesting reduced phospholipase activity to hydrolyse phosphatidylinositol 4,5-biphosphate (PI4,5P2) into two second messengers diacylglycerol (DAG) and inositol triphosphate (IP3) (25). To our surprise, phosphorylation of upstream tyrosine kinase Zap70 at Tyr319, one important site required for TCR-dependent PLCγ1 activation (26), was not significantly reduced (Fig. 6B,D). Here we showed that mitogen-activated protein kinase (MAPK) Erk2 was almost equally activated in both types of T cells (Fig. 6B,E), suggesting other signaling molecules compensated for the loss of PLCγ1 activity to activate Ras/MAPK signaling cascade. PI3K/Akt/mTOR pathway plays an important role in regulating T cell survival and proliferation in response to TCR engagement with pMHC molecules presented by APCs (27, 28). The phosphorylation of Akt at Ser473 by mTORC2, which leads to full activation of Akt (29), was decreased but not abolished in T cells expressing CD3η (Fig. 6B,F). Western blot analysis of the expression levels of CD3ζ and CD3η in these studies revealed that CD3η was not as highly expressed as CD3ζ in the retrogenic T cells (Fig. S1D).
Figure 6.

CD3η-expressing peripheral T cells exhibit partial signaling defects following TCR stimulation. (A) The reduction in TCRβ expression is maintained in the periphery of CD3η mice. Representative flow plot and the summary of TCRβ MFI in CD4+ and CD8+ T splenocytes in retrogenic CD3ζ or CD3η mice. (B) Purified total T cells from the spleens of CD3ζ or CD3η mice were stimulated with plate bound anti-CD3 and soluble anti-CD28 mAbs for the indicated times. Cells were harvested, lysed and Western blot analysis for phosphorylated PLCγ1 (p-PLCγ1), p-Zap70, p-Erk1/2 and p-Akt was performed. Total levels of PLCγ1, Zap70, Erk1/2 and Akt are also shown. The blots shown are representative of three independent experiments. (C-F) Quantifications of the three experiments demonstrating significant differences in the phosphorylation of PLCγ1 and Akt but not Zap70 or Erk1/2 in total T cells from CD3η mice. (G,H) Purified total T cells from the spleens of CD3ζ or CD3η mice were stimulated with plate bound anti-CD3 and soluble anti-CD28 mAbs for 2 hours. Gated CD4+ and CD8+ T cells were examined for phosphorylated S6 (pS6), downstream of Akt/mTOR, by flow cytometry. A representative flow plot is shown along with the summary of the percentages of pS6+ populations (G) and the pS6 MFI (H). Each dot represents a single mouse (A) or data pooled from three independent experiments with 3 mice per group (C-H). Results shown are the mean ± SEM; statistical analysis was determined by two-way ANOVA (A and C-H) with Sidak post-test correction. *p<0.05, **p<0.01, ***p<0.001, ****p<0.0001; ns not significant.
Ribosomal protein S6 is downstream of mTORC1 and phosphorylation of S6 (pS6) at Ser235/236 serves as a positive indicator of Akt/mTORC1 activity (30). Flow cytometric analysis revealed that CD3η-expressing CD8+ but not CD4+ T cells had a reduced percentage of pS6+ population (Fig. 6G). In addition, within these pS6+ populations, the MFI of pS6 was significantly reduced in both CD4+ and CD8+ T cells from CD3η-expressing mice (Fig. 6H). In conclusion, CD3η exerted negative impacts on PLCγ1 activation and Akt/mTOR signaling cascade.
CD3η negatively regulated the frequency of T cell activation with less impact on proliferation and differentiation into Th1 subset in activated cells
RNA-Seq data suggested that CD3η-expressing T cells proliferated robustly in the periphery. However, our Western blot analysis showed that these cells exhibited a diminution in Akt/mTOR signaling pathway, which is known to modulate cell proliferation, upon short stimulation. We were curious to learn whether cell proliferation and differentiation was influenced by CD3η. We labeled isolated T cells with CFSE and stimulated them for 3 days. Flow cytometric analysis demonstrated that CD3η-expressing T cells proliferated to a similar extent as CD3ζ-expressing T cells did in vitro (Fig. 7A). However, CD3η-expressing T cells had reduced expression of CD25+T-bet+, characteristic of Th1 or TC1 cells (Fig. 7B). Interestingly, IFN-γ production was not impaired in CD3η-expressing T cells (Fig. 7C), which is similar to what has previously been reported (31). However, we did observe an increase in the proportion of CD3η-expressing CD4+ and CD8+ T cells that failed to upregulate CD25 or IFN-γ (Fig. 7C). These data suggest that activation can occur normally in less CD3η-expressing T cells.
Figure 7.

CD3η negatively impacted on the frequency of T cell activation. (A) Purified total T cells from the spleens of CD3ζ or CD3η mice were labeled with CFSE and stimulated with plate bound anti-CD3 and soluble anti-CD28 mAbs for 3 days. Flow cytometric analysis of CFSE indicates that CD3ζ- or CD3η-expressing T cells proliferate to the same degree. The flow plot shown is a representative of three independent experiments. (B) After 3 days of stimulation, CD3ζ- or CD3η-expressing T cells were examined for the expression of the Th1-associated transcription factor T-bet. Shown is a representative flow plot of CD25 and T-bet expression, along with quantification of the percentages of CD25+T-bet+ CD4+ and CD8+ T cells. Data was pooled from three independent experiments with 3 mice per group. (C) After 3 days of stimulation, CD3ζ- or CD3η-expressing T cells were restimulated with PMA and ionomycin for 2.5 hours and examined for the expression of IFN-γ. Shown is a representative flow plot of CD25 and IFN-γ expression, along with quantification of the percentages of CD25+IFN-γ+ CD4+ and CD8+ T cells. The right panel shows quantification of the proportions of CD25−IFN-γ− CD4+ and CD8+ T cells. Data was pooled from two independent experiments with 2 mice per group. Results shown are the mean ± SEM; statistical analysis was determined by two-way ANOVA (B,C) with Sidak post-test correction. *p<0.05, **p<0.01, ****p<0.0001.
Discussion
In this study, we compared the impacts of the CD3ζ chain and that of three alternatively spliced CD247 isoforms on T-cell development and activation, using a retrogenic mouse approach. These three isoforms differ in the C-terminus of the protein, leading to the loss of the third canonical ITAM motif, and we observed very different behaviors between them. We observed that CD247−/− BM reconstituted with CD3θ failed to generate mature SP T cells, whereas mice reconstituted with CD3ι had essentially normal T cell development and proliferation. Mice reconstituted with CD3η had impaired T cell development, that appeared to occur at the stage of positive selection leading to a reduction in TCR expression at the cell surface. Peripheral T cells in CD3η-reconstituted mice overexpressed CD44 and some exhaustion markers, suggesting expansion in the lymphopenic environment of Rag1−/− mice. CD3η-expressing T cells also exhibited diminished PLCγ1 and Akt/mTOR activation following TCR stimulation, although Zap70 and Erk activation were not affected. Finally, CD3η negatively impinged on the frequency of T cell activation with less impact on Th1 cell fate decision and proliferation in those cells that did activate. In conclusion, all four CD247 isoforms had diverse influences on T cell development and activation.
A previous study utilized the T cell hybridoma MA5.8 transfected with CD3ζ, CD3η or CD3θ expression vector to characterize their functions in vitro. It was demonstrated that the CD3ζ transfectant expressed the highest level of surface TCR, less TCR expression was observed with CD3η, and surface TCR was undetectable with CD3θ. The authors suggested that the CD3θ and CD3η may interfere with the transfer from endoplasmic reticulum (ER) to Golgi. They were also unable to identify CD3θ protein in the thymus (11). We observed a similar gradient in TCR expression mediated by isoforms of CD247 in our in vivo retrogenic mice such that CD3η-expressing SP thymocytes expressed a reduced level of TCR and CD3θ-expressing thymocytes expressed a barely detectable level of surface TCR throughout thymic development. In contrast to the previous study, we did observe CD3θ protein expression both in WT thymus (Fig. 1B) and in the thymus of CD3θ-reconstituted retrogenic mice (Fig. S1B).
Immature thymocytes undergo 3 major checkpoints, TCRβ-selection, positive selection and negative selection, before becoming mature immunocompetent T cells. Both TCRβ-selection and positive selection are two positively selecting processes by which thymocytes must receive pre-TCR or TCR-induced signals respectively to survive and proliferate (32, 33). The expression of pre-TCR or TCR on the cell surface and the ability to trigger downstream signaling cascades are critical factors for thymocytes to survive these selection stages. Thus, it is not clear whether the defects observed in T cell development in CD3θ or CD3η-expressing thymocytes are caused by the abrogation or reduction in surface expression of TCR, the loss of two C-terminal ITAMs, or the combination of both defects. Shores et al reported that a transgenic CD3ζ chain lacking all three ITAM sequences but retaining the ability to facilitate the expression of surface TCR was able to restore T cell development in CD247−/− mice, indicating that the developmental defects by loss of CD3ζ resulted from a reduced level of TCR rather than a lack of CD3ζ ITAM-mediated signals (34). Holst et al demonstrated that quantitative rather than qualitative ITAM-mediated signals appeared to be the primary factor to regulate the development and function of T cells (31). On the other hand, Bettini et al examined the ITAM sequence diversity necessary to support T cell development. In this study, they found severe defects in T cell development when thymocytes only expressed a single ITAM sequence at each of the 10 ITAM locations, and this was manifested by both decreased TCR expression and reduced signaling. Interestingly, retrogenic mice reconstituted with CD3 subunits expressing only the third ITAM sequence of the CD3ζ chain had normal TCR expression and TCR signaling in the thymus as evidenced by CD5 and Nur77 expression (35).
In our retrogenic mice reconstituted with either CD3θ or CD3η-expressing BM, the TCR complex is only lacking the third CD3ζ ITAM, and the other 8 ITAMs are intact, and we observed severe T cell defects. These results reinforce the central importance of this sequence in T cell development and function.
CD3θ-expressing thymocytes appear to express the lowest level of TCR and the cells become stalled at the DN3 stage, suggesting that they fail TCRβ-selection. Examination of the C-terminal sequence of CD3θ reveals a KKXX sequence which has been implicated in endoplasmic reticulum retention/retrieval (36). The presence of this retention sequence may be responsible for the fact that the defect in CD3θ-reconstituted mice appears to be more severe than that seen with empty vector reconstitution. Thus, it seems that the developmental defects that CD3θ-expressing thymocytes encounter are mainly attributed to a lack of sufficient surface expression of pre-TCR. CD3η-expressing thymocytes, on the other hand, appear to successfully undergo TCRβ selection and reach the DP stage. We speculate that this is due to a defect in positive selection as there is a marked reduction in CD4 and CD8 SP thymocyte numbers. Surface TCR expression at the DP stage is equivalent in CD3η and CD3ζ-expressing thymocytes (Fig 4E). A normal consequence of successful positive selection is the upregulation of TCR expression on SP thymocytes, which was observed in CD3ζ-reconstituted mice. Mice reconstituted with CD3η failed to up-regulate TCR expression on SP thymocytes, and this reduced TCR expression was maintained in the periphery. Further examination of CD3η-expressing DP thymocytes revealed a significant reduction in CD5 expression, suggesting reduced TCR signaling at this stage of positive selection. Thus, it appears that the thymic defect in CD3η-expressing thymocytes is related to reduced TCR signaling at the DP stage.
While the defect in thymic cellularity is extreme with a close to 30-fold reduction in total thymocyte numbers in CD3η-reconstituted mice, the splenic numbers were only reduced by 2-fold. We observed evidence in the enrichment for cell cycle-related gene sets of these cells in vivo via RNA-Seq and in the enhanced expression of CD44 and reduced CD62L. Several studies have reported that naive T cells can proliferate independently of foreign antigens, presumably in response to self-antigens at steady state, especially after the transfer of T cells into a lymphopenic environment (37–39). Since the thymic output from CD3η-reconstituted mice was significantly lower, peripheral CD3η-expressing T cells appear to undergo a more vigorous proliferation to recover lymphosufficiency within the immune deficient Rag1−/− hosts. Such homeostatic proliferation driven by recognition of self-antigens might be considered as an inducing factor for autoimmunity. However, we did not observe any autoimmune disease in any mice reconstituted with CD3η, out to 4 months of age.
Studies have established the crucial role for Akt/mTOR signaling pathway in controlling T-cell survival and proliferation. We showed that Akt activation was diminished at early time points following TCR stimulation, but cell proliferation was not affected in CD3η-expressing T cells. One possibility is that the reduction is time-sensitive and Akt activation eventually reaches a similar level in both CD3η and CD3ζ-expressing T cells. Another possibility is while cell proliferation is not affected in surviving T cells, the reduced Akt activity in some cells could lead to enhanced cell death. It was reported that Akt1 and Akt2-deficient thymocytes were more susceptible to TCR-induced death, while cell proliferation was subtly reduced (40). Although we observed that CD3η-expressing T cells appeared to be capable of proliferating normally, the percentage of cells induced to activate was lower than that in CD3ζ-expressing T cells. It is also likely that the activity of PI3K, which is upstream of Akt, might be compromised in CD3η-expressing T cells, not only because of the diminution in Akt activation, but also due to the reduction of PLCγ1 phosphorylation at Y783. The phosphorylation requires the recruitment of ITK to the cell membrane by binding to phosphatidylinositol 3,4,5-triphosphate (PIP3) produced by PI3K lipid kinase activity (41, 42). Since Zap70 and Erk were activated at a similar level in a TCR-dependent manner, the reduction of PLCγ1 and Akt activation in CD3η-expressing T cells may not only result from reduced TCR expression. The third ITAM of CD3ζ seems to be required for PLCγ1 and Akt/mTOR activation.
CD3ζ chain acts as a critical component of TCR complex in mediating downstream signaling. By investigating four isoforms of CD247 gene, our studies elucidate that CD3ζ and CD3ι may play a similar role in T cell function, while CD3θ-expressing thymocytes are blocked at the DN stage, and CD3η-expressing cells display defects in T cell development and activation because of reduced TCR expression and ITAM loss. The diverse impacts of these isoforms on T cells highlight the importance of alternative splicing in regulating the immune system.
Supplementary Material
Key Points:
Alternatively spliced variants of CD3ζ affect T cell development and activation.
CD3ι-expressing T cells develop and activate normally like cells expressing CD3ζ.
Mice reconstituted with CD3θ or CD3η have severe thymic defects.
Acknowledgements
We thank Dr. Dario Vignali for Plat-E and NIH/3T3 cell lines, and MSCV and pCL-Eco vectors. We thank Tristan White and Matthew Gable for discussing the project and lab management. We appreciate Dr. Chang (Gracie) Liu for the protocols of generating retrogenic mice. We also thank the Computational Immunology Core for RNA Seq analysis and Jishnu Das for fruitful discussions.
The work was supported by NIH grant R01130488 (PAM)
Footnotes
Disclosures
The authors have no financial conflicts of interests.
References
- 1.Marrack P, and Kappler J. 1987. The T cell receptor. Science 238: 1073–1079. [DOI] [PubMed] [Google Scholar]
- 2.Saito T, and Germain RN. 1988. The molecular basis of MHC-restricted antigen recognition by T cells. Int Rev Immunol 3: 147–174. [DOI] [PubMed] [Google Scholar]
- 3.Malissen B, and Schmitt-Verhulst AM. 1993. Transmembrane signalling through the T-cell-receptor-CD3 complex. Curr Opin Immunol 5: 324–333. [DOI] [PubMed] [Google Scholar]
- 4.Wegener AM, Letourneur F, Hoeveler A, Brocker T, Luton F, and Malissen B. 1992. The T cell receptor/CD3 complex is composed of at least two autonomous transduction modules. Cell 68: 83–95. [DOI] [PubMed] [Google Scholar]
- 5.Sancho J, Franco R, Chatila T, Hall C, and Terhorst C. 1993. The T cell receptor associated CD3-epsilon protein is phosphorylated upon T cell activation in the two tyrosine residues of a conserved signal transduction motif. Eur J Immunol 23: 1636–1642. [DOI] [PubMed] [Google Scholar]
- 6.Courtney AH, Lo WL, and Weiss A. 2018. TCR Signaling: Mechanisms of Initiation and Propagation. Trends Biochem Sci 43: 108–123. [DOI] [PMC free article] [PubMed] [Google Scholar]
- 7.Gaud G, Lesourne R, and Love PE. 2018. Regulatory mechanisms in T cell receptor signalling. Nat Rev Immunol 18: 485–497. [DOI] [PubMed] [Google Scholar]
- 8.Weissman AM, Baniyash M, Hou D, Samelson LE, Burgess WH, and Klausner RD. 1988. Molecular cloning of the zeta chain of the T cell antigen receptor. Science 239: 1018–1021. [DOI] [PubMed] [Google Scholar]
- 9.Ohno H, and Saito T. 1990. CD3 zeta and eta chains are produced by alternative splicing from a common gene. Int Immunol 2: 1117–1119. [DOI] [PubMed] [Google Scholar]
- 10.Clayton LK, D’Adamio L, Howard FD, Sieh M, Hussey RE, Koyasu S, and Reinherz EL. 1991. CD3 eta and CD3 zeta are alternatively spliced products of a common genetic locus and are transcriptionally and/or post-transcriptionally regulated during T-cell development. Proc Natl Acad Sci U S A 88: 5202–5206. [DOI] [PMC free article] [PubMed] [Google Scholar]
- 11.Clayton LK, Diener AC, Lerner A, Tse AG, Koyasu S, and Reinherz EL. 1992. Differential regulation of T-cell receptor processing and surface expression affected by CD3 theta, an alternatively spliced product of the CD3 zeta/eta gene locus. J Biol Chem 267: 26023–26030. [PubMed] [Google Scholar]
- 12.Nocentini G, Ronchetti S, Bartoli A, Testa G, D’Adamio F, Riccardi C, and Migliorati G. 1995. T cell receptor iota an alternatively spliced product of the T cell receptor zeta gene. Eur J Immunol 25: 1405–1409. [DOI] [PubMed] [Google Scholar]
- 13.Malissen M, Gillet A, Rocha B, Trucy J, Vivier E, Boyer C, Kontgen F, Brun N, Mazza G, Spanopoulou E, and et al. 1993. T cell development in mice lacking the CD3-zeta/eta gene. EMBO J 12: 4347–4355. [DOI] [PMC free article] [PubMed] [Google Scholar]
- 14.Love PE, Shores EW, Johnson MD, Tremblay ML, Lee EJ, Grinberg A, Huang SP, Singer A, and Westphal H. 1993. T cell development in mice that lack the zeta chain of the T cell antigen receptor complex. Science 261: 918–921. [DOI] [PubMed] [Google Scholar]
- 15.Liu CP, Ueda R, She J, Sancho J, Wang B, Weddell G, Loring J, Kurahara C, Dudley EC, Hayday A, and et al. 1993. Abnormal T cell development in CD3-zeta−/− mutant mice and identification of a novel T cell population in the intestine. EMBO J 12: 4863–4875. [DOI] [PMC free article] [PubMed] [Google Scholar]
- 16.Ohno H, Aoe T, Taki S, Kitamura D, Ishida Y, Rajewsky K, and Saito T. 1993. Developmental and functional impairment of T cells in mice lacking CD3 zeta chains. EMBO J 12: 4357–4366. [DOI] [PMC free article] [PubMed] [Google Scholar]
- 17.Bray NL, Pimentel H, Melsted P, and Pachter L. 2016. Near-optimal probabilistic RNA-seq quantification. Nat Biotechnol 34: 525–527. [DOI] [PubMed] [Google Scholar]
- 18.Pimentel H, Bray NL, Puente S, Melsted P, and Pachter L. 2017. Differential analysis of RNA-seq incorporating quantification uncertainty. Nat Methods 14: 687–690. [DOI] [PubMed] [Google Scholar]
- 19.Wu T, Hu E, Xu S, Chen M, Guo P, Dai Z, Feng T, Zhou L, Tang W, Zhan L, Fu X, Liu S, Bo X, and Yu G. 2021. clusterProfiler 4.0: A universal enrichment tool for interpreting omics data. Innovation (Camb) 2: 100141. [DOI] [PMC free article] [PubMed] [Google Scholar]
- 20.Kanehisa M, and Goto S. 2000. KEGG: kyoto encyclopedia of genes and genomes. Nucleic Acids Res 28: 27–30. [DOI] [PMC free article] [PubMed] [Google Scholar]
- 21.Holst J, Szymczak-Workman AL, Vignali KM, Burton AR, Workman CJ, and Vignali DA. 2006. Generation of T-cell receptor retrogenic mice. Nat Protoc 1: 406–417. [DOI] [PubMed] [Google Scholar]
- 22.Azzam HS, Grinberg A, Lui K, Shen H, Shores EW, and Love PE. 1998. CD5 expression is developmentally regulated by T cell receptor (TCR) signals and TCR avidity. J Exp Med 188: 2301–2311. [DOI] [PMC free article] [PubMed] [Google Scholar]
- 23.Azzam HS, DeJarnette JB, Huang K, Emmons R, Park CS, Sommers CL, El-Khoury D, Shores EW, and Love PE. 2001. Fine tuning of TCR signaling by CD5. J Immunol 166: 5464–5472. [DOI] [PubMed] [Google Scholar]
- 24.Houtman JC, Houghtling RA, Barda-Saad M, Toda Y, and Samelson LE. 2005. Early phosphorylation kinetics of proteins involved in proximal TCR-mediated signaling pathways. J Immunol 175: 2449–2458. [DOI] [PMC free article] [PubMed] [Google Scholar]
- 25.Margolis B, Zilberstein A, Franks C, Felder S, Kremer S, Ullrich A, Rhee SG, Skorecki K, and Schlessinger J. 1990. Effect of phospholipase C-gamma overexpression on PDGF-induced second messengers and mitogenesis. Science 248: 607–610. [DOI] [PubMed] [Google Scholar]
- 26.Williams BL, Irvin BJ, Sutor SL, Chini CC, Yacyshyn E, Bubeck Wardenburg J, Dalton M, Chan AC, and Abraham RT. 1999. Phosphorylation of Tyr319 in ZAP-70 is required for T-cell antigen receptor-dependent phospholipase C-gamma1 and Ras activation. EMBO J 18: 1832–1844. [DOI] [PMC free article] [PubMed] [Google Scholar]
- 27.Jones RG, Parsons M, Bonnard M, Chan VS, Yeh WC, Woodgett JR, and Ohashi PS. 2000. Protein kinase B regulates T lymphocyte survival, nuclear factor kappaB activation, and Bcl-X(L) levels in vivo. J Exp Med 191: 1721–1734. [DOI] [PMC free article] [PubMed] [Google Scholar]
- 28.Costello PS, Gallagher M, and Cantrell DA. 2002. Sustained and dynamic inositol lipid metabolism inside and outside the immunological synapse. Nat Immunol 3: 1082–1089. [DOI] [PubMed] [Google Scholar]
- 29.Sarbassov DD, Guertin DA, Ali SM, and Sabatini DM. 2005. Phosphorylation and regulation of Akt/PKB by the rictor-mTOR complex. Science 307: 1098–1101. [DOI] [PubMed] [Google Scholar]
- 30.Antion MD, Hou L, Wong H, Hoeffer CA, and Klann E. 2008. mGluR-dependent long-term depression is associated with increased phosphorylation of S6 and synthesis of elongation factor 1A but remains expressed in S6K-deficient mice. Mol Cell Biol 28: 2996–3007. [DOI] [PMC free article] [PubMed] [Google Scholar]
- 31.Holst J, Wang H, Eder KD, Workman CJ, Boyd KL, Baquet Z, Singh H, Forbes K, Chruscinski A, Smeyne R, van Oers NS, Utz PJ, and Vignali DA. 2008. Scalable signaling mediated by T cell antigen receptor-CD3 ITAMs ensures effective negative selection and prevents autoimmunity. Nat Immunol 9: 658–666. [DOI] [PubMed] [Google Scholar]
- 32.Dutta A, Zhao B, and Love PE. 2021. New insights into TCR beta-selection. Trends Immunol 42: 735–750. [DOI] [PubMed] [Google Scholar]
- 33.Klein L, Kyewski B, Allen PM, and Hogquist KA. 2014. Positive and negative selection of the T cell repertoire: what thymocytes see (and don’t see). Nat Rev Immunol 14: 377–391. [DOI] [PMC free article] [PubMed] [Google Scholar]
- 34.Shores EW, Huang K, Tran T, Lee E, Grinberg A, and Love PE. 1994. Role of TCR zeta chain in T cell development and selection. Science 266: 1047–1050. [DOI] [PubMed] [Google Scholar]
- 35.Bettini ML, Chou PC, Guy CS, Lee T, Vignali KM, and Vignali DAA. 2017. Cutting Edge: CD3 ITAM Diversity Is Required for Optimal TCR Signaling and Thymocyte Development. J Immunol 199: 1555–1560. [DOI] [PMC free article] [PubMed] [Google Scholar]
- 36.Jackson MR, Nilsson T, and Peterson PA. 1993. Retrieval of transmembrane proteins to the endoplasmic reticulum. J Cell Biol 121: 317–333. [DOI] [PMC free article] [PubMed] [Google Scholar]
- 37.Ernst B, Lee DS, Chang JM, Sprent J, and Surh CD. 1999. The peptide ligands mediating positive selection in the thymus control T cell survival and homeostatic proliferation in the periphery. Immunity 11: 173–181. [DOI] [PubMed] [Google Scholar]
- 38.Martin B, Bourgeois C, Dautigny N, and Lucas B. 2003. On the role of MHC class II molecules in the survival and lymphopenia-induced proliferation of peripheral CD4+ T cells. Proc Natl Acad Sci U S A 100: 6021–6026. [DOI] [PMC free article] [PubMed] [Google Scholar]
- 39.Haluszczak C, Akue AD, Hamilton SE, Johnson LD, Pujanauski L, Teodorovic L, Jameson SC, and Kedl RM. 2009. The antigen-specific CD8+ T cell repertoire in unimmunized mice includes memory phenotype cells bearing markers of homeostatic expansion. J Exp Med 206: 435–448. [DOI] [PMC free article] [PubMed] [Google Scholar]
- 40.Juntilla MM, Wofford JA, Birnbaum MJ, Rathmell JC, and Koretzky GA. 2007. Akt1 and Akt2 are required for alphabeta thymocyte survival and differentiation. Proc Natl Acad Sci U S A 104: 12105–12110. [DOI] [PMC free article] [PubMed] [Google Scholar]
- 41.Ching KA, Kawakami Y, Kawakami T, and Tsoukas CD. 1999. Emt/Itk associates with activated TCR complexes: role of the pleckstrin homology domain. J Immunol 163: 6006–6013. [PubMed] [Google Scholar]
- 42.Huang YH, Grasis JA, Miller AT, Xu R, Soonthornvacharin S, Andreotti AH, Tsoukas CD, Cooke MP, and Sauer K. 2007. Positive regulation of Itk PH domain function by soluble IP4. Science 316: 886–889. [DOI] [PubMed] [Google Scholar]
Associated Data
This section collects any data citations, data availability statements, or supplementary materials included in this article.