

Abstract
Background
The dynamic shape of the normal adult mitral annulus has been shown to be important to mitral valve function. However, annular dynamics of the healthy mitral valve in children have yet to be explored. We sought to model and quantify the shape and major modes of variation of pediatric mitral valve annuli at four phases in the cardiac cycle using transthoracic echocardiograms.
Methods
The mitral valve annuli of 100 children and young adults with normal 3D echocardiograms were modeled in four different cardiac phases using the SlicerHeart extension for 3DSlicer. Annular metrics were quantified using SlicerHeart and optimal normalization to BSA was explored. Mean annular shapes and the principal components of variation were computed using custom code implemented in a new SlicerHeart module (Annulus Shape Analyzer). Shape was regressed over metrics of age and body surface area (BSA) and the mean shapes for five age-stratified groups were generated.
Results
The annular height to commissural width ratio (AHCWR) of the mitral valve (“saddle shape”) changed significantly through age for systolic phases (p<0.001) but within a narrow range (Medians 0.20–0.25). Annular metrics change statistically between the diastolic and systolic phases of the cardiac cycle. Visually, the annular shape was maintained with respect to age and BSA. Principal component analysis revealed that the pediatric mitral annulus primarily varies in size (Mode 1), AHCWR (Mode 2) and sphericity (Mode 3).
Conclusions
The saddle shaped mitral annulus is maintained throughout childhood but varies significantly throughout the cardiac cycle. The major modes of variation in the pediatric mitral annulus are due to size, AHCWR, and sphericity. The generation of age- and size-specific mitral annular shapes may inform the development of appropriately scaled absorbable or expandable mitral annuloplasty rings for children.
Keywords: three-dimensional echocardiography, mitral valve, pediatric, congenital heart disease
INTRODUCTION
Mitral annulus (MA) shape and dynamics have been shown to be critical to adult mitral valve function [1, 2]. Lower annular height to commissural width ratio (AHCWR) has been associated with greater leaflet stress, greater valve regurgitation, and chordal rupture [3–5]. Understanding of the importance of non-planar saddle shape of the normal adult mitral valve, and consequences of loss of that shape in the setting of pathology, has led to the development of non-planar annuloplasty rings which are now ubiquitously applied in adult mitral valve repair [6–11].
Mid-systolic mitral annular geometry has previously been explored in normal children and those with leaflet prolapse [12, 13]. While pediatric mitral valve dynamics have been explored in a small cohort[14], a larger analysis of how pediatric MA shape changes throughout the cardiac cycle has yet to be performed. Further, the actual dynamic shape of the pediatric annulus, as opposed to geometric metrics of shape (diameter, area), has not been described. Defining the actual shape may inform our understanding of normal pediatric annular biomechanics as well as the potential development of pediatric specific annuloplasty rings that are either absorbable, or built to accommodate growth [9, 15–19]. While such an analysis can partially be accomplished with traditional metrics using Euclidean geometry(e.g. diameter, area), shape analysis allows the creation of mean shapes, comparison of mean shapes across age, the assessment of the principal modes of variation, and regression of annular shape across continuous variables such as age or size [20–23].
As such, we sought to define the pediatric MA shape throughout the cardiac cycle and quantify how MA annular dynamics and shape vary with age and size (e.g. body surface area). In addition, we implement these capabilities into an open-source tool that can be applied to analyze the annular shape and dynamics, further understand differences between functional and dysfunctional valves, and inform annuloplasty design in pediatric patients.
METHODS
Subjects and Image Acquisition
We analyzed an existing dataset of 100 patients with structurally normal hearts for whom transthoracic three-dimensional echocardiography (3DE) had been collected for clinical studies [12]. All 3DE datasets were apical 4-chamber acquisitions. Functional or structural heart disease was suspected in these children but judged to be absent by the treating cardiologist. The original inclusion criteria for this existing cohort were as follows: (1) referral for clinical 3DE, (2) no history of congenital or acquired heart disease, (3) no more than trivial valvular regurgitation, (4) no structural defects (patient foramen ovale and trivial branch pulmonary artery stenosis permitted in infants), (5) left ventricle end-diastolic volume Z score >−2.5 and <+2.5, and (6) normal left-ventricle systolic function (ejection fraction >55%) on a complete two-dimensional (2D) and Color Doppler echocardiogram. The study was approved by the Committee on Clinical Investigation at Boston Children’s Hospital [12].
Annular Curve Modeling and Quantification
Annular modeling was performed analogous to our previous work by employing the mitral valve presets in the new SlicerHeart Valve Annulus Analysis module within 3DSlicer [22–24]. Four equally spaced phases in the cardiac cycle were modeled for the MA and aortic annulus (AA): end-diastole (ED), mid-systole (MS), end-systole (ES), and mid-diastole (MD). Euclidean annular metrics, described in Table 1 and Figure 1, were measured in each phase using the SlicerHeart Valve Quantification module [22–24].
Table 1.
Description of Annular Parameters
| Variable | Description |
|---|---|
| BSA (m2) | Body surface area |
| Annular Circumference (mm) | Distance around annular circumference |
| Annular Height (mm) | Height of mitral annulus (lowest point to highest point) |
| A-P Diameter (mm) | Distance from anterior mitral annulus to posterior annulus |
| AL-PM Diameter (mm) | Distance from anterolateral annulus to posteromedial annulus |
| A-P Bending Angle (°) | Angle between distances from the center to points A and P respectively |
| AL-PM Bending Angle (°) | Angle between distances from the center to points AL and PM respectively |
| 2D Annular Area (cm2/m2) | Area of surface enclosed by modeled 3D mitral annulus and projected onto annular least squares plane |
| 3D Annular Area (cm2/m2) | Minimum area of manifold surface generated from and enclosed by modeled 3D mitral annulus |
| Annular Height to Width Ratio | Annular height / AL-PM diameter |
| Sphericity | A-P diameter / AL-PM diameter |
Figure 1. Visualization of Mitral Annular Metrics.

A. Annular circumference; B. Annular height; C. 3D annular area; D. A-P Diameter; E. AL-PM diameter; F. Dynamic comparison of annular metrics through cardiac cycle. A-P = anterior-posterior, AL-PM = anterolateral-posteromedial.
Normalization and Statistical Analysis
The Kruskal-Wallis test was performed to assess changes in MA parameters across age groups. A Friedman test was performed, with a Nemenyi post-hoc analysis, on continuous variables across age groups to determine differences in annular metrics across the cardiac cycle.
Cardiac output is thought to be proportional to body surface area (BSA), and valve area is thought to be associated to BSA [17]. As such, annular metrics (e.g. diameter, circumference) would teleologically vary with the square root of BSA, as validated for the aortic valve using 2D-echocardiography [17]. In this study, annular area measurements were first normalized to BSA, and linear measurements were normalized to BSA0.5 as previously described [17, 23]. To further investigate normalization methods, both variable-specific and type-optimized normalization were explored by finding the value of x that minimizes the slope of Variable/BSAx vs. BSA for each metric and metric type. Additional details about this exploration are provided in Appendix A.
Shape Parametrization and Analysis
The Annulus Shape Analyzer module in Slicer Heart was created to extend previous shape methods and implement them in an open-source software [24]. This module facilitates Procrustes alignment (a method to optimally align shapes) [22, 23], calculation of population mean shape, principal component analysis (PCA), curve comparisons, and regression of mean shape with respect to demographic variables [24]. Procrustes alignment, mean shape model generation, and PCA (see Appendix B) were conducted analogously to our previous descriptions [22, 23]. In this study, we present PCA on 1) shape-aligned and 2) shape- and scale-aligned MA data. Finally, annular models were regressed over continuous demographic variables (i.e., age, height, BSA) to further explore how shape varies with respect to growth.
Physical Annulus Models
Annular models were 3D printed to demonstrate proof of concept for the “on demand” generation of size specific, absorbable, or expandable pediatric annuloplasty rings. The mean annular model for each age group was exported from 3DSlicer as a stereolithography file (.stl) and 3D printed with a radius of 0.60 mm on a material jetting printer (J750, Stratasys, Eden Prairie, MN) using polycarbonate material (VeroVivid, Stratasys, Eden Prairie, MN) [24].
RESULTS
The MA of 100 patients (44% female) with normal echocardiograms were successfully modeled in each cardiac phase (ED, MS, ES, and MD). Patient-age ranged from 1 day to 22 years (Median 9.92 IQR 5.99–14.7); BSA ranged from 0.17 to 2.18 m2, and weight spanned 2.2 to 92.3 kg (Table 2).
Table 2.
Demographics
| Variable | <1 y (n=8) | 1–5 y (n=13) | >5–9 y (n=21) | >9–13 y (n=27) | >13 y (n=31) | All Ages (n=100) |
|---|---|---|---|---|---|---|
|
| ||||||
| Age at Analysis (y) | 0.03 [0.02–0.2] | 3.2 [3.1–4.5] | 7.0 [6.2–7.7] | 11.2 [9.7–11.6] | 16.0 [15.0–17.0] | 9.7 [5.4–14.7] |
| Female Gender n (%) | 3 (38) | 8 (62) | 10 (48) | 7 (26) | 14 (45) | 42 (42) |
| Height (cm) | 51 [48–55] | 99 [97–108] | 122 [118–125] | 143 [139–149] | 169 [164–176] | 140 [117–162] |
| Weight (kg) | 3.4 [2.8–5.5] | 15.7 [15.0–17.3] | 23.6 [22.4–25.9] | 37.2 [32.5–44.3] | 60.0 [56.1–63.9] | 32.5 [21.9–55.2] |
| BSA (m2) | 0.22 [0.20–0.30] | 0.68 [0.64–0.72] | 0.91 [0.87–0.94] | 1.22 [1.12–1.36] | 1.69 [1.61–1.75] | 1.1 [0.8–1.6] |
| Heart Rate (bpm) | 132 [123–142] | 94 [89–102] | 79 [76–84] | 75 [65–78] | 64 [58–72] | 76 [66–85] |
| Frame Rate (Hz) | 26.0 [25.0–29.25] | 31.0 [29.25–34.25] | 33.0 [30.0–37.0] | 34.0 [31.0–35.0] | 29.0 [22.0–33.0] | 31.0 [25.2–35.0] |
Values listed are Median [IQR].
BSA = body surface area.
Exploration of BSA-Based Normalization in Mitral Annular Metrics
Plots of BSA-normalized annular circumference and area with respect to BSA are shown in Figure 2. Initially, annular area measurements were normalized to BSA, and linear measurements were normalized to BSA0.5 as previously described (Figure 2 Left Panels) [17, 23]. However, with this normalization, a persistent negative trend was observed between annular metrics and these standard relationships to BSA. As such, we investigated optimal exponents for BSA normalization in our cohort as detailed in Appendix A. In this cohort, linear metrics (e.g. annular diameter) were optimally normalized to BSA0.45, and area metrics were optimally normalized to BSA0.86 (Figure 2 Right Panels).
Figure 2. Relationship of Mitral Annular Circumference and Annular Area to Body Surface Area (BSA).
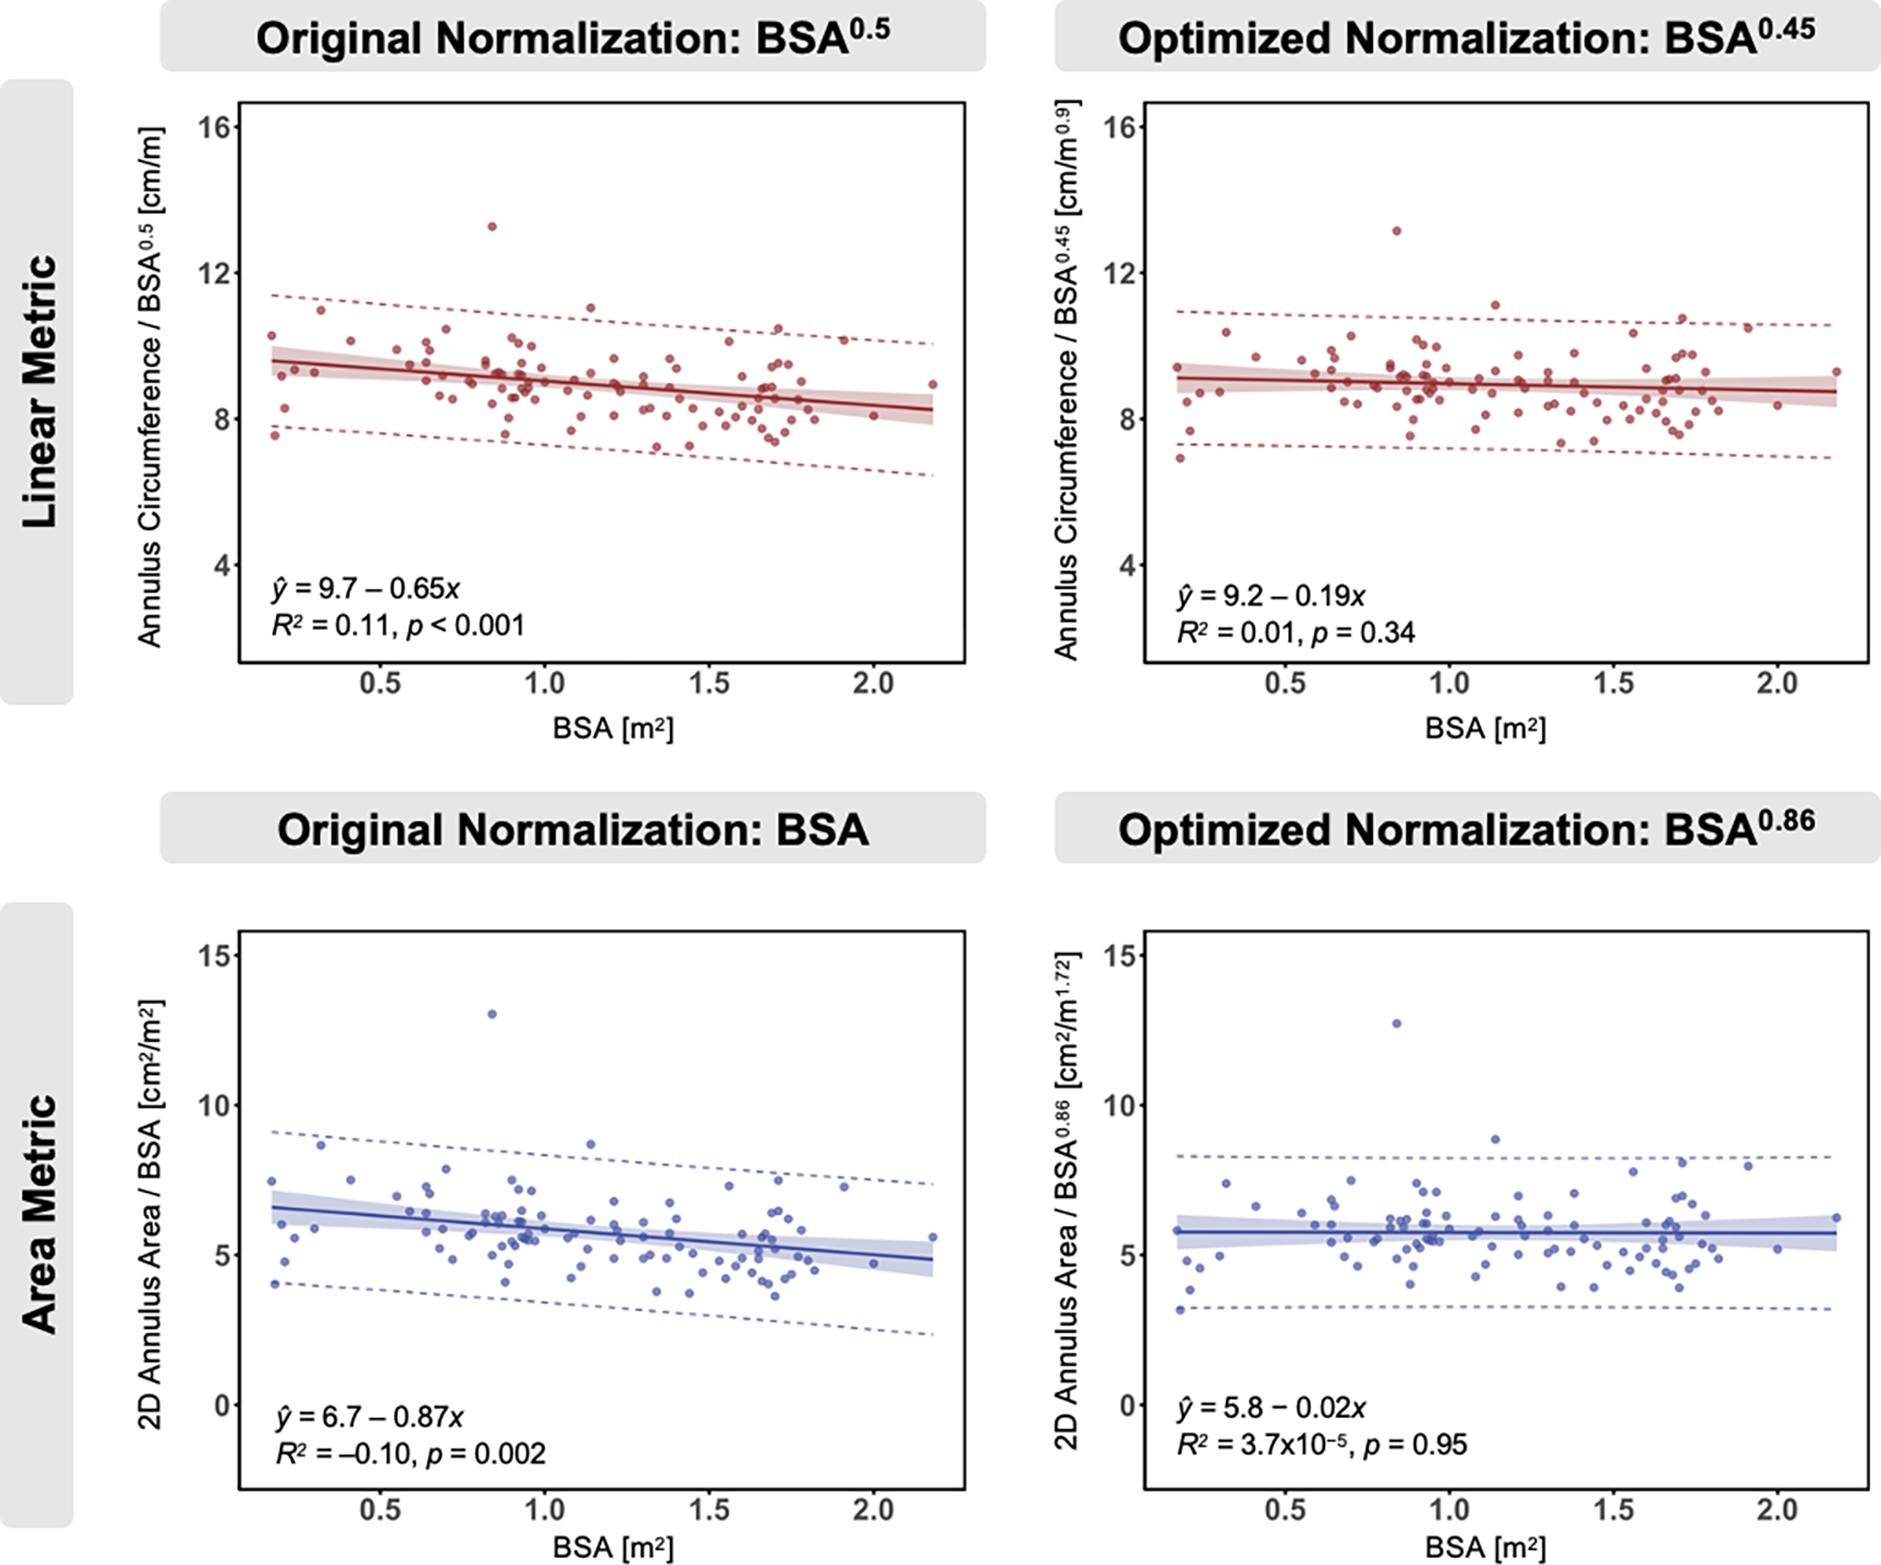
Original normalization (left) of linear metric to BSA0.5 and area metric to BSA, and optimized normalization (right) of linear metric to BSA0.45 and area metric to BSA0.86. Optimized normalization was identified by finding the value of x that minimizes the average slope of Variable/BSAx vs. BSA across variables of each type. All annular metrics in mid-systole. Solid line = best fit line, shaded area = 95% confidence limits, dashed line = 95% prediction limits. p-values computed via linear regression t-test.
Traditional Annular Modeling
Annular metrics varied significantly in an individual patient through the cardiac cycle as presented in Table 3. Specifically, adjusted p-values in Supplementary Table S1 demonstrated statistically significant changes are observed between MS and MD annular dimensions and ES and ED. Annular height increased in systolic phases, while A-P distance contracted in systole.
Table 3.
Non-Normalized Annular Dimensions Throughout Cardiac Cycle
| Variable | ED | MS | ES | MD | Max Change (%) | p-value |
|---|---|---|---|---|---|---|
|
| ||||||
| Annular Height (cm) | 0.61 [0.51–0.75] | 0.64 [0.54–0.76] | 0.62 [0.53–0.74] | 0.55 [0.46–0.70] | 24 [16–33] | <0.001 |
| A-P Distance (cm) | 2.4 [2.1–2.8] | 2.6 [2.3–2.9] | 2.7 [2.4–3.1] | 2.5 [2.1–3.0] | 14 [10–19] | <0.001 |
| AL-PM Distance (cm) | 3.1 [2.7–3.5] | 3.1 [2.7–3.5] | 3.1 [2.7–3.5] | 3.2 [2.7–3.6] | 8 [6–13] | <0.001 |
| AHCWR | 0.20 [0.18–0.24] | 0.22 [0.20–0.25] | 0.21 [0.18–0.24] | 0.19 [0.17–0.21] | 28 [16–40] | <0.001 |
| Sphericity | 0.78 [0.73–0.83] | 0.86 [0.79–0.91] | 0.88 [0.83–0.95] | 0.80 [0.75–0.85] | 16 [11–22] | <0.001 |
Values listed are Median [IQR].
ED = End-diastole, MS = Mid-Systole, ES = End-Systole, MD = Mid-Diastole.
A-P = anterior-posterior, AL-PM = anterolateral-posteromedial.
AHCWR = annular height to commissural width ratio
Sphericity = A-P distance/AL-PM distance.
Max Change = maximum value in cardiac cycle (MD or ED) minus minimum value in cardiac cycle (MS or ES).
MA median metrics across the five stratified age groups are shown in Table 4. The annular height to commissural width ratio (AHCWR) of the mitral valve (“saddle shape”) changed significantly through age for systolic phases (p<0.001) but within a narrow range (Medians 0.20–0.25). Annular sphericity (anterior-posterior diameter/anterior-lateral to posterior-medial diameter ratio), did not significantly change across age. The results for annular metrics normalized to optimized BSA-indexing exponents are presented in the Appendix A.
Table 4.
Non-Normalized Annular Dimensions by Age Group
| Variable | <1 y (n=8) | 1–5 y (n=13) | >5–9 y (n=21) | >9–13 y (n=27) | >13 y (n=31) | All Ages (n=100) | p-value |
|---|---|---|---|---|---|---|---|
|
| |||||||
| BSA (m2) | 0.22 [0.2–0.3] | 0.68 [0.64–0.72] | 0.91 [0.87–0.94] | 1.22 [1.12–1.36] | 1.69 [1.61–1.75] | 1.13 [0.86–1.58] | -- |
| Annular Height (cm) | |||||||
| ED | 0.33 [0.30–0.38] | 0.53 [0.48–0.61] | 0.52 [0.47–0.59] | 0.62 [0.56–0.68] | 0.78 [0.69–0.92] | 0.61 [0.51–0.75] | <0.001 |
| MS | 0.37 [0.31–0.43] | 0.57 [0.54–0.60] | 0.60 [0.54–0.67] | 0.64 [0.57–0.70] | 0.84 [0.75–0.94] | 0.64 [0.55–0.76] | <0.001 |
| ES | 0.33 [0.30–0.40] | 0.53 [0.48–0.57] | 0.59 [0.53–0.63] | 0.61 [0.56–0.66] | 0.83 [0.71–0.94] | 0.62 [0.53–0.74] | <0.001 |
| MD | 0.32 [0.28–0.36] | 0.48 [0.45–0.52] | 0.52 [0.44–0.53] | 0.62 [0.53–0.66] | 0.72 [0.65–0.87] | 0.55 [0.46–0.70] | <0.001 |
| A-P Distance (cm) | |||||||
| ED | 1.3 [1.2–1.5] | 1.9 [1.7–2.1] | 2.1 [2.0–2.3] | 2.4 [2.3–2.6] | 2.9 [2.6–3.1] | 2.4 [2.1–2.8] | <0.001 |
| MS | 1.2 [1.2–1.5] | 2.1 [2.0–2.4] | 2.4 [2.3–2.5] | 2.7 [2.5–2.9] | 3.1 [2.8–3.4] | 2.6 [2.3–2.9] | <0.001 |
| ES | 1.3 [1.2–1.5] | 2.1 [2.1–2.3] | 2.5 [2.4–2.6] | 2.8 [2.5–2.9] | 3.3 [3.0–3.5] | 2.7 [2.4–3.1] | <0.001 |
| MD | 1.3 [1.2–1.5] | 2.0 [1.8–2.1] | 2.2 [2.1–2.4] | 2.6 [2.4–2.8] | 3.1 [2.9–3.3] | 2.5 [2.1–3.0] | <0.001 |
| AL-PM Distance (cm) | |||||||
| ED | 1.5 [1.3–1.7] | 2.5 [2.2–2.9] | 2.8 [2.6–3.0] | 3.2 [3.1–3.4] | 3.7 [3.4–3.8] | 3.1 [2.7–3.5] | <0.001 |
| MS | 1.4 [1.2–1.7] | 2.6 [2.4–2.8] | 2.8 [2.5–3.0] | 3.2 [3.1–3.4] | 3.5 [3.2–3.7] | 3.1 [2.7–3.5] | <0.001 |
| ES | 1.4 [1.2–1.7] | 2.5 [2.3–2.7] | 2.8 [2.6–3.0] | 3.2 [3.0–3.4] | 3.6 [3.4–3.8] | 3.1 [2.7–3.5] | <0.001 |
| MD | 1.5 [1.3–1.7] | 2.5 [2.4–2.7] | 2.9 [2.6–3.0] | 3.4 [3.2–3.5] | 3.7 [3.5–4.0] | 3.2 [2.7–3.6] | <0.001 |
| AHCWR | |||||||
| ED | 0.22 [0.20–0.24] | 0.21 [0.20–0.24] | 0.19 [0.17–0.2] | 0.20 [0.17–0.21] | 0.23 [0.19–0.24] | 0.20 [0.18–0.24] | 0.009 |
| MS | 0.25 [0.23–0.28] | 0.22 [0.20–0.25] | 0.22 [0.20–0.23] | 0.20 [0.18–0.22] | 0.24 [0.21–0.27] | 0.22 [0.20–0.25] | <0.001 |
| ES | 0.22 [0.21–0.27] | 0.21 [0.19–0.23] | 0.21 [0.19–0.23] | 0.19 [0.17–0.21] | 0.23 [0.20–0.26] | 0.21 [0.18–0.24] | <0.001 |
| MD | 0.21 [0.19–0.23] | 0.20 [0.17–0.21] | 0.18 [0.16–0.19] | 0.18 [0.16–0.19] | 0.20 [0.18–0.23] | 0.19 [0.17–0.21] | 0.007 |
| Sphericity | |||||||
| ED | 0.86 [0.77–0.93] | 0.77 [0.73–0.80] | 0.77 [0.73–0.80] | 0.78 [0.73–0.81] | 0.8 [0.73–0.86] | 0.78 [0.73–0.83] | 0.23 |
| MS | 0.93 [0.91–0.98] | 0.82 [0.79–0.89] | 0.85 [0.80–0.90] | 0.83 [0.79–0.88] | 0.88 [0.82–0.93] | 0.86 [0.79–0.91] | 0.02 |
| ES | 0.92 [0.90–0.96] | 0.86 [0.84–0.92] | 0.91 [0.80–0.97] | 0.86 [0.80–0.90] | 0.88 [0.84–1.0] | 0.88 [0.83–0.95] | 0.11 |
| MD | 0.84 [0.80–0.95] | 0.78 [0.73–0.82] | 0.79 [0.73–0.84] | 0.78 [0.75–0.84] | 0.83 [0.79–0.87] | 0.80 [0.75–0.85] | 0.05 |
Values listed are Median [IQR].
ED = End-diastole, MS = Mid-Systole, ES = End-Systole, MD = Mid-Diastole.
BSA = body surface area, A-P = anterior-posterior, AL-PM = anterolateral-posteromedial, AHCWR = annular height to commissural width ratio, Sphericity = A-P distance/AL-PM distance.
Shape Analysis of Mitral Annuli
The mid-systolic mean annular shape and principal modes of shape variation in the entire cohort are shown for shape aligned and shape+scale aligned MA data in Figure 3. The greatest variations in pediatric MA shape are physical size, AHCWR, and sphericity as elaborated in Video 1. A comparison of the explained variance ratios between the two PCA analyses are shown in Figure 4. Size accounted for 87% of the total variation in MA shape. When scale (physical size) is removed to isolate changes in annular shape, 34% of MA shape variation is due to AHCWR, and 18% of MA shape variation is due to sphericity (Figure 4).
Figure 3. Shape and Principal Component Analysis (PCA) of Mitral Annuli.

A. Mean shape of mitral annulus; B. Variation observed from PCA of shape-aligned annuli – Mode 1: size, Mode 2: AHCWR, Mode 3: sphericity; C. Variation observed from PCA of shape- and scale-aligned annuli – Mode 1: AHCWR, Mode 2: sphericity, Mode 3: other variation. PCA curves show variation +/− two standard deviations. Analysis performed in mid-systole across all age cohorts (0–22 years).
Figure 4. Explained Variance Ratio from Principal Component Analysis (PCA).

A. Shape-aligned; B. Shape- and scale-aligned mitral annuli. In Shape-Aligned PCA, Mode 1 explains 87% of the variation that occurs in our mitral annulus dataset, Mode 2 explains 4.5% of the variation, and Mode 3 explains 2.5% of the total variation. In Shape- and Scale-Aligned PCA, Mode 1 explains 34% of the variation that occurs in mitral annulus shape, Mode 2 explains 18% of the variation, and Mode 3 explains 11% of the total variation. To ensure the mitral annulus data is being analyzed correctly, we perform a Procrustes shape alignment to conduct “Shape-Aligned” PCA. When size is removed as a variation factor in PCA, we assess a shape- and scale-aligned dataset.
The shape and size-aligned comparison of MA mean models within each age cohort again displays a qualitatively consistent saddle shape but does not significantly change in dimensions. The 3D-printed MA mean shape models in MS demonstrate similar dimensional characteristics with increasing size due to age in Figure 5. This is echoed when MA shape is regressed across BSA and age in Video 2.
Figure 5. 3D Printed Mean Mitral Annular Curves Across Age.

A. Lateral view; B. Atrial view. Quarter provides reference of scale.
Open-Source Software Tools
The described annular modeling functionality has been implemented in the Annular Shape Analyzer module and is available open source at www.github.com/SlicerHeart and implemented in the SlicerHeart Extension for 3D Slicer [24].
DISCUSSION
We present a detailed analysis of the dynamic MA in a cohort of 100 structurally normal children and young adults. Our primary finding is that while MA parameters vary throughout the cardiac cycle, the shape is largely maintained across age and BSA. Further, we found that the primary modes of variation in the pediatric mitral annulus are physical size, AHCWR, and sphericity. Finally, the models of this cohort, in concert with newly created shape analysis tools, enables the creation of age- and size-specific 3D annular curves that may eventually inform the design of patient-specific annuloplasty rings for children.
We had previously published the general relationship between 3D mid-systolic mitral annular metrics and BSA but did not explore determination of the optimal relationship to BSA[12]. Notably, most allometric studies for valve anatomy have been limited to animal samples [25, 26]. However, Sluysman et el. had performed this analysis for 2D measurements of aortic annuli and they determined that linear metrics are best indexed to BSA0.5, and area metrics are best indexed to BSA when making allometric comparisons of heart anatomy across size[17, 26]. We initially normalized as per Sluysman et al. but found a resulting negative bias with this normalization. In further explorations we found linear metrics were optimally indexed to BSA0.45, and area metrics were optimally indexed to BSA0.86. To our knowledge, this is the first analysis of optimal normalization of 3D atrioventricular annular metrics in a pediatric population. This study also demonstrates how it may be difficult to observe changes in pediatric anatomic geometry without first establishing population-specific normalization indexes.
The pediatric mean MA shape varies throughout the cardiac cycle but closely follows the established paraboloid (“saddle shape”) as previously described for both the adult and pediatric MV. Specifically, the mid-systolic AHCWR median results for this dataset (0.22 IQR 0.20–0.25) came within a similar range to the adult mean results of AHCWR (0.22 ± 0.06) [20], however were slightly lower compared to our previous MA analysis using commercial software (0.24 IQR 0.22–0.28) [27]. Overall, MA dynamic shape in non-mid systolic phases paralleled previous studies of adult MA dynamics [1, 2, 28, 29]. In comparison, the adult normal MA undergoes contraction in AP diameter, with increase in annular height, at early systole [1, 28, 29]. These changes are through to aid coaptation between the anterior and posterior leaflet (decreased AP distance). Similarly, in our pediatric cohort we demonstrated decreasing values of AP diameter as the MV is about to close in ED, while annular height increases in systolic phases, generally consistent with prior work by Nii et al[14].
However, while simple Euclidean metrics (diameter, area) provide a concise and clinically familiar description of MA anatomy, shape analysis considers the complete morphology of an anatomic structure [21]. Shape analysis methods have previously supported characterization of the adult MV, complete atrioventricular canal, and the tricuspid valve in patients with hypoplastic left heart syndrome [20, 22, 23]. These methods further confirmed that the scaled pediatric MA shape is relatively preserved and invariant through childhood. Most changes in MA shape were attributed to scale(physical size), with only subtle variations influencing AHCWR, and sphericity, similar to previous analyses in normal adults [20]. AHCWR has been hypothesized to be important to reducing leaflet stress, and lower values are associated with clinically significant regurgitation [13, 22, 30]. Our findings of preservation of annular shape across a wide range of sizes of children and adults with normally functioning valves thus further supports the previously described importance of annular shape to MV function.
Clinical Implications
The established values for healthy MA shape through childhood and healthy MA dynamics in this study will allow comparison to dysfunctional valves and may help inform restoration of healthy MA shape with informed prediction of growth in childhood. Specifically, the Annulus Shape Analyzer module in combination with this open-data normal mitral cohort help facilitate patient-specific comparisons of dysfunctional annuli to normal pediatric annular shape and size. Further, regression across this population allows the creation of age-specific geometries with respect to patient demographics (e.g., BSA, age, or height) which could inform the design of annuloplasty rings for children.
Annuloplasty is a common form of valve repair in adults, and often employs an annuloplasty ring[31, 32]. However, the need for annular growth has traditionally restricted application of rings to older children to avoid developing elevated mitral inflow gradients with time[33–35]. Pediatric atrioventricular annuloplasty now offer a variety of options to help abate the effects of growth on the repair with suture based annuloplasty and the growing potential for the use of emerging absorbable or expandable annuloplasty rings [15, 36]. The 3D shapes and ability to regress across BSA thus creates the potential to generate size appropriate annular curves “on demand” to enable the generation of age- and size-specific annuloplasty devices [9, 15, 16]. MA shape for a given patient size may then act as a template for customized prosthetic design [37].
Limitations and Future Directions
This is a retrospective study. Acquisition of data was primarily conducted for left ventricular volume assessment and not specifically for MA analysis. 3DE acquisition focused on the MV would be expected to improve image quality, frame rates, and subsequent MA analysis. There may also be sample bias because of small sample numbers within the cohort and lack of patient cooperation from the younger children. Our analysis was semi-automatic; future application of automated annular tracking throughout the cardiac cycle may allow measurement of every frame of data and reduce interuser variability.
CONCLUSION
The MA saddle shape is largely maintained with growth throughout childhood but varies significantly throughout the cardiac cycle. The data and tools created by this work may inform the development of appropriately scaled mitral annuloplasty rings or expandable devices for children. However, further investigation of changes in MA dynamics with respect to mitral pathology and intervention in children is needed.
Supplementary Material
Video 1: Principal Component Analysis on Pediatric Normal Mitral Annuli Models
Video 2: Pediatric Mitral Annuli Shape Regression Over Age and Body Surface Area
Central Illustration. Framework for Euclidean Feature and Shape Characterization in Pediatric Mitral Annuli (MA).

Quantification of MA models allowed exploration of MA dynamics and allometric relations with respect to BSA. Shape Analysis was used calculate Mean Shape and Principal Component Analysis was applied to explore variations of the MA shape across the population. Finally, the MA models and MA analysis tool will facilitate future comparison of MA of dysfunctional valves to normal valves, and may inform design and selection of size-appropriate mitral annular rings. ED = end-diastole, MD = mid-diastole, MS = mid-systole, ES = end-systole. A-P Distance = Anterior-Posterior Distance. BSA = Body Surface Area.
Highlights.
We modeled the dynamic mitral annular(MA) shape of a pediatric cohort.
The dynamic MA shape varies throughout contraction but is maintained across age.
The MA varies slightly in shape, but primarily in annular size across childhood.
We provide a pediatric MA dataset and tools to enable future investigations
Funding:
This work was supported by the Department of Anesthesia and Critical Care at the Children’s Hospital of Philadelphia (CHOP), the Topolewski Pediatric Valve Center at CHOP, the Topolewski endowed chair, NIH R01HL153166, NIH R01EB021396-01A, and the Canarie Research Software foundation. Dr. Laurence was supported by NHLBI Training Grant 5T32HL007915-24. Dr. Fichtinger is supported as a Canada Research Chair in Computer-Integrated Surgery.
Abbreviations:
- 2D
Two – Dimensional
- 3DE
Three – Dimensional Echocardiography
- AA
Aortic Annulus
- A-P
Anterior-posterior
- AL-PM
Anterolateral-posteromedial
- AHCWR
Annular Height to Commissural Width Ratio
- BSA
Body Surface Area
- ED
End-diastolic
- ES
End-systolic
- IQR
Inter-quartile Range
- MA
Mitral Annulus
- MD
Mid-diastolic
- MS
Mid-systolic
- PCA
Principal Component Analysis
Footnotes
Disclosures: B. Paniagua, J. Vicory, and Y. Han are employees of Kitware, a company that supports open-source software. The other authors have no disclosures.
Publisher's Disclaimer: This is a PDF file of an unedited manuscript that has been accepted for publication. As a service to our customers we are providing this early version of the manuscript. The manuscript will undergo copyediting, typesetting, and review of the resulting proof before it is published in its final form. Please note that during the production process errors may be discovered which could affect the content, and all legal disclaimers that apply to the journal pertain.
REFERENCES
- [1].Grewal J, Suri R, Mankad S, et al. Mitral annular dynamics in myxomatous valve disease: new insights with real-time 3-dimensional echocardiography. Circulation. 2010;121:1423–31. [DOI] [PubMed] [Google Scholar]
- [2].Bartels K, Thiele RH, Phillips-Bute B, et al. Dynamic indices of mitral valve function using perioperative three-dimensional transesophageal echocardiography. J Cardiothorac Vasc Anesth. 2014;28:18–24. [DOI] [PubMed] [Google Scholar]
- [3].Salgo IS, Gorman JH 3rd, Gorman RC, et al. Effect of annular shape on leaflet curvature in reducing mitral leaflet stress. Circulation. 2002;106:711–7. [DOI] [PubMed] [Google Scholar]
- [4].Lee CH, Oomen PJA, Rabbah JP, et al. A High-Fidelity and Micro-anatomically Accurate 3D Finite Element Model for Simulations of Functional Mitral Valve. Funct Imaging Model Heart. 2013;7945:416–24. [DOI] [PMC free article] [PubMed] [Google Scholar]
- [5].Khabbaz KR, Mahmood F, Shakil O, et al. Dynamic 3-dimensional echocardiographic assessment of mitral annular geometry in patients with functional mitral regurgitation. Ann Thorac Surg. 2013;95:105–10. [DOI] [PMC free article] [PubMed] [Google Scholar]
- [6].Bruse JL, Ntsinjana H, Capelli C, et al. CMR-based 3D statistical shape modelling reveals left ventricular morphological differences between healthy controls and arterial switch operation survivors. J Cardiovasc Magn Reson. 2016;18. [Google Scholar]
- [7].Hoeijmakers MJMM, Waechter-Stehle I, Weese J, et al. Combining statistical shape modeling, CFD, and meta-modeling to approximate the patient-specific pressure-drop across the aortic valve in real-time. Int J Numer Method Biomed Eng. 2020;36:e3387. [DOI] [PMC free article] [PubMed] [Google Scholar]
- [8].Cheng Y, Hu Z, Li G, et al. Surgical repair of mitral valve bileaflet prolapse in pediatric patients. J Card Surg. 2021;36:1858–63. [DOI] [PubMed] [Google Scholar]
- [9].Ncho BE, Pierce EL, Bloodworth CHt, et al. Optimized mitral annuloplasty ring design reduces loading in the posterior annulus. J Thorac Cardiovasc Surg. 2020;159:1766–74 e2. [DOI] [PMC free article] [PubMed] [Google Scholar]
- [10].Pilgram R, Fritscher KD, Zwick RH, et al. Shape analysis of healthy and diseased cardiac ventricles using PCA. International Congress Series. 2005;1281:357–62. [Google Scholar]
- [11].Pouch AM, Wang H, Takabe M, et al. Fully automatic segmentation of the mitral leaflets in 3D transesophageal echocardiographic images using multi-atlas joint label fusion and deformable medial modeling. Med Image Anal. 2014;18:118–29. [DOI] [PMC free article] [PubMed] [Google Scholar]
- [12].Jolley MA, Ghelani SJ, Adar A, et al. Three-Dimensional Mitral Valve Morphology and Age-Related Trends in Children and Young Adults with Structurally Normal Hearts Using Transthoracic Echocardiography. J Am Soc Echocardiogr. 2017;30:561–71. [DOI] [PubMed] [Google Scholar]
- [13].Jolley MA, Hammer PE, Ghelani SJ, et al. Three-Dimensional Mitral Valve Morphology in Children and Young Adults With Marfan Syndrome. J Am Soc Echocardiogr. 2018;31:1168–77 e1. [DOI] [PMC free article] [PubMed] [Google Scholar]
- [14].Nii M, Roman KS, Macgowan CK, et al. Insight into normal mitral and tricuspid annular dynamics in pediatrics: a real-time three-dimensional echocardiographic study. J Am Soc Echocardiogr. 2005;18:805–14. [DOI] [PubMed] [Google Scholar]
- [15].Feins EN, Emani SM. Expandable Valves, Annuloplasty Rings, Shunts, and Bands for Growing Children. Semin Thorac Cardiovasc Surg. 2020;23:17–23. [DOI] [PubMed] [Google Scholar]
- [16].Feins EN, Lee Y, O’Cearbhaill ED, et al. A growth-accommodating implant for paediatric applications. Nat Biomed Eng. 2017;1:818–25. [DOI] [PMC free article] [PubMed] [Google Scholar]
- [17].Sluysmans T, Colan SD. Theoretical and empirical derivation of cardiovascular allometric relationships in children. J Appl Physiol (1985). 2005;99:445–57. [DOI] [PubMed] [Google Scholar]
- [18].Komoda T, Huebler M, Berger F, et al. Growth of mitral annulus in the pediatric patient after suture annuloplasty of the entire posterior mitral annulus. Interact Cardiovasc Thorac Surg. 2009;9:354–6. [DOI] [PubMed] [Google Scholar]
- [19].Van DH, Pham NHM, Nguyen VMT, et al. Isolated Congenital Mitral Regurgitation Repair in Children: Long-term Outcomes of Artificial Rings. Ann Thorac Surg. 2022;113:638–45. [DOI] [PubMed] [Google Scholar]
- [20].Pouch AM, Vergnat M, McGarvey JR, et al. Statistical assessment of normal mitral annular geometry using automated three-dimensional echocardiographic analysis. Ann Thorac Surg. 2014;97:71–7. [DOI] [PMC free article] [PubMed] [Google Scholar]
- [21].Vicory J, Herz C, Allemang D, et al. Statistical shape analysis of the tricuspid valve in hypoplastic left heart sydrome. Stat Atlases Comput Models Heart. 2022;13131:132–40. [DOI] [PMC free article] [PubMed] [Google Scholar]
- [22].Nam HH, Dinh PV, Lasso A, et al. Dynamic Annular Modeling of the Unrepaired Complete Atrioventricular Canal Annulus. Ann Thorac Surg. 2022;113:654–62. [DOI] [PMC free article] [PubMed] [Google Scholar]
- [23].Nguyen AV, Lasso A, Nam HH, et al. Dynamic Three-Dimensional Geometry of the Tricuspid Valve Annulus in Hypoplastic Left Heart Syndrome with a Fontan Circulation. J Am Soc Echocardiogr. 2019;32:655–66 e13. [DOI] [PMC free article] [PubMed] [Google Scholar]
- [24].Lasso A, Herz C, Nam H, et al. SlicerHeart: An open-source computing platform for cardiac image analysis and modeling. Front cardiovasc med. 2022;9:886549. [DOI] [PMC free article] [PubMed] [Google Scholar]
- [25].Ueda Y, Duler LMM, Elliot KJ, et al. Echocardiographic reference intervals with allometric scaling of 823 clinically healthy rhesus macaques (Macaca mulatta). BMC Vet Res. 2020;16:348. [DOI] [PMC free article] [PubMed] [Google Scholar]
- [26].Rovira S, Munoz A, Rodilla V. Allometric scaling of echocardiographic measurements in healthy Spanish foals with different body weight. Res Vet Sci. 2009;86:325–31. [DOI] [PubMed] [Google Scholar]
- [27].Jolley MA, Ghelani SJ, Adar A, et al. Three-Dimensional Mitral Valve Morphology and Age-Related Trends in Children and Young Adults with Structurally Normal Hearts Using Transthoracic Echocardiography. J Am Soc Echocardiogr. 2017;30:561–71. [DOI] [PubMed] [Google Scholar]
- [28].Mihaila S, Muraru D, Piasentini E, et al. Quantitative analysis of mitral annular geometry and function in healthy volunteers using transthoracic three-dimensional echocardiography. J Am Soc Echocardiogr. 2014;27:846–57. [DOI] [PubMed] [Google Scholar]
- [29].Jiang L, Owais K, Matyal R, et al. Dynamism of the mitral annulus: a spatial and temporal analysis. J Cardiothorac Vasc Anesth. 2014;28:1191–7. [DOI] [PubMed] [Google Scholar]
- [30].Levack MM, Jassar AS, Shang EK, et al. Three-dimensional echocardiographic analysis of mitral annular dynamics: implication for annuloplasty selection. Circulation. 2012;126:S183–8. [DOI] [PMC free article] [PubMed] [Google Scholar]
- [31].Carpentier AF, Lessana A, Relland JY, et al. The “physio-ring”: an advanced concept in mitral valve annuloplasty. Ann Thorac Surg. 1995;60:1177–85; discussion 85–6. [DOI] [PubMed] [Google Scholar]
- [32].Maisano F, Caldarola A, Blasio A, et al. Midterm results of edge-to-edge mitral valve repair without annuloplasty. J Thorac Cardiovasc Surg. 2003;126:1987–97. [DOI] [PubMed] [Google Scholar]
- [33].Yamamoto Y, Nomura K, Murayama F, et al. De Vega Tricuspid Annuloplasty for Pediatric Patients: Growth Potential of the Plicated Annulus. Pediatr Cardiol. 2021;42:1854–61. [DOI] [PubMed] [Google Scholar]
- [34].Ngaba NN, Lesbre JP, Hange N, et al. Mid and long-term follow-up of 50 pediatric cardiac Chadians operated in France from 2003 to 2012. Pan Afr Med J. 2022;42:66. [DOI] [PMC free article] [PubMed] [Google Scholar]
- [35].Chan KL, Chen SY, Chan V, et al. Functional significance of elevated mitral gradients after repair for degenerative mitral regurgitation. Circ Cardiovasc Imaging. 2013;6:1041–7. [DOI] [PubMed] [Google Scholar]
- [36].Cheng Y, Li H, Li G, et al. Surgical Results of Mitral Valve Repair for Mitral Regurgitation in Pediatric Patients with Mitral Valve Prolapse. Pediatr Cardiol. 2022;43:1578–86. [DOI] [PubMed] [Google Scholar]
- [37].Illi J, Bernhard B, Nguyen C, et al. Translating Imaging Into 3D Printed Cardiovascular Phantoms: A Systematic Review of Applications, Technologies, and Validation. JACC Basic Transl Sci. 2022;7:1050–62. [DOI] [PMC free article] [PubMed] [Google Scholar]
Associated Data
This section collects any data citations, data availability statements, or supplementary materials included in this article.
Supplementary Materials
Video 1: Principal Component Analysis on Pediatric Normal Mitral Annuli Models
Video 2: Pediatric Mitral Annuli Shape Regression Over Age and Body Surface Area