

Abstract
Objective:
To assess the relationship between magnetic resonance imaging (MRI)-based estimation of pancreatic fat and histology-based measurement of pancreatic tissue composition.
Methods:
In this retrospective study, MRI was used to noninvasively estimate pancreatic fat content in preoperative images from high-risk individuals in the Cancer of the Pancreas Screening (CAPS) study who underwent surveillance and from disease controls having normal pancreata. A deep learning algorithm was used to label eleven tissue components at micron resolution in subsequent pancreatectomy specimens. The components labeled included: normal ductal epithelium, pancreatic cancer precursors (pancreatic intraepithelial neoplasia and intraepithelial papillary mucinous neoplasia), pancreatic cancer, islets of Langerhans, acini, smooth muscle, nerves, collagen, duodenum, lymph nodes, and fat. Researchers manually annotated MRI images and histologic slides to exclude extra-pancreatic tissues. A linear model was used to determine the correlation between histologic tissue composition and MRI fat estimation.
Results:
27 patients (mean age 64.0 ± 12.0 years [standard deviation], 15 women) were evaluated. The fat content measured by MRI ranged from 0 – 36.9%. Intrapancreatic histologic tissue fat content ranged from 0.8 – 38.3%. MRI estimation of pancreatic fat content positively correlated with microanatomical composition of fat in the same region of the pancreas (r= 0.90 [95%CI 0.83 : 0.95], p<0.001); as well as with pancreatic cancer precursor (r= 0.65 [95%CI 0.44 : 0.79], p<0.001); and collagen (r= 0.46 [95%CI 0.20 : 0.66], p<0.001) content, and negatively correlated with pancreatic acinar (r= −0.85 [95%CI −0.91 : −0.74], p<0.001) content.
Conclusion:
MRI and histologic measurements of pancreatic parenchymal fat content closely correlate. High pancreatic fat content similarly correlates to acinar content, stromal content (fibrosis), and presence of benign neoplastic precursors of cancer.
Keywords: Deep learning, pancreatic cancer, MRI, fat
Introduction
Fatty pancreas, or fatty infiltration of the pancreatic tissue (1, 2), is associated with serious conditions including obesity (3, 4), diabetes mellitus (4–6), fatty liver disease (6–8), pancreatitis (9–11), and pancreatic ductal adenocarcinoma (11–14). These conditions are associated with additional changes to the pancreatic microenvironment including a loss of β-cells within the islets of Langerhans, increased pancreatic collagen content, acinar atrophy, and development of pancreatic cancer precursor lesions (15–17). Many of these pathologies are microscopic and therefore not visualized by clinical imaging tests. Noninvasive tools capable of quantifying fat in the pancreas could be useful determiners of histologic changes and pancreatic diseases.
Prior reports correlate pancreatic fat content measured by MRI- and CT- with histology determined by visual inspection of a limited number of tissue sections (5, 14, 18, 19), which may limit the accuracy of the comparison. Recent deep learning-based tissue segmentation algorithms are capable of rapidly deconvolving histologic slides into their various microanatomical components (20–24). These algorithms allow rapid, consistent calculation of tissue composition that can be quantitatively validated. Additionally, deep learning algorithms can discern diverse pancreatic structures, allowing comparisons of fat content to a large number of other pancreatic tissue components.
The purpose of this study was two-fold. First, we sought to corroborate the relation between MRI-based and histology-based measurements of pancreatic fat content using deep learning-based histologic fat quantification. Second, an accurate estimate of pancreatic fat content with MRI could serve a stand in for other pathologies. We aimed to evaluate other anatomical correlates of MRI-based pancreatic fat measurements, including pancreatic neoplasia, stroma, and acinar dropout to determine whether MRI-based estimation of pancreatic fat content is accurate enough to recapitulate histologic correlates of pancreatic fat content to stromal content, acinar content, and pancreatic cancer precursor content. To enable this, we first calculated the correlation between histology-based measures of different pancreatic tissue components. We reasoned that measurable changes to the pancreatic architecture, such as pancreatic fat fraction as estimated in MRI, may allow indirect evidence of the presence of pancreatic cancer precursor lesions.
In order to increase the likelihood our cohort that contained a wide spectrum of pancreatic fat, stroma, and pancreatic cancer precursor lesion compositions, we examined the histology and MRI images both from patients in the CAPS program who underwent resection for worrisome pancreatic imaging findings and from disease controls whose pancreata were resected for other indications.
Materials and Methods
This retrospective study was approved by the Johns Hopkins University School of Medicine institutional review board.
Study Subjects
Individuals who underwent regular pancreatic surveillance for their increased risk for pancreatic cancer (high risk individuals or HRI) participated in a series of institutional review board (IRB)-approved prospective cohort studies at the Johns Hopkins Hospital from 1998 to 2019 (Cancer of the Pancreas Screening Studies CAPS1-5 (25–27)). The HRIs were enrolled based on either family history criteria, which included individuals who had at least one first-degree relative with PDAC, and who were part of a kindred with at least one pair of affected first-degree relatives (familial pancreatic cancer kindred), or mutation criteria (carriers of a germline deleterious variant in a gene associated with hereditary pancreatic cancer (ATM, BRCA1, BRCA2, PALB2, STK11 or CDKN2A pathogenic germline variant and/or familial atypical mole melanoma FAMMM, Lynch syndrome, or Peutz-Jeghers syndrome (PJS). The CAPS screening protocol consisted of baseline MRI and EUS, followed by either MRI or EUS alternating annually. Those HRIs who developed a pancreatic lesion concerning for pancreatic cancer or a high-grade pancreatic cancer precursor neoplasm, such as intraductal papillary mucinous neoplasm (IPMN) or pancreatic intra-epithelial neoplasia (PanIN) with high-grade dysplasia were offered operative treatment after a multidisciplinary conference. Of the 47 HRI who had pancreatic resections, in 15 the histologic slides and the pre-surgical MRI sequences and images were available (Figure 1).
Figure 1.

Flow diagram of the subjects shows the selection of patients, including high-risk individuals (HRIs) and control subjects.
Control subjects were non-high-risk individuals selected from a series of consented patients at the Johns Hopkins Hospital who underwent surgical resection of parts of their pancreas for either benign non-precursor lesions of the pancreas (e.g. serous cystadenomas, hemangiomas, heterotrophic spleen), or non-pancreatic lesions (e.g. duodenal adenomas) and were included if they had an MRI less than three months prior to surgery and had available histologic slides from their resection. For the normal pancreas controls, histologic sections were selected from the pancreas downstream from the resected lesion to minimize any potential upstream obstructive effects on the ducts and parenchyma analyzed.
The median time between pre-surgical MRI and surgery in days for all subjects was 56, with an interquartile range of 108 days.
Assessment of Pancreatic Fat Content in MRI images
Cross-sectional MRI images were acquired using a 3 Tesla scanner (MAGNETOM Tim Trio; Siemens Healthcare, Erlangen, Germany), equipped with an 18-channel phased-array body coil in combination with a 32-channel spine matrix coil. Patients were scanned in the supine position. Each sequence was acquired at the end of inspiration in a single breath-hold. The imaging protocol included a dual-echo volumetric interpolated breath-hold examination (VIBE) Dixon-method which was used to quantify the fat fraction of the pancreas. The sequence is a commercially available, three-dimensional parallel-accelerated VIBE sequence prototype, and was performed to acquire opposed- and in-phase echoes. Sequence parameters were as follows: Repetition time 3.8 ms, opposed-phase echo time 1.22 ms, in-phase echo time 2.45 ms, flip angle 10°, readout echo bandwidth 1300 Hz/pixel, field of view 440 mm, and slice thickness 3 mm. The acquisition was completed in a single breath-hold of about 20 s. As in previous work that used MRI to quantitate organ fat fraction ,(28, 29) the opposed-phase and in-phase images were then used to calculate the fat fraction of the pancreas according to following equation: fat fraction=(in-phase - opposed-phase)/2*in-phase. Of note, this MRI method cannot quantify fat content >50%. The in-phase and opposed-phase images are acquired in the same acquisition. The ROIs are placed on the in-phase images and copied and pasted on the opposed-phase images to ensure identical localization.
Two readers who were not aware of the surgical and histologic findings measured the MRI fat fraction values by manually drawing three regions of interest (ROIs) on the fat fraction maps of the dual-echo Dixon sequence (Figure 2). Three oval ROIs with at least 1 cm2 diameter were placed in the head, body, and tail of the pancreas. The ROIs were carefully placed over the pancreatic parenchyma, avoiding surrounding peripancreatic fat, large vasculature, bile duct and duodenum. Each reader determined a fat fraction for the pancreatic head, body, and tail, as well as an overall pancreatic fat fraction (determined as an average of the head, body, and tail measurements). These fat fraction averages did not take into account ROI size, instead ranking head, body, and tail measurements equally and requiring each ROI to be ≥1 cm2. The fat fraction value from the portion of the pancreas that was surgically resected was used for pathologic correlation, where the average of the fat fractions as determined by the two independent readers was correlated with pathologic data. Inter-reader agreement of average fat fraction was calculated through assessment of the percent difference between fat fraction calculated between observer 1 and observer 2.
Figure 2.

Sample images showing MRI-based pancreatic fat quantification. (a) Areas (AR) with minimum size of 1cm2 were manually identified in the pancreatic head, body, and tail. In each region the average signal intensity (AV) was compared between the in-phase and out-of-phase sequence to estimate the intrapancreatic fat content. In this example, an average fat content of 32% was obtained. (b) Violin plot presenting percent difference in fat fraction as calculated by two independent readers. Median: 1%, Interquartile range (IQR): 2%.
Deep Learning Determination of Histologic Composition
CODA, a previously described convolutional neural network designed for rapid labelling of tissue microanatomy(22) was retrained here to label eleven tissue types in digitized images of the hematoxylin and eosin (H&E) stained slides: normal ductal epithelium, pancreatic intraductal precursor lesions (PanIN or IPMN), pancreatic cancer, islets of Langerhans, acini, blood vessels, nerves, collagen, duodenum, lymph nodes, and fat (fat referring to adipocytes and their minimal associated connective tissues, not to intracellular lipids in epithelia). Of the 421 histologic images in this work, 50 were used for training and validation and five were used for independent testing of model accuracy. A resnet50 network was adapted for DeepLab v3+ semantic segmentation (30) and trained to a validation patience of five. The final model obtained an overall accuracy of 89.7% and was used to label components of the 421 histologic images to a resolution of 1μm / pixel.
During image classification, it was noted that many of the histologic slides contained extra-pancreatic components. Because the pancreas is not surrounded by a well-defined capsule, the periphery of the pancreas mingles imperceptibly with extra-pancreatic structures, particularly extra-pancreatic fat, and these structures are often resected along with the pancreas. The existence of extra-pancreatic structures in histologic sections could obfuscate the assessment of pancreatic tissue composition. This extra pancreatic fat was excluded from the analysis through manual annotation of non-pancreatic tissues. As the lack of a defining capsule around the pancreas presents a challenge when distinguishing between true extra-pancreatic fat and excessive fatty replacement of the acinar tissue, three independent readers followed predetermined guidelines to remove extra-pancreatic tissues, and these measures were evaluated for consistency:
The three researchers who were blinded to the MRI findings, separately reviewed the histologic images. A script written in MATLAB 2021b to rapidly display each image, allowing the researchers to digitally outline the pancreatic parenchyma. Large peripheral regions of fat, connective tissue, non-pancreatic tissue such as duodenum or lymph nodes, and tissue containing cancer, were excluded. The histologic analysis included all pancreatic anatomical components including pancreatic ducts, acinar lobules, pancreatic fat, and pancreatic stroma. Fat was determined to be intra-pancreatic if it was surrounded by acinar lobules or contained sparse islets of Langerhans (which may indicate atrophy of the exocrine pancreas and fatty replacement, leaving behind endocrine structures within the fat). Three researchers independently decided which components of tissue sections to exclude due to the subjective nature of determining the precise edge of the pancreas in histologic images. The three researchers’ outlines were compared by calculation of the Intersection over Union of the three masks per image. Pancreatic histologic fractions were determined by taking the mean of the results of each of the three researchers.
The images were sorted by patient ID and by the approximate anatomic location within the pancreas (head, body, or tail) from which they were taken. For each histologic tissue type (acini, fat, collagen, etc.), the volumetric tissue composition was calculated per image with and without excluding the non-pancreas tissue, using the manual annotations described above. For a given tissue type, volumetric tissue composition percentage is defined as the number of pixels of that tissue type normalized by the total number of tissue pixels per histologic image.
Statistical Analyses
The linear dependence between the MRI and histologic fat measurements was determined by calculation of their correlation coefficient, r, and linear relationships are reported using the square of the correlation coefficient, r2. P-values were determined using the Wilcoxon rank sum test. Linear lines of best fit and 95% confidence intervals (95%CI) were used to further visualize the correlation of the histologic and MRI data. Intersection-over-union was used to compare the different manual annotations of the histologic pancreatic area. All calculations were performed using MATLAB 2021b.
Results
Study Demographics
Fat compositions as determined by MRI and as quantified histologically were compared across the cohort of 27 patients (15 HRI, 12 normal pancreas controls), with mean age 64.0 ± 12.0 years, a gender ratio of 15 women:12 men, and a BMI ratio of 7 normal:16 overweight:4 obese. An average of 15.6 ± 21.4 histologic images were analyzed for each patient. The set of histologic images contained repeat samples from different anatomic locations in the pancreas, resulting in a ratio of 18 pancreatic head:17 pancreatic body:14 pancreatic tail measurements (49 total) (Table 1).
Table 1.
Study participant characteristics
| Characteristic | Interquartile | ||
|---|---|---|---|
| Ratio | Range | Median | |
| Age | - | 15.8 | 65 |
| Sex (# female : # male) | 15 : 12 | - | - |
| BMI (# normal : # overweight : # obese) | 7 : 16 : 4 | - | - |
| Number of histological samples per patient | - | 38.5 | 12 |
| Location of histology / MRI measurement in pancreas (# head : # body : # tail) | 18 : 17 : 14 | - | - |
Assessment of Histologic Tissue and MRI Fat Compositions
Volumetric tissue composition of each labelled component was determined following deep learning semantic segmentation of the histologic images. Average MRI intrapancreatic fat percentage was also measured, and these data are summarized in Table 2.
Table 2.
Summary of magnetic resonance imaging and histologic tissue measurements
| MRI composition (volume %) | Overall histologic composition (volume %) | Intrapancreatic histologic composition (volume %) | ||||
|---|---|---|---|---|---|---|
|
| ||||||
| Interquartile Range | Median | Interquartile Range | Median | Interquartile Range | Median | |
| Fat | 12.0 | 5.3 | 20.2 | 23.8 | 13.7 | 10.0 |
| Precancer | - | - | 0.6 | 0.3 | 0.6 | 0.3 |
| Collagen | - | - | 12.3 | 16.0 | 9.0 | 10.8 |
| Islets of Langerhans | - | - | 1.2 | 0.8 | 1.3 | 1.1 |
| Normal ductal epithelium | - | - | 0.2 | 0.2 | 0.2 | 0.2 |
| Smooth muscle | - | - | 2.9 | 3.4 | 1.5 | 2.1 |
| Acini | - | - | 28.4 | 54.2 | 18.0 | 74.2 |
Comparison of the Correlation between Histology-Based Measures of Pancreas Tissue Composition
We first assessed the interrelation between the histology-based measures of pancreatic tissue composition. The correlation between the histology-based measures of pancreas composition was computed between the seven histologically-detected components (Figure 4). We identified several correlations worth noting (with 95%CI lower and upper bounds in parentheses): correlation of histologic fat to pancreatic cancer precursor lesions: 0.61 (0.39 : 0.76); correlation of histologic fat to collagen: 0.42 (0.16 : 0.63); correlation of histologic fat to pancreatic acini: −0.88 (−0.93 : −0.79); correlation of pancreatic cancer precursor lesions to collagen: 0.54 (0.31 : 0.72); correlation of pancreatic cancer precursor lesions to pancreatic acini: −0.71 (−0.83 : −0.53); and correlation of collagen to pancreatic acini: −0.79 (−0.88 : −0.66). We next assessed whether the noted correlations between fat and pancreatic tissue components found in the histologic data could be replicated using MRI-based estimation of fat fraction.
Figure 4.

Correlation matrix comparing histology-based compositional data. The correlation coefficient for each pair of deep learning measured histology-based features was computed and displayed in heatmap form.
Relation between Histology-Based Measures of Tissue Composition and MRI-Based Measures of Fat
MRI fat content and histologic composition were compared separately for the seven pancreatic tissue components identified by the segmentation algorithm (excluding duodenum, lymph node, cancer, and other non-pancreatic structures). The percent difference in the two observer’s fat fraction estimation was determined (Figure 2B), with median of 1% and interquartile range of 2%. The median overlap in manual annotations excluding non-pancreatic structures was 89.9%, with an interquartile range of 12.7% (Figure 3D). Correlation coefficients between MRI fat and overall histologic tissue percentage were as follows, including both the intrapancreatic tissues (IP) and extrapancreatic (EP) tissues on the slides, as defined in the materials and methods section (Figure 5A).
Figure 3.
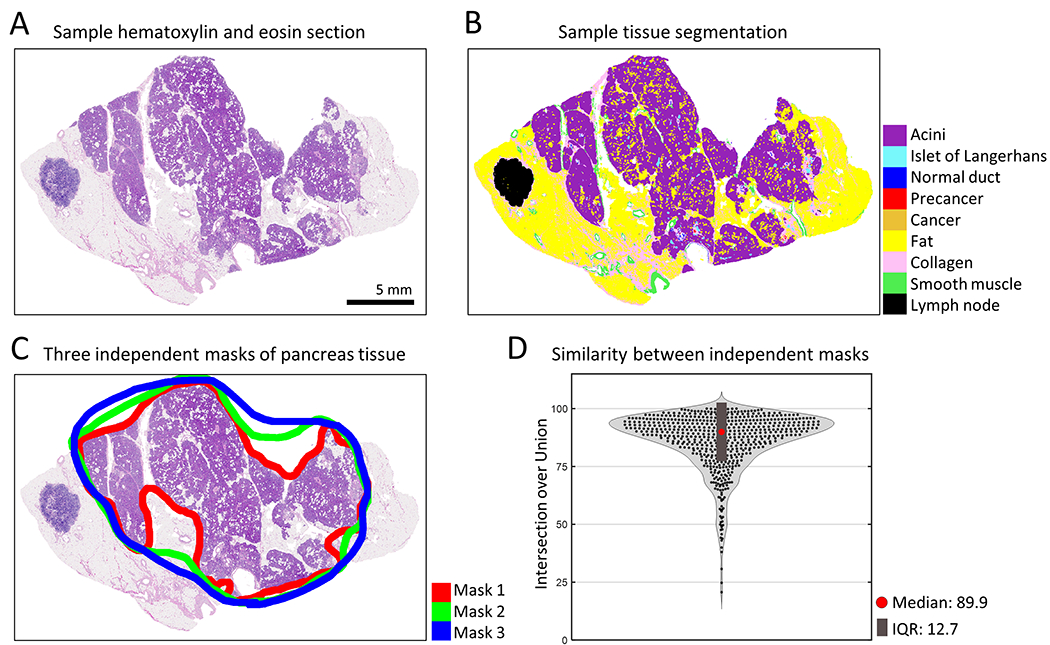
Measuring microanatomical pancreatic tissue. (a) Example of a hematoxylin and eosin (H&E) stained section of human pancreas. (b) Deep learning semantic segmentation of H&E section allows quantification of eleven pancreatic tissue components. (c) Manual annotation of pancreatic tissue by three independent researchers allows exclusion of structures such as lymph nodes and extra-pancreatic fat. (d) A violin plot displays the similarity between the three researchers’ annotations of pancreatic tissue area per histologic image. Intersection over union of the annotated tissue area was calculated for each image. Median: 89.9%, Interquartile range (IQR): 12.7%.
Figure 5.

Correlations of histologic to MRI data. (a) Correlation coefficient between MRI-derived pancreatic fat and histology-derived pancreatic tissue components. The leftmost column depicts correlations between MRI values and all histologic data. The rightmost column depicts correlations between MRI values and intrapancreatic histologic data (excluding non-pancreatic tissues such as lymph nodes and duodenum). (b) Scatter plot linearly relating MRI fat to histologic intrapancreatic fat. (c) Scatter plot linearly relating MRI fat to histologic intrapancreatic acini. (d) Scatter plot linearly relating MRI fat to histologic intrapancreatic pancreatic precursor lesions. (e) Scatter plot linearly relating MRI fat to histologic intrapancreatic collagen.
Correlation coefficients for positive correlations of MRI-based fat to various histologic components (with 95%CI lower and upper bounds in parentheses): overall fat: 0.57 (0.38 : 0.71); overall pancreatic cancer precursor lesion: 0.43 (0.22 : 0.61); overall collagen: 0.06 (−0.18 : 0.29). Correlation coefficients for negative correlations: overall islets: −0.08 (−0.32 : 0.16); overall normal ductal epithelium: −0.29 (−0.49 : −0.06); overall smooth muscle: −0.15 (−0.38 : 0.71); overall acini: −0.40 (−0.58 : −0.18). After repeating the correlation calculation for the intrapancreatic components only, we observed that correlation of all components with MRI fat percentage improved. Correlation coefficients for positive correlations (with 95%CI lower and upper bounds in parentheses): IP fat: 0.90 (0.83 : 0.95); IP pancreatic cancer precursor: 0.65 (0.44 : 0.79); IP collagen: 0.46 (0.20 : 0.66). Correlation coefficients for negative correlations: IP islets: −0.04 (−0.32 : 0.24); IP normal ductal epithelium: −0.14 (−0.41 : 0.15); IP smooth muscle: −0.23 (−0.48 : 0.07); IP acini: −0.85 (−0.91 : −0.74).
To further investigate the correlations, we determined the linear fit for the four pancreatic tissue components determined to have strong correlation with MRI fat (absolute value >0.4, Figures 5B-4E). IP histologic fat percentage, pancreatic cancer precursor lesion percentage, and collagen percentage presented strong positive correlations with MRI fat (r2=0.81, p<0.001; r2=0.42, p<0.001; r2=0.21, p<0.001). IP histologic acinar percentage had a strong negative correlation with MRI fat (r2=0.72, p<0.001), suggesting an inverse relationship between pancreatic acinar content and pancreatic fat content.
Discussion
Here, we compare MRI-based measurements of pancreatic fat content to histology-based measurements of pancreatic microanatomic composition. We show two improvements on previous work.
First, where past studies calculated histologic fat content using visual inspection by trained pathologists (5, 14, 18, 19), we use a novel deep learning approach to measure fat content at high accuracy and at micron resolution. Second, we compare noninvasive MRI-based pancreatic fat measurements to additional histology-based pancreatic components, including percent of pancreatic acini, pancreatic cancer precursor neoplasms, and islets of Langerhans, allowing us to examine the relationship between fatty infiltration of the pancreas and tissue compositions.
We confirm that MRI-based estimates of fat content correlate closely with histology-based pancreatic fat content. We additionally show that MRI-based fat content correlates positively with the histology-based pancreatic cancer precursor lesion and collagen content, and negatively with histology-based pancreatic acinar tissue. Previous studies observed that increased stromal content and decreased acinar content occurs in areas involved with pancreatic neoplasia (31). We provide further evidence that fat, as well as denser stromal tissues, replace atrophied pancreatic lobules.
Our results are important for future studies related to surveillance of HRIs undergoing repeated MRI imaging as part of a pancreatic cancer early detection or prevention strategy. We show that MRI-measured pancreatic fat content positively correlates with histologically-measured pancreatic cancer precursor lesion content. Currently, patients at high risk for development of pancreatic cancer undergo routine surveillance including use of MRI and EUS imaging. Patients with visible pancreatic cysts in diagnostic imaging are advised to undergo pancreatectomies to remove what may be large pancreatic cancer precursor lesions called intraductal papillary mucinous neoplasms or IPMNs, if there are associated visible high risk or worrisome features. The data shown in this study indicates that high pancreatic fat content as measured by MRI may be another indicator that a patient has microscopic pancreatic cancer precursor lesions not detectable by current clinical MRI. The use of MRI to estimate pancreatic fat has the potential to provide better estimates of the extent of pancreatic neoplasia, thereby helping to select HRI for surgical intervention.
Our study has some limitations. Due to the relatively small sample size used here, more research to prospectively validate our methods and results in specific larger patient populations is needed. Another limitation of the MRI fat fraction estimation method used in this study is that it cannot quantify fat fractions >0.50. However, none of the 27 pancreas cases in this study had this much fat (the median fat fraction was 0.23 and the highest fat fraction was 0.37, suggesting that even ‘fatty’ pancreases may contain fat fractions <0.50.
Key points.
Pancreatic fat content as measured in MRI correlates strongly with pancreatic fat content as measured via deep learning in histology.
Pancreatic fat content as measured in MRI correlates positively with pancreatic intraepithelial neoplasia, and collagen, and correlates negatively with pancreatic acinar content as measured via deep learning in histology.
Conflicts of Interest and Source of Funding
The authors declare no competing interests. Funding sources are as follows: National Institutes of Health / National Cancer Institute U54CA268083, CA210170. Susan Wojcicki and Dennis Troper. The Rolfe Foundation for Pancreatic Cancer Research, Allegheny Health Network – Johns Hopkins Cancer Research Fund. Lustgarten Foundation-AACR Career Development Award for Pancreatic Cancer Research, in Honor of Ruth Bader Ginsburg. The Carl and Carol Nale Fund for Pancreatic Cancer Research. Stand Up To Cancer-Lustgarten Foundation Pancreatic Cancer Interception Translational Cancer Research Grant (Grant Number: SU2C-AACR-DT25-17). Stand Up To Cancer is a program of the Entertainment Industry Foundation. SU2C research grants are administered by the American Association for Cancer Research, the scientific partner of SU2C. Pancreatic Cancer Hope Foundation.
List of abbreviations
- BMI
body mass index
- H&E
hematoxylin and eosin
- HRI
high risk individuals
- IPMN
intraductal papillary mucinous neoplasm
- MRI
magnetic resonance imaging
- PanIN
pancreatic intra-epithelial neoplasia
- ROI
region of interest
- VIBE
volumetric interpolated breath-hold examination
- 95%CI
95% confidence interval
References
- 1.Tariq H, Nayudu S, Akella S, Glandt M, Chilimuri S. Non-Alcoholic Fatty Pancreatic Disease: A Review of Literature. Review Gastroenterol Res 2016; p. 87–91. [DOI] [PMC free article] [PubMed] [Google Scholar]
- 2.Majumder S, Philip NA, Takahashi N, Levy MJ, Singh VP, Chari ST. Fatty Pancreas: Should We Be Concerned? Pancreas: NIH Public Access, 2017; p. 1251. [DOI] [PMC free article] [PubMed] [Google Scholar]
- 3.Choi CW, Kim GH, Kang DH, Kim HW, Kim DU, Heo J, Song GA, Park DY, Kim S. Associated factors for a hyperechogenic pancreas on endoscopic ultrasound. World Journal of Gastroenterology : WJG: Baishideng Publishing Group Inc, 2010; p. 4329. [DOI] [PMC free article] [PubMed] [Google Scholar]
- 4.Saisho Y, Butler AE, Meier JJ, Monchamp T, Allen-Auerbach M, Rizza RA, Butler PC. Pancreas volumes in humans from birth to age one hundred taking into account sex, obesity, and presence of type-2 diabetes. Clinical Anatomy: John Wiley & Sons, Ltd, 2007; p. 933–942. [DOI] [PMC free article] [PubMed] [Google Scholar]
- 5.Lingvay I, Esser V, Legendre JL, Price AL, Wertz KM, Adams-Huet B, Zhang S, Unger RH, Szczepaniak LS. Noninvasive Quantification of Pancreatic Fat in Humans. The Journal of Clinical Endocrinology & Metabolism: Oxford Academic, 2009; p. 4070–4076. [DOI] [PMC free article] [PubMed] [Google Scholar]
- 6.Wang CY, Ou HY, Chen MF, Chang TC, Chang CJ. Enigmatic ectopic fat: prevalence of nonalcoholic fatty pancreas disease and its associated factors in a Chinese population. Journal of the American Heart Association 2014. [DOI] [PMC free article] [PubMed] [Google Scholar]
- 7.Della Corte C, Mosca A, Majo F, Lucidi V, Panera N, Giglioni E, Monti L, Stronati L, Alisi A, Nobili V. Nonalcoholic fatty pancreas disease and Nonalcoholic fatty liver disease: more than ectopic fat. Clinical Endocrinology: John Wiley & Sons, Ltd, 2015; p. 656–662. [DOI] [PubMed] [Google Scholar]
- 8.Uygun A, Kadayifci A, Demirci H, Saglam M, Sakin YS, Ozturk K, Polat Z, Karslioglu Y, Bolu E. The effect of fatty pancreas on serum glucose parameters in patients with nonalcoholic steatohepatitis. European Journal of Internal Medicine: Elsevier, 2015; p. 37–41. [DOI] [PubMed] [Google Scholar]
- 9.Navina S, Acharya C, DeLany JP, Orlichenko LS, Baty CJ, Shiva SS, Durgampudi C, Karlsson JM, Lee K, Bae KT, Furlan A, Behari J, Liu S, McHale T, Nichols L, Papachristou GI, Yadav D, Singh VP. Lipotoxicity causes multisystem organ failure and exacerbates acute pancreatitis in obesity. Science Translational Medicine: American Association for the Advancement of Science, 2011. [DOI] [PMC free article] [PubMed] [Google Scholar]
- 10.Matsuda A, Makino N, Tozawa T, Shirahata N, Honda T, Ikeda Y, Sato H, Ito M, Kakizaki Y, Akamatsu M, Ueno Y, Kawata S. Pancreatic Fat Accumulation, Fibrosis, and Acinar Cell Injury in the Zucker Diabetic Fatty Rat Fed a Chronic High-Fat Diet. Pancreas: Wolters Kluwer Health, 2014; p. 735. [DOI] [PMC free article] [PubMed] [Google Scholar]
- 11.Tomita Y, Azuma K, Nonaka Y, Kamada Y, Tomoeda M, Kishida M, Tanemura M, Miyoshi E. Pancreatic fatty degeneration and fibrosis as predisposing factors for the development of pancreatic ductal adenocarcinoma. Pancreas: Lippincott Williams and Wilkins, 2014; p. 1032–1041. [DOI] [PubMed] [Google Scholar]
- 12.Hori M, Takahashi M, Hiraoka N, Yamaji T, Mutoh M, Ishigamori R, Furuta K, Okusaka T, Shimada K, Kosuge T, Kanai Y, Nakagama H. Association of Pancreatic Fatty Infiltration With Pancreatic Ductal Adenocarcinoma. Clinical and Translational Gastroenterology: American College of Gastroenterology, 2014; p. e53. [DOI] [PMC free article] [PubMed] [Google Scholar]
- 13.Rebours V, Gaujoux S, d’Assignies G, Sauvanet A, Ruszniewski P, Lévy P, Paradis V, Bedossa P, Couvelard A. Obesity and Fatty Pancreatic Infiltration Are Risk Factors for Pancreatic Precancerous Lesions (PanIN). Clinical Cancer Research: American Association for Cancer Research, 2015; p. 3522–3528. [DOI] [PubMed] [Google Scholar]
- 14.Mathur A, Hernandez J, Shaheen F, Shroff M, Dahal S, Morton C, Farrior T, Kedar R, Rosemurgy A. Preoperative computed tomography measurements of pancreatic steatosis and visceral fat: prognostic markers for dissemination and lethality of pancreatic adenocarcinoma. Hpb: Elsevier, 2011; p. 404–410. [DOI] [PMC free article] [PubMed] [Google Scholar]
- 15.Brune K, Abe T, Canto M, O’Malley L, Klein AP, Maitra A, Volkan Adsay N, Fishman EK, Cameron JL, Yeo CJ, Kern SE, Goggins M, Hruban RH. Multifocal Neoplastic Precursor Lesions Associated With Lobular Atrophy of the Pancreas in Patients Having a Strong Family History of Pancreatic Cancer. The American journal of surgical pathology: NIH Public Access, 2006; p. 1067. [PMC free article] [PubMed] [Google Scholar]
- 16.Ae HET, Mckenzie MD, Angstetra E, Peter AE, Campbell D, Kay TW. Beta cell apoptosis in diabetes. DIABETES AND APOPTOSIS. [DOI] [PubMed] [Google Scholar]
- 17.Hausmann S, Michalski CW, Kleeff J, Friess H, Fingerle AA, Dobritz M, Erkan M, Hausmann S, Michalski CW, Fingerle AA, Dobritz M, Kleeff J, Friess H. The role of stroma in pancreatic cancer: diagnostic and therapeutic implications. Nature Reviews Gastroenterology & Hepatology 2012. 9:8: Nature Publishing Group, 2012; p. 454–467. [DOI] [PubMed] [Google Scholar]
- 18.Kim SY, Kim H, Cho JY, Lim S, Cha K, Lee KH, Kim YH, Kim JH, Yoon YS, Han HS, Kang HS. Quantitative assessment of pancreatic fat by using unenhanced CT: Pathologic correlation and clinical implications. Radiology: Radiological Society of North America Inc., 2014; p. 104–112. [DOI] [PubMed] [Google Scholar]
- 19.Yoon JH, Lee JM, Lee KB, Kim SW, Kang MJ, Jang JY, Kannengiesser S, Han JK, Choi BI. Pancreatic steatosis and fibrosis: Quantitative assessment with preoperative multiparametric MR imaging. Radiology: Radiological Society of North America Inc., 2016; p. 140–150. [DOI] [PubMed] [Google Scholar]
- 20.Ternes L, Huang G, Lanciault C, Thibault G, Riggers R, Gray JW, Muschler J, Chang YH. VISTA: VIsual Semantic Tissue Analysis for pancreatic disease quantification in murine cohorts. Scientific Reports 2020. 10:1: Nature Publishing Group, 2020; p. 1–12. [DOI] [PMC free article] [PubMed] [Google Scholar]
- 21.Kiemen AL, Choi Y, Braxton AM, Almagro Perez C, Graham S, Grahn MP, Nanda N, Roberts N, Wood L, Wu P, Hruban RH, Wirtz D. Intraparenchymal metastases as a cause for local recurrence of pancreatic cancer. Histopathology 2022. doi: 10.1111/his.14839 [DOI] [PMC free article] [PubMed] [Google Scholar]
- 22.Kiemen AL, Braxton AM, Grahn MP, Han KS, Babu JM, Reichel R, Jiang AC, Kim B, Hsu J, Amoa F, Reddy S, Hong SM, Cornish TC, Thompson ED, Huang P, Wood LD, Hruban RH, Wirtz D, Wu PH. CODA: quantitative 3D reconstruction of large tissues at cellular resolution. Nat Methods 2022;19(11):1490–1499. doi: 10.1038/s41592-022-01650-9 [DOI] [PMC free article] [PubMed] [Google Scholar]
- 23.Braxton AMK AL; Grahn MP; Forjaz A; Mahesh Babu J; Zheng L; Jiang L; Cheng H; Song Q; Reichel R; Graham S; Damanakis AI; Fisher CG; Mou S; Metz C; Granger; Liu XD; Bachmann N; Almagro Perez C; Jiang AC; Yoo J; Kim B; Du S Foster; Hsu JY; Andreu-Rivera P; Chu LC; Liu F; Niknafs N; Fishman E; Yuille A; Roberts NJ; Thompson ED; Scharpf RB; Cornish TC; Jiao Y; Karchin; Hruban RH; Wu PH; Wirtz D; Wood LD Three-dimensional genomic mapping of human pancreatic tissue reveals striking multifocality and genetic heterogeneity in precancerous lesions. biorxiv, under review 2023. [Google Scholar]
- 24.Deshpande AL M; Sidiripoulos DN; Zhangm S; Yuanm L; Bell A; Zhu Q Jin Ho W; Santa-Maria C; Gilkes D; Williams SR; Uytingco CR; Chew J; Hartnett A; Bent ZW; Favorov AV; Popel AS; Yarchoan M; Kiemen A; Wu PH; Fujikura K; Wirtz D; Wood L; Zheng L; Jaffee EM; Anders R; Danilova L; Stein-O’Brien G; Kagohara LT; Fertig E Uncovering the spatial landscape of molecular interactions within the tumor microenvironment through latent spaces. Cell Systems 2023. [DOI] [PMC free article] [PubMed] [Google Scholar]
- 25.Canto MI, Almario JA, Schulick RD, Yeo CJ, Klein A, Blackford A, Shin EJ, Sanyal A, Yenokyan G, Lennon AM, Kamel IR, Fishman EK, Wolfgang C, Weiss M, Hruban RH, Goggins M. Risk of Neoplastic Progression in Individuals at High Risk for Pancreatic Cancer Undergoing Long-term Surveillance. Gastroenterology 2018;155(3):740–751 e742. doi: 10.1053/j.gastro.2018.05.035 [DOI] [PMC free article] [PubMed] [Google Scholar]
- 26.Dbouk M, Katona BW, Brand RE, Chak A, Syngal S, Farrell JJ, Kastrinos F, Stoffel EM, Blackford AL, Rustgi AK, Dudley B, Lee LS, Chhoda A, Kwon R, Ginsberg GG, Klein AP, Kamel I, Hruban RH, He J, Shin EJ, Lennon AM, Canto MI, Goggins M. The Multicenter Cancer of Pancreas Screening Study: Impact on Stage and Survival. J Clin Oncol 2022:JCO2200298. doi: 10.1200/JCO.22.00298 [DOI] [PMC free article] [PubMed] [Google Scholar]
- 27.Canto MI, Goggins M, Hruban RH, Petersen GM, Giardiello FM, Yeo C, Fishman EK, Brune K, Axilbund J, Griffin C, Ali S, Richman J, Jagannath S, Kantsevoy SV, Kalloo AN. Screening for Early Pancreatic Neoplasia in High-Risk Individuals: A Prospective Controlled Study. Clinical Gastroenterology and Hepatology: W.B. Saunders, 2006; p. 766–781. [DOI] [PubMed] [Google Scholar]
- 28.Cassidy FH, Yokoo T, Aganovic L, Hanna RF, Bydder M, Middleton MS, Hamilton G, Chavez AD, Schwimmer JB, Sirlin CB. Fatty liver disease: MR imaging techniques for the detection and quantification of liver steatosis. Radiographics 2009;29(1):231–260. doi: 10.1148/rg.291075123 [DOI] [PubMed] [Google Scholar]
- 29.Schwenzer NF, Machann J, Martirosian P, Stefan N, Schraml C, Fritsche A, Claussen CD, Schick F. Quantification of pancreatic lipomatosis and liver steatosis by MRI: comparison of in/opposed-phase and spectral-spatial excitation techniques. Invest Radiol 2008;43(5):330–337. doi: 10.1097/RLI.0b013e31816a88c6 [DOI] [PubMed] [Google Scholar]
- 30.Chen LC, Papandreou G, Kokkinos I, Murphy K, Yuille AL. DeepLab: Semantic Image Segmentation with Deep Convolutional Nets, Atrous Convolution, and Fully Connected CRFs. IEEE Transactions on Pattern Analysis and Machine Intelligence: IEEE Computer Society, 2018; p. 834–848. [DOI] [PubMed] [Google Scholar]
- 31.Brune K, Abe T, Canto M, O’Malley L, Klein AP, Maitra A, Volkan Adsay N, Fishman EK, Cameron JL, Yeo CJ, Kern SE, Goggins M, Hruban RH. Multifocal neoplastic precursor lesions associated with lobular atrophy of the pancreas in patients having a strong family history of pancreatic cancer. Am J Surg Pathol 2006;30(9):1067–1076. doi: pas.0000213265.84725.0b [PMC free article] [PubMed] [Google Scholar]