

Abstract
Atherosclerosis is an inflammatory process resulting in the deposition of cholesterol and cellular debris, narrowing of the vessel lumen and clot formation. Characterization of the morphology and vulnerability of the lesion is essential for effective clinical management. Here, near-infrared auto-photoacoustic (NIRAPA) imaging is shown to detect plaque components and, when combined with ultrasound imaging, to differentiate stable and vulnerable plaque. In an ex vivo study of photoacoustic imaging of excised plaque from 25 patients, 88.2% sensitivity and 71.4% specificity were achieved using a clinically-relevant protocol. In order to determine the origin of the NIRAPA signal, immunohistochemistry, spatial transcriptomics and spatial proteomics were co-registered with imaging and applied to adjacent plaque sections. The highest NIRAPA signal was spatially correlated with bilirubin and associated blood-based residue and with the cytoplasmic contents of inflammatory macrophages bearing CD74, HLA-DR, CD14 and CD163 markers. In summary, we establish the potential to apply the NIRAPA-ultrasound imaging combination to detect vulnerable carotid plaque and a methodology for fusing molecular imaging with spatial transcriptomic and proteomic methods.
Keywords: Photoacoustic imaging, spatial transcriptomics, atherosclerosis, vulnerable plaque, NIR biomarker
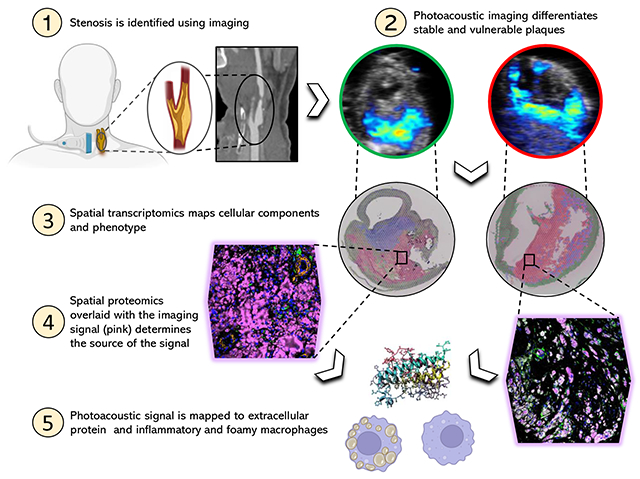
Graphical abstract
INTRODUCTION
Cardiovascular diseases, which include coronary heart disease, peripheral arterial disease and stroke, are the leading cause of death globally [1, 2]. In the United States, heart disease was the first and stroke the fifth leading cause of death in 2020[3]. The cause of these diseases in most cases is atherosclerosis[1]. Atherosclerosis is an inflammatory process resulting in the deposition of fatty and/or necrotic residues in the vessel wall and consequently the narrowing of the vessel lumen. The rupture of an atherosclerotic plaque and the following formation of a thrombus in the blood circulation can result in ischemic events such as myocardial infarction or stroke[1, 4, 5]. Silent, asymptomatic atherosclerosis is a common finding in the general population, even in young adults, and is typically associated with a low risk of myocardial infarction or stroke[6–8]; however, more than half of the acute coronary syndrome cases originate from these clinically silent plaques [9–11]. For that reason, it is critical to understand the phenotypic characteristics of plaques, which can help develop imaging solutions for early detection [12, 13].
For the characterization of plaque types, specific histomorphological markers have been identified, including percent luminal stenosis, fibrous cap thickness, macrophage area, necrotic core area and calcified plaque area[14, 15]. The fibrous cap of an atherosclerotic plaque is one of the best discriminators of stable versus unstable plaque type[5, 14, 16, 17]. Standard imaging techniques to detect carotid atherosclerotic plaques are Doppler ultrasound, magnetic resonance (MR) angiography and computed tomography (CT) angiography. The clinical treatment process, including decisions about when to offer prophylactic surgery, is primarily based on the extent of luminal stenosis[18]. Novel imaging methods, including high-resolution MR imaging, CT combined with positron emission tomography (PET) imaging, and photoacoustic imaging are being tested to better assess the vessel wall features of the plaque in order to determine the plaques vulnerability[18–21]. Photoacoustic imaging utilizes laser light in the near-infrared range (680–980 nm) to excite endogenous or exogenous chromophores in the tissue in order to generate an ultrasound wave that can be combined with regular ultrasound scans[22]. Of particular clinical interest are endogenous chromophores used to acquire molecular tissue information without the requirement for an exogenous contrast agent. Specific endogenous tissue components including oxyhemoglobin (HbO2), deoxyhemoglobin (Hb), H2O, melanin and lipids can be identified via photoacoustic imaging based on their characteristic absorption spectra[23, 24]. Previous attempts to detect vulnerable plaque features via photoacoustic imaging focused on lipids (950-1250 nm)[25–27] and intraplaque hemorrhage (808 nm)[28, 29]. Recently, bilirubin and other heme degradation products and insoluble lipid in atherosclerotic plaques have been evaluated as to their autofluorescence properties in the near-infrared (680 nm) range[30]. The hemoglobin degradation products represent a pathological process indicative of intraplaque hemorrhage and therefore serve as an important biomarker for vulnerable plaque [30–32]. However, near-infrared autofluorescence (NIRAF) in the 650-700 nm range suffers from limited penetration depth and spatial resolution; and therefore, photoacoustic techniques are attractive [23, 33].
In this study, we investigate whether plaque components associated with the NIRAF signal can be detected with a clinical photoacoustic device to reveal the characteristics of a vulnerable plaque, such as thickness of a fibrous cap, infiltrating macrophages and necrotic core size. Further, we set out to characterize the molecular characteristics of the components that were responsible for the signal. To accomplish this, spatially registered near-infrared auto-photoacoustic (NIRAPA) and fluorescence microscopy are combined with immunohistochemistry, spatial RNA sequencing and immunofluorescence imaging via co-detection by indexing (CODEX) [34]. Single-cell RNA sequencing has previously been successfully applied in atherosclerosis to profile individual cells and has revealed valuable information regarding infiltrating immune cells [35, 36]; herein, we use spatial transcriptomics to associate NIRAF and photoacoustic signal with the gene expression profile. Spatial transcriptomics was performed with a depth of 15000 ~ 18000 genes at each location, thus enabling correlation of the NIRAF signal with specific transcriptomic profiles[37]. Protein immunofluorescence, with single-cell resolution and markers spanning the NIRAF signal, immune and epithelial markers, was then applied to visualize the NIRAF signal generated by individual immune cells and extracellular components. The combination of these techniques provides multiple levels of insight as to: 1) the association of the tissue level photoacoustic signal with clinically-significant features, 2) the characterization of an inflammatory gene signature that is primarily associated with the signal, and 3) confirmation that the photoacoustic and NIRAF signals result from extracellular matrix components and CD74+ HLA-DR+ CD14+ macrophages.
MATERIALS AND METHODS
Human Carotid Endarterectomy Specimens
All human studies have been approved by the institutional review board at Stanford (IRB50541). To test the ability of spectroscopic photoacoustic (sPA) imaging to guide treatment decisions, human carotid plaques were used. Human carotid plaques were collected from 25 patients who presented to Stanford Hospital, Palo Alto, US with clinical indications for carotid endarterectomy (CEA), where 24 samples included carotid pathology and one sample was normal (Supplementary Table 1). In a subset of cases, contrast CT imaging and/or color flow ultrasound imaging were available based on standard of care parameters and these studies were obtained and compared to the results. In each case, a region was scanned above and below the stenosis, such that each study contained a control region. Imaging was performed over a 15 to 39 mm distance at an inter-image distance of 0.2 mm, and the histology was acquired at an axial intersample distance of 1.5 cm. After surgical resection, the carotid specimens were immediately fixed in 4% paraformaldehyde (PFA) for subsequent photoacoustic imaging (PAI) and histopathologic assessment, or were imaged with PAI and fixed afterwards in 4% PFA. sPA images and near-infrared auto-fluorescence (NIRAF) images were analyzed and compared with the results of the histopathologic analysis.
Auto-near infrared photoacoustic imaging and computed tomography angiography (CTA)
Spectral photoacoustic images of the intact human carotid plaque were acquired using the Vevo LAZR-X (FUJIFILM VisualSonics) with a 15 MHz linear array transducer (MX 201; axial resolution, 100 um) and a 150 mJ/cm2 average fluence laser pulse (10 ns pulse width, 20 Hz pulse repetition frequency, which has been optimized and calibrated). Single-plane, multiwavelength (680, 690, 700, 710, 720, 750, 800, 850 and 900 nm) photoacoustic images (Supplementary Fig.1) were acquired every 200 μm based on translation of a 3D stepper motor. B-mode ultrasound images were recorded simultaneously to provide anatomic registration. To evaluate the potential influence of PFA fixation on the PAI signal, these specimens were imaged before and after fixation. A preliminary study confirmed that the NIRAF signal was not impacted by fixation as in[30], where a complete 3D photoacoustic/ultrasound (PA/US) scan of the whole carotid specimen was acquired before and after fixation with 4% PFA. In all co-registered images, the detected NIRAPA signal was similar but marginally stronger in the fresh specimen scan than in the fixed specimen scan (Supplementary Fig. 2).
Previously acquired standard of care longitudinal/axial CTA images were co-registered with longitudinal/axial PA/US images. Images were co-registered using side branches as index markers, with consideration given to the measured distance along the longitudinal axis. Anatomical landmarks such as luminal configuration, were identified to detect the same plaque on the CTA and PA/US image. Transverse PA/US images were co-registered with histological cross-sections based on landmarks, such as known sectioning distance, vessel lumen, and side branches. Shrinkage artifacts from fixation and dehydration were taken into account. An example of the NIRAPA images acquired to generate the spectrum (Supplementary Fig. 1A) is provided as well as the estimated spectrum (labeled NIR-auto) for the plaque region (Supplementary Fig. 1B). The spectral amplitude of the NIRAPA signal (Supplementary Fig. 1B) is greatest in the lower NIR range (680-700 nm) and linearly decreases towards 950 nm. Spectral unmixing of the signal was computed using the oxygenated (OXY) and deoxygenated (DeOXY) hemoglobin settings on the VisualSonics yielding the estimated spectra and images (Supplementary Fig. 1B-D). Based on previous work demonstrating NIRAF from bilirubin[30], the bilirubin (B4126, Sigma-Aldrich) absorption spectrum was first measured using a VisualSonics phantom, where the intensity decreases with increasing wavelength and increases with bilirubin concentration (Supplementary Fig. 1E-F).
Matching photoacoustic images to histologic sections
Samples were imaged with the Vevo LAZR-X (FUJIFILM VisualSonics) for NIRAPA signal. To evaluate the clinical significance of the acquired PAI images, the whole 3D PA/US scan and at least 3 corresponding histologic sections were examined in a blinded manner by a board-certified pathologist, and the images were examined by two experts in the field. The histological cross-section with the thinnest fibrous cap within the carotid plaque and corresponding transverse PA/US image was used for the classification of stable versus vulnerable plaque. The absence or thickness of the fibrous cap was recorded. In 19 cases, the NIRAPA signal reached the vessel lumen, but the measured fibrous cap thickness was 0 and couldn’t be used for the calculation of the relative intraobserver variability. In the remaining 6 cases, the intraobserver variability was on average 8% based on methods in [38, 39].
Plaques with a fibrous cap less than 65 μm or missing were classified as vulnerable plaques and plaques with a fibrous plaque greater than 65 μm were determined as stable plaque [40, 41]. The PAI reviewer assessed the fibrous cap using PAI images overlaid on top of B-mode ultrasound images. In each image, the NIRAPA signal was considered to be positive if the area was greater than 2.5 mm2. All cases included both positive images in the plaque center and negative imaging at the axial extrema of the excised vessel. A positive image separated from the vessel lumen by a hyperechoic ultrasound structure thicker than 65 μm was termed as stable plaque. A positive image adjacent to the vessel lumen with a smaller fibrous cap was assessed as vulnerable plaque. Afterwards, the results and clinical symptoms were matched. For each patient, a proximal and distal vascular region was identified and imaged to serve as an in-patient control. For the analysis of the PAI, all images were reviewed for each case and the minimum fibrous cap distance was quantified along with the maximum plaque volume.
Quantitative immunohistochemistry staining of human carotid plaques
After the plaques were fixed in 4% PFA, the specimens were decalcified via incubation in Formical 2000 (1314–1, StatLab) for 48 h. The decalcified plaque specimens were then embedded in paraffin. Five-μm slices were sectioned from the tissue block. Paraffin was removed using Xylene and then hydrated deploying an alcohol/water gradient. For NIRAF imaging the slides were dried after the deionized water step. As soon as the de-paraffinized slides were dry, they were imaged for the auto-near-infrared (NIR) signal using a digital slide scanner (CY5, Olympus VS120, Exposure time: 500 ms, 20x objective). The staining protocol was then continued by antigen retrieval in citrate buffer (C9999, Sigma-Aldrich, USA) for 20 min at 95 degrees Celsius. After the slides reached room temperature, they were washed using a wash buffer (PBS + 0.1% Tween) and subsequently treated with 3% hydrogen peroxide for 10 min to block endogenous peroxidase activity. Following an additional washing step in wash buffer, the sections were incubated with goat serum (Vector Laboratories, CA, USA) for 30 min. The sections were then covered with a primary antibody and incubated overnight at 4 degrees Celsius. Anti-CD68 (clone KP1, BioLegend, USA, dilution 1:250), anti-alpha-SMA (Cat no: ab5694, Abcam, USA, dilution 1:200) and anti-bilirubin (clone 24G7, Shino-test, Kanagawa, Japan, dilution 1:200) were used as primary antibodies. After washing off the primary antibody, the sections were incubated with a corresponding biotinylated secondary antibody for 30 min at room temperature. Following an additional washing step, the sections were incubated with a DAB (3, 3’-diaminobenzidine) substrate kit for peroxidase detection (Vector Laboratories). No counterstaining was performed to achieve maximal contrast for digital imaging processing.
Collagen imaging
Five-μm tissue sections were stained with hematoxylin and eosin (H&E), Masson’s Trichrome (Sigma Aldrich) and Picrosirius Red (24901; Polysciences, USA). Picrosirius red sections were imaged using a polarized light (AxioImager Widefield Fluorescence Microscope, Zeiss).
Spatial transcriptomic data processing
In order to maintain RNA integrity, decalcification was not performed on these samples. Specimens were soft enough to acquire 5-μm sections from formalin-fixed paraffin-embedded (FFPE) tissue blocks. FFPE sections were placed on the Visium slides and subjected to spatial analysis using the 10x Visium FFPE workflow (spatial resolution of 100 μm and with 1-10 cells per spot) (10x Genomics, Pleasanton, CA). Manufacturer’s instructions were followed without any significant alterations. Individually indexed libraries were pooled and sequenced on the NovaSeq 6000 (Illumina inc., San Diego, CA) with the recommended read depth of per cell. Raw sequencing data was parsed through the SpaceRanger analysis platform (10x Genomics), aligned with a human (GRCh38) reference, and low unique molecular identifier (UMI) counts were filtered. Transcriptomic analysis was performed with a Seurat framework [42]. Separate samples were merged and then normalized with the SCTransform function, resulting in 3000-5000 spots for downstream processing. Principal component analysis was performed and, based on the elbow plot, the first 75 principal components were selected for downstream analysis. A resolution value of 0.4, k-nearest neighbors of 20, and the cutoff for Jaccard index of 0.005 were selected for Uniform Manifold Approximation and Projection (UMAP) clustering using the Leiden algorithm. To investigate cluster cell type, spatially variable features and cluster distinctive markers were determined with the FindSpatiallyVariableFeatures and FindAllMarkers function in the Seurat package [42]. The top differentially expressed genes of each clusters were compared to key gene markers from the literature to annotate clusters. The top differentially expressed genes from each sub-cluster were found with the FindAllMarkers function. All transcriptomic data processing, analysis and visualization was done with R language (version 4.2.2) in RStudio (RStudio team, PBC, Boston, MA).
CODEX processing
Plaque histology in FFPE slices was stained with 51-multiplexed antibodies (Supplementary Table 2) and 3 spectral channels were co-acquired. After image processing, cell segmentation was performed with the DeepCell algorithm through the Enable Medicine portal (https://app.enablemedicine.com/portal). We further filtered the segmentation results based on size of the cell, total biomarker intensity, DNA channel intensity and signal coefficient of variation. The filtered segmentation results were then normalized and scaled for principal component analysis. UMAP clustering based on the Leiden algorithm was performed on 25 principal components with the number of k nearest neighbors, spread and minimum distance of clusters optimized to create a minimal number of clusters. To explore co-expressions of key immune markers (CD163, CD68, CD14, HLA-DR), we subset segmented cells with a normalized expression of larger than 2 and plotted a Venn diagram to visualize the population distribution of cells with various co-expression combinations. To explore co-expression signal level of key immune cell markers and NIRAF signal intensity, we computed the Pearson’s coefficient based on image signal intensity across the plaque for NIRAF signal intensity and the fluorescence signal intensity of immune cell markers such as CD14, HLA-DR, CD163, and Collagen IV as a negative control. Signals for NIRAF and various immune cell markers were then evaluated in gray-scale intensity across identical areas in the plaque in order to assess their spatial correlation. Segmented cells were also exported to the cloud-based cytometry platform OMIQ (https://www.omiq.ai/) for additional visualization of marker fluorescence signal intensity.
Statistics
Pearson correlation coefficients (r values) with estimated standard errors were used to determine associations between NIRAF signal and histologic measurements of CD68 and bilirubin. ImageJ – JACoP were used to calculate the Pearson’s correlation. An unpaired t-test was used to evaluate the difference between the unstable plaque area NIRAPA signal and the stable plaque area NIRAPA signal. Simple linear regression was performed, and all graphs were created using GraphPad Prism version 9.3.1 for Windows (GraphPad Software, San Diego, California USA, www.graphpad.com). Sensitivity, specificity, positive predictive value and negative predictive value of PAI were determined with histologic analysis used as the reference standard.
RESULTS
NIRAF / NIRAPA signal correlates with macrophages and bilirubin
To assess the feasibility of using spectroscopic photoacoustic (sPA) imaging for the detection of vulnerable atherosclerotic plaques, 24 diseased human carotid plaques and one pathologically normal artery were collected from patients who underwent carotid endarterectomy (CEA) at Stanford Hospital, Palo Alto, USA. Twelve carotid plaques were collected from patients presenting with symptoms such as stroke or transient ischemic attacks, and 12 CEA samples were classified as asymptomatic (Fig. 1). The excised carotid (Fig. 1A-B) was subjected to NIRAPA imaging (Fig. 1C), where the images were oriented using CT (Fig. 1D) and color flow ultrasound (Fig. 1E) imaging. Most importantly, the NIRAPA images provide a positive contrast image of the plaque, as compared with the negative contrast produced by the absence of blood flow in CT and color flow ultrasound imaging. In all 24 diseased cases, the NIRAPA signal was detected in all patients in multiple imaging planes with the imaged region of interest spanning 15 to 40 mm (Fig. 1F).
Figure 1. Photoacoustic imaging of the near-infrared auto-photoacoustic (NIRAPA) biomarker in human carotid plaque.
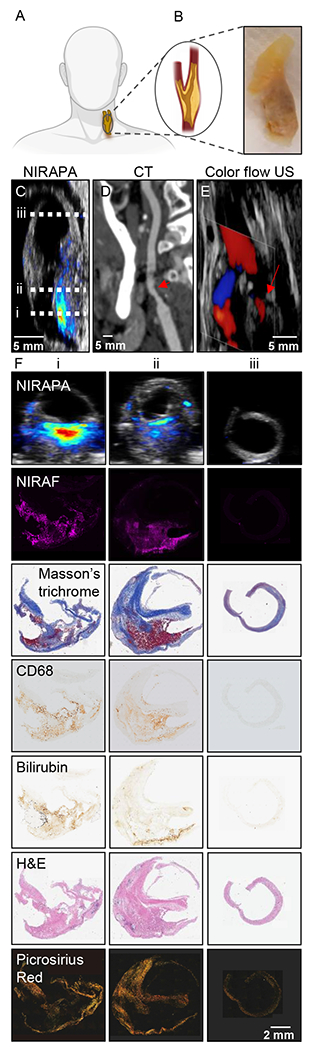
A) Schematic of human carotid endarterectomy (CEA) sample. B) Human carotid plaque under white light. C-E) Longitudinal anatomic C) NIRAPA, D) computed tomography (CT) and E) color flow ultrasound (US) images of human carotid plaque. The dashed lines on the longitudinal image in (C) represent the imaging locations of the axial images in columns i, ii and iii in (F). F) Comparison of the NIRAPA signal (680-700nm) with NIRAF and Masson’s trichrome, CD68, bilirubin, H&E and picrosirius red staining for the three tissue section locations, i, ii and iii, indicated in Fig. 1C. Scale bar, bottom right, applies to all panels in F.
A further example of the correspondence of the NIRAPA imaging and in vivo CT imaging, each acquired along the longitudinal axis, is provided in Supplementary Fig. 3. This clinical CT scan cannot distinguish between stable and unstable plaque components, whereas the photoacoustic scan can detect the NIRAPA signal and discriminate these different features. As a result, photoacoustic scanning is valuable for imaging the location of the stenosis and has clinical advantages when combined with other imaging modalities. The full set of images acquired in vivo with CT and ex vivo with PAI can be visualized within Supplementary Videos 1-2.
The acquired PAI cross-sectional images and corresponding histological sections and stains, spanning H&E, Masson’s trichrome, picrosirus red, CD68, and bilirubin (Fig. 1F), were registered to the acquired NIRAF image from the same slide, with the NIRAF signal representing the NIRAPA signal. A clear spatial correlation was observed between the NIRAPA and NIRAF signals, CD68, and bilirubin (Fig. 1F); therefore, we sought to quantify the correlation across the entire population in additional studies. Masson’s trichrome further defined regions of connective tissue and picrosirius red defined the collagen-rich regions.
NIRAPA signal distinguishes between stable and unstable plaque
In order to evaluate the accuracy of photoacoustic images regarding discriminating stable plaque regions (a fibrous cap rich in collagen and alpha smooth muscle actin) versus unstable (vulnerable) plaque regions, the NIRAPA signal in the 680-700 nm range was compared to corresponding picrosirius red histological sections, indicating collagen-rich regions (Fig. 2). To evaluate the fibrous cap thickness, the minimum distance between vessel lumen and unstable plaque region was measured using a cross-sectional ultrasound image overlaid with the NIRAPA signal of the carotid plaque. In the picrosirius red stain, the respective fibrous cap thickness was determined by measuring the minimum distance between vessel lumen and signal-free areas within the vessel wall. If the fibrous cap was absent or undetected, we measured adjacent connective tissue areas and compared them to picrosirius red stain measurements. The measured fibrous cap thickness within the ultrasound-NIRAPA images correlated with the measured values from the picrosirius red histological images (r2 = 0.9913) (Fig. 2A). The same cross-section images were then used to evaluate the necrotic core area and the NIRAPA signal intensity difference between stable and unstable regions. The measured necrotic core areas based on NIRAPA signal corresponded to the signal-free picrosirius red stain areas (r2 = 0.8612) (Fig. 2B). Accordingly, the NIRAPA signal intensity recorded in unstable plaque areas was significantly higher than in stable plaque areas (p<0.0001, Fig. 2C).
Figure 2. Measurements of fibrous cap thickness and plaque volume by histology and imaging establish sensitivity and specificity of the imaging technique.
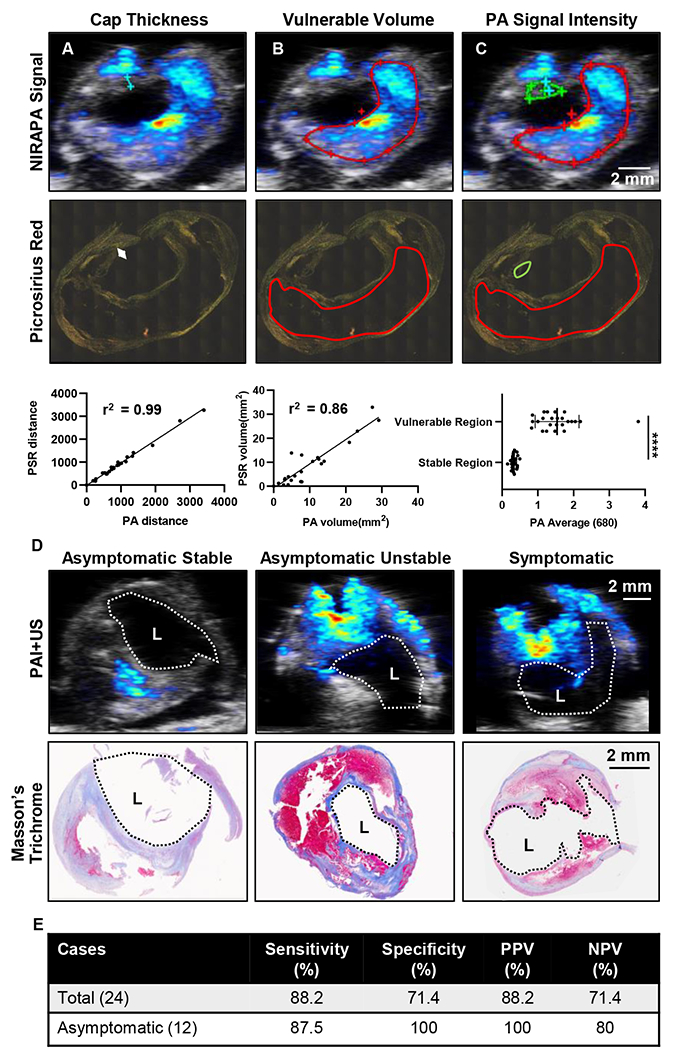
A) Measurements and correlation of fibrous cap thickness on NIRAPA (680-700 nm)-US images and picrosirius red (PSR) histopathology with r2=0.99. B) Measurements and correlation of the vulnerable plaque volume (red outline) on NIRAPA (680-700 nm)-US images and picrosirius red histopathology with r2=0.86. C) Photoacoustic (PA) signal intensity of NIRAPA (680-700 nm) averaged in vulnerable (red outline) and stable (green outline) plaque areas. Picrosirius red histopathology shows correlating areas. p<0.0001. D) Representative PA NIRAPA-US images of asymptomatic stable, asymptomatic vulnerable (unstable) and symptomatic vulnerable plaque cases. Correlating Masson’s trichrome stains. E) Summary of diagnostic accuracy of fibrous cap thickness as measured by PA imaging compared with histological classification. Vulnerable plaque defined as fibrous cap not existing or <65 μm. PPV: positive predictive value, NPV: negative predictive value, L: lumen, ****, p<0.0001. n=24 patients.
NIRAPA plus ultrasound: sensitivity and specificity
The histological sections and NIRAPA-ultrasound images were then classified as stable or unstable/vulnerable, based on a fibrous cap thickness greater or less than 65 μm, respectively (Fig. 2D)[43]. In this comparison, NIRAPA images (using histology as a gold standard) achieved 88.2% sensitivity and 71.4% specificity (88.2% positive predictive value, 71.4% negative predictive value). In order to evaluate the clinical importance of NIRAPA images, we looked at asymptomatic cases separately. In 12 asymptomatic plaques, photoacoustic imaging reached 87.5% sensitivity and 100% specificity (100% positive predictive value, 80% negative predictive value) (Fig. 2E).
Correlation of the NIRAPA signal with macrophages and bilirubin
We then sought to determine the origin of the NIRAPA signal. In order to spatially correlate the NIRAPA images with microscopic cell structures, we acquired NIRAF slide scans. NIRAPA and NIRAF images are highly correlated since, in both cases, laser light in the 680-700nm range is used for excitation and they differ only in the resulting emission. The naturally-occurring near-infrared signal correlated with the CD68 macrophage marker (Pearson’s coefficient 0.4, p<0.0001) and bilirubin (Pearson’s coefficient 0.4, p<0.0001), a degradation product of hemoglobin, in comparison with alpha smooth muscle actin (αSMA), a marker for a healthy and stable artery (Fig. 3A-B). Correspondingly, in the absence of a NIRAF signal, the detected area of CD68 and bilirubin (p<0.0001) was negligible and significantly lower than the αSMA area (Fig. 3A, C). This correlation with both macrophage localization and bilirubin concentration motivated us to further evaluate the molecular basis of the signal using spatial transcriptomics and proteomics.
Figure 3. NIRAF signal correlates with CD68 and bilirubin.
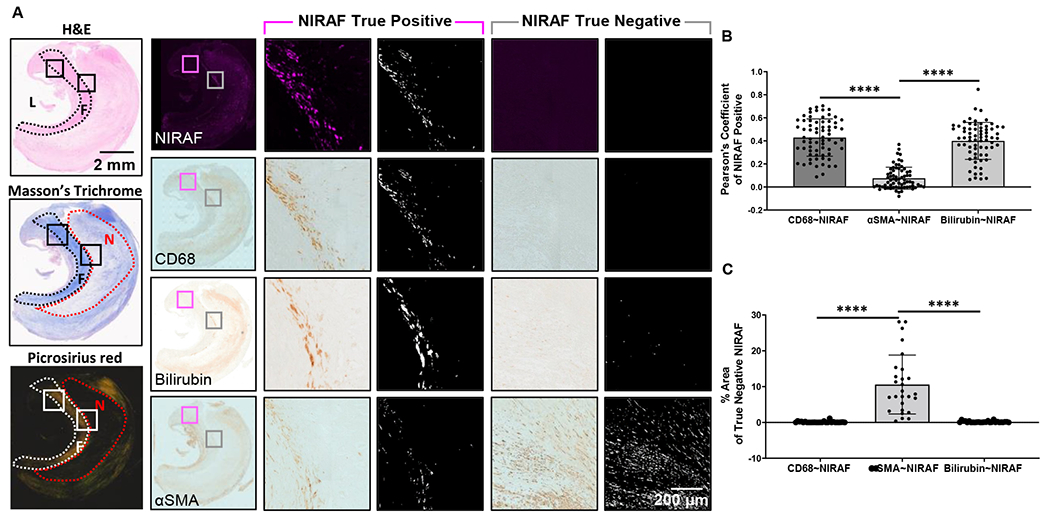
A) Overview of representative H&E, Masson’s trichrome and picrosirius red images used to localize the image features. CD68, bilirubin and αSMA images provided for reference. If NIRAF was detected, results were used to calculate the Pearson’s Coefficient (termed NIRAF True Positive, pink highlighted columns). L: Lumen, F: Fibrous Cap, N: Necrotic. If NIRAF was not detected, the percentage pixel area was calculated (termed NIRAF True Negative, gray highlighted columns). B) Pearson’s Coefficient results based on the colocalization of CD68, bilirubin and αSMA with respect to the NIRAF image. C) Difference in the analyzed pixel area of CD68, bilirubin or αSMA, when NIRAF was not detected. ****, p<0.0001, n=25 patients.
Spatial transcriptomics and proteomic mapping in stable plaque
Imaging, immunohistochemistry (IHC), and spatial transcriptomic sequencing were performed on the plaque slide sections to probe the genetic character with respect to spatial location. As noted earlier, NIRAPA imaging corresponded closely with CT imaging and the location of the lesion (Supplementary Fig. 3). Based on the IHC analysis, we confirmed that the NIRAPA signal corresponded with both CD68 and bilirubin (Fig. 4A-D), where the bilirubin was localized to an area more than 1 mm from the lumen, and CD68 was detected within this region and a large surrounding area.
Figure 4. Spatial transcriptomic analysis of stable plaque specimen identifies specific macrophage populations that spatially correlate with the NIRAF and NIRAPA signals.
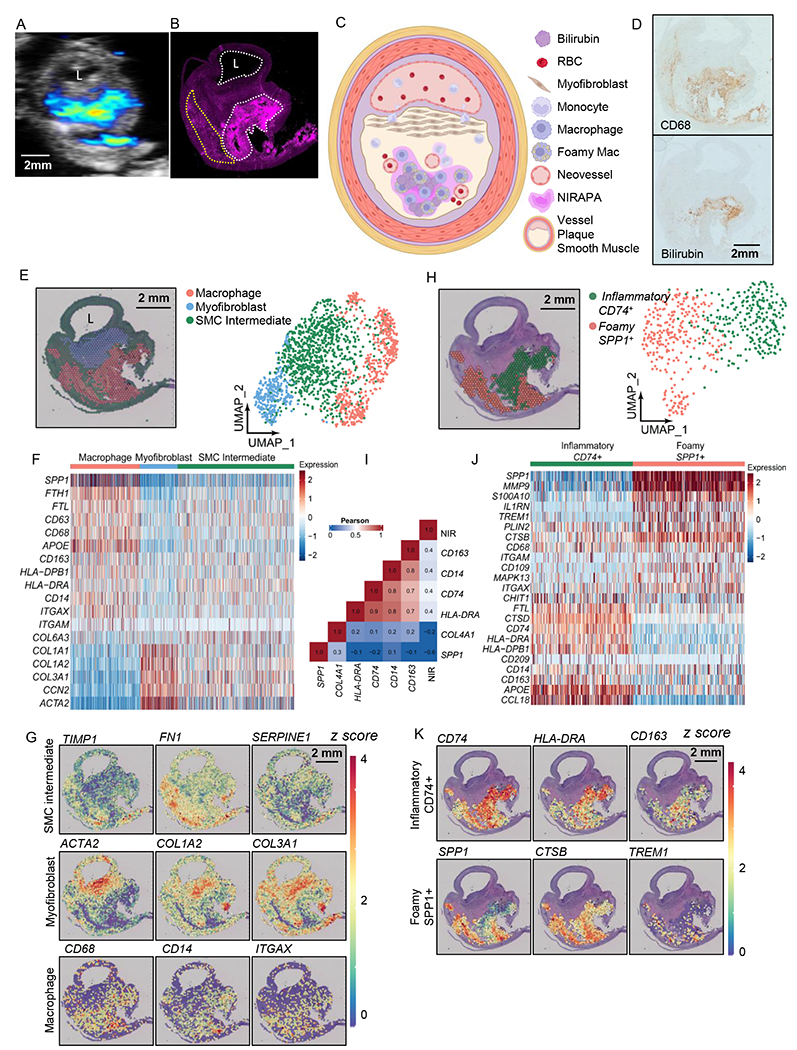
A-B) NIRAPA (A) and NIRAF (B) images of a carotid plaque cross section. Annotations indicate strong (white) and weaker (yellow) NIRAF signal. C) Illustration summarizing the stable plaque features and the location of the NIRAPA signal. D) Histological sections of the carotid endarterectomy (CEA) plaque specimen stained with CD68 and bilirubin. E) Overlay and Uniform Manifold Approximation and Projection (UMAP) cluster projection of spatial transcriptomics on carotid plaque H&E. Based on their gene expression, clusters have been assigned to macrophage, myofibroblast and smooth muscle cell (SMC) intermediate cell types. F) Overall heatmap of the general immunological signatures that differentiate the macrophage, myofibroblast and SMC intermediate clusters. G) Key genes that differentiate macrophage, myofibroblast, and SMC intermediate populations and their spatial intensity on the CEA specimen. H) Spatial deconvolution and UMAP cluster projection of the macrophage cluster in CD74+ and SPP1+ regions and the spatial location on the H&E-stained plaque cross section. UMAP projection of macrophage high resolution subtype clustering shows CD74+ and SPP1+ populations. I) Pearson’s correlation between genes within the macrophage clusters and the NIR signal. J) Heatmap of macrophage-specific gene signatures that differentiate the CD74+ and SPP1+ macrophage subpopulations. K) Key genes differentiating inflammatory (CD74+) and foamy (SPP1+) macrophages and their spatial location on the CEA specimen. P-value cutoff is 0.005. L: Lumen. Log2FC cutoff is 2.
With the Seurat single cell sequencing analysis package [42], we found three distinct clusters in the stable plaque. Through comparison between clusters and canonical cell markers commonly found in atherosclerotic plaque [44–46], the identified clusters included a smooth muscle cell-like phenotype (actin and collagen markers) surrounding the lumen, a myofibroblast cluster[45] (ACTA2, COL1A1, COL1A2, COL3A1, and CNN2) in the proximal plaque and macrophages (CD163, CD68, CD14, HLA-DRB1, and APOE) in the distant plaque (Fig. 4E-F, Supplementary Table 3). Other groups have demonstrated that during atherosclerosis, smooth muscle cells (SMCs) transdifferentiate into fibroblast-like or macrophage-like cells[47] and can undergo clonal expansion[48]. During transdifferentiation, SMCs begin to down-regulate SMC-specific phenotypes. Since our smooth muscle cell-like cluster expressed both SMC and macrophage phenotypes, but with a decreased expression, we annotated this cluster as a SMC-derived intermediate. Comparing the spatial transcriptomic results (Fig. 4E) with NIRAPA and NIRAF data (Fig. 4A-B)), a segment of the macrophage population overlapped with the intense NIRAF signal, and a population of macrophages exhibited with a greatly reduced NIRAF signal. Maps of the spatial distribution of key markers (Fig. 4G) further defined the spatial characteristics.
Since sequencing and NIRAF data indicated potential sub-macrophage populations, we computationally isolated the macrophage cluster and further re-clustered with a higher resolution, following Seurat’s standard clustering protocol (Fig. 4H). Through high-resolution re-clustering, we discovered two distinct macrophage subpopulations, which differentially expressed key gene markers (CD74 and SPP1) (Fig. 4H). We then quantified the spatial correlation between the expression of various macrophage markers (Fig. 4I), the correlation between inflammatory markers was greatest (0.8) between HLA-DRA and CD74 and was similarly large within the SPP1 cluster. The correlation between the NIRAF signal and CD163, CD14, CD74 and HLA-DRA was ~0.4 (Fig. 4I). By comparison, the correlation between the NIRAF signal and COL4A1 or SPP1 was −0.2 and −0.6 respectively. Given the differences in the spatial resolution and dynamic range of fluorescence and spatial transcriptomics, a correlation of 0.4 was anticipated. Based on select differentially-expressed genes of each cluster, we found that macrophages with a greater imaging signal and higher CD74 expression also co-expressed MHC II (HLA-DRA) and APOE, while macrophages with higher SPP1 expression co-expressed S100A10, MMP9, CTSB, IL1RN, and TREM1 (Fig. 4J). The cluster co-expressing macrophage activation markers such as CD74, APOE, and HLA-DRA spatially overlapped with the greater NI RAPA and NIRAF signals (Fig. 4K) with a significant correlation between the NIRAF signal level and that of CD74, CD163, and HLA-DRA (Supplementary Fig. 4)[49]. In contrast, the macrophage cluster co-expressing SPP1 and CTSB spatially overlapped with the reduced NIRAF signal (Fig. 4K, Supplementary Fig. 4). CTSB is a cathepsin known to promote atherosclerotic inflammation and vulnerability[45] (Fig. 4K) and the SPP1 and CTSB cluster is associated with foamy macrophages with an M2-like phenotype[45].
Since spatial transcriptomics identified inflammatory macrophage populations related to the NIRAF signal, we probed the spatial protein distribution and the relationship between protein expression and the NIRAF signal at the single-cell level in stable plaque (Fig. 5). We performed spatial proteomic imaging on slices adjacent to the spatial transcriptomic studies and acquired the coincident NIRAF signal. To validate the correlation between NIRAF signal and macrophage-related protein expression, we compared the NIRAF signal and signals from other markers in gray-scale intensity to compute the Pearson’s correlation across the plaque sample. Spatial correlation between the NIRAF signal and MHCII (HLA-DR) and CD14 was 0.9 and 0.8, respectively (Fig. 5A-D), and HLA-DR and CD14 spatially correlate with one another at 0.9. As expected, the correlation of the NIRAF signal with Collagen IV was low (0.2), and in this stable plaque, the correlation with CD163 was 0.2 (Fig. 5D). We segmented the cells based on the DAPI nuclear DNA stain and plotted cell populations expressing each marker in a Venn diagram (Fig. 5E). The greatest marker overlap occurred between CD14 and HLA-DR, with ~20% of the segmented cells displaying both markers.
Figure 5. Spatial proteomic analysis of resolved single cells and correlation with overlaid NIRAF signal in a stable plaque.
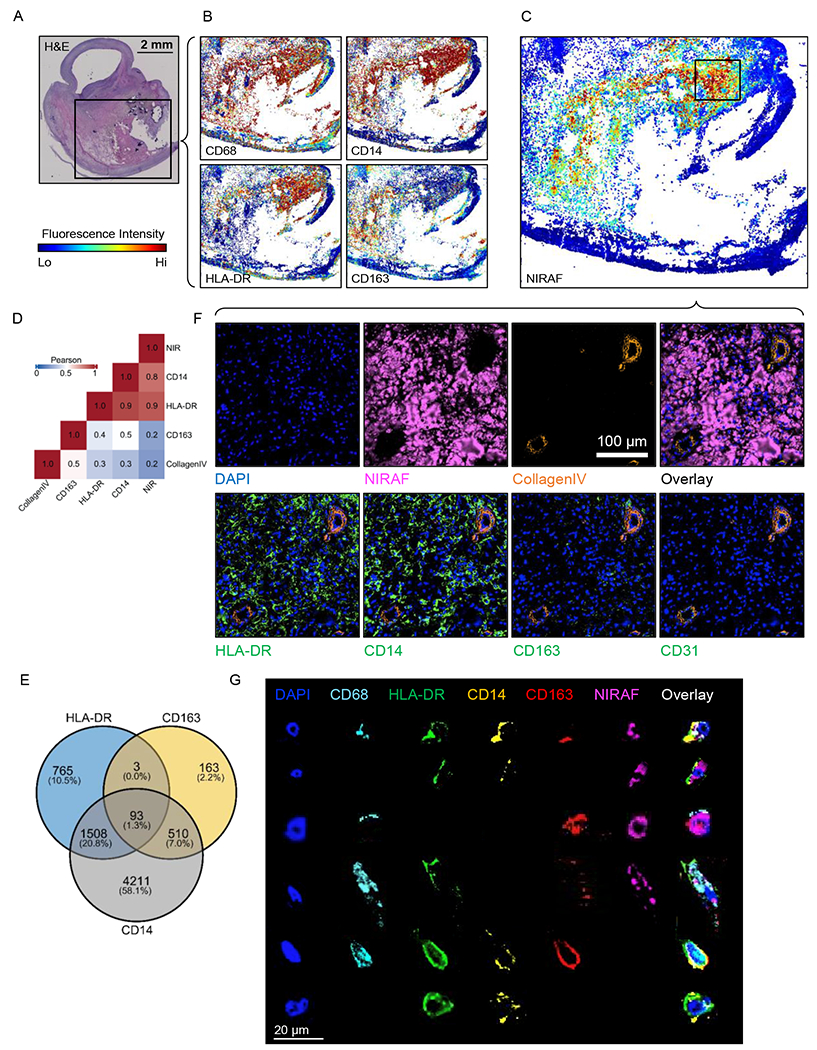
A) H&E cross section overview with black box showing CODEX region. B) CODEX images showing signal intensities of CD68, CD14, HLA-DR and CD163 on the same tissue section. C) CODEX image of NIRAF signal intensity on the same tissue section with the high-NIRAF signal region highlighted and the boxed region studied further in F. D) Pearson’s correlation between the NIRAF signal, genes within the macrophage clusters and Collagen IV. E) Venn diagram of the expression of HLA-DR, CD163 and CD14 based on segmented cells from CODEX images. F) Region of interest (ROI) images of CODEX showing DAPI, NIRAF, Collagen IV, HLA-DR, CD14, CD163 and CD31. G) Representative manually-segmented individual cell fluorescence examples from CODEX.
To further characterize the source of the NIRAF and NIRAPA signal, we examined the CODEX images with successively higher spatial resolution (Fig. 5F-G). As expected from Fig. 4A-D (bilirubin distribution), we found that, in some regions, the NIRAF signal correlated with extracellular protein (regions of pink fluorescence in the absence of a DAPI signal). Individual neovessels were identified deep within the plaque, particularly in the NIRAPA region. The NIRAF/NIRAPA signal was frequently associated with the presence of CD31+ angiogenic neovessels, which can facilitate red blood cell extravasation (Fig. 5F, Collagen IV, CD31).
Signal overlap with the HLA-DR and CD14 markers was also detected and then probed at higher spatial resolution in Fig. 5G. Individual cells were manually segmented and images were obtained with a set of markers. The analysis confirmed that the signal was localized with the cytoplasm of CD68+ macrophages with varied expression of HLA-DR, CD14, and CD163. This analysis also demonstrated that the markers could be detected in these same regions without the presence of the NIRAF signal, suggesting that the varied cellular contents and/or phagocytotic activity determine the strength of the NIRAF signal.
We next evaluated the spatial correspondence of the transcriptomic and proteomic signals (Supplementary Fig. 5) in the structural features of the plaque. We found good agreement between the key protein/gene pairs of interest; the αSMA/ACTA2 signal was confirmed and correlated, the CD31/PECAM1 signal was correlated and the Collagen IV/COL4A1 signal (which largely corresponds with the blood vessels) was mapped. This is a particular advantage of combining these techniques, in which spatial proteomics provides single-cell spatial resolution to detect features such as angiogenic vessels, and spatial transcriptomics provides high-depth profiling of global gene expression.
In summary, the CODEX analysis of the stable plaque cross section confirmed the spatial RNA sequencing results on a single-cell level. The NIRAF signal was spatially colocalized in some pixels containing extracellular matrix without DAPI (spatially correlated with bilirubin) and individual inflammatory cells expressing HLA-DR, CD14 and CD163.
Spatial transcriptomic sequencing and proteomics highlight inflammatory macrophages lining the lumen of vulnerable plaque
We then evaluated the source of the signal in a vulnerable plaque (Fig. 6) where the corresponding CT and NIRAPA images are summarized in Supplementary Fig. 6 and the associated videos (Supplementary Videos 3 and 4). Here again, the NIRAPA and NIRAF signals were similar and spatially localized within the vulnerable plaque. The NIRAPA signal extended a smaller distance from the lumen, possibly due to the presence of proximal calcification blocking light from entering the intact plaque. From Fig. 6A, the combination of the ultrasound and NIRAPA signal suggested a very thin fibrous cap, and this was confirmed in Fig. 6B, as illustrated in Fig. 6C. Both CD68 and bilirubin IHC were positive for the region of the active NIRAPA signal (Fig. 6D-E). Cluster analysis of the spatial transcriptomic data again detected the presence of three clusters spanning macrophages, myofibroblasts and an SMC intermediate cluster (Fig. 6F-G, Supplementary Table 4). Similar to the stable plaque (Fig. 4F), we have annotated the smooth muscle cell-like cluster as SMC intermediate. Other works have explored the transdifferentiation and dedifferentiation of smooth muscle cells during plaque progression, which showed a decreased expression of markers such as SMA-2 (ACTA2) and the presence of other phenotypes[35, 45, 46, 50, 51].
Figure 6. Spatial transcriptomic and proteomic analysis of vulnerable plaque delineates spatially-dependent macrophage populations.
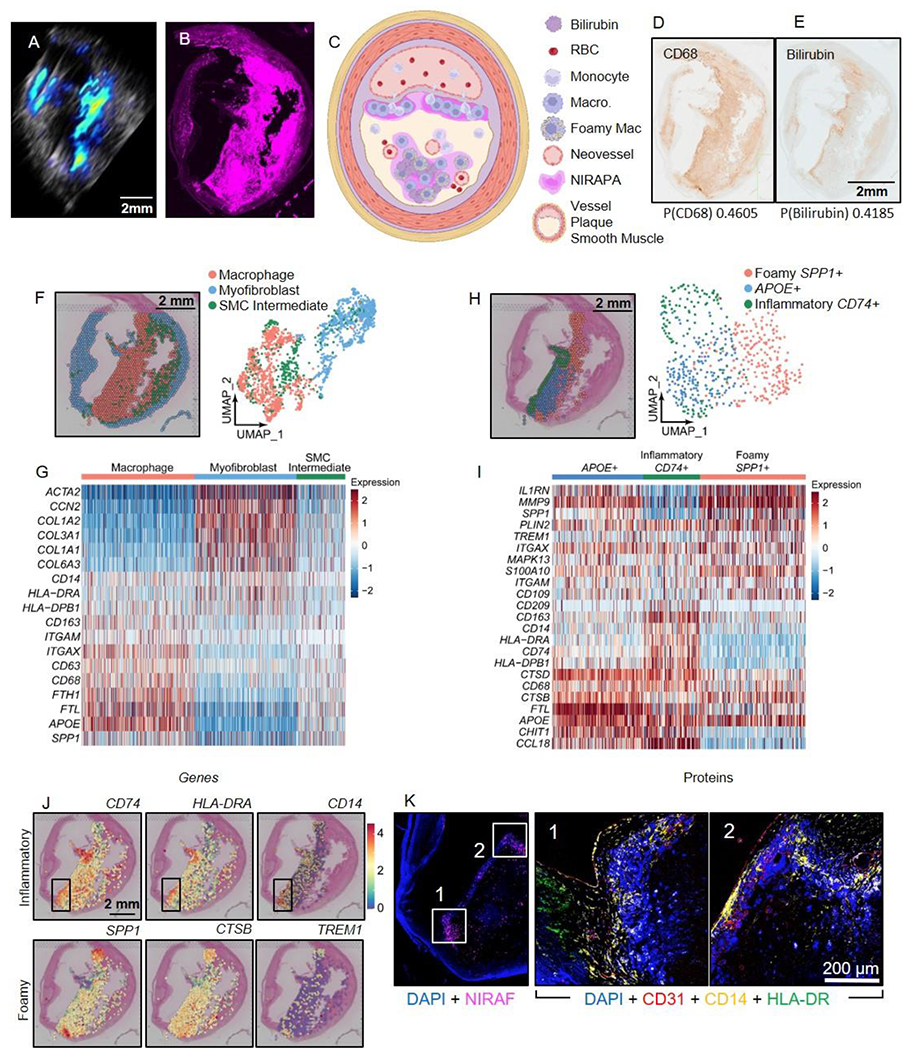
A-B) NIRAPA (A) and NIRAF (B) images of a carotid plaque cross section. C) Illustration summarizing the vulnerable plaque features and the location of the NIRAPA signal. D-E) Histological sections of the carotid endarterectomy (CEA) plaque specimen stained with CD68 (D) and bilirubin (E); corresponding Pearson’s correlation coefficients indicating correlation of each stain with NIRAF signal are reported below each image. F) Overlay and Uniform Manifold Approximation and Projection (UMAP) cluster projection of spatial transcriptomics on carotid plaque H&E. Based on their gene expression, clusters have been assigned to macrophage, myofibroblast and smooth muscle cell (SMC) intermediate cell types. G) Overall heatmap of general immunological signatures that differentiate the macrophage, myofibroblast and SMC intermediate clusters. H) Spatial deconvolution and UMAP cluster projection of the macrophage cluster in inflammatory CD74+, foamy SPP1+, and APOE+ regions and the spatial location on the H&E-stained plaque cross section. UMAP projection of macrophage high resolution subtype clustering shows CD74+, SPP1+, and APOE+ populations. I) Heatmap of macrophage-specific gene signatures that differentiate the CD74+, SPP1+, and APOE+ macrophage subpopulations. J) Key genes differentiating inflammatory (CD74+) and foamy (SPP1+) macrophages and their spatial location on the H&E-stained CEA specimen. A region with enhanced CD74 expression is outlined in a black box overlay and investigated further in (K). K) CODEX imaging of DAPI nuclear DNA stain, NIRAF, CD31, CD14, and HLA-DR in two areas of the vulnerable plaque region showing enhanced CD74 expression. P value cutoff is 0.005. Log2FC cutoff is 2.
Here, the macrophage cluster was adjacent to the lumen (Fig. 6F). The macrophage cluster was further analyzed to reveal foamy, APOE+ and inflammatory subclusters (Fig. 6H), with a thin layer of inflammatory macrophages covering the lumen and correlated with the NIRAPA signal. This inflammatory cluster highly expressed CD74, HLA-DRA, CD14, and CD163 (Fig. 6I). Spatial mapping of individual genes differentiated the macrophage clusters (Fig. 6J), with a region exhibiting enhanced CD74 expression outlined. CODEX imaging focused on this region revealed expression of angiogenic and inflammatory macrophage markers (Fig. 6K). As in Fig. 4, the NIRAPA signal is localized to the inflammatory macrophage phenotype. In the vulnerable plaque, endothelial and muscle tissue have degenerated, leaving inflammatory macrophages directly adjacent to the lumen. This is detected by the PA imaging and the NIR signal (Fig. 6A and B). In contrast, in the stable plaque, B-mode ultrasound imaging visualized the myofibroblast and smooth muscle plaque covering the inflammatory macrophages, which is consistent with the location of PA signal overlaid on the B-mode images. Together, this demonstrates the feasibility and utility of PA to differentiate plaque types and the biomolecular source of the PA signal.
The analysis of this vulnerable plaque was repeated in a second slice (Supplementary Fig. 7, Supplementary Table 5) and confirmed the correspondence of the NIRAPA and NIRAF signals with a macrophage (CD68) and bilirubin signal (Supplementary Fig. 7A-E), and the existence of the inflammatory macrophage mRNA near the lumen (Supplementary Fig. 7F-I). The co-expression of CD14 and HLA-DR on ~20% of cells was observed (Supplementary Fig. 7J). In this vulnerable plaque, the expression of the NIRAF signal within the cytoplasm of individual macrophages was confirmed on CODEX imaging (Supplementary Fig. 7K). Finally, based on the analysis of both the stable and vulnerable plaque, we performed a gene ontology analysis of the differences between these samples (Supplementary Fig. 8). Upregulated pathways in the vulnerable plaque included wound healing, hemostasis and blood coagulation, confirming the findings of the imaging study. In summary, the NIRAPA technique was capable of detecting regions of vulnerable plaque as a result of signals generated by extracellular protein and macrophages.
DISCUSSION
In our study, we use photoacoustic imaging to discriminate stable versus vulnerable plaque components based on naturally-occurring near-infrared markers. Near-infrared autofluorescence (NIRAF) has been associated with lipids and intraplaque hemorrhage. Macrophages, which are a marker of a vulnerable plaque, phagocytose extravasated red blood cells, degrade heme to bilirubin, and are involved in the formation of insoluble lipids or ceroids[30, 32]. Here we show that the aforementioned endogenous near-infrared biomarkers, especially in colocalization with macrophages, can be detected by photoacoustic imaging (PAI). Our results demonstrate that the NIR-auto-photoacoustic (NIRAPA) signal in the 680-700 nm range can be combined with anatomic ultrasound to distinguish stable from vulnerable plaque components. Especially in asymptomatic cases where the need for surgery is still difficult to assess, PAI using the NIRAPA signal achieved significant sensitivity of 87.5% and specificity of 100% (n=12). The sensitivity and specificity achieved with PAI outperformed the classical symptoms/histology system. The higher sensitivity and specificity could also be achieved due to the identification of asymptomatic vulnerable plaques, which represent the most difficult-to-detect and potentially most clinically-relevant cases.
Of particular clinical relevance is the assessment of the fibrous cap thickness overlying the necrotic core of the plaque, which is a key source of inflammation and thrombogenicity in lesions at risk for erosion or frank rupture[52]. A fibrous cap measuring less than 65 μm is considered a vulnerable plaque[40, 41]. Photoacoustic images overlaid on B-mode ultrasound images, with a resolution of 100 μm, allowed us to identify thick (>65 μm) fibrous caps, based on the missing NIRAPA signal, and NIRAPA signal generating pathological tissue components (macrophages, hemoglobin degradation products, necrotic material). The clinical importance of the detected NIRAPA signal depends on its area and its localization with respect to the plaque lumen. Some MRI-based studies have indicated that debris with a volume larger than 100 mm3 can promote blood vessel occlusion and cause stroke[53].
Transcriptomics and Proteomics
Further, we leverage the power of spatial transcriptomics and proteomics to validate the use of PAI. The spatial RNA sequencing results, in combination with spatial proteomics and immunohistochemistry (IHC), confirmed spatial correlation of the NIRAF signal and macrophages as well as hemoglobin degradation products[30, 54]. We believe this may be the first time that these techniques have been combined to develop and characterize an in vivo medical imaging technique.
By directly registering the images to the spatial ‘omic data, we were able to directly demonstrate that the NIRAPA signal can differentiate stable and vulnerable plaque, and arises both from extracellular heme degradation products, such as bilirubin, and from the cytoplasmic contents of inflammatory macrophages, particularly those bearing CD74, HLA-DR, CD14 and CD163 markers. By combining spatial transcriptomics and proteomics, we were also able to precisely determine the source of the NIRAPA signal. First, CODEX imaging with the NIRAF signal overlay confirmed the macrophage phenotypes associated with the NIRAPA signal on a single-cell level. Indeed, in a manner similar to imaging cytometry, the localization of the NIRAPA signal within the macrophage cytoplasm was confirmed. Both techniques revealed that inflammatory macrophages (CD74, HLA-DRA) were associated with a stronger NIRAF signal than SPP1+ foamy macrophages.
Second, the CODEX imaging mapped angiogenic vascular structures at a resolution not feasible with Visium transcriptomics, where leaky, angiogenic vessels could be the source of the red blood cells and their degradation products. While additional spatial transcriptomics technologies are emerging, few will be able to provide single-cell resolution with a deep genetic profile, further emphasizing the power of combinatorial -omics analyses. Third, with spatial proteomics, we confirmed that extracellular protein was a partial source of the NIRAPA signal.
Comparison to standard imaging methods
Standard imaging modalities for assessing carotid artery atherosclerosis include sonography, computed tomography (CT), magnetic resonance (MR) angiography, and digital subtraction angiography[55]. Treatment decisions, including determining when to offer surgical intervention, are primarily based on the degree of stenosis and the presence or absence of clinical symptoms[56]. However, plaque size and the severity of stenosis are not necessarily correlated with plaque vulnerability[40]. Many recent studies emphasize the importance of the plaque composition, which has a significantly higher impact on plaque vulnerability than luminal stenosis and plaque size alone[57–60]. Unstable, or vulnerable, plaques are characterized by a thin fibrous cap, a large necrotic core, neovascularization from vasa vasorum and intraplaque hemorrhage[15, 61–63]. CT is part of the current guidelines for the assessment and management of carotid plaques. The degree of stenosis in combination with clinical symptoms still guide the treatment decision. However, CT imaging alone cannot assess plaque composition[64, 65], nor reliably differentiate fibrous tissue and intraplaque hemorrhage due to the overlapping Hounsfield units of these components[66].
High-resolution MRI is used to accurately detect intraplaque hemorrhage, a marker of plaque vulnerability in symptomatic and asymptomatic patients[60, 67]. However, MRI is the most expensive imaging technique and not broadly accessible, whereas PAI, in combination with ultrasound, can be integrated more broadly[22]. Further, mapping the fibrous cap thickness is challenging with MRI imaging. PAI, utilizing our proposed auto-photoacoustic signal, would allow physicians to assess plaque vulnerability quickly and affordably, thus potentially facilitating the identification of asymptomatic individuals requiring treatment. This could lead to a significant reduction of adverse outcomes, as the presence of intraplaque hemorrhage is an independent risk factor for stroke and coronary heart disease[60]. For these reasons, new clinically-relevant imaging techniques such as PAI, in combination with novel biomarkers, are needed to further improve plaque treatment regimens.
To compensate for the patient’s differential light penetration properties, the PAI protocol should begin in a vessel region without plaque. In this area, PAI can be calibrated and the laser intensity or wavelength summation determined. Based on this PAI configuration, the operator should continue scanning the plaque area. PA images within the NIR range of 680-700 nm overlaid on top of B-mode ultrasound images then allow the assessment of the plaque wall. The size and location of the NIRAPA signal with respect to the plaque lumen can be used to distinguish the respective plaque as stable versus vulnerable.
Limitations
The main limitations in utilizing the NIRAPA signal in a clinical setting result from physical constraints. In order to excite the naturally-occurring biomarker in the near-infrared range of 670-700 nm, sufficient photons from the laser pulse must be able to penetrate the tissue. A major absorber of light is the hemoglobin in blood, but also the presence of calcified tissue structures[22, 24]. Due to the superficial location of the carotid artery, the laser light can illuminate the complete vessel. However, currently available planar transducers and planar laser fibers may not provide homogenous illumination of the vessel depending on the plaque size, and new C-shaped (concave) transducers with correspondingly aligned laser fibers could improve image quality. Differences between the NIRAPA and NIRAF signals are influenced by the plaque size and the illumination limitations. Further improvements may require the development of novel transducers to improve the arterial illumination.
The NIRAPA signal has a similar spectrum to deoxy hemoglobin with the exception of the missing peak around 750 nm. Therefore, it might be more challenging to identify the NIRAPA signal in veins, containing deoxy hemoglobin. In the carotid artery, on the other hand, we expect a clear difference between oxygenated blood in the artery and the spatial location of the NIRAPA signal based on the simultaneously recorded ultrasound (US) images. Additionally, the NIRAPA signal should always be evaluated in combination with the corresponding US image, since NIRAPA provides functional information, but should be augmented by anatomy from the US image. The presence of an NIRAPA/NIRAF signal doesn’t discriminate between the heme degradation product bilirubin and insoluble lipids or ceroids. However, if the NIRAPA/NIRAF signal is absent, this is a clear indication that the vessel consists of benign components.
Based on our fresh-sample NIRAPA scans, we expect the in vivo NIRAPA signal to be strong enough to detect in a clinical setting. The presence of blood within the carotid artery will have an impact on the light absorption and therefore on the penetration depth, but previous PA in vivo studies have demonstrated the recording of PA clinical images to a depth of several centimeters with similar wavelengths[23, 27]. Spectral unmixing of the PA signal and the underlying US images used for spatial orientation allow discrimination of the plaque wall tissue component image from the blood-originated PA image. PA signals from oxygenated blood in the carotid can be clearly distinguished from the NIRAPA signal based on the spectral properties of NIRAPA, which is much closer to deoxygenated blood (Supplementary Fig. 1).
Summary
Atherosclerosis is a dynamic process over time, which is characterized through different stages. Since plaques are very common among aging adults, and the majority consist of stable plaques, which do not impact the wellbeing of a patient, it is essential to identify and prioritize treatment of vulnerable plaques. Carotid artery plaque management requires thorough surveillance due to the potential for devastating morbidity from stroke. Depending on the plaque characteristics, different treatment strategies are indicated, ranging from intensification of drug regimens to surgical interventions. To aid in predicting which treatment strategy will be the most successful, the detection of this newly described naturally-occurring near-infrared biomarker, which is associated with the presence of inflammatory markers such as macrophages and the blood degradation product bilirubin, is crucial. Therefore, our results will lead to more precision medicine and personally-tailored disease evaluation and treatment.
Supplementary Material
Multimedia 1. Supplementary methods, Figures and Tables 1–2.
Multimedia 2. Supplementary Table 3. Differential expression gene and location coordinate tables for the CEA sample from Fig. 4. Including overall populations and macrophage subpopulations
Multimedia 3. Supplementary Table 4. Differential expression gene and location coordinate tables for the CEA sample from Fig. 6. Including overall populations and macrophage subpopulations
Multimedia 4. Supplementary Table 5. Differential expression gene and location coordinate tables for the CEA sample from Supplementary Fig. 7. Including overall populations and macrophage subpopulations
Multimedia 5. Supplementary Video 1. Corresponding PAI images to Supplementary Fig. S3. Serial axial PAI/US sections through the lesion in the carotid artery. The photoacoustic NIRAPA signal is overlaid in color on B-mode US images (black and white) acquired ex vivo.
Multimedia 6. Supplementary Video 2. Corresponding CT images to Supplementary Fig. S3. Serial axial CT sections through the lesion in the carotid artery acquired in vivo.
Multimedia 7. Supplementary Video 3. Corresponding PAI images to Supplementary Fig. S6. Serial axial PAI/US sections through the lesion in the carotid artery. The photoacoustic NIRAPA signal is overlaid in color on B-mode US images (black and white) acquired ex vivo.
Multimedia 8. Supplementary Video 4. Corresponding CT images to Supplementary Fig. S6. Serial axial CT sections through the lesion in the carotid artery acquired in vivo.
Acknowledgements:
We dedicate this paper to our friend and colleague Dr. Sanjiv Sam Gambhir who recruited Martin Schneider to Stanford University. This project was supported by the Stanford PHIND Institute and NIH R01 CA250557 and NIHR01CA253316, through which we developed spatial sequencing techniques. The sequencing data was generated with instrumentation purchased with NIH funds: S10OD025212, 1S10OD021763, R35HL144475 and T32CA118681. This research was also supported in part by a training grant from NIH Cellular and Molecular Training Grant (NIGMS, T32GM007276). The Vevo LAZR-X equipment was provided for this study by Fujifilm VisualSonics. The assistance of Alexander Trevino at Enable Medicine was greatly appreciated. Imaging was performed in the Stanford Center for Innovation in In vivo Imaging (SCi3).
Footnotes
Publisher's Disclaimer: This is a PDF file of an unedited manuscript that has been accepted for publication. As a service to our customers we are providing this early version of the manuscript. The manuscript will undergo copyediting, typesetting, and review of the resulting proof before it is published in its final form. Please note that during the production process errors may be discovered which could affect the content, and all legal disclaimers that apply to the journal pertain.
Competing interests: AM is an employee of Enable Medicine, which develops CODEX-related methodologies. All other authors declare no competing interest.
The authors declare the following financial interests/personal relationships which may be considered as potential competing interests:
Katherine Ferrara reports financial support was provided by National Institutes of Health.
Data availability
The main data supporting the findings of this study are available within the paper and its Supplementary Information. The raw and analyzed datasets will be made available through an appropriate data server upon acceptance of the paper.
References
- [1].Libby P, Buring JE, Badimon L, Hansson GK, Deanfield J, Bittencourt MS, Tokgozoglu L, Lewis EF, Atherosclerosis, Nat Rev Dis Primers 5(1) (2019) 56. [DOI] [PubMed] [Google Scholar]
- [2].W.H. Organization, Cardiovascular diseases (CVDs) Fact Sheet, (2021).
- [3].C.f.D.C.a. Prevention, Mortality in the United States, 2020, (2021).
- [4].Hansson GK, Hermansson A, The immune system in atherosclerosis, Nat Immunol 12(3) (2011) 204–12. [DOI] [PubMed] [Google Scholar]
- [5].Hansson GK, Inflammation, atherosclerosis, and coronary artery disease, N Engl J Med 352(16) (2005) 1685–95. [DOI] [PubMed] [Google Scholar]
- [6].Prati P, Vanuzzo D, Casaroli M, Di Chiara A, De Biasi F, Feruglio GA, Touboul PJ, Prevalence and determinants of carotid atherosclerosis in a general population, Stroke 23(12) (1992) 1705–11. [DOI] [PubMed] [Google Scholar]
- [7].Bergstrom G, Persson M, Adiels M, Bjornson E, Bonander C, Ahlstrom H, Alfredsson J, Angeras O, Berglund G, Blomberg A, Brandberg J, Borjesson M, Cederlund K, de Faire U, Duvernoy O, Ekblom O, Engstrom G, Engvall JE, Fagman E, Eriksson M, Erlinge D, Fagerberg B, Flinck A, Goncalves I, Hagstrom E, Hjelmgren O, Lind L, Lindberg E, Lindqvist P, Ljungberg J, Magnusson M, Mannila M, Markstad H, Mohammad MA, Nystrom FH, Ostenfeld E, Persson A, Rosengren A, Sandstrom A, Sjalander A, Skold MC, Sundstrom J, Swahn E, Soderberg S, Toren K, Ostgren CJ, Jernberg T, Prevalence of Subclinical Coronary Artery Atherosclerosis in the General Population, Circulation 144(12) (2021) 916–929. [DOI] [PMC free article] [PubMed] [Google Scholar]
- [8].Tuzcu EM, Kapadia SR, Tutar E, Ziada KM, Hobbs RE, McCarthy PM, Young JB, Nissen SE, High prevalence of coronary atherosclerosis in asymptomatic teenagers and young adults: evidence from intravascular ultrasound, Circulation 103(22) (2001) 2705–10. [DOI] [PubMed] [Google Scholar]
- [9].Golledge J, Greenhalgh RM, Davies AH, The symptomatic carotid plaque, Stroke 31(3) (2000) 774–81. [DOI] [PubMed] [Google Scholar]
- [10].Longstreth WT Jr., Shemanski L, Lefkowitz D, O’Leary DH, Polak JF, Wolfson SK Jr., Asymptomatic internal carotid artery stenosis defined by ultrasound and the risk of subsequent stroke in the elderly. The Cardiovascular Health Study, Stroke 29(11) (1998) 2371–6. [DOI] [PubMed] [Google Scholar]
- [11].Vergallo R, Crea F, Atherosclerotic Plaque Healing, N Engl J Med 383(9) (2020) 846–857. [DOI] [PubMed] [Google Scholar]
- [12].Kamtchum-Tatuene J, Noubiap JJ, Wilman AH, Saqqur M, Shuaib A, Jickling GC, Prevalence of High-risk Plaques and Risk of Stroke in Patients With Asymptomatic Carotid Stenosis: A Meta-analysis, JAMA Neurol 77(12) (2020) 1524–1535. [DOI] [PMC free article] [PubMed] [Google Scholar]
- [13].Li J, Montarello NJ, Hoogendoorn A, Verjans JW, Bursill CA, Peter K, Nicholls SJ, McLaughlin RA, Psaltis PJ, Multimodality Intravascular Imaging of High-Risk Coronary Plaque, JACC Cardiovasc Imaging 15(1) (2022) 145–159. [DOI] [PubMed] [Google Scholar]
- [14].Narula J, Nakano M, Virmani R, Kolodgie FD, Petersen R, Newcomb R, Malik S, Fuster V, Finn AV, Histopathologic characteristics of atherosclerotic coronary disease and implications of the findings for the invasive and noninvasive detection of vulnerable plaques, J Am Coll Cardiol 61(10) (2013) 1041–51. [DOI] [PMC free article] [PubMed] [Google Scholar]
- [15].Burke AP, Farb A, Malcom GT, Liang YH, Smialek J, Virmani R, Coronary risk factors and plaque morphology in men with coronary disease who died suddenly, N Engl J Med 336(18) (1997) 1276–82. [DOI] [PubMed] [Google Scholar]
- [16].Davies MJ, Thomas AC, Plaque fissuring--the cause of acute myocardial infarction, sudden ischaemic death, and crescendo angina, Br Heart J 53(4) (1985) 363–73. [DOI] [PMC free article] [PubMed] [Google Scholar]
- [17].Howard DP, van Lammeren GW, Rothwell PM, Redgrave JN, Moll FL, de Vries JP, de Kleijn DP, den Ruijter HM, de Borst GJ, Pasterkamp G, Symptomatic carotid atherosclerotic disease: correlations between plaque composition and ipsilateral stroke risk, Stroke 46(1) (2015) 182–189. [DOI] [PMC free article] [PubMed] [Google Scholar]
- [18].JM UK-I, Young V, Gillard JH, Carotid-artery imaging in the diagnosis and management of patients at risk of stroke, Lancet Neurol 8(6) (2009) 569–80. [DOI] [PubMed] [Google Scholar]
- [19].Zhu G, Hom J, Li Y, Jiang B, Rodriguez F, Fleischmann D, Saloner D, Porcu M, Zhang Y, Saba L, Wintermark M, Carotid plaque imaging and the risk of atherosclerotic cardiovascular disease, Cardiovasc Diagn Ther 10(4) (2020) 1048–1067. [DOI] [PMC free article] [PubMed] [Google Scholar]
- [20].Ivankovic I, Mercep E, Schmedt CG, Dean-Ben XL, Razansky D, Real-time Volumetric Assessment of the Human Carotid Artery: Handheld Multispectral Optoacoustic Tomography, Radiology 291(1) (2019) 45–50. [DOI] [PubMed] [Google Scholar]
- [21].Jansen K, van Soest G, van der Steen AF, Intravascular photoacoustic imaging: a new tool for vulnerable plaque identification, Ultrasound Med Biol 40(6) (2014) 1037–48. [DOI] [PubMed] [Google Scholar]
- [22].Steinberg I, Huland DM, Vermesh O, Frostig HE, Tummers WS, Gambhir SS, Photoacoustic clinical imaging, Photoacoustics 14 (2019) 77–98. [DOI] [PMC free article] [PubMed] [Google Scholar]
- [23].Weber J, Beard PC, Bohndiek SE, Contrast agents for molecular photoacoustic imaging, Nat Methods 13(8) (2016) 639–50. [DOI] [PubMed] [Google Scholar]
- [24].Zackrisson S, van de Ven S, Gambhir SS, Light in and sound out: emerging translational strategies for photoacoustic imaging, Cancer Res 74(4) (2014) 979–1004. [DOI] [PMC free article] [PubMed] [Google Scholar]
- [25].Kruizinga P, van der Steen AF, de Jong N, Springeling G, Robertus JL, van der Lugt A, van Soest G, Photoacoustic imaging of carotid artery atherosclerosis, J Biomed Opt 19(11) (2014) 110504. [DOI] [PubMed] [Google Scholar]
- [26].Allen TJ, Hall A, Dhillon AP, Owen JS, Beard PC, Spectroscopic photoacoustic imaging of lipid-rich plaques in the human aorta in the 740 to 1400 nm wavelength range, J Biomed Opt 17(6) (2012) 061209. [DOI] [PubMed] [Google Scholar]
- [27].Karlas A, Kallmayer M, Bariotakis M, Fasoula NA, Liapis E, Hyafil F, Pelisek J, Wildgruber M, Eckstein HH, Ntziachristos V, Multispectral optoacoustic tomography of lipid and hemoglobin contrast in human carotid atherosclerosis, Photoacoustics 23 (2021) 100283. [DOI] [PMC free article] [PubMed] [Google Scholar]
- [28].Arabul MU, Heres M, Rutten MC, van Sambeek MR, van de Vosse FN, Lopata RG, Toward the detection of intraplaque hemorrhage in carotid artery lesions using photoacoustic imaging, J Biomed Opt 22(4) (2017) 41010. [DOI] [PubMed] [Google Scholar]
- [29].Muller JW, van Hees R, van Sambeek M, Boutouyrie P, Rutten M, Brands P, Wu M, Lopata R, Towards in vivo photoacoustic imaging of vulnerable plaques in the carotid artery, Biomed Opt Express 12(7) (2021) 4207–4218. [DOI] [PMC free article] [PubMed] [Google Scholar]
- [30].Htun NM, Chen YC, Lim B, Schiller T, Maghzal GJ, Huang AL, Elgass KD, Rivera J, Schneider HG, Wood BR, Stocker R, Peter K, Near-infrared autofluorescence induced by intraplaque hemorrhage and heme degradation as marker for high-risk atherosclerotic plaques, Nat Commun 8(1) (2017) 75. [DOI] [PMC free article] [PubMed] [Google Scholar]
- [31].Wang H, Gardecki JA, Ughi GJ, Jacques PV, Hamidi E, Tearney GJ, Ex vivo catheter-based imaging of coronary atherosclerosis using multimodality OCT and NIRAF excited at 633 nm, Biomed Opt Express 6(4) (2015) 1363–75. [DOI] [PMC free article] [PubMed] [Google Scholar]
- [32].Albaghdadi MS, Ikegami R, Kassab MB, Gardecki JA, Kunio M, Chowdhury MM, Khamis R, Libby P, Tearney GJ, Jaffer FA, Near-Infrared Autofluorescence in Atherosclerosis Associates With Ceroid and Is Generated by Oxidized Lipid-Induced Oxidative Stress, Arterioscler Thromb Vasc Biol 41(7) (2021) e385–e398. [DOI] [PMC free article] [PubMed] [Google Scholar]
- [33].Chen Z, Dean-Ben XL, Gottschalk S, Razansky D, Performance of optoacoustic and fluorescence imaging in detecting deep-seated fluorescent agents, Biomed Opt Express 9(5) (2018) 2229–2239. [DOI] [PMC free article] [PubMed] [Google Scholar]
- [34].Black S, Phillips D, Hickey JW, Kennedy-Darling J, Venkataraaman VG, Samusik N, Goltsev Y, Schurch CM, Nolan GP, CODEX multiplexed tissue imaging with DNA-conjugated antibodies, Nat Protoc 16(8) (2021) 3802–3835. [DOI] [PMC free article] [PubMed] [Google Scholar]
- [35].Fernandez DM, Giannarelli C, Immune cell profiling in atherosclerosis: role in research and precision medicine, Nat Rev Cardiol 19(1) (2022) 43–58. [DOI] [PMC free article] [PubMed] [Google Scholar]
- [36].Paik DT, Cho S, Tian L, Chang HY, Wu JC, Single-cell RNA sequencing in cardiovascular development, disease and medicine, Nat Rev Cardiol 17(8) (2020) 457–473. [DOI] [PMC free article] [PubMed] [Google Scholar]
- [37].Stahl PL, Salmen F, Vickovic S, Lundmark A, Navarro JF, Magnusson J, Giacomello S, Asp M, Westholm JO, Huss M, Mollbrink A, Linnarsson S, Codeluppi S, Borg A, Ponten F, Costea PI, Sahlen P, Mulder J, Bergmann O, Lundeberg J,Frisen J, Visualization and analysis of gene expression in tissue sections by spatial transcriptomics, Science 353(6294) (2016) 78–82. [DOI] [PubMed] [Google Scholar]
- [38].Popović ZB, Thomas JD, Assessing observer variability: a user’s guide, Cardiovasc Diagn Ther 7(3) (2017) 317–324. [DOI] [PMC free article] [PubMed] [Google Scholar]
- [39].Young GR, Humphrey PRD, Nixon TE, Smith ETS, Variability in Measurement of Extracranial Internal Carotid Artery Stenosis as Displayed by Both Digital Subtraction and Magnetic Resonance Angiography, Stroke 27(3) (1996) 467–473. [DOI] [PubMed] [Google Scholar]
- [40].Virmani R, Burke AP, Farb A, Kolodgie FD, Pathology of the vulnerable plaque, J Am Coll Cardiol 47(8 Suppl) (2006) C13–8. [DOI] [PubMed] [Google Scholar]
- [41].Virmani R, Kolodgie FD, Burke AP, Farb A, Schwartz SM, Lessons from sudden coronary death: a comprehensive morphological classification scheme for atherosclerotic lesions, Arterioscler Thromb Vasc Biol 20(5) (2000) 1262–75. [DOI] [PubMed] [Google Scholar]
- [42].Hao Y, Hao S, Andersen-Nissen E, Mauck WM 3rd, Zheng S, Butler A, Lee MJ, Wilk AJ, Darby C, Zager M, Hoffman P, Stoeckius M, Papalexi E, Mimitou EP, Jain J, Srivastava A, Stuart T, Fleming LM, Yeung B, Rogers AJ, McElrath JM, Blish CA, Gottardo R, Smibert P, Satija R, Integrated analysis of multimodal single-cell data, Cell 184(13) (2021) 3573–3587 e29. [DOI] [PMC free article] [PubMed] [Google Scholar]
- [43].Virmani R, Burke AP, Farb A, Kolodgie FD, Pathology of the Vulnerable Plaque, Journal of the American College of Cardiology 47(8, Supplement) (2006) C13–C18. [DOI] [PubMed] [Google Scholar]
- [44].Winkels H, Ehinger E, Vassallo M, Buscher K, Dinh HQ, Kobiyama K, Hamers AAJ, Cochain C, Vafadarnejad E, Saliba AE, Zernecke A, Pramod AB, Ghosh AK, Anto Michel N, Hoppe N, Hilgendorf I, Zirlik A, Hedrick CC, Ley K, Wolf D, Atlas of the Immune Cell Repertoire in Mouse Atherosclerosis Defined by Single-Cell RNA-Sequencing and Mass Cytometry, Circ Res 122(12) (2018) 1675–1688. [DOI] [PMC free article] [PubMed] [Google Scholar]
- [45].Willemsen L, de Winther MP, Macrophage subsets in atherosclerosis as defined by single-cell technologies, J Pathol 250(5) (2020) 705–714. [DOI] [PMC free article] [PubMed] [Google Scholar]
- [46].Wirka RC, Wagh D, Paik DT, Pjanic M, Nguyen T, Miller CL, Kundu R, Nagao M, Coller J, Koyano TK, Fong R, Woo YJ, Liu B, Montgomery SB, Wu JC, Zhu K, Chang R, Alamprese M, Tallquist MD, Kim JB, Quertermous T, Atheroprotective roles of smooth muscle cell phenotypic modulation and the TCF21 disease gene as revealed by single-cell analysis, Nat Med 25(8) (2019) 1280–1289. [DOI] [PMC free article] [PubMed] [Google Scholar]
- [47].Pan H, Xue C, Auerbach BJ, Fan J, Bashore AC, Cui J, Yang DY, Trignano SB, Liu W, Shi J, Ihuegbu CO, Bush EC, Worley J, Vlahos L, Laise P, Solomon RA, Connolly ES, Califano A, Sims PA, Zhang H, Li M, Reilly MP, Single-Cell Genomics Reveals a Novel Cell State During Smooth Muscle Cell Phenotypic Switching and Potential Therapeutic Targets for Atherosclerosis in Mouse and Human, Circulation 142(21) (2020) 2060–2075. [DOI] [PMC free article] [PubMed] [Google Scholar]
- [48].Wang Y, Nanda V, Direnzo D, Ye J, Xiao S, Kojima Y, Howe KL, Jarr K-U, Flores AM, Tsantilas P, Tsao N, Rao A, Newman AAC, Eberhard AV, Priest JR, Ruusalepp A, Pasterkamp G, Maegdefessel L, Miller CL, Lind L, Koplev S, Björkegren JLM, Owens GK, Ingelsson E, Weissman IL, Leeper NJ, Clonally expanding smooth muscle cells promote atherosclerosis by escaping efferocytosis and activating the complement cascade, Proceedings of the National Academy of Sciences 117(27) (2020) 15818–15826. [DOI] [PMC free article] [PubMed] [Google Scholar]
- [49].Fernandez DM, Rahman AH, Fernandez NF, Chudnovskiy A, Amir ED, Amadori L, Khan NS, Wong CK, Shamailova R, Hill CA, Wang Z, Remark R, Li JR, Pina C, Faries C, Awad AJ, Moss N, Bjorkegren JLM, Kim-Schulze S, Gnjatic S, Ma’ayan A, Mocco J, Faries P, Merad M, Giannarelli C, Single-cell immune landscape of human atherosclerotic plaques, Nat Med 25(10) (2019) 1576–1588. [DOI] [PMC free article] [PubMed] [Google Scholar]
- [50].Li Y, Zhu H, Zhang Q, Han X, Zhang Z, Shen L, Wang L, Lui KO, He B, Zhou B, Smooth muscle-derived macrophage-like cells contribute to multiple cell lineages in the atherosclerotic plaque, Cell Discov 7(1) (2021) 111. [DOI] [PMC free article] [PubMed] [Google Scholar]
- [51].Allahverdian S, Chaabane C, Boukais K, Francis GA, Bochaton-Piallat ML, Smooth muscle cell fate and plasticity in atherosclerosis, Cardiovasc Res 114(4) (2018) 540–550. [DOI] [PMC free article] [PubMed] [Google Scholar]
- [52].Kojima Y, Weissman IL, Leeper NJ, The Role of Efferocytosis in Atherosclerosis, Circulation 135(5) (2017) 476–489. [DOI] [PMC free article] [PubMed] [Google Scholar]
- [53].Takaya N, Yuan C, Chu B, Saam T, Polissar NL, Jarvik GP, Isaac C, McDonough J, Natiello C, Small R, Ferguson MS, Hatsukami TS, Presence of intraplaque hemorrhage stimulates progression of carotid atherosclerotic plaques: a high-resolution magnetic resonance imaging study, Circulation 111(21) (2005) 2768–75. [DOI] [PubMed] [Google Scholar]
- [54].Chinetti-Gbaguidi G, Colin S, Staels B, Macrophage subsets in atherosclerosis, Nat Rev Cardiol 12(1) (2015) 10–7. [DOI] [PubMed] [Google Scholar]
- [55].Saba L, Yuan C, Hatsukami TS, Balu N, Qiao Y, DeMarco JK, Saam T, Moody AR, Li D, Matouk CC, Johnson MH, Jager HR, Mossa-Basha M, Kooi ME, Fan Z, Saloner D, Wintermark M, Mikulis DJ, Wasserman BA, Vessel N Wall Imaging Study Group of the American Society of, Carotid Artery Wall Imaging: Perspective and Guidelines from the ASNR Vessel Wall Imaging Study Group and Expert Consensus Recommendations of the American Society of Neuroradiology, AJNR Am J Neuroradiol 39(2) (2018) E9–E31. [DOI] [PMC free article] [PubMed] [Google Scholar]
- [56].Saba L, Brinjikji W, Spence JD, Wintermark M, Castillo M, de Borst GJ, Yang Q, Yuan C, Buckler A, Edjlali M, Saam T, Saloner D, Lal BK, Capodanno D, Sun J, Balu N, Naylor R, Lugt AVD, Wasserman BA, Kooi ME, Wardlaw J, Gillard J, Lanzino G, Hedin U, Mikulis D, Gupta A, DeMarco JK, Hess C, Goethem JV, Hatsukami T, Rothwell P, Brown MM, Moody AR, Roadmap Consensus on Carotid Artery Plaque Imaging and Impact on Therapy Strategies and Guidelines: An International, Multispecialty, Expert Review and Position Statement, AJNR Am J Neuroradiol 42(9) (2021) 1566–1575. [DOI] [PMC free article] [PubMed] [Google Scholar]
- [57].Chai JT, Biasiolli L, Li L, Alkhalil M, Galassi F, Darby C, Halliday AW, Hands L, Magee T, Perkins J, Sideso E, Handa A, Jezzard P, Robson MD, Choudhury RP, Quantification of Lipid-Rich Core in Carotid Atherosclerosis Using Magnetic Resonance T(2) Mapping: Relation to Clinical Presentation, JACC Cardiovasc Imaging 10(7) (2017) 747–756. [DOI] [PMC free article] [PubMed] [Google Scholar]
- [58].Bos D, van Dam-Nolen DHK, Gupta A, Saba L, Saloner D, Wasserman BA, van der Lugt A, Advances in Multimodality Carotid Plaque Imaging: AJR Expert Panel Narrative Review, AJR Am J Roentgenol 217(1) (2021) 16–26. [DOI] [PubMed] [Google Scholar]
- [59].Daghem M, Bing R, Fayad ZA, Dweck MR, Noninvasive Imaging to Assess Atherosclerotic Plaque Composition and Disease Activity: Coronary and Carotid Applications, JACC Cardiovasc Imaging 13(4) (2020) 1055–1068. [DOI] [PMC free article] [PubMed] [Google Scholar]
- [60].Bos D, Arshi B, van den Bouwhuijsen QJA, Ikram MK, Selwaness M, Vernooij MW, Kavousi M, van der Lugt A, Atherosclerotic Carotid Plaque Composition and Incident Stroke and Coronary Events, J Am Coll Cardiol 77(11) (2021) 1426–1435. [DOI] [PubMed] [Google Scholar]
- [61].Naghavi M, Libby P, Falk E, Casscells SW, Litovsky S, Rumberger J, Badimon JJ, Stefanadis C, Moreno P, Pasterkamp G, Fayad Z, Stone PH, Waxman S, Raggi P, Madjid M, Zarrabi A, Burke A, Yuan C, Fitzgerald PJ, Siscovick DS, de Korte CL, Aikawa M, Airaksinen KE, Assmann G, Becker CR, Chesebro JH, Farb A, Galis ZS, Jackson C, Jang IK, Koenig W, Lodder RA, March K, Demirovic J, Navab M, Priori SG, Rekhter MD, Bahr R, Grundy SM, Mehran R, Colombo A, Boerwinkle E, Ballantyne C, Insull W Jr., Schwartz RS, Vogel R, Serruys PW, Hansson GK, Faxon DP, Kaul S, Drexler H, Greenland P, Muller JE, Virmani R, Ridker PM, Zipes DP, Shah PK, Willerson JT, From vulnerable plaque to vulnerable patient: a call for new definitions and risk assessment strategies: Part II, Circulation 108(15) (2003) 1772–8. [DOI] [PubMed] [Google Scholar]
- [62].Carr S, Farb A, Pearce WH, Virmani R, Yao JS, Atherosclerotic plaque rupture in symptomatic carotid artery stenosis, J Vasc Surg 23(5) (1996) 755–65; discussion 765-6. [DOI] [PubMed] [Google Scholar]
- [63].Falk E, Nakano M, Bentzon JF, Finn AV, Virmani R, Update on acute coronary syndromes: the pathologists’ view, Eur Heart J 34(10) (2013) 719–28. [DOI] [PubMed] [Google Scholar]
- [64].Millon A, Mathevet JL, Boussel L, Faries PL, Fayad ZA, Douek PC, Feugier P, High-resolution magnetic resonance imaging of carotid atherosclerosis identifies vulnerable carotid plaques, J Vasc Surg 57(4) (2013) 1046–1051 e2. [DOI] [PubMed] [Google Scholar]
- [65].Grimm JM, Schindler A, Freilinger T, Cyran CC, Bamberg F, Yuan C, Reiser MF, Dichgans M, Freilinger C, Nikolaou K, Saam T, Comparison of symptomatic and asymptomatic atherosclerotic carotid plaques using parallel imaging and 3 T black-blood in vivo CMR, J Cardiovasc Magn Reson 15(1) (2013) 44. [DOI] [PMC free article] [PubMed] [Google Scholar]
- [66].Saba L, Saam T, Jager HR, Yuan C, Hatsukami TS, Saloner D, Wasserman BA, Bonati LH, Wintermark M, Imaging biomarkers of vulnerable carotid plaques for stroke risk prediction and their potential clinical implications, Lancet Neurol 18(6) (2019) 559–572. [DOI] [PubMed] [Google Scholar]
- [67].Gupta A, Baradaran H, Schweitzer AD, Kamel H, Pandya A, Delgado D, Dunning A, Mushlin AI, Sanelli PC, Carotid plaque MRI and stroke risk: a systematic review and meta-analysis, Stroke 44(11) (2013) 3071–7. [DOI] [PubMed] [Google Scholar]
Associated Data
This section collects any data citations, data availability statements, or supplementary materials included in this article.
Supplementary Materials
Multimedia 1. Supplementary methods, Figures and Tables 1–2.
Multimedia 2. Supplementary Table 3. Differential expression gene and location coordinate tables for the CEA sample from Fig. 4. Including overall populations and macrophage subpopulations
Multimedia 3. Supplementary Table 4. Differential expression gene and location coordinate tables for the CEA sample from Fig. 6. Including overall populations and macrophage subpopulations
Multimedia 4. Supplementary Table 5. Differential expression gene and location coordinate tables for the CEA sample from Supplementary Fig. 7. Including overall populations and macrophage subpopulations
Multimedia 5. Supplementary Video 1. Corresponding PAI images to Supplementary Fig. S3. Serial axial PAI/US sections through the lesion in the carotid artery. The photoacoustic NIRAPA signal is overlaid in color on B-mode US images (black and white) acquired ex vivo.
Multimedia 6. Supplementary Video 2. Corresponding CT images to Supplementary Fig. S3. Serial axial CT sections through the lesion in the carotid artery acquired in vivo.
Multimedia 7. Supplementary Video 3. Corresponding PAI images to Supplementary Fig. S6. Serial axial PAI/US sections through the lesion in the carotid artery. The photoacoustic NIRAPA signal is overlaid in color on B-mode US images (black and white) acquired ex vivo.
Multimedia 8. Supplementary Video 4. Corresponding CT images to Supplementary Fig. S6. Serial axial CT sections through the lesion in the carotid artery acquired in vivo.
Data Availability Statement
The main data supporting the findings of this study are available within the paper and its Supplementary Information. The raw and analyzed datasets will be made available through an appropriate data server upon acceptance of the paper.