

Abstract
Purpose:
Accelerometers are used to objectively measure physical behaviors in free-living environments, typically for ≥7 consecutive days. We examined whether participants experience “wear fatigue”, a decline in wear time day over day, during typical assessment period acquired in a nationally representative sample of 6–80-year-olds in the United States (U.S.).
Methods:
Participants were instructed to wear an ActiGraph GT3X+ on their non-dominant wrist continuously for 7 consecutive days. Participants with seven complete days of recorded data, regardless of wear status, were included in the analyses (N = 13,649). Wear was scored with the Sleep-Wake-and-Nonwear (SWaN) algorithm.
Results:
Participants averaged 1248 ± 3.6 (Mean ± SE) min·day−1 of wear over the assessment but wear time linearly decreased from day 1 (1295 ± 3.2 minutes) to day 7 (1170 ± 5.3 minutes) resulting in a wear fatigue of −18.1 ± 0.7 min·day−1 (β ± SE). Wear fatigue did not differ by sex but varied by age group - highest in adolescents (−26.8 ± 2.4 min·day−1) and lowest in older adults (−9.3 ± 0.9 min·day−1). Wear was lower in evening (18:00–23:59) and early morning (00:00–05:59) compared to the middle of the day and on weekend days compared to weekdays. We verified similar wear fatigue (−23.5 ± 0.7 min·day−1) in a separate sample (N = 14,631) with hip-worn devices and different wear-scoring. Applying minimum wear criteria of ≥10 h·day−1 for ≥4 days reduced wear fatigue to −5.3 mins·day−1 and −18.7 mins·day−1 for the wrist and hip, respectively.
Conclusions:
Patterns of wear suggest non-compliance may disproportionately affect estimates of sleep and sedentary behavior, particularly for adolescents. Further study is needed to determine the impact of wear fatigue on longer assessments.
Keywords: ACTIGRAPH, WEARABLE DEVICE, ACTIVITY TRACKING, PHYSICAL BEHAVIOR MONITORING, NONWEAR
INTRODUCTION
Wearable devices are frequently used to objectively assess free-living physical behaviors, providing valuable insights into the role of physical activity (PA), sedentary behavior (SB), and sleep on health. However, missing data due to non-compliance with wear instructions is a common occurrence, which limits the accuracy of these device-based physical behavior assessments. In the early stages of device-based physical behavior assessment, quantifying waking physical behaviors mainly used waist-worn devices which were removed during sleep. This practice may have led to less daily wear time and greater non-compliance (1), as participants may have forgotten to reattach upon waking. Sleep assessments used wrist-worn devices, which typically increases wear time (2). However, analyses of sleep largely ignored activity outside the sleep period. These methodological differences have led to potential gaps in our knowledge of how the inter-relationship of sleep and waking physical behaviors may impact health. More recently, free-living protocols to assess physical behavior have trended toward instructing participants to wear wrist-based devices continuously, which has improved wear compliance (2), increased daily wear time, and allowed for analyses of the 24-hour activity cycle (3), which depends on both the amounts of and interactions between physical activity, sedentary behavior, and sleep to inform development of 24-hour movement guidelines (4–6). Despite evidence of greater group-level mean wear time, little has been done to systematically quantify wear behavior over the duration of a continuous free-living wear protocol.
Prior research has shown that for many at-home behavioral assessment methods, including daily food records, compliance declines over time as the novelty of the measurement wanes (7). Whether a similar trend occurs with free-living device-based measurements of physical behavior is currently not well characterized. If daily wear time wanes during a free-living assessment, less data would be available at the end of the assessment period than at the beginning, which may result in biased estimates of physical behavior and could have important implications for analyses of 24-hour activity cycles and circadian rhythmicity, such as day-to-day variability and “social jetlag” (8, 9), as well as measures of behavioral frequency. Furthermore, an increase in data loss over time may also affect studies with longitudinal outcomes over a single continuous assessment, including interventions and clinical trials interested in correlating or controlling for intra-individual changes in physical behavior between treatments, particularly if the protocol requires a longer assessment (e.g., > 7 days) or is limited to a small sample size.
Reliable estimates of free-living physical behaviors require participants to wear their devices as instructed. Since some non-compliance to wear instructions is anticipated, only participants exceeding some minimum wear criteria, such as ≥10 hrs·day−1 of waking wear for ≥4 days, are typically included in analyses to improve the reliability of these estimates (1). However, most current minimum wear standards treat nonwear events as temporally random and it is not common to report whether the participants who exceed them have more “invalid” days at the end rather than the beginning of their assessment. Thus, it is difficult to assess how application of commonly used minimum wear criteria could potentially affect data loss over time due to nonrandom nonwear behavior.
Prior research has also demonstrated that the number of days required to achieve stable and reliable estimates of habitual physical behaviors varies by outcome and age group (12–16). For example, stable estimates of physical activity measures typically require 3–5 days for adults (17) and 4–9 days for children (17) although this is further contingent on the specific physical activity outcome of interest (12–16). However, estimates of sleep duration are shown to require aggregates of 3 nights for older adults (18) but ≥ 7 nights for adults (19) and adolescents and children (20) to achieve stability. Methods used to determine the number of days required for stable estimates of a particular parameter generally assume that day-to-day variability is random over time and largely driven by variation in the measured behavior rather than missing data due to non-wear. A nonrandom increase in nonwear over the course of an assessment may disrupt these assumptions. Further, identifying whether a nonrandom decline in wear compliance over time varies by sub-population, including age-group or gender, or by time of day, (e.g., less wear at night as an assessment progresses) may help inform corrective steps for statistical techniques and/or protocol alterations to mitigate such data loss and improve the stability of estimates of various physical behaviors in future studies.
The objective of this study was to identify whether “wear fatigue”, defined as a day-to-day reduction in accelerometer wear time or rate of change in daily wear behavior, occurs over the 7-day free-living accelerometer measurement by examining daily variations in compliance rates in a representative sample of U.S. adults and youth. We also examined whether wear fatigue varied by age, sex, or time of day to better characterize if patterns of nonwear behavior might affect sub-populations or outcome metrics differently.
METHODS
We present analyses of the device-based physical behavior monitoring component from two population-representative datasets of U.S. youth and adults from the NHANES 2003–2006 and the 2011–2014 cycles. The 2011–2014 cycle was the primary focus, since the 7-day continuous 24-hr wear protocol on the non-dominant wrist is most applicable to current study designs.
2011–2014 NHANES Non-Dominant Wrist Data – Data Collection and Scoring
Data presented as the primary outcome in this paper were collected as part of the Physical Activity Monitoring (PAM) component of the 2011–2012 (PAXHR_G.xpt & PAXDAY_G.xpt) and 2013–2014 (PAXHR_H.xpt & PAXDAY_H.xpt) NHANES cycles and are freely and openly available from the Centers for Disease Control (CDC) site through the National Center for Health Statistics (NCHS; https://wwwn.cdc.gov/nchs/nhanes/) (21). A total of 14,693 individuals across the 2011–2012 NHANES (n = 6,917) and 2013–2014 NHANES (n = 7,776) were given a triaxial ActiGraph GT3X+ (NEO) PAM and asked to wear the device on their non-dominant wrist, using a removable Velcro strap, continuously (“all day, every day”) for seven consecutive days, even while bathing and sleeping (22). Since children < 6 years old were not measured in the 2011–2012 cycle, we also excluded children < 6 years old from the 2013–2014 NHANES cycle to align the sample age ranges. Participants were provided written instructions with pre-filled dates (including day of the week) indicating when to wear, remove, and return the device using a pre-paid envelope (22). Participants were compensated $40 upon return of their device which may have incentivized compliance to instructions, although compensation was not contingent on the quality or completeness of the data (22).
Raw triaxial ActiGraph GT3X+ (NEO serial numbers) data were collected continuously at 80 Hz with Idle Sleep Mode (ISM) enabled. ISM is a power and memory sparing feature that engages when the device is static and the variability in acceleration in each axis remains below ±40 milli-g’s for ≥10 seconds (23). Thus, ISM results in gaps in the recorded acceleration time series which are later commonly imputed with the last acceleration value recorded (i.e., last value carried forward) prior to ISM engaging. A three-step, open-source algorithm (24) was used to classify each minute of PAM data as nonwear, sleep wear, wake wear, or unknown. The algorithmically scored wear classifications were applied prior to the NCHS data release, with greater detail on how the algorithm handled ISM and made predictions of the target classes provided elsewhere (24).
Day-level data reported in the PAXDAY files included total minutes of data per day per individual (PAXTMD). Partial recordings from the days the device was distributed (day 0) and collected (day 8) were excluded from the presented analysis. Only participants with seven complete days of recorded data (1440 mins) on days 1 through 7, regardless of wear compliance, were included in the current analysis to best understand the influence of wear behavior across the assessment period. The total wear time for each day is the sum of the waking wear time (PAXWWMD) and sleeping wear time (PAXSWMD). Similarly, the total wear minutes for each hour of each day were aggregated from the waking (PAXWWMH) and sleeping wear minutes (PAXSWMH) of each hour found in the PAXHR files. Unknown minutes (Mean ± SE; 52.0 ± 0.3 min·day−1) were not included in the presented analyses as they could not be accounted for as wear or nonwear.
2003–2006 NHANES Hip Data – Data Collection and Scoring
Data presented as a secondary outcome in this paper were collected as part of the PAM component of the 2003–2004 (PAXRAW_C.xpt) and 2005–2006 (PAXRAW_D.xpt) NHANES cycles and are freely and openly available from the Centers for Disease Control (CDC) site through the National Center for Health Statistics (NCHS; https://wwwn.cdc.gov/nchs/nhanes/) (21). A total of 14,631 individuals across the 2003–2004 NHANES (n = 7,176) and 2005–2006 NHANES (n = 7,455) were given a uniaxial ActiGraph 7164 PAM and provided written, dated instructions to wear the device on their right hip during waking time for seven consecutive days following their physical examination visit and to remove it while swimming, bathing, or sleeping. The device was attached using a removable elastic belt (25). As in the 2011–2014 cycles, participants were instructed to return the device using a pre-paid envelope (25).
Data were collected as activity counts in 60-second epochs and scored for wear time with rnhanesdata (version 1.02) (26). Any period ≥60 consecutive minutes of zero counts, with a 1–2-minute allowance of < 100 counts·min−1, was considered nonwear. All other minutes were considered wear (1, 26). All minutes of wear from midnight until 23:59 the next day were summed to get daily wear (1). The devices were programmed to start recording at midnight on the first day and end at midnight on the last day, so there were no partial days of recording.
Statistical Analysis
All statistical analyses and figure creation were done in R (version 4.1.2). Age was collected as a continuous variable in each wave of NHANES and, for the purpose of the presented analyses, was re-coded into the following age group categories: children (6 through <12 years), adolescents (≥12 through <18 years), adults (≥18 through 60 years), and older adults (≥60 year). As suggested by the NHANES documentation for complex survey weighting, to appropriately account for pooling two or more cycles, the sample weights (WTMEC2YR) from the 2011–2012 and 2013–2014 were averaged to create a new weighting variable (WTMEC4YR) spanning both survey cycles (27). Sample weights for the 2003–2004 and 2005–2006 cycles were averaged in the same fashion. Complex survey weighted means and standard errors (SE) were computed for each day of assessment and each day of the week for all participants and by age group and sex for the 2003–2006 hip and the 2011–2014 wrist datasets (survey, version 4.1.1). Daily mean wear time, a continuous variable, was compared using analysis of variance (ANOVA) with pairwise comparisons for day of assessment and day of the week, both ordinal variables, and unpaired comparisons for the categorical variables age group and sex and their respective interactions. Generalized linear models (GLM), accounting for complex survey design, were fit to the obtain the trends for mean daily wear time versus day of assessment for all participants and for interactions by age group and sex. For the GLM analyses, assessment days were zero-indexed (i.e., assigned values 0 to 6) such that y-intercepts correspond to the first assessment day. However, they are referred to as assessment day 1 to 7 throughout the manuscript. Estimated marginal means with paired contrasts corrected with Tukey’s method for multiple comparisons were used to determine differences between daily mean wear time and the trends of the estimated marginal means were used to determine whether slopes differed significantly from one another (emmeans version 1.8.2).
The following statistical analyses apply to the 2011–2014 wrist data only. A one-way random effect model was run to obtain the intraclass correlation and determine the stability (28) of total wear minutes over the multiple days of the week (irr, version 0.84.1). Subsequently, a Spearman-Brown prophecy analysis was run on the ICC for daily wear time to obtain reliability estimates (CTT, version 2.3.3). Separately, additional generalized linear models were fit to obtain the trends for mean daily wear time to examine the potential effects of the starting day of the week for the assessment. Hour-level data were plotted as heatmaps to illustrate the pattern of wear fatigue over each day of assessment. Hourly wear time was averaged for each quadrant of the day (00:00–05:59 Early Morning, 06:00–11:59 Late Morning, 12:00–17:59 Afternoon, 18:00–23:59 Evening) for each assessment day. Additionally, a survey weighted generalized linear model was used to obtain the trends for mean hourly wear time for each quadrant of the day versus day of assessment for all participants and for interactions by age group.
RESULTS
Wear fatigue in the NHANES 2011–2014 cycles
Characteristics of participants included in the final analytic sample are presented in Table 1. Overall mean wear time was (Mean ± SE) 1248 ± 3.6 min·day−1 for all participants (Table 1). There was a significant main effect for day of assessment resulting in a decrease in mean wear time, over the seven-day continuous measurement period for all participants (β ± SE; −18.1 ± 0.7 min·day−1, p < 0.001, Figure 1A). This resulted in over two hours less data on average per participant on the final full day of the assessment compared to the first full day of the assessment. The intraclass correlation for consistency in total wear minutes per day was r = 0.65 (95% CI: 0.64–0.66, p < 0.001). Spearman-Brown prophecy analysis suggests the stability of accelerometer wear time was moderate and two consecutive days of accelerometry are needed to increase the stability to approximately 0.8 (Supplemental Table 1, Supplemental Digital Content).
Table 1.
Descriptive data of the mean wear time for the analytic samples from the 2003–2006 NHANES hip data and the 2011–2014 NHANES wrist data.
| 2011–2014 NHANES Cycles | 2003–2006 NHANES Cycles | ||||
|---|---|---|---|---|---|
| Grouping Variable | Group | N (%) | Wear Time (Mean ± SE, mins·day−1) | N (%) | Wear Time (Mean ± SE, mins·day−1) |
| Overall | All Participants | 13,649 (100%) | 1248 ± 3.6 | 13,639 (100%) | 693 ± 3.3 |
| Age Group | Children [<12y] | 2,206 (16.2%) | 1278 ± 6.9 | 1,810 (13.3%) | 657 ± 7.5 |
| Adolescents [≥12y, < 18y] | 1,725 (12.6%) | 1184 ± 9.3 | 2,862 (20.9%) | 620 ± 6.2 | |
| Adults [≥18y, < 60y] | 6,754 (49.5%) | 1229 ± 5.5 | 6,258 (45.9%) | 680 ± 3.9 | |
| Older Adults [≥60y] | 2,964 (21.7%) | 1317 ± 5.0 | 2,709 (19.9%) | 797 ± 6.4 | |
| Sex | Females | 7,004 (51.3%) | 1254 ± 4.8 | 7,020 (51.5%) | 683 ± 3.8 |
| Males | 6,645 (48.7%) | 1241 ± 5.1 | 6,619 (48.5%) | 703 ± 4.7 | |
| Age Group by Sex | Female Children | 1,087 (49.3%) | 1275 ± 11.2 | 938 (51.8%) | 654 ± 8.3 |
| Male Children | 1,119 (50.7%) | 1281 ± 12.2 | 872 (48.2%) | 660 ± 10.9 | |
| Female Adolescents | 853 (49.4%) | 1193 ± 13.1 | 1,394 (48.7%) | 614 ± 8.8 | |
| Male Adolescents | 872 (50.6%) | 1174 ± 15.0 | 1,468 (51.3%) | 624 ± 7.4 | |
| Female Adults | 3,536 (52.4%) | 1235 ± 7.0 | 3,339 (53.4%) | 666 ± 4.7 | |
| Male Adults | 3,218 (47.6%) | 1223 ± 7.1 | 2,919 (46.6%) | 694 ± 5.7 | |
| Female Older Adults | 1,528 (51.6%) | 1319 ± 5.9 | 1,349 (49.8%) | 784 ± 6.3 | |
| Male Older Adults | 1,436 (48.4%) | 1313 ± 7.1 | 1,360 (50.2%) | 813 ± 8.7 | |
| Day of Assessment | Day 1 | 13,649 (100%) | 1295 ± 3.2 | 13,639 (100%) | 749 ± 5.1 |
| Day 2 | 13,649 (100%) | 1281 ± 3.9 | 13,639 (100%) | 737 ± 3.5 | |
| Day 3 | 13,649 (100%) | 1267 ± 3.9 | 13,639 (100%) | 719 ± 4.1 | |
| Day 4 | 13,649 (100%) | 1254 ± 3.8 | 13,639 (100%) | 708 ± 4.6 | |
| Day 5 | 13,649 (100%) | 1241 ± 4.2 | 13,639 (100%) | 686 ± 4.1 | |
| Day 6 | 13,649 (100%) | 1227 ± 4.5 | 13,639 (100%) | 653 ± 4.2 | |
| Day 7 | 13,649 (100%) | 1170 ± 5.3 | 13,639 (100%) | 597 ± 4.9 | |
| Day of the Week | Sunday | 13,649 (100%) | 1225 ± 5.1 | 13,639 (100%) | 617 ± 4.6 |
| Monday | 13,649 (100%) | 1257 ± 4.3 | 13,639 (100%) | 717 ± 4.1 | |
| Tuesday | 13,649 (100%) | 1270 ± 4.1 | 13,639 (100%) | 733 ± 3.6 | |
| Wednesday | 13,649 (100%) | 1263 ± 4.0 | 13,639 (100%) | 724 ± 4.2 | |
| Thursday | 13,649 (100%) | 1254 ± 3.5 | 13,639 (100%) | 716 ± 4.6 | |
| Friday | 13,649 (100%) | 1248 ± 4.0 | 13,639 (100%) | 708 ± 3.8 | |
| Saturday | 13,649 (100%) | 1219 ± 4.9 | 13,639 (100%) | 634 ± 4.8 | |
Wear time data are weighted means and standard errors accounting for the NHANES complex survey design
Figure 1.

Wear fatigue for A) all participants in the 2011–2014 NHANES cycles (N = 13,649) and by age group across the seven-day assessment period and B) all individuals with invalid weekly wear (≥ 4 days with ≥ 10 hrs·day−1, n = 12,868).
The effect of age on wear fatigue.
Across the seven-day assessment period, there was a significant main effect for mean wear time by age group (p < 0.001) and a significant interaction effect for age group by day of assessment (p < 0.01, Table 1), with older adults having the highest (Mean ± SE; 1317 ± 5.0 min·day−1) and adolescents having the lowest (1184 ± 9.3 min·day−1) mean wear time. Wear fatigue was also different by age group. Adolescents had the greatest wear fatigue (β ± SE; −26.8 ± 2.4 min·day−1, Figure 1A), which was significantly higher than adults and older adults (p’s < 0.05) but not significantly different from children (p = 0.08). Older adults had the lowest wear fatigue (β ± SE; −9.3 ± 0.9 min·day−1, Figure 1A), which was significantly lower than all other age groups (p’s < 0.003).
The effect of sex on wear fatigue.
Overall, there was no significant main effect for sex on wear fatigue (Mean ± SE; females = −18.0 ± 0.8, males = −18.2 ± 1.0, p = 0.89) or mean wear time (females = 1254 ± 4.8 min·day−1, males = 1241 ± 5.1 min·day−1, p = 0.07). Additionally, there was also no significant interaction between sex and age on mean wear time or wear fatigue for the 2011–2014 wrist data (p ≥ 0.73).
The effect of minimum wear time criteria on wear fatigue.
Historically, data collected using a waist-worn device frequently excluded participants with too few days of wear time above a pre-specified threshold, such as ≥ 10 waking hrs·day−1 for at least four days of a seven-day assessment (1). To demonstrate the potential impact of minimum wear time thresholds, we compared the wear fatigue from the subset of participants who met this frequently used wear time criteria (n=12,868, 94.3% of participants) to that of all participants. Overall, implementing the minimum wear time criteria reduced wear fatigue to (β ± SE) −5.3 ± 0.4 min·day−1, a 70.8% reduction (Δ−12.8 min·day−1 if all participants were included), meaning that the decline in wear time from day 1 to day 7 was now only 31.8 minutes total, 76.8 minutes less than if all participants were included (Figures 1B and 2A). However, the subset of participants who met the minimum wear criteria still had some invalid days (<10 hours·day−1 wear time), and they were more likely to occur at the end of the assessment than at the beginning (Figure 2B) – evidence that, while considerably dampened, wear fatigue persisted. Minimum wear time criteria also reduced wear fatigue over all age groups (Table 2). Adolescents had the highest percentage that did not meet weekly wear criteria (9.6%, n=166). Of those who met the minimum wear criteria, invalid days were again more likely to occur at the end of the week than the beginning – with 154 (9.9% of remaining adolescents) with invalid data on day 7 compared to 14 (0.9% of remaining adolescents) with invalid data on day 1. Adolescents also saw the greatest change in wear fatigue when the minimum valid day criteria were applied, with a 21.3 min·day−1 (79.6%) reduction (Table 2). Older adults saw the least change in wear fatigue (5.1 min·day−1, 54.8%). Despite the small change in wear fatigue, however, older adults who met the minimum weekly wear criteria also had fewer invalid days on the first day (n = 11 or 0.4%) compared to the final day of assessment (n = 117 or 4.0%).
Figure 2.

Effect of applying minimum wear criteria on wear fatigue and analytic sample size. A) Applying minimum wear thresholds mitigates wear fatigue at the cost of analytic sample size. B) Compliant individuals by minimum wear criteria (≥4 days) still provide invalid days of wear skewed disproportionately towards the end of the assessment period.
Table 2:
Contributors to wear fatigue in the 2011–2014 NHANES wrist data include those providing zero minutes of wear time and those providing an invalid day of wear based on minimum wear time criteria of ≤ 10, 12, 16, 18, and 21 hrs·day−1 for ≥4 days.
| Zero minutes wear time | ||||||||||
|---|---|---|---|---|---|---|---|---|---|---|
| N | Group | Day 1 | Day 2 | Day 3 | Day 4 | Day 5 | Day 6 | Day 7 | β ± SE | Δ (%) |
| 2,206 | Children | 17 (0.77%) | 35 (1.59%) | 50 (2.27%) | 62 (2.81%) | 66 (2.99%) | 91 (4.13%) | 102 (4.62%) | −11.2 ± 1.3 | −7.1 (38.8%) |
| 1,725 | Adolescents | 19 (1.10%) | 43 (2.49%) | 77 (4.46%) | 82 (4.75%) | 94 (5.45%) | 115 (6.67%) | 118 (6.84%) | −14.4 ± 1.6 | −12.4 (46.3%) |
| 6,754 | Adults | 83 (1.23%) | 129 (1.91%) | 181 (2.68%) | 259 (3.83%) | 300 (4.44%) | 334 (4.95%) | 387 (5.73%) | −11.5 ± 0.6 | −8.4 (42.2%) |
| 2,964 | Older Adults | 21 (0.71%) | 32 (1.08%) | 40 (1.35%) | 36 (1.21%) | 47 (1.59%) | 47 (1.59%) | 63 (2.13%) | −6.9 ± 0.7 | −2.4 (25.9%) |
| 13649 | Total | 140 (1.03%) | 239 (1.75%) | 348 (2.55%) | 439 (3.22%) | 507 (3.71%) | 587 (4.30%) | 670 (4.91%) | -10.7 ± 0.5 | -7.4 (41.0%) |
| Minimum Wear Criteria | ||||||||||
| Invalid Wear Days (≤10hrs·day−1) | ||||||||||
| N (%) | Group | Day 1 | Day 2 | Day 3 | Day 4 | Day 5 | Day 6 | Day 7 | β ± SE | Δ (%) |
| 2,103 (95.3%) | Children | 21 (1.00%) | 24 (1.14%) | 33 (1.57%) | 39 (1.85%) | 59 (2.81%) | 82 (3.90%) | 162 (7.70%) | −3.5 ± 0.8 | −14.8 (80.9%) |
| 1,559 (90.4%) | Adolescents | 14 (0.90%) | 35 (2.25%) | 59 (3.78%) | 53 (3.40%) | 78 (5.00%) | 111 (7.12%) | 154 (9.88%) | −5.5 ± 1.3 | −21.3 (79.5%) |
| 6,305 (93.4%) | Adults | 76 (1.21%) | 101 (1.60%) | 113 (1.79%) | 155 (2.46%) | 194 (3.08%) | 271 (4.30%) | 508 (8.06%) | −6.0 ± 0.5 | −13.9 (69.8%) |
| 2,901 (97.9%) | Older Adults | 11 (0.38%) | 10 (0.34%) | 18 (0.62%) | 19 (0.65%) | 23 (0.79%) | 43 (1.48%) | 117 (4.03%) | −4.2 ± 0.6 | −5.1 (54.9%) |
| 12,868 (94.3%) | Total | 122 (0.95%) | 170 (1.32%) | 223 (1.73%) | 266 (2.07%) | 354 (2.75%) | 507 (3.94%) | 941 (7.31%) | -5.3 ± 0.4 | -12.8 (70.8%) |
| Invalid Wear Days (≤12hrs·day−1) | ||||||||||
| N (%) | Group | Day 1 | Day 2 | Day 3 | Day 4 | Day 5 | Day 6 | Day 7 | β ± SE | Δ (%) |
| 2,079 (94.2%) | Children | 32 (1.54%) | 32 (1.54%) | 36 (1.73%) | 40 (1.92%) | 66 (3.17%) | 89 (4.28%) | 174 (8.37%) | −3.2 ± 0.6 | −15.1 (82.5%) |
| 1,534 (88.9%) | Adolescents | 22 (1.43%) | 39 (2.54%) | 55 (3.59%) | 52 (3.39%) | 87 (5.67%) | 116 (7.56%) | 179 (11.67%) | −3.8 ± 1.1 | −23.0 (85.8%) |
| 6,188 (91.6%) | Adults | 92 (1.49%) | 121 (1.96%) | 130 (2.10%) | 176 (2.84%) | 203 (3.28%) | 314 (5.07%) | 570 (9.21%) | −4.7 ± 0.4 | −15.2 (76.4%) |
| 2,891 (97.5%) | Older Adults | 15 (0.52%) | 15 (0.52%) | 22 (0.76%) | 30 (1.04%) | 32 (1.11%) | 50 (1.73%) | 141 (4.88%) | −3.3 ± 0.5 | −6.0 (64.6%) |
| 12,692 (93.0%) | Total | 161 (1.27%) | 207 (1.63%) | 243 (1.91%) | 298 (2.35%) | 388 (3.06%) | 569 (4.48%) | 1064 (8.38%) | -4.2 ± 0.3 | -13.9 (76.8%) |
| Invalid Wear Days (≤16hrs·day−1) | ||||||||||
| N (%) | Group | Day 1 | Day 2 | Day 3 | Day 4 | Day 5 | Day 6 | Day 7 | β ± SE | Δ (%) |
| 1,999 (90.6%) | Children | 30 (1.50%) | 40 (2.00%) | 37 (1.85%) | 45 (2.25%) | 64 (3.2%) | 98 (4.9%) | 193 (9.65%) | −2.2 ± 0.3 | −16.1 (88%) |
| 1,438 (83.4%) | Adolescents | 32 (2.23%) | 46 (3.20%) | 60 (4.17%) | 63 (4.38%) | 85 (5.91%) | 112 (7.79%) | 195 (13.56%) | −2.8 ± 0.6 | −24.0 (89.6%) |
| 5,870 (86.9%) | Adults | 161 (2.74%) | 155 (2.64%) | 193 (3.29%) | 230 (3.92%) | 275 (4.68%) | 390 (6.64%) | 710 (12.10%) | −2.4 ± 0.3 | −17.5 (87.9%) |
| 2,846 (96.0%) | Older Adults | 39 (1.37%) | 23 (0.81%) | 30 (1.05%) | 36 (1.26%) | 41 (1.44%) | 68 (2.39%) | 212 (7.45%) | −1.2 ± 0.3 | −8.1 (87.1%) |
| 12,153 (89.0%) | Total | 262 (2.16%) | 264 (2.17%) | 320 (2.63%) | 374 (3.08%) | 465 (3.83%) | 668 (5.50%) | 1310 (10.78%) | -2.1 ± 0.2 | -16.0 (88.4%) |
| Invalid Wear Days (≤18hrs·day−1) | ||||||||||
| N (%) | Group | Day 1 | Day 2 | Day 3 | Day 4 | Day 5 | Day 6 | Day 7 | β ± SE | Δ (%) |
| 1,974 (89.5%) | Children | 39 (1.98%) | 47 (2.38%) | 51 (2.58%) | 55 (2.79%) | 75 (3.8%) | 110 (5.57%) | 207 (10.49%) | −1.7 ± 0.3 | −16.6 (90.7%) |
| 1,397 (81.0%) | Adolescents | 39 (2.79%) | 51 (3.65%) | 58 (4.15%) | 70 (5.01%) | 89 (6.37%) | 111 (7.95%) | 210 (15.03%) | −1.5 ± 0.4 | −25.3 (94.4%) |
| 5,723 (84.7%) | Adults | 202 (3.53%) | 182 (3.18%) | 217 (3.79%) | 248 (4.33%) | 305 (5.33%) | 406 (7.09%) | 819 (14.31%) | −1.4 ± 0.2 | −18.5 (93.0%) |
| 2,821 (95.2%) | Older Adults | 59 (2.09%) | 40 (1.42%) | 34 (1.21%) | 44 (1.56%) | 51 (1.81%) | 78 (2.76%) | 257 (9.11%) | −0.6 ± 0.2 | −8.7 (93.6%) |
| 11,915 (87.3%) | Total | 339 (2.85%) | 320 (2.69%) | 360 (3.02%) | 417 (3.50%) | 520 (4.36%) | 705 (5.92%) | 1493 (12.53%) | -1.3 ± 0.1 | -16.8 (92.8%) |
| Invalid Wear Days (≤21hrs·day−1) | ||||||||||
| N (%) | Group | Day 1 | Day 2 | Day 3 | Day 4 | Day 5 | Day 6 | Day 7 | β ± SE | Δ (%) |
| 1,937 (87.8%) | Children | 59 (3.05%) | 59 (3.05%) | 63 (3.25%) | 63 (3.25%) | 91 (4.70%) | 124 (6.4%) | 285 (14.71%) | −0.6 ± 0.1 | −17.7 (96.7%) |
| 1,359 (78.8%) | Adolescents | 59 (4.34%) | 68 (5.00%) | 86 (6.33%) | 88 (6.48%) | 112 (8.24%) | 134 (9.86%) | 254 (18.69%) | −0.6 ± 0.2 | −26.2 (97.8%) |
| 5,542 (82.1%) | Adults | 282 (5.09%) | 261 (4.71%) | 271 (4.89%) | 285 (5.14%) | 375 (6.77%) | 472 (8.52%) | 996 (17.97%) | −0.5 ± 0.1 | −19.4 (97.5%) |
| 2,779 (93.8%) | Older Adults | 99 (3.56%) | 73 (2.63%) | 69 (2.48%) | 95 (3.42%) | 93 (3.35%) | 130 (4.68%) | 331 (11.91%) | −0.4 ± 0.1 | −8.9 (95.7%) |
| 11,617 (85.1%) | Total | 499 (4.30%) | 461 (3.97%) | 489 (4.21%) | 531 (4.57%) | 671 (5.78%) | 860 (7.40%) | 1866 (16.06%) | -0.5 ± 0.1 | -17.6 (97.2%) |
As a sensitivity test, we also applied various wear criteria that may better align with a 24-hour wear protocol including 12, 16, 18, and 21 hrs·day−1, all with a minimum of 4 days above the threshold. As expected, increasing the minimum wear threshold reduced wear fatigue but also reduced the useable sample size for analysis (Figure 2A, Table 2). However, as with the >10 hrs·day−1 threshold, in the subset that met the criteria, invalid days were still more likely to occur at the end of the measurement than at the beginning (Figure 2B, Table 2). For example, implementing a 16 hrs·day−1 threshold reduced the sample by 1,496 individuals (11.0%), but in the remaining participants 2.2% had an invalid day on day 1 compared to 10.8% with an invalid day on day 7, yielding a mean wear fatigue (β ± SE) of −2.1 ± 0.2 min·day−1, a −16.0 min·day−1 (88.4%) reduction compared to all participants (Figure 2, Table 2). Similarly, the 21 hrs·day−1 threshold reduced the sample by 2,032 individuals (14.9%), with 4.3% of the remaining sample contributing an invalid day on day 1 and 16.1% contributing an invalid day on day 7, yielding a mean wear fatigue (β ± SE) of −0.5 ± 0.1 min·day−1, a −17.6 min·day−1 (97.2%) reduction compared to all participants (Figure 2, Table 2). These findings demonstrate that implementing more rigorous minimum wear criteria can substantively mitigate wear fatigue at the cost of analysis sample size (Figure 2, Table 2). The tradeoff of potential accuracy at the expense of included participants is likely less impactful to cross-sectional analyses of large samples (e.g., population-level) compared to detection of within-individual changes in smaller samples.
Time of day.
We observed different patterns of mean wear time and wear fatigue by time of day. The nocturnal quadrants in the early morning (00:00–06:00) and evening (18:00–00:00) had lower mean wear time than quadrants of typical waking hours in the late morning (06:00–12:00) and afternoon (12:00–18:00). Early morning had the lowest wear time (Mean ± SE; 52.7 ± 0.2 min·hr−1, Figure 3, Table 3), but also the lowest wear fatigue (β ± SE; −3.8 ± 0.19 min·day−1, Table 4), suggesting early morning wear was low across the entire assessment period. The evening quadrant had the second lowest mean wear time (51.3 ± 0.2 min·hr−1, Table 3) but also the greatest wear fatigue of all quadrants (β ± SE; −5.7 ± 0.20 min·day−1, Table 4) resulting in approximately 1.6% less wear in the evening quadrant day over day. Mean wear time was highest and wear fatigue was intermediate and comparable in the late morning (Mean ± SE; 53.9 ± 0.1 min·hr−1; β ± SE; −4.2 ± 0.21 min·day−1, Tables 3 and 4) and afternoon quadrants (Mean ± SE; 54.2 ± 0.1 min·hr−1; β ± SE; −4.7 ± 0.21 min·day−1, Tables 3 and 4), indicating higher compliance and a more stable pattern of wear during waking hours (06:00–18:00). This temporal pattern was largely consistent across age groups. However, similar to whole-day trends, nonwear and wear fatigue was most pronounced in adolescents and the least noticeable in older adults in each quadrant (Figure 3, Tables 3 and 4).
Figure 3.
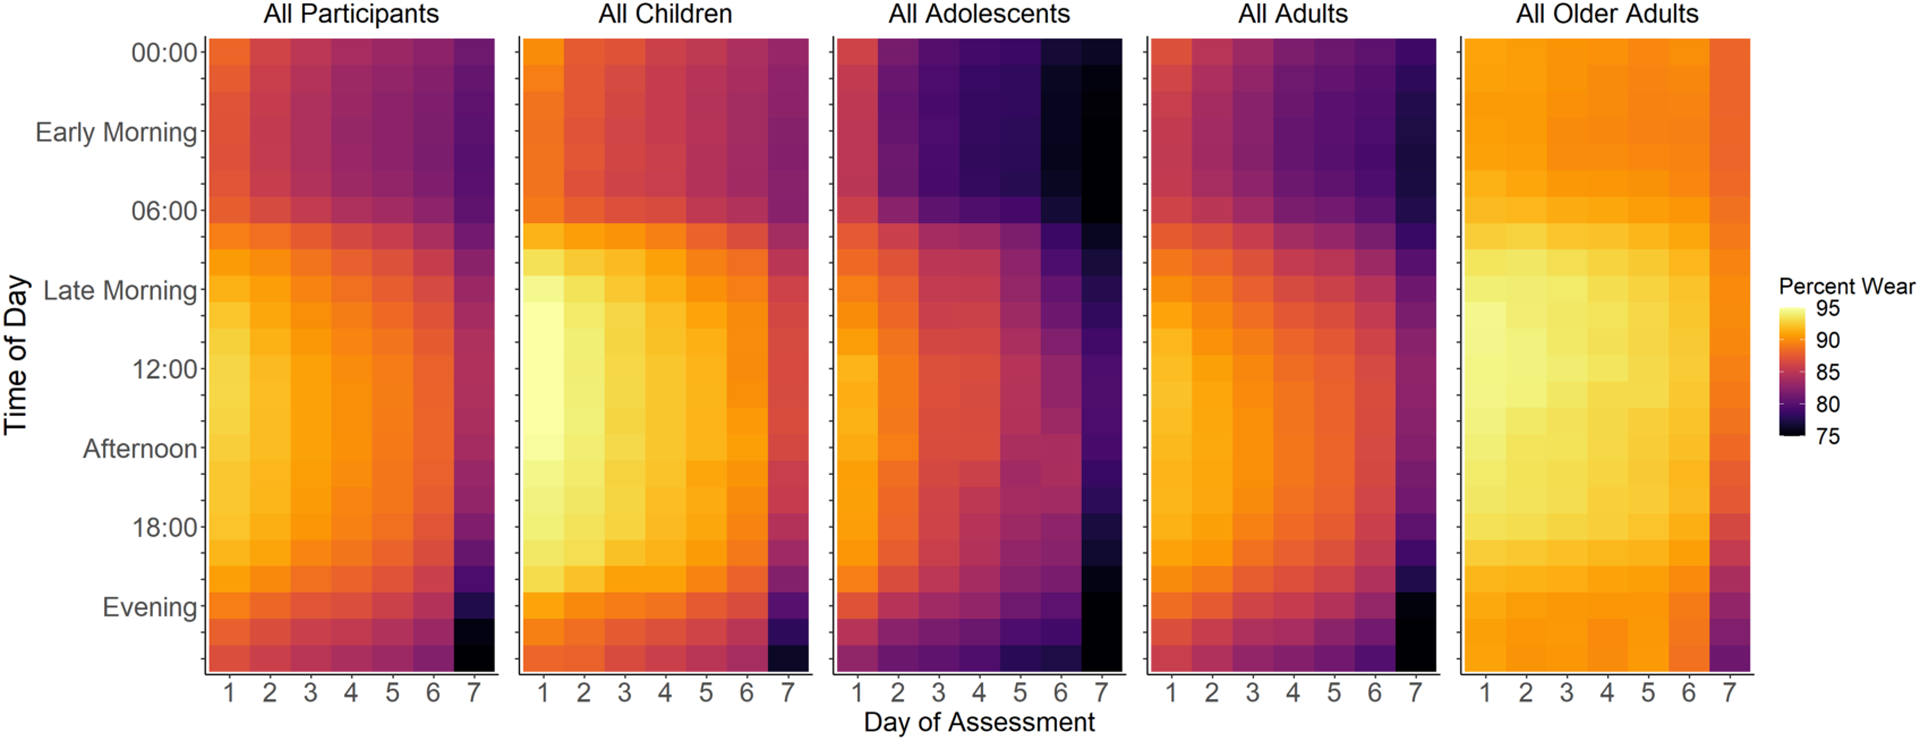
Hourly heatmaps illustrating the temporal patterns of wear fatigue for all individuals in the 2011–2014 NHANES cycles with seven complete days of recorded data, regardless of wear time, and by age group across the seven-day assessment period.
Table 3.
Mean (± SE) hourly wear time by quadrant of the day for all participants in the 2011–2014 NHANES cycles with seven days of recorded data, regardless of wear time, and by age group across the seven-day assessment period and summarized by time of week (weekdays versus weekends).
| Day of Assessment | Time of Week | ||||||||||
|---|---|---|---|---|---|---|---|---|---|---|---|
| Day 1 | Day 2 | Day 3 | Day 4 | Day 5 | Day 6 | Day 7 | Mean | Weekday | Weekend | ||
| All Participants | Early Morning (00:00 – 05:59) | 52.7 ± 0.2 | 51.5 ±0.3 | 50.8 ± 0.3 | 50.5 ± 0.3 | 50.0 ± 0.2 | 49.3 ± 0.3 | 48.5 ± 0.2 | 50.5 ± 0.2 | 50.8 ± 0.2 | 49.7 ± 0.2 |
| Late Morning (06:00 – 11:59) | 55.2 ± 0.2 | 54.7 ± 0.2 | 53.9 ± 0.2 | 53.8 ± 0.2 | 52.9 ± 0.2 | 52.1 ± 0.2 | 50.2 ± 0.2 | 53.3 ± 0.1 | 53.9 ± 0.1 | 51.7 ± 0.2 | |
| Afternoon (12:00 – 17:59) | 55.8 ± 0.1 | 55.1 ± 0.1 | 54.6 ± 0.2 | 54.2 ± 0.1 | 53.5 ± 0.2 | 53.0 ± 0.2 | 50.0 ± 0.3 | 53.7 ± 0.1 | 54.2 ± 0.1 | 52.6 ± 0.2 | |
| Evening (18:00 – 23:59) | 53.6 ± 0.2 | 52.7 ± 0.2 | 52.6 ± 0.2 | 51.9 ± 0.1 | 51.4 ± 0.2 | 50.8 ± 0.2 | 46.3 ± 0.4 | 51.3 ± 0.2 | 51.8 ± 0.1 | 50.1 ± 0.3 | |
| Quadrant of the Day | Day 1 | Day 2 | Day 3 | Day 4 | Day 5 | Day 6 | Day 7 | Mean | Weekday | Weekend | |
| Children | Early Morning (00:00 – 05:59) | 53.1 ± 0.4 | 52.0 ± 0.5 | 51.8 ± 0.4 | 51.2 ± 0.5 | 50.8 ± 0.4 | 50.4 ± 0.6 | 49.2 ± 0.5 | 51.2 ± 0.4 | 51.5 ± 0.4 | 50.7 ± 0.5 |
| Late Morning (06:00 – 11:59) | 56.5 ± 0.3 | 55.7 ± 0.4 | 55.5 ± 0.3 | 55.0 ± 0.4 | 54.4 ± 0.4 | 53.4 ± 0.6 | 51.2 ± 0.4 | 54.5 ± 0.3 | 55.2 ± 0.3 | 52.8 ± 0.4 | |
| Afternoon (12:00 – 17:59) | 56.9 ± 0.3 | 56.3 ± 0.3 | 56.0 ± 0.3 | 55.7 ± 0.4 | 55.1 ± 0.4 | 54.1 ± 0.4 | 51.0 ± 0.6 | 55.0 ± 0.3 | 55.6 ± 0.3 | 53.6 ± 0.4 | |
| Evening (18:00 – 23:59) | 54.4 ± 0.4 | 54.0 ± 0.4 | 53.5 ± 0.4 | 53.3 ± 0.4 | 52.8 ± 0.5 | 51.6 ± 0.5 | 47.4 ± 0.6 | 52.4 ± 0.3 | 53.0 ± 0.3 | 51.1 ± 0.5 | |
| Quadrant of the Day | Day 1 | Day 2 | Day 3 | Day 4 | Day 5 | Day 6 | Day 7 | Mean | Weekday | Weekend | |
| Adolescents | Early Morning (00:00 – 05:59) | 51.2 ± 0.5 | 48.5 ± 0.6 | 47.5 ± 0.8 | 47.5 ± 0.7 | 46.9 ± 0.6 | 45.2 ± 0.9 | 44.5 ± 0.6 | 47.3 ± 0.5 | 47.8 ± 0.5 | 46.0 ± 0.7 |
| Late Morning (06:00 – 11:59) | 53.7 ± 0.5 | 52.8 ± 0.4 | 50.9 ± 0.5 | 51.5 ± 0.4 | 49.8 ± 0.7 | 48.2 ± 0.7 | 46.1 ± 0.7 | 50.4 ± 0.4 | 51.5 ± 0.4 | 47.7 ± 0.7 | |
| Afternoon (12:00 – 17:59) | 54.6 ± 0.3 | 52.9 ± 0.4 | 52.0 ± 0.4 | 51.5 ± 0.4 | 50.3 ± 0.5 | 50.2 ± 0.6 | 46.5 ± 0.8 | 51.1 ± 0.3 | 51.8 ± 0.3 | 49.4 ± 0.6 | |
| Evening (18:00 – 23:59) | 52.0 ± 0.5 | 50.1 ± 0.7 | 50.6 ± 0.4 | 49.0 ± 0.5 | 48.0 ± 0.6 | 47.8 ± 0.6 | 42.7 ± 1.0 | 48.6 ± 0.4 | 49.3 ± 0.4 | 46.8 ± 0.7 | |
| Quadrant of the Day | Day 1 | Day 2 | Day 3 | Day 4 | Day 5 | Day 6 | Day 7 | Mean | Weekday | Weekend | |
| Adults | Early Morning (00:00 – 05:59) | 51.6 ± 0.3 | 50.7 ± 0.3 | 49.9 ± 0.3 | 48.8 ± 0.3 | 48.4 ± 0.3 | 48.0 ± 0.3 | 47.0 ± 0.4 | 49.2 ± 0.3 | 49.6 ± 0.3 | 48.2 ± 0.3 |
| Late Morning (06:00 – 11:59) | 54.1 ± 0.2 | 53.8 ± 0.2 | 53.1 ± 0.2 | 52.3 ± 0.3 | 51.8 ± 0.3 | 51.3 ± 0.3 | 49.2 ± 0.3 | 52.2 ± 0.2 | 52.8 ± 0.2 | 50.7 ± 0.3 | |
| Afternoon (12:00 – 17:59) | 55.1 ± 0.2 | 54.8 ± 0.2 | 54.2 ± 0.2 | 53.5 ± 0.2 | 53.1 ± 0.3 | 52.2 ± 0.3 | 49.4 ± 0.3 | 53.2 ± 0.2 | 53.6 ± 0.2 | 52.0 ± 0.3 | |
| Evening (18:00 – 23:59) | 53.0 ± 0.3 | 52.4 ± 0.3 | 51.5 ± 0.2 | 51.1 ± 0.3 | 50.5 ± 0.3 | 49.9 ± 0.3 | 45.2 ± 0.4 | 50.5 ± 0.2 | 51.0 ± 0.2 | 49.3 ± 0.3 | |
| Quadrant of the Day | Day 1 | Day 2 | Day 3 | Day 4 | Day 5 | Day 6 | Day 7 | Mean | Weekday | Weekend | |
| Older Adults | Early Morning (00:00 – 05:59) | 54.8 ± 0.3 | 54.7 ± 0.3 | 54.1 ± 0.5 | 54.3 ± 0.3 | 53.9 ± 0.4 | 53.6 ± 0.4 | 53.4 ± 0.4 | 54.1 ± 0.3 | 54.2 ± 0.3 | 53.8 ± 0.4 |
| Late Morning (06:00 – 11:59) | 56.6 ± 0.2 | 56.5 ± 0.2 | 56.3 ± 0.2 | 56.3 ± 0.2 | 55.7 ± 0.3 | 55.4 ± 0.3 | 54.2 ± 0.3 | 55.9 ± 0.2 | 56.0 ± 0.2 | 55.6 ± 0.2 | |
| Afternoon (12:00 – 17:59) | 56.6 ± 0.2 | 56.3 ± 0.2 | 56.3 ±0.2 | 56.0 ± 0.2 | 55.7 ± 0.3 | 55.5 ± 0.2 | 53.1 ± 0.4 | 55.6 ± 0.2 | 55.8 ± 0.2 | 55.2 ± 0.2 | |
| Evening (18:00 – 23:59) | 54.9 ± 0.2 | 54.4 ± 0.3 | 54.7 ± 0.2 | 54.2 ± 0.3 | 54.3 ± 0.3 | 53.9 ± 0.3 | 50.1 ± 0.5 | 53.8 ± 0.2 | 54.0 ± 0.2 | 53.3 ± 0.3 | |
Table 4.
Wear fatigue by quadrant of the day (Mean ± SE min·day−1) for all participants in the 2011–2014 NHANES cycles with seven days of recorded data, regardless of wear time, and by age group across the seven-day assessment period.
| Quadrant of the Day | All Participants | Children | Adolescents | Adults | Older Adults | |
|---|---|---|---|---|---|---|
| All Days | Early Morning (00:00 – 05:59) | −3.8 ± 0.19 | −3.4 ± 0.51 | −5.9 ± 0.68 | −4.4 ± 0.26 | −1.4 ± 0.32 |
| Late Morning (06:00 – 11:59) | −4.2 ± 0.21 | −4.7 ± 0.56 | −7.0 ± 0.62 | −4.5 ± 0.27 | −2.1 ± 0.29 | |
| Afternoon (12:00 – 17:59) | −4.7 ± 0.21 | −4.9 ± 0.59 | −6.7 ± 0.68 | −5.0 ± 0.27 | −2.7 ± 0.27 | |
| Evening (18:00 – 23:59) | −5.7 ± 0.20 | −5.7 ± 0.61 | −7.5 ± 0.86 | −6.3 ± 0.22 | −3.4 ± 0.34 |
Wear fatigue in the NHANES 2003–2006 cycles
To demonstrate that the wear fatigue observed in 2011–2014 NHANES PAM data was not entirely dependent on attachment site, wear protocol, or wear-scoring algorithm, we also explored data from the hip-worn, wake time only PAM component of the NHANES 2003–2006 cycle with wear scored using the method described by Troiano (1). In the 2003–2006 NHANES dataset, overall mean wear time was (Mean ± SE) 693 ± 3.3 min·day−1 for all participants (N = 13,639, Table 1). There was a significant main effect for day of assessment, resulting in a decrease in mean wear time over the seven-day continuous measurement period for all participants (β ± SE; −23.5 ± 0.7 min·day−1, p < 0.001, Figure 4A), which corroborates results of the 2011–2014 cycle.
Figure 4.

NHANES 2003–2006 wear data shown for A) all participants with 7 days of recorded data (N = 13,639) and B) for all participants and participant age groups after applying minimum wear criteria of ≥4 days with ≥10 hrs·day−1 (N = 10,112).
Using the 2003–2006 hip data, we also observed a significant main effect for mean wear time by age group (p < 0.001) and a significant interaction effect for age group by day of assessment (p < 0.001), with older adults having the highest (797 ± 6.4 min·day−1, Table 1) and adolescents (Mean ± SE; 620 ± 6.2 min·day−1, Table 1) having the lowest mean wear time. Similar to the 2011–2014 wrist data, wear fatigue also differed by age group for the 2003–2006 hip data with adolescents having the greatest wear fatigue (β ± SE; −33.2 ± 1.5 min·day−1, Figure 4) which was significantly different from adults and older adults (p’s < 0.001) but not children (p = 0.06) and older adults having the least wear fatigue (β ± SE; −10.2 ± 1.2 min·day−1, Figure 4) which was again significantly lower than all other age groups (p’s < 0.001).
There was no significant main effect for sex on wear fatigue (females = −23.5 ± 1.0 min·day−1, males = −23.4 ± 0.9 min·day−1, p = 0.95) for the 2003–2004 hip data, however, there was a significant main effect for sex on mean wear time (females = 683 ± 4.7 min·day−1, males = 703 ± 3.8 min·day−1, p = 0.001, Table 1). Additionally, there was also no significant interaction between sex and age on mean wear time or wear fatigue for the 2003–2006 hip data (p’s ≥ 0.22). Collectively, these results suggest that wear fatigue and wear trends by age are reproducible and do not depend solely on attachment site, wear protocol, or wear-scoring algorithm.
As with the 2011–2014 wrist data, we compared wear fatigue from the subset of participants who met the frequently used minimum wear time criteria of ≥ 10 hrs·day−1 for at least four days (n=10,112, 74.1% of participants) to that of all participants. Implementing the minimum wear time criteria reduced wear fatigue to (β ± SE) −18.7 ± 0.7 min·day−1, a 20.4% reduction (Δ−4.8 min·day−1 compared to all participants). The decline in wear time from day 1 to day 7 was 112.2 minutes total, 28.8 minutes less than if all participants were included after implementing the wear time threshold (Figure 4).
The remainder of the results explores additional contributors to wear behavior using wrist data from the NHANES 2011–2014 cycles only.
Additional contributors to wear fatigue
Assessment initiation and completion on weekdays versus weekends.
Daily mean wear time was significantly lower on weekend days (Mean ± SE; 1222 ± 4.8 min·day−1) compared to weekdays (1258 ± 3.5 min·day−1, p < 0.001), which aligns with prior research (29). We also found that wear fatigue was significantly higher for participants ending on a weekend compared to a weekday (β ± SE; −21.8 ± 1.1 min·day−1 vs. −15.0 ± 0.8 min·day−1, p < 0.001), but weekly mean wear time did not differ (Mean ± SE; 1244 ± 6.13 min·day−1 for weekend completion vs. 1251 ± 5.0 min·day−1 weekday completion, p = 0.46). Participants ending their assessment on Sunday had the greatest wear fatigue (n = 3,424 or 25.1%, β ± SE; −24.4 ± 1.6 min·day−1). However, nearly half of the sample (n = 6,549, 48.0%) were given their device on a Saturday or Sunday (day 0) and subsequently completed their seven-day assessment on a Saturday or Sunday (day 7). Thus, it is unclear whether the lower weekend wear time resulted from a deviation in behavior or schedule on the weekend or was a consequence of reduced compliance from wear fatigue on the later days of the assessment window.
Zero-wear contributors.
Along with the general decline in wear time over the assessment period, we also saw a day-to-day increase in total daily non-compliance (i.e., zero minutes of daily wear time), from 140 participants (1.0%) on day 1 to 670 participants (4.9%) on day 7 (Supplemental Figure 1 and Table 2, Supplemental Digital Content), with a low prevalence of individuals contributing all seven days with zero wear minutes (n = 45, 0.3%). We explored the impact of total daily non-compliance to wear fatigue by comparing the subset of participants with at least one minute of wear time for each of the seven assessment days (n=12,508, 85.1% of all participants) to all participants. We found that those with at least one minute of wear on each day had 7.4 min·day−1 (41.0%) less wear fatigue compared with over all participants (β ± SE; −10.7 ± 0.5 vs. −18.1 ± 0.7 min·day−1), reducing the day 1 to day 7 decline by 44.4 minutes (Supplemental Figure 1, Supplemental Digital Content). We also observed that when analysis was limited to those with at least one minute of wear per day, wear fatigue decreased in all age groups. The greatest reduction to wear fatigue (12.4 min·day−1 or 46.3%) occurred in adolescents, which was not surprising since they had the highest relative number of participants with zero wear time days, which span from 1.1% of adolescents (n = 19) on day 1 up to 6.8% of adolescents (n = 387) on day 7 (Table 2). Conversely, older adults saw the smallest reduction in wear fatigue (2.4 min·day−1, 25.9%) and had the fewest relative participants with zero-minute wear days – from 0.7% of older adults (n = 21) on day 1 to 2.1% of older adults (n = 63) on day 7 (Table 2).
Interpretation of Wear Instructions.
We observed that the drop in wear time from the penultimate to final day of assessment (i.e., day 6 to 7) was notably larger than those between earlier consecutive assessment days (Figure 1). This pattern suggests that, despite being provided wear instructions with the date and day of the week for removal, at least some participants may have misinterpreted when to discontinue wearing the device and removed it after completing day 6 rather than day 7. The large decrease in wear time from day 6 to 7 could have affected our estimate of the wear fatigue slope. Using only the first six days for the analysis, overall wear fatigue was reduced by 4.6 min·day−1 (25.4%, Supplemental Figure 2, Supplemental Digital Content). Eliminating the seventh assessment day also reduced wear fatigue for all age groups, with older adults seeing the greatest relative change in slope of 4.1 min·day−1 (44.1%), which is largely attributable to older adults having higher mean wear time and lower wear fatigue across all other days of the assessment period compared to other age groups. However, the absolute decrease in mean wear time from day 6 to 7 was similar for all age groups, ranging from 49 minutes for older adults to 61 minutes for adults, indicating all groups were affected similarly by possible misinterpretation of instructions.
DISCUSSION
Using a large data set collected from U.S. participants with a broad age range, we identified a systematic near-linear decrease in the overall mean device wear time of ~9% and ~16% over a 7-day free-living assessment for the 2011–2014 wrist and the 2003–2006 hip data, respectively. The rate and pattern of the daily wear reduction was greatest in adolescents, least for older adults and did not vary by sex. Scored non-wear occurred mostly at night but wear fatigue was observed in all quadrants of the day, suggesting it more likely results from behavior than algorithmic or device performance limitations. Applying minimum wear criteria,, a standard practice for physical activity outcomes, particularly in cross-sectional analyses of larger cohorts, mitigates wear fatigue at the cost of analytic sample size. Together, these data suggest that wear fatigue does occur in objective, device-based measurement of physical behavior and varies according to age group and time of day, which may inform statistical corrections for analysis and/or future protocol changes to improve collection methods to maximize wear time.
Our findings suggest that the consequences of wear fatigue, and strategies to combat it, are likely dependent on targeted outcomes, experimental design, assessment duration, and age group of interest. Clinical trials and interventional studies, for instance, are often designed to detect or control for within subject differences in physical behaviors over time, frequently longer than a week. Such interventional studies, where accelerometry-based metrics are employed as a marker of functional status in recovery from a clinical procedure (30, 31) or as a proxy for activity-related energy expenditure in studies of energy balance where diet or exercise is manipulated (32, 33), often require longer or more frequent assessments to achieve meaningful changes. Continued improvements to battery life and memory have made these longer assessments with accelerometers more feasible. However, given that we observed measurable wear fatigue at only seven days, it is a concern that the impact on longer continuous assessment periods may be more substantial. While the daily figures for wear fatigue (−18.1 min·day−1 for the wrist and −23.5 mins·day−1 for the hip) seem trivial relative to the 1440 minutes in a day, the >2 hrs decline in wear time over the week may have practical implications for analyses. This includes studies of the 24-hr activity cycle where accumulating missing data due to nonwear may become an issue. While a 7-day wear protocol is a general field standard, wear fatigue of the observed magnitude may be particularly problematic for studies lasting multiple weeks if the decline in wear time continues in a linear fashion. Interventional studies also often consist of smaller samples dictated by burdensome clinical outcomes, rigorous protocols, or rare disease populations (12, 14, 15). Compared to studies of larger samples with broader inclusion criteria and cross-sectional outcomes, wear compliance and consistency are likely more important for these smaller, more intensive studies, and the presence of wear-fatigue, which results in a non-random data loss over time, may have greater impact on the sensitivity to detect within-individual changes to physical behavior.
In studies of larger sample sizes and cross-sectional outcomes, for example in population-level surveillance such as NHANES wear fatigue on the order of approximately −20 mins·day−1, though statistically significant, may have limited practical impact on estimates of physical behavior computed from data aggregated over the assessment period and/or entire sample to a single point estimate. We also demonstrated that by applying minimum wear time criteria, a practice common in analyses of larger data sets from wearable sensors, the magnitude of wear fatigue can be substantively reduced, particularly for data collected with a wrist-worn device. We observed a meaningful reduction in wear fatigue by applying a basic 10 hrs·day−1 on ≥4 days minimum wear criteria which reduced group-level wear fatigue to ~5 mins·day−1 or a half hour per week. Applying the same minimum wear criteria to the hip-worn data also reduced wear fatigue but to a lesser extent, and there was still an approximately 2-hour difference in mean wear time between the first and last days of the assessment period for participants exceeding the criteria. More stringent wear time criteria further curbed the effect of wear fatigue – from a 70.8% reduction at a 10 hr·day−1 threshold to a 97.2% reduction for a 21 hrs·day−1 threshold when compared to the wear fatigue observed in the full sample. However, attenuation to wear fatigue comes at a cost of reduction to analytic sample size (−5.7% at 10 hrs·day−1 to −14.9% at 21 hrs·day−1), which is likely less impactful for initial samples >10,000 than for those with <100 participants. Furthermore, analyses of the sub-population remaining after application of minimum wear-time criteria tend to exclude invalid days where participants did not meet the minimum wear threshold, which are still skewed towards the end of the assessment. These trends again suggest greater impact in studies with smaller samples and longitudinal outcomes compared to population-level averages, however additional study is required to determine what extent this non-random data loss over time may have on estimates of physical behavior and approaches to impute missing data (34–36).
Concern for the presence of wear fatigue, and nonrandom variations in wear over the assessment period, likely also depends on the outcomes of interest. In the continuous wrist wear during the 2011–2014 NHANES cycle, we observed greater scored nonwear during typical sleeping hours and the highest wear fatigue in the evening, when individuals are less likely to be active compared to the middle of the day (37). These trends suggest potentially greater impact of nonwear and wear fatigue to metrics of sleep or circadian variation than to analyses of waking behaviors alone. For instance, prior research suggests that sleep metrics, specifically (19) indices of sleep variability (18), require more valid days of data to achieve stable estimates than measures of physical activity (12–17). Disproportionate data loss at night from nonwear or wear fatigue may further increase the minimum assessment duration needed to achieve stability in these measures. Similarly, our observations also suggest that greater nonwear on weekends versus weekdays may contribute to a need for longer assessment periods for parameters such as social jet lag – the difference between the mid-point of sleep on the weekend and weekdays (38, 39). In general, parameters aiming to quantify trends over time, for instance measures of behavior frequency (e.g., days taking ≥8000 steps) or circadian metrics (e.g., interdaily stability, intradaily variability, sleep regularity), may be more affected by a nonrandom increase in data loss with time.
It is unclear whether disproportionate nocturnal nonwear stems from purposeful device removal due to discomfort during sleep or from algorithmic misclassification of periods of inactivity or sleep as nonwear, since the sleep, wake, and nonwear (SWaN) algorithm used on the 2011–2014 NHANES wrist data has not yet been independently validated (24). Most existing scoring methods were developed using minute-level activity count data (1, 40–44) and function by identifying a single behavior (nonwear, sleep, or wake-wear) over windows ≥60 minutes which may leave them susceptible to error and misidentification when used with 24-hr data containing all behaviors (45–48). Some improvement has been made to these count-based, single behavior methods by utilizing raw acceleration data in shorter windows and in two stages to account for more than one behavior (49–51). Nevertheless, misidentification of sleep or sedentary time as nonwear and contrariwise remains a noted issue, particularly if the only information available for classification is movement data from a single attachment site (24, 51–53). ISM is believed to engage more frequently and for longer periods during low movement periods, including overnight during plausible sleep, which may increase the likelihood of misclassifying wear time during sleep as nonwear (24). However, the SWaN algorithm specifically attempted to address limitations caused by ISM during development and was applied to all these data uniformly (24). Thus, if a majority of nonwear minutes were explained solely by algorithmic bias, one would expect a more consistent pattern of nonwear across the assessment during times traditionally associated with limited movement when ISM engagement was more likely, which occur mostly at night. Instead, we observed an increase in nonwear over the week during all hours of the day but particularly in the evening, suggesting that if low-movement periods of wear were misclassified, this was not the only source of the disproportionate nonwear at night. Conversely, if the reduction in wear was due only to total non-compliance (i.e., participants who stopped wearing the device completely) one would expect a more evenly distributed decline in wear time over all hours of the day, which also runs contrary to our observations. Further, the similar decline in wear time over the 2003–2006 NHANES assessments using a different ActiGraph device worn on the hip scored with a separate nonwear detection algorithm provides additional support to the findings from the 2011–2014 NHANES cycles. However, comparisons of wear time and wear-fatigue during the traditional sleep period between the different NHANES waves are not possible, since the 2003–2006 participants were instructed to remove their device before going to sleep.
Both mean wear time and wear fatigue varied substantially by age group, which may have implications for analyses comparing physical behavior estimates across age, including cross-sectional population-based studies and longitudinal studies spanning a broad age range. As noted in a prior analysis of the 2003–2006 NHANES data (1), we found that adolescents had the lowest mean wear time while older adults had the highest. Perhaps not surprisingly, wear fatigue followed a similar trend by age group, suggesting a curvilinear pattern in compliance from childhood through older adulthood, with a nadir in adolescence. As a sensitivity analysis, we divided continuous age into eight groups by decade to look at wear time and wear fatigue over the lifespan more closely in the 2011–2014 NHANES wrist data (Supplemental Table 2, Supplemental Digital Content). As with the broad age group categories presented in the main analysis, there is a curvilinear pattern to wear fatigue across the lifespan -increasing from −18.9 ± 2.6 mins·day−1 in <10-year-olds to 26.0 ± 1.8 mins·day−1 in 20–30-year-olds and gradually declining in each successive decade of life reaching a low of −7.0 ± 0.9 mins·day−1 after age 70. Mean wear time over the 7-day assessment period mirrored this trend. Conversely, we saw no sex difference in wear fatigue or mean wear time. Together, these trends suggest a more systematic difference in wear by age but limited practical difference in compliance by sex.
This study has limitations. In the 2011–2014 NHANES analysis, nonwear detection by the SWaN algorithm was most prominent at night, during the probable sleep period, where low movement or sleep is most likely to be misclassified as nonwear. Whether the disproportionate detected non-wear at night accurately reflects behavior or represents periods of misclassified low-movement wear, the problem remains the same - it reduces confidence in the reliability of sleep parameter estimates (16). Although the SWaN algorithm developers have demonstrated that their algorithm performs similarly to or better than several popular nonwear and sleep detection methods, both training and validation datasets were comprised of several disparate datasets, each with small sample sizes (<31 participants) of healthy, young participants (mean ages 18.8–23.8y) (24). Additionally, data from a variety of activity monitors (Axivity, ActiGraph GT9X and GT3X+) were used and the target classes within the datasets were unbalanced and blended from multiple sources to achieve a training dataset with all three labeled behavior classes (sleep wear, wake wear, and nonwear) (24). Thus, additional independent validation of the SWaN algorithm against ground-truth observation of all classified behaviors (wake wear, sleep wear, and non-wear) in a single dataset collected in a broader population would likely enable a better definition of confidence limits surrounding our observations of non-wear and wear fatigue. Furthermore, a more detailed evaluation of the SWaN algorithm may also provide some insight into the approximately 3.5% of minutes scored as “unknown” that could not be adjudicated as wear or non-wear. Prior research has demonstrated a small, but detectable, reactivity bias for device-based studies of physical behavior that may contribute to the observed wear fatigue (9, 54–56). Similarly, we cannot rule out that the large proportion (48.0%, 31.9% of older adults to 60.1% of adolescents) of individuals initiating and concluding their assessment on a weekend may also contribute to the rate of change in wear time over the assessment (29). While we observed a similar, statistically significant wear fatigue in two separate waves of the NHANES, the measurements were conducted on different participants in each wave, and, thus, cannot address how wear behavior, including wear fatigue, may change with repeated assessments of the same participants.
This study presents representative wear behavior for the U.S. population across a broad age range including two different commonly used device attachment sites. The comparable results between the 2003–2006 hip data and the 2011–2014 wrist data suggest this phenomenon is not unique to a specific sample population, device attachment site, scoring algorithm or wear protocol but rather appears to have a human behavioral component. Both 7-day hip and wrist wear protocols used by NHANES have been widely used which may allow for comparison to other national and international population-based studies using similar protocols. Such analyses may inform whether nonwear behavior, and strategies to combat it, vary according to national or cultural attitudes toward research participation. As demonstrated in the analysis of the 2011–2014 NHANES participants, despite being provided explicitly dated wear instructions, our finding of a larger decline in wear time from assessment day six to seven, which was consistent across age groups, suggests an apparent shared confusion about instructions on when to terminate wear. Future study is needed to determine whether instructing participants to wear devices for more days than needed can increase the number of participants with sufficient data for planned analyses or stable physical behavior estimates. Alternatively, the degree to which electronic reminders and newer cloud-based systems with near real-time monitoring can improve compliance and mitigate wear fatigue should be evaluated Advances in sensor technology and incorporation of sensors with modalities other than movement, including heart rate (57, 58) and/or skin temperature (52, 59) may improve differentiation of nonwear, sleep, and sedentary behavior, allowing a more complete characterization of wear behavior in the future.
CONCLUSIONS
In conclusion, we discovered a statistically significant wear fatigue in the overall NHANES 2003–2006 hip (−23.5 min·day−1), and 2011–2014 wrist data (−18.1 min·day−1) irrespective of minimum wear time, and that age, time of day, and days of the week were associated with wear behavior. As wearable devices become more regularly integrated in clinical research where sample sizes are typically small, the effects of wear fatigue may be more impactful on detecting intra-individual change in response to an intervention or treatment exposure. In studies of adolescent populations, or where sleep or the 24h activity cycle are primary outcomes, periodic reminders may be needed to minimize wear fatigue and maintain high compliance. Lastly, further research is needed to determine if the magnitude, pattern, and/or effects of wear fatigue differ in longer observational studies, interventional studies, or for other countries or cultures.
Supplementary Material
SUPPLEMENTAL DIGITAL CONTENT
SDC 1:Supplemental Digital Content.docx
Acknowledgements
This research was supported by the Intramural Research Program of the NIH, The National Institute of Diabetes Digestive and Kidney Diseases (NIDDK), and The National Cancer Institute (NCI). This study did not receive any outside funding or support. Thank you to all of the NHANES participants who have participated in the NHANES data collection. Thank you to the NCHS and all of the contributors who made this effort possible and these data available for public use. Thank you to Joshua R. Freeman, PhD for his insights and contributions to this manuscript. The authors declare no conflicts of interest. The results of the study are presented clearly, honestly, and without fabrication, falsification, or inappropriate data manipulation. The results of the present study do not constitute endorsement by the American College of Sports Medicine.
Conflict of Interest and Funding Source:
This study did not receive any outside funding or support. The authors declare no conflicts of interest. The results of the study are presented clearly, honestly, and without fabrication, falsification, or inappropriate data manipulation. The results of the present study do not constitute endorsement by the American College of Sports Medicine.
REFERENCES
- 1.Troiano RP, Berrigan D, Dodd KW, Masse LC, Tilert T, McDowell M. Physical activity in the United States measured by accelerometer. Med Sci Sports Exerc. 2008;40(1):181–8. [DOI] [PubMed] [Google Scholar]
- 2.Troiano RP, McClain JJ, Brychta RJ, Chen KY. Evolution of accelerometer methods for physical activity research. Br J Sports Med. 2014;48(13):1019–23. [DOI] [PMC free article] [PubMed] [Google Scholar]
- 3.Rosenberger ME, Fulton JE, Buman MP, et al. The 24-hour activity cycle: a new paradigm for physical activity. Med Sci Sports Exerc. 2019;51(3):454–64. [DOI] [PMC free article] [PubMed] [Google Scholar]
- 4.Ross R, Chaput JP, Giangregorio LM, et al. Canadian 24-hour movement guidelines for adults aged 18–64 years and adults aged 65 years or older: an integration of physical activity, sedentary behaviour, and sleep. Appl Physiol Nutr Metab. 2020;45(10 (Suppl. 2)):S57–102. [DOI] [PubMed] [Google Scholar]
- 5.Tremblay MS. Introducing 24-hour movement guidelines for the early years: a new paradigm gaining momentum. J Phys Act Health. 2020;17(1):92–5. [DOI] [PubMed] [Google Scholar]
- 6.Tremblay MS, Carson V, Chaput J-P, et al. Canadian 24-Hour Movement Guidelines for Children and Youth: an integration of physical activity, sedentary behaviour, and sleep. Appl Physiol Nutr Metab. 2016;41(6 (Suppl. 3)):iii–iv. [DOI] [PubMed] [Google Scholar]
- 7.Gersovitz M, Madden JP, Smiciklas-Wright H. Validity of the 24-hr. dietary recall and seven-day record for group comparisons. J Am Diet Assoc. 1978;73(1):48–55. [PubMed] [Google Scholar]
- 8.Roenneberg T, Allebrandt KV, Merrow M, Vetter C. Social jetlag and obesity. Curr Biol. 2012;22(10):939–43. [DOI] [PubMed] [Google Scholar]
- 9.Baumann S, Groß S, Voigt L, et al. Pitfalls in accelerometer-based measurement of physical activity: The presence of reactivity in an adult population. Scand J Med Sci Sports. 2018;28(3):1056–63. [DOI] [PubMed] [Google Scholar]
- 10.Herrmann SD, Barreira TV, Kang M, Ainsworth BE. How many hours are enough? Accelerometer wear time may provide bias in daily activity estimates. J Phys Act Health. 2013;10(5):742–9. [DOI] [PubMed] [Google Scholar]
- 11.Herrmann SD, Barreira TV, Kang M, Ainsworth BE. Impact of accelerometer wear time on physical activity data: a NHANES semisimulation data approach. Br J Sports Med. 2014;48(3):278–82. [DOI] [PubMed] [Google Scholar]
- 12.Hilden P, Schwartz JE, Pascual C, Diaz KM, Goldsmith J. How many days are needed? Measurement reliability of wearable device data to assess physical activity. PLoS One. 2023;18(2):e0282162. [DOI] [PMC free article] [PubMed] [Google Scholar]
- 13.Jaeschke L, Steinbrecher A, Jeran S, Konigorski S, Pischon T. Variability and reliability study of overall physical activity and activity intensity levels using 24 h-accelerometry-assessed data. BMC Public Health. 2018;18(1):530. [DOI] [PMC free article] [PubMed] [Google Scholar]
- 14.Antczak D, Lonsdale C, Del Pozo Cruz B, Parker P, Sanders T. Reliability of GENEActiv accelerometers to estimate sleep, physical activity, and sedentary time in children. Int J Behav Nutr Phys Act. 2021;18(1):73. [DOI] [PMC free article] [PubMed] [Google Scholar]
- 15.Dillon CB, Fitzgerald AP, Kearney PM, et al. Number of days required to estimate habitual activity using wrist-worn GENEActiv accelerometer: a cross-sectional study. PLoS One. 2016;11(5):e0109913. [DOI] [PMC free article] [PubMed] [Google Scholar]
- 16.Fekedulegn D, Andrew ME, Shi M, Violanti JM, Knox S, Innes KE. Actigraphy-based assessment of sleep parameters. Ann Work Expo Health. 2020;64(4):350–67. [DOI] [PMC free article] [PubMed] [Google Scholar]
- 17.Ricardo LIC, Wendt A, Galliano LM, et al. Number of days required to estimate physical activity constructs objectively measured in different age groups: findings from three Brazilian (Pelotas) population-based birth cohorts. PLoS One. 2020;15(1):e0216017. [DOI] [PMC free article] [PubMed] [Google Scholar]
- 18.Rowe M, McCrae C, Campbell J, et al. Actigraphy in older adults: comparison of means and variability of three different aggregates of measurement. Behav Sleep Med. 2008;6(2):127–45. [DOI] [PubMed] [Google Scholar]
- 19.Aili K, Åström-Paulsson S, Stoetzer U, Svartengren M, Hillert L. Reliability of actigraphy and subjective sleep measurements in adults: the design of sleep assessments. J Clin Sleep Med. 2017;13(1):39–47. [DOI] [PMC free article] [PubMed] [Google Scholar]
- 20.Acebo C, Sadeh A, Seifer R, et al. Estimating sleep patterns with activity monitoring in children and adolescents: how many nights are necessary for reliable measures? Sleep. 1999;22(1):95–103. [DOI] [PubMed] [Google Scholar]
- 21.U.S. Department of Health and Human Services Centers for Disease Control and Prevention, National Center for Health Statistics. National Health and Nutrition Examination Survey - NHANES Questionnaires, Datasets, and Related Documentation. Available from: https://wwwn.cdc.gov/nchs/nhanes/.
- 22.U.S. Department of Health and Human Services Centers for Disease Control and Prevention, National Health and Nutrition Examination Survey (NHANES): Physical Activity Monitor Procedures Manual. [Procedures Manual]. 2012.
- 23.U.S. Department of Health and Human Services Centers for Disease Control and Prevention, National Center for Health Statistics. National Health and Nutrition Examination Survey - 2013–2014 Data Documentation, Codebook, and Frequencies - Physical Activity Monitor - Day (PAXDAY_H). 2020.
- 24.Thapa-Chhetry B, Arguello DJ, John D, Intille S. Detecting sleep and nonwear in 24-h wrist accelerometer data from the National Health and Nutrition Examination survey. Med Sci Sports Exerc. 2022;54(11):1936–46. [DOI] [PMC free article] [PubMed] [Google Scholar]
- 25.Belcher BR, Wolff-Hughes DL, Dooley EE, et al. US population-referenced percentiles for wrist-worn accelerometer-derived activity. Med Sci Sports Exerc. 2021;53(11):2455–64. [DOI] [PMC free article] [PubMed] [Google Scholar]
- 26.Leroux A, Di J, Smirnova E, McGuffey EJ, et al. Organizing and analyzing the activity data in NHANES. Stat Biosci. 2019;11(2):262–87. [DOI] [PMC free article] [PubMed] [Google Scholar]
- 27.Heeringa SG, West BT, Berglund PA. Applied Survey Data Analysis. CRC press; 2017. [Google Scholar]
- 28.Shrout PE, Fleiss JL. Intraclass correlations: uses in assessing rater reliability. Psychol Bull. 1979;86(2):420–8. [DOI] [PubMed] [Google Scholar]
- 29.To QG, Stanton R, Schoeppe S, Doering T, Vandelanotte C. Differences in physical activity between weekdays and weekend days among U.S. children and adults: cross-sectional analysis of NHANES 2011–2014 data. Prev Med Rep. 2022;28:101892. [DOI] [PMC free article] [PubMed] [Google Scholar]
- 30.Prescott S, Traynor JP, Shilliday I, Zanotto T, Rush R, Mercer TH. Minimum accelerometer wear-time for reliable estimates of physical activity and sedentary behaviour of people receiving haemodialysis. BMC Nephrol. 2020;21(1):230. [DOI] [PMC free article] [PubMed] [Google Scholar]
- 31.Snipelisky D, Kelly J, Levine JA, et al. Accelerometer-measured daily activity in heart failure with preserved ejection fraction: clinical correlates and association with standard heart failure severity indices. Circ Heart Fail. 2017;10(6):e003878. [DOI] [PMC free article] [PubMed] [Google Scholar]
- 32.Hall KD, Chen KY, Guo J, et al. Energy expenditure and body composition changes after an isocaloric ketogenic diet in overweight and obese men. Am J Clin Nutr. 2016;104(2):324–33. [DOI] [PMC free article] [PubMed] [Google Scholar]
- 33.Hall KD, Ayuketah A, Brychta R, et al. Ultra-processed diets cause excess calorie intake and weight gain: an inpatient randomized controlled trial of ad libitum food intake. Cell Metab. 2019;30(1):67–77.e3. [DOI] [PMC free article] [PubMed] [Google Scholar]
- 34.Catellier DJ, Hannan PJ, Murray DM, et al. Imputation of missing data when measuring physical activity by accelerometry. Med Sci Sports Exerc. 2005;37(11 Suppl):S555–62. [DOI] [PMC free article] [PubMed] [Google Scholar]
- 35.Tackney MS, Cook DG, Stahl D, Ismail K, Williamson E, Carpenter J. A framework for handling missing accelerometer outcome data in trials. Trials. 2021;22(1):379. [DOI] [PMC free article] [PubMed] [Google Scholar]
- 36.Yue Xu S, Nelson S, Kerr J, et al. Statistical approaches to account for missing values in accelerometer data: applications to modeling physical activity. Stat Methods Med Res. 2018;27(4):1168–86. [DOI] [PubMed] [Google Scholar]
- 37.Saint-Maurice PF, Berrigan D, Whitfield GP, et al. Amount, type, and timing of domain-specific moderate to vigorous physical activity among US adults. J Phys Act Health. 2021;18(S1):S114–22. [DOI] [PMC free article] [PubMed] [Google Scholar]
- 38.Roenneberg T How can social jetlag affect health? Nat Rev Endocrinol. 2023;19(7):383–4. [DOI] [PMC free article] [PubMed] [Google Scholar]
- 39.Wittmann M, Dinich J, Merrow M, Roenneberg T. Social jetlag: misalignment of biological and social time. Chronobiol Int. 2006;23(1–2):497–509. [DOI] [PubMed] [Google Scholar]
- 40.Cole RJ, Kripke DF, Gruen W, Mullaney DJ, Gillin JC. Automatic sleep/wake identification from wrist activity. Sleep. 1992;15(5):461–9. [DOI] [PubMed] [Google Scholar]
- 41.Sadeh A, Sharkey KM, Carskadon MA. Activity-based sleep-wake identification: an empirical test of methodological issues. Sleep. 1994;17(3):201–7. [DOI] [PubMed] [Google Scholar]
- 42.Tudor-Locke C, Barreira TV, Schuna JM Jr, Mire EF, Katzmarzyk PT. Fully automated waist-worn accelerometer algorithm for detecting children’s sleep-period time separate from 24-h physical activity or sedentary behaviors. Appl Physiol Nutr Metab. 2014;39(1):53–7. [DOI] [PubMed] [Google Scholar]
- 43.Choi L, Ward SC, Schnelle JF, Buchowski MS. Assessment of wear/nonwear time classification algorithms for triaxial accelerometer. Med Sci Sports Exerc. 2012;44(10):2009–16. [DOI] [PMC free article] [PubMed] [Google Scholar]
- 44.Choi L, Liu Z, Matthews CE, Buchowski MS. Validation of accelerometer wear and nonwear time classification algorithm. Med Sci Sports Exerc. 2011;43(2):357–64. [DOI] [PMC free article] [PubMed] [Google Scholar]
- 45.Jaeschke L, Luzak A, Steinbrecher A, et al. 24 h-accelerometry in epidemiological studies: automated detection of non-wear time in comparison to diary information. Sci Rep. 2017;7(1):2227. [DOI] [PMC free article] [PubMed] [Google Scholar]
- 46.McVeigh JA, Winkler EA, Healy GN, Slater J, Eastwood PR, Straker LM. Validity of an automated algorithm to identify waking and in-bed wear time in hip-worn accelerometer data collected with a 24 h wear protocol in young adults. Physiol Meas. 2016;37(10):1636–52. [DOI] [PubMed] [Google Scholar]
- 47.Winkler EA, Gardiner PA, Clark BK, Matthews CE, Owen N, Healy GN. Identifying sedentary time using automated estimates of accelerometer wear time. Br J Sports Med. 2012;46(6):436–42. [DOI] [PMC free article] [PubMed] [Google Scholar]
- 48.Moore HE IV, Haydel KF, Banda JA, Fiterau M, Desai M, Robinson TN. Potential corner case cautions regarding publicly available implementations of the National Cancer Institute’s nonwear/wear classification algorithm for accelerometer data. PLoS One. 2018;13(12):e0210006. [DOI] [PMC free article] [PubMed] [Google Scholar]
- 49.Pulakka A, Shiroma EJ, Harris TB, Pentti J, Vahtera J, Stenholm S. Classification and processing of 24-hour wrist accelerometer data. J Meas Phys Behav. 2018;1(2):51–9. [Google Scholar]
- 50.van Hees VT, Sabia S, Jones SE, et al. Estimating sleep parameters using an accelerometer without sleep diary. Sci Rep. 2018;8(1):12975. [DOI] [PMC free article] [PubMed] [Google Scholar]
- 51.Syed S, Morseth B, Hopstock LA, Horsch A. Evaluating the performance of raw and epoch non-wear algorithms using multiple accelerometers and electrocardiogram recordings. Sci Rep. 2020;10(1):5866. [DOI] [PMC free article] [PubMed] [Google Scholar]
- 52.Vert A, Weber KS, Thai V, et al. Detecting accelerometer non-wear periods using change in acceleration combined with rate-of-change in temperature. BMC Med Res Methodol. 2022;22(1):147. [DOI] [PMC free article] [PubMed] [Google Scholar]
- 53.Meredith-Jones K, Williams S, Galland B, Kennedy G, Taylor R. 24 h Accelerometry: impact of sleep-screening methods on estimates of sedentary behaviour and physical activity while awake. J Sports Sci. 2016;34(7):679–85. [DOI] [PubMed] [Google Scholar]
- 54.Dössegger A, Ruch N, Jimmy G, et al. Reactivity to accelerometer measurement of children and adolescents. Med Sci Sports Exerc. 2014;46(6):1140–6. [DOI] [PMC free article] [PubMed] [Google Scholar]
- 55.Ullrich A, Baumann S, Voigt L, John U, Ulbricht S. Measurement reactivity of accelerometer-based sedentary behavior and physical activity in 2 assessment periods. J Phys Act Health. 2021;18(2):185–91. [DOI] [PubMed] [Google Scholar]
- 56.Vanhelst J, Béghin L, Drumez E, Coopman S, Gottrand F. Awareness of wearing an accelerometer does not affect physical activity in youth. BMC Med Res Methodol. 2017;17(1):99. [DOI] [PMC free article] [PubMed] [Google Scholar]
- 57.Gorny AW, Liew SJ, Tan CS, Müller-Riemenschneider F. Fitbit Charge HR wireless heart rate monitor: validation study conducted under free-living conditions. JMIR Mhealth Uhealth. 2017;5(10):e157. [DOI] [PMC free article] [PubMed] [Google Scholar]
- 58.Claudel SE, Tamura K, Troendle J, et al. Comparing methods to identify wear-time intervals for physical activity with the Fitbit Charge 2. J Aging Phys Act. 2021;29(3):529–35. [DOI] [PMC free article] [PubMed] [Google Scholar]
- 59.Zhou S-M, Hill RA, Morgan K, et al. Classification of accelerometer wear and non-wear events in seconds for monitoring free-living physical activity. BMJ Open. 2015;5(5):e007447. [DOI] [PMC free article] [PubMed] [Google Scholar]
Associated Data
This section collects any data citations, data availability statements, or supplementary materials included in this article.
Supplementary Materials
SUPPLEMENTAL DIGITAL CONTENT
SDC 1:Supplemental Digital Content.docx