

Summary
Transcription factor combinations play a key role in shaping cellular identity. However, the precise relationship between specific combinations and downstream effects remains elusive. Here, we investigate this relationship within the context of the Drosophila eve locus, which is controlled by gap genes. We measure spatiotemporal levels of four gap genes in heterozygous and homozygous gap mutant embryos and correlate them with the striped eve activity pattern. While changes in gap gene expression extend beyond the manipulated gene, the spatial patterns of Eve expression closely mirror canonical activation levels in wild-type. Interestingly, some combinations deviate from the wild-type repertoire but still drive eve activation. While in homozygous mutants some Eve stripes exhibit partial penetrance, stripes consistently emerge at reproducible positions, even with varying gap gene levels. Our findings suggest a robust molecular canalization of cell fates in gap mutants and provide insights into the regulatory constraints governing multi-enhancer gene loci.
Graphical Abstract

INTODUCTION
The prevailing model of gene locus transcriptional activity suggests that the presence of specific transcription factor combinations in the nucleus determines locus activity 1–8. Distinct combinations of transcription factor concentrations can activate the same gene, potentially responding to a range of concentrations 2,5,9. However, the rules governing these combinations and their activity-promoting concentrations remain uncertain. How does the decision made by adjacent cells to switch between on/off activity states relate to the regulator’s concentration range? How responsive is a locus to novel combinations of regulator concentrations? In this study we explore these questions within a developmental context, manipulating the gap genes in the Drosophila embryo to subject the even-skipped (eve) gene locus to non-canonical combinations of regulator transcription factor expression levels.
The segmentation patterning program of the early Drosophila embryo serves as an ideal model for addressing quantitative questions related to transcriptional regulation during cellular identity formation 10. This program involves a feed-forward flow of information, starting with primary maternal morphogens that activate the interconnected gap gene network, which in turn drives expression of the pair-rule genes 11. These genes are expressed in precisely and reproducibly positioned stripes, forming the blueprint for the organism’s segmented body plan 12. For this program to result in a precise and reproducible outcome, individual cells need to take actions that are consistent with their spatial coordinates within the embryo. At each location along the anterior-posterior (AP) axis, gap gene expression levels contain enough information to determine position with a precision of ~1% egg length (EL), corresponding to the spatial extent of a single cell 13,14, which is also reflected in the spatial precision of the resulting pair-rule gene expression 5.
To decipher the regulatory code governing eve activity, we refer to the expression levels of the four major gap genes at each spatial position as a ‘code word’. The term stems from the intuition that the eve enhancers (encompassing binding sites for these regulators) decode this information and determine the corresponding activity level of the Eve gene. The code words measured at Eve stripe peaks can thus be thought of as permissive for the gene’s activity in a particular nucleus, versus the ones at troughs as non-permissive (corresponding to the characterized role of the gap genes as repressors 15–17.
Here, we present a comprehensive dataset that establishes the canonical code words for wild-type as well as heterozygous and homozygous gap gene mutants, shedding light on the dynamic range of gap gene expression levels that trigger eve activity. While mutants perturb expression profiles, they maintain similar variance and precision in gap gene expression levels and target gene positioning. Our findings reveal that network-induced changes in gap gene levels generally permit eve activation in mutants, albeit at displaced locations from wild-type Eve stripe positions. These positions, even in homozygous mutants with partial penetrance, are reproducible and precise. Homozygous mutants generate code words that can activate multiple distinct stripe enhancers, as suggested by integrating classic studies of reporter construct expression in mutant embryos 15,18–20. Principal component analysis helps identify key determinants for individual stripe positions and provides insights into altered patterns observed in mutant phenotypes.
RESULTS
Eve expression pattern in gap gene mutants is reproducible and precise
To functionally challenge eve locus responses, we alter the code word catalogue beyond its wild-type repertoire. The Drosophila model allows us to accomplish this genetically via null mutations in each of the four major gap genes (i.e., hunchback (hb), giant (gt), Kruppel (Kr), and knirps (kni)), whose AP patterns overlap nicely with the seven Eve stripes which we use as spatial cues for the locus read-out (Figure 1A). For each gap gene, we generate three classes of embryos by crossing heterozygous null mutant embryos with each other. According to the mendelian expectation, 25% of F1 embryos contain both gene copies (2x, the ones on the balancer chromosome, which we consider as a wild-type equivalent), half of all F1 embryos contain a single copy (1x, heterozygous mutant), and another 25% of F1 embryos contain no copy (0x, homozygous or null mutant) of the wild-type gap gene (Figure 1B & see Figure S1 for our sample size per genotype). For each gap gene mutation experiment we collect the F1 embryos consisting of these three genotypes and perform dual immuno-fluorescence labeling of Eve and the respective mutated gap gene. Each embryo was assigned a time stamp with an accuracy of ~1 minute from entry into nuclear cycle 14 (nc14) based on the extent of the progressing cellularization front 21. To optimally capture the information flow between the gap genes and eve, we focus on eve expression around 50 min into nc14, allowing an ~8 min delay from the time point where gap genes produce their maximal information 14, for changes in concentration of gap genes proteins to affect Eve levels 22. 2x, 1x, and 0x embryos are sorted based on a classification scheme that acts on gene expression profiles and the associated time stamp (see methods for details). After measuring Eve, we extract the locations of its maximal activity (peaks) and assess the mutant average displacement from wild-type locations, Δx, and the embryo-to-embryo variability of stripe location, (Figure 1C). We analyzed over 300 embryos (between 53–107 per experiment), fixed at 50±5 min into nc14.
Figure 1: Precise even-skipped patterning in gap gene mutants.
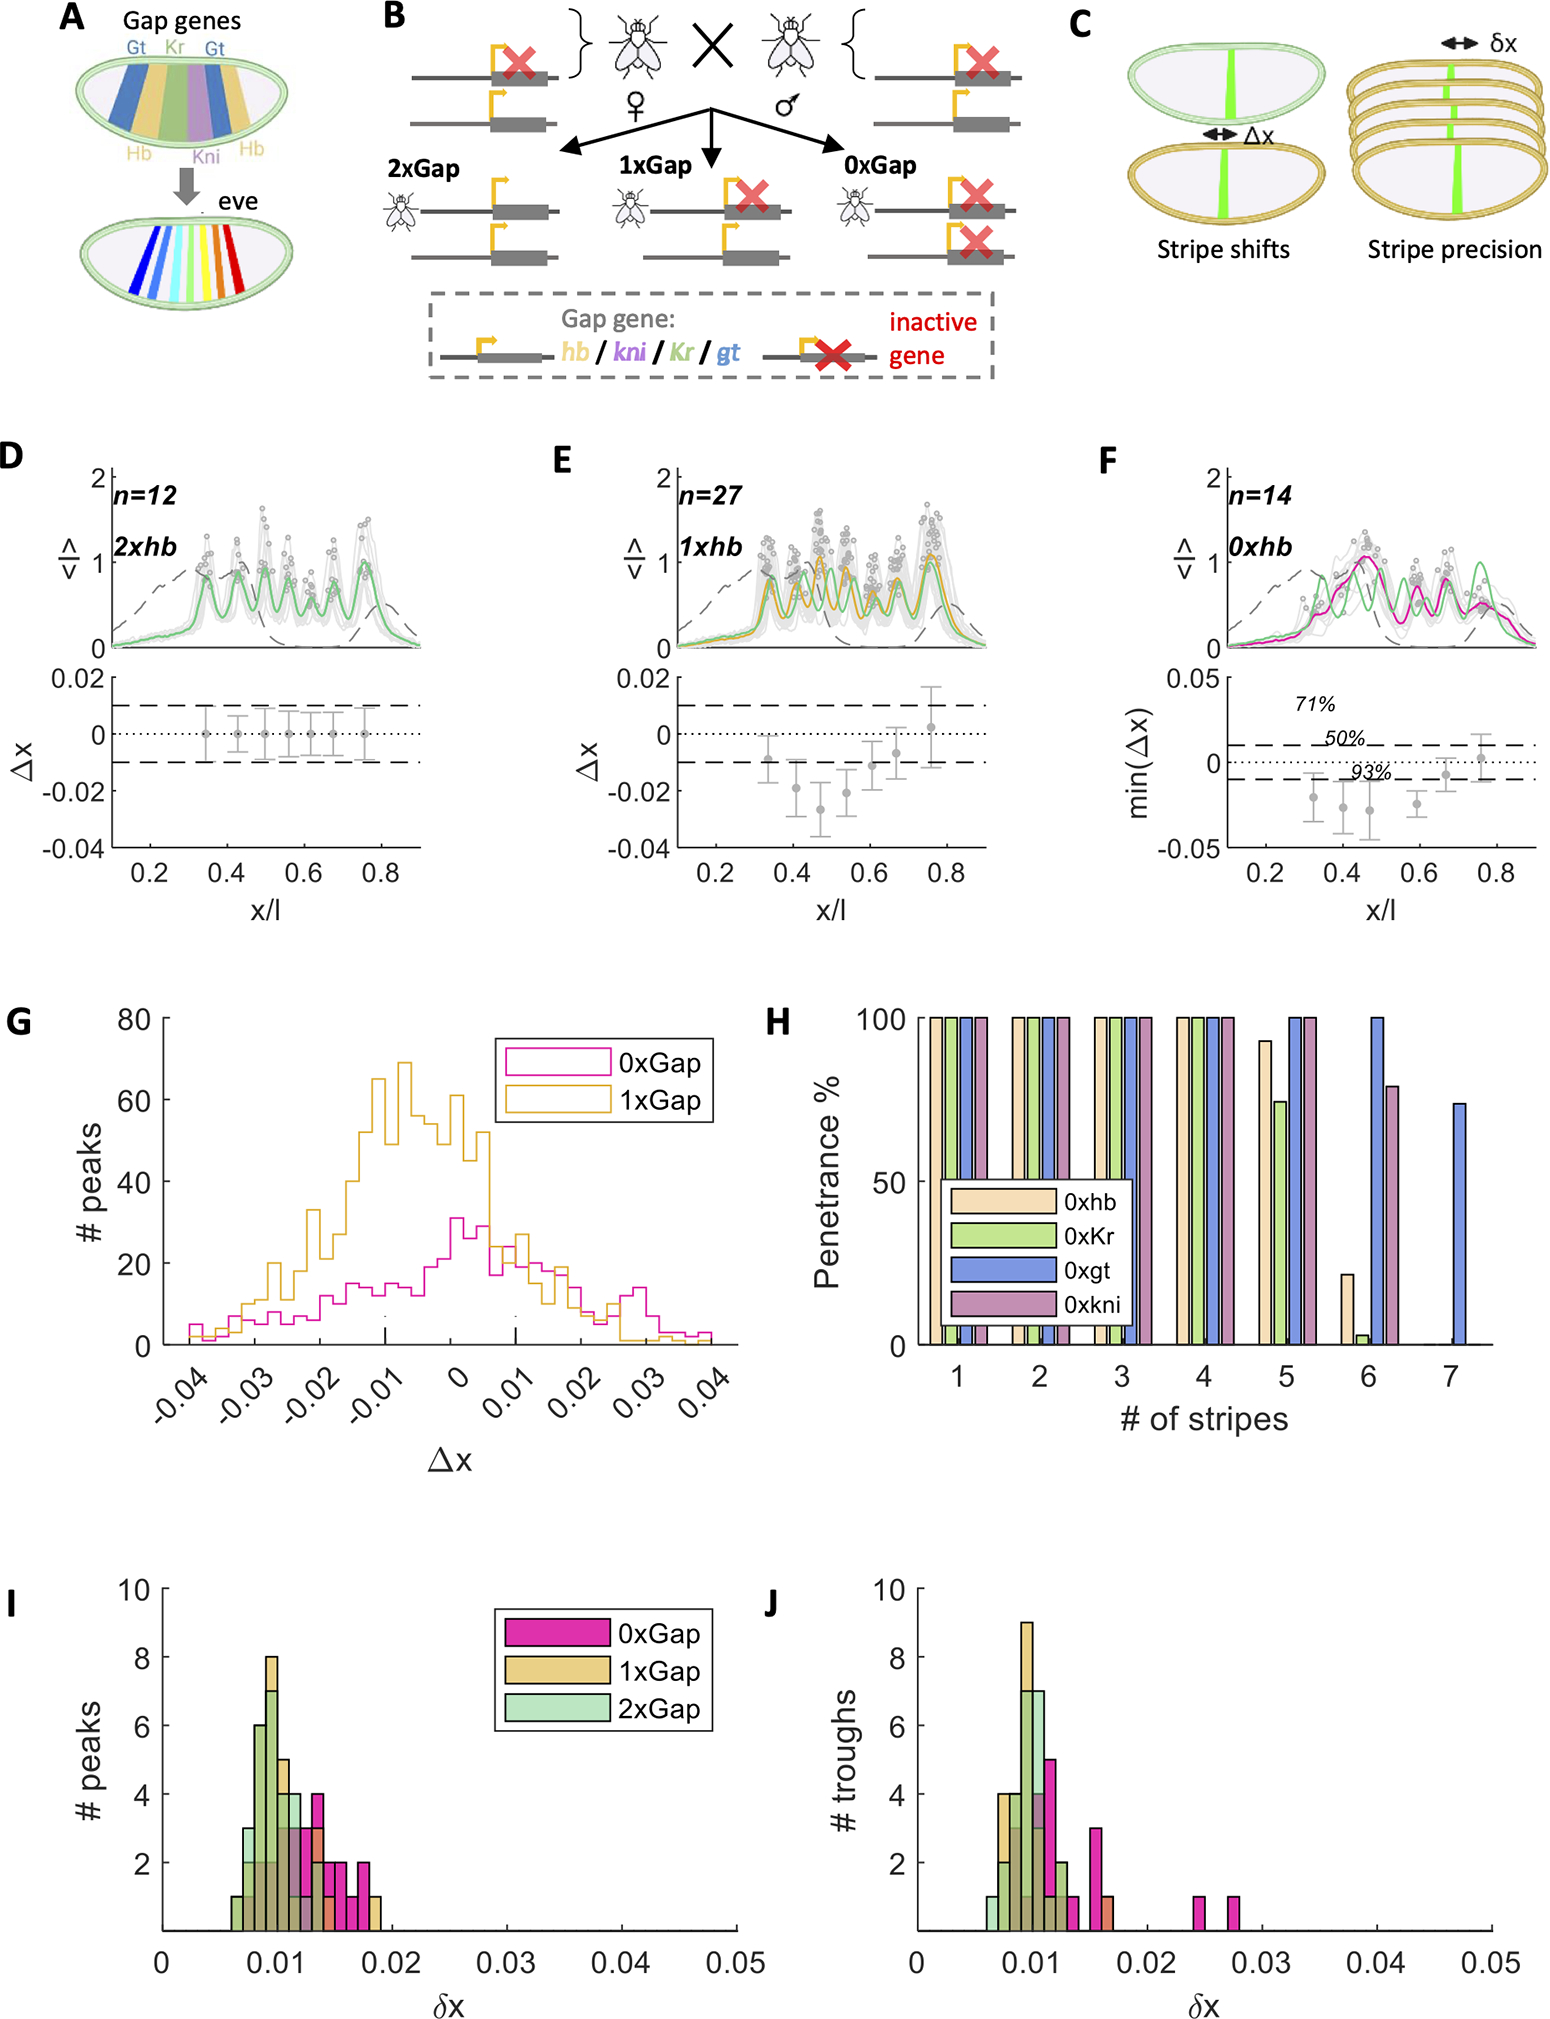
(A) Cartoon showing color code for labeling the identities of the spatial order of the main gap gene patterns (top) and the seven Eve stripes (bottom). (B) Genetic design of gap gene manipulations. Heterozygous parents with a null mutation in one gap gene on one chromosome generated offspring with ~50% heterozygotes (1x), ~25% homozygotes (0x), and ~25% quasi wild-type (2x, resulting from the two non-viable balancer chromosomes). For gt the expected proportion of offspring is altered due to its X chromosome residence. Measured Gt levels are thus subject to dosage compensation, which should theoretically result in 50% 2X, 25% for each 1x and 0x. (C) Cartoon showing difference between positional displacement (Δx, left) and positional error (, right). Displacements are mean position shifts of a stripe; positional error stems from small fluctuations between embryos for the position of a given stripe. (D) Eve normalized mean fluorescence intensities (<i>) are shown for 12 embryos as a function of their fractional position x/L along the AP axis (of length L) at 50±5 min into nc14 for the 2xhb experiment (gray); also shown mean Eve pattern (green), automated identification of peak locations for seven stripes (circles), and mean Hb pattern (dashed gray). In bottom panel, error bars represent the positional error () for each Eve stripe. Horizontal dashed gray lines represent ±1% EL. (E) Same as in D for 1xhb experiment, with Eve patterns for 27 embryos, mean pattern in yellow, with 2xhb pattern overlayed in green. Bottom panel shows mean positional displacements for each Eve stripe, with positional error indicated by error bars. (F) Same as in E for 0xhb experiment, with Eve patterns for 14 embryos (gray), mean in magenta. bottom panel here shows the minimal positional displacement from all possible wild-type stripes, since stripe identity is ambiguous. Stripe penetrance is annotated if different from 100%. (G) The distributions for Δx across all homozygous (magenta, 477 stripes from 87 embryos) and heterozygous (yellow) embryos (910 stripes from 130 embryos). (H) Stripe penetrance for homozygous null mutants (by gap gene color code), indicating the percentage of embryos showing a certain number of stripes (24 stripes in 87 embryos). The distributions of 𝛿𝑥 in each genotype is presented for Eve peak- (I) and trough- (J) locations using genotype-specific color code. See Figure S1 for Eve patterns in all genotypes.
For each gap gene fly stock, the data set for the 2x balancer homozygotes, faithfully reproduces the wild-type Eve stripe locations and their well-documented spatial precision of ~1% EL (Figure 1D and Figure S1A) 5,12. Striped expression patterns of Eve are observed in all 1x and 0x mutant embryos (Figure 1E–F and S1B–C), including regions along the AP axis where endogenous expression of the gap gene has been genetically manipulated. For all 1x mutants we observe seven Eve stripes, with identities easily defined based on their order along the AP axis, since final differentiation patterns in their hatching larvae are ordered according to wild-type 23,24. While stripe locations in these embryos can be mildly displaced ( cells) relative to their mean wild-type position (Figure 1E, 1G and Figure S1B), these displaced locations are nevertheless highly reproducible across embryos, in each mutant, with the positional error of any displaced stripe ~1% EL around their shifted mean (Figure 1E, 1I–J, and S1B).
Surprisingly, this precision is also maintained for all Eve stripes in 0x homozygous mutant backgrounds, even though the number of stripes is reduced and variable: in 0xhb mutants we identify 4–6 stripes (Figure 1F, 1H–1J), in 0xgt mutants 6–7 stripes, in 0xKr mutants 4–6 stripes, and in 0xkni we identify 5–6 stripes (Figure S1C). Although stripe identity for these mutants can be ambiguous, many stripes arise in positions that correspond to specific stripes in the wild-type pattern, or very slightly displaced from these positions (>±3 cells, Figure 1F, 1G, and S1C). In regions where the manipulated gap gene would have been expressed in the wild-type, eve expression patterns are broadened and consist of a variable number of discrete Eve peaks (Figure S1C–F). Such variable stripes occur with 11–89% frequencies in homozygotes (Figure 1H). When they do occur, however, regardless of their known or unknown identity, their positional error, and that for all stripes in homozygous null mutants, remains at the order of ~1% EL (Figure 1I–J). This result is surprising given the well-documented variable body plan for individual null mutant embryos 25–29. The gap between the highly reproducible Eve positions and this phenotypic variability can be accounted for by the partial penetrance observed for specific Eve stripes in these mutants. Our data suggest that spatial patterning precision might be an intrinsic property of the system that reemerges even under novel genetic conditions.
Reproducibility of gap gene expression underlies Eve reproducibility in mutants
To investigate the origin of the observed Eve positional precision and associated pattern shifts in the gap gene mutant backgrounds, we examined the twelve different genotypes analyzed for Eve expression using a protocol that allows simultaneous measurement of protein expression levels for the four gap genes 5,21. We collected a data set with over 3000 embryos to reconstruct the simultaneous expression dynamics of all four major gap genes for each genotype (Figure 2A–2D, Supplemental Videos 1–4). Due to the interactive nature of the gap gene network 30–32, perturbations in gap gene expression levels are not limited to the gap gene whose dosage was genetically manipulated. To quantify primary and secondary effects on gap gene expression, for each genotype we compute the deviations in embryo-averaged expression levels across space and time for each gap gene from their wild-type counterpart, (where G={Hb, Gt, Kr, Kni}, are the protein products, and nxg={2xg, 1xg, and 0xg} for each for the four gap genes, g={hb, gt, Kr, kni}). Figure 2E demonstrates for example the deviation from the wild-type expression levels of Gt in 0xKr . We represent these expression level differences in a kymograph where the spatial axis corresponds to the central 80% (or ~54 cells) of the embryo’s AP-axis, and the temporal axis corresponds to 10–56±4 min into nc14. We thus construct a total of 48 different kymographs (Figure 2F–I), corresponding to the four gap genes’ protein products measured in 12 genotypes. Note that kymographs of the 2x data sets (left columns), produced independently by each gap gene experiment, serve as a control for the experimental noise in our data measurements (Figure S2A–C & see methods).
Figure 2: Spatiotemporal gap gene expression in gap gene mutants.

(A–D) Simultaneously measured spatial gap gene expression profiles are shown for 85 embryos (42±4 min into nc14) in the Kr experiment for Kr (A), Kni (B), Hb (C), and Gt (D). Kr profiles (A) are used for genotype assignment (see methods): homozygous (0x, magenta, n=29), heterozygous (1x, yellow, n=46), and quasi wild-type (2x, green, n=10). Dashed lines show the mean expression profiles in each panel (A–D). (E) Example for kymograph construction in F-I. Top panel depicts the mean deviation of Gt as a function of relative position x/L in 0xKr from the wild-type pattern . It defines the response of Gt to the removed Kr gene, which is estimated by subtracting the mean expression profile of Gt in 2xKr from that in 0xKr . Bottom panel shows the difference profile as a one-dimensional color bar along the AP axis, where increased expression in the mutant relative to wild-type is labeled in red, and reduced expression is labeled in blue. (F–I) Spatiotemporal kymographs of color-coded rows with (with n={0,1,2} and g={Kr,kni,hb,gt}) as in E (bar corresponds to line of magenta arrow in F). In each panel, each row corresponds to a different time point in nc14, running from 10 to 56±4 min along the vertical axis for Kr (F), kni (G), hb (H), and gt (I) mutant genetic background experiments. The left columns (green border) show examples for a bootstrapped difference of resampled 2x data sets (), estimating experimental noise in the measure (under ideal conditions these panels would be white, i.e. no noise). Middle (yellow) and right (magenta) columns for each panel show heterozygous and homozygous , respectively. See S2 and Methods for more information on measurement noise and expression variances. Black arrows mark examples for: boundary shifts (adjacent red and blue regions) in Panel (F) for Gt in 0xKr, and in Panel (H) for Kr in 1xhb; pattern expansion (just red) in Panel (H) for Kni in 0xhb; pattern contraction (just blue) in Panel (H) for Gt in 0xhb; expression level increase or decrease without boundary shifts in Panel (I) for Hb in 0xgt and in Panel (F) for Kni in 0xKr, respectively.
As expected, in each genotype the largest overall deviations, averaged over all time-points and positions (see methods), occur in the gene whose dosage was modified genetically and , where G is the protein product of the gene ). This overall deviation is ranging between ~9–21% and ~23–44% of the wild-type maximum, for the 1x and 0x cases respectively. For kymographs representing the non-manipulated gap genes, positive and negative deviations in absolute average expression levels are weaker, ranging between 5–7% for the 1x and ~3–17% for the 0x data sets, respectively. In each mutant experiment, however, expression level alterations in at least two of the remaining genes in homozygous mutants and one of the remaining genes in heterozygous mutants were higher than the fluctuations observed in the randomized control (1–4%, where was bootstrapped to estimate noise levels, see methods). Moreover, their local spatiotemporal deviations (represented by individual pixels in the kymographs) can reach ~25% and ~80% of wild-type peak expression per gene for heterozygous and homozygous mutants, respectively. This quantification allows us to identify boundary shifts as adjacent red and blue regions in the kymographs (e.g. Gt in 0xKr, or Kr in 1xhb), or as pattern expansion (just red, e.g. Kni in 0xhb) or pattern contraction (just blue, e.g. Gt in 0xhb); as well as expression level increases or decreases without boundary shifts (e.g. Hb in 0xgt or Kni in 0xKr, respectively) 33. Changes in heterozygous mutants either lead to faint boundary shifts or faint expression level decreases.
In what follows, we use the broad range of gap gene combinations as a resource to investigate the downstream impact of gap gene expression levels on Eve pattern. For all our analyses, we choose the time window around 42±4 min into nc14, at which the information carried by the gap genes is maximized 14. As noted above, this time window precedes our Eve data by ~8 min, accounting for the expected delay for the impact of changes in gap proteins levels on Eve protein levels 22.
Given the precise positioning of Eve stripes in gap mutants and considering that during nc14 the gap genes are providing the main input source for eve expression (within the embryo’s main trunk) 5,16,17, we ask whether a corresponding degree of reproducibility is found at the level of gap gene concentrations. It is traditionally expected that spatiotemporal expression profiles in mutants are more variable as the animals are assumed to be less capable in coping with external stress. In our dataset the opposite is observed: although there are significant deviations for the mean expression profiles, in all mutant backgrounds, expression levels are highly reproducible from embryo to embryo (Figure S2D). Variances around the average profile, even when that profile is considerably displaced compared to wild-type, are close to the levels observed in wild-type (Figures S2D–F). While the positional error measured for heterozygous mutants is as accurate as the one for wild-type (i.e., ~ 1% EL, Figure S2E), homozygous gap mutants show slight increases in the positional error obtained from the remaining 3 genes (Figure S2F). This increased variability typically appears in the boundary regions of the removed gene. While the positional error can locally go as high as ~6% EL (e.g. in 0xKr around the region of reversed polarity duplications), at Eve stripes positions it typically reaches around ~2% EL, matching the upper bound of the variability measured for the homozygous Eve stripes positions (Figure 1I–J). Our quantitative analysis indicates that gap gene expression in both mutants and wild-type is sufficiently reproducible to account for the reproducibility of Eve expression and thus allows a direct comparison of code word combinations accounting for that expression.
Stripe-specific Eve expression tolerates broad ranges in code words
To investigate the relationship between the gap gene patterns and eve expression, we used our four independent measurements in 2x embryos to extract the wild-type gap gene expression levels present during the eight minutes immediately preceding the time window for which eve expression is measured. By examining locations corresponding to peak and trough locations along the AP-axis, we established the gap gene expression range within which eve activity is fully turned on or turned off, respectively. For each wild-type Eve stripe we determine its average peak position along the AP axis, which we know to be reproducible to within ~1%, and then extract at that location in each 2x embryo the four simultaneously labeled gap genes expression levels.
To visualize our multi-dimensional data set, we performed a principal component (PC) analysis on all wild-type code words identified with Eve peaks in individual embryos. Projected on the plane spanned by the dominant two principal components (i.e., the ones containing most of the variance), these code words are perfectly disjoint for all Eve peaks (Figure 3E and S3E). In addition, all troughs fall in the interstitial spaces. Although the weights of each PC consist of significant contributions from all four gap genes (Figure S3E), the first two components transform a four-dimensional data set into a two-dimensional visualization in which ~80% of the variance is accounted for (see Figure SE3). Our analysis confirms that stripe-specific DNA elements are activated by unique code words at each position, a nontrivial result since some enhancers of the eve locus drive multiple stripes. In principle, these could have generated alternative geometries of the PC space in which code words related to these shared stripe peaks are neighboring or overlapping.
Figure 3: Code words with large dynamic ranges and reproducible patterning.
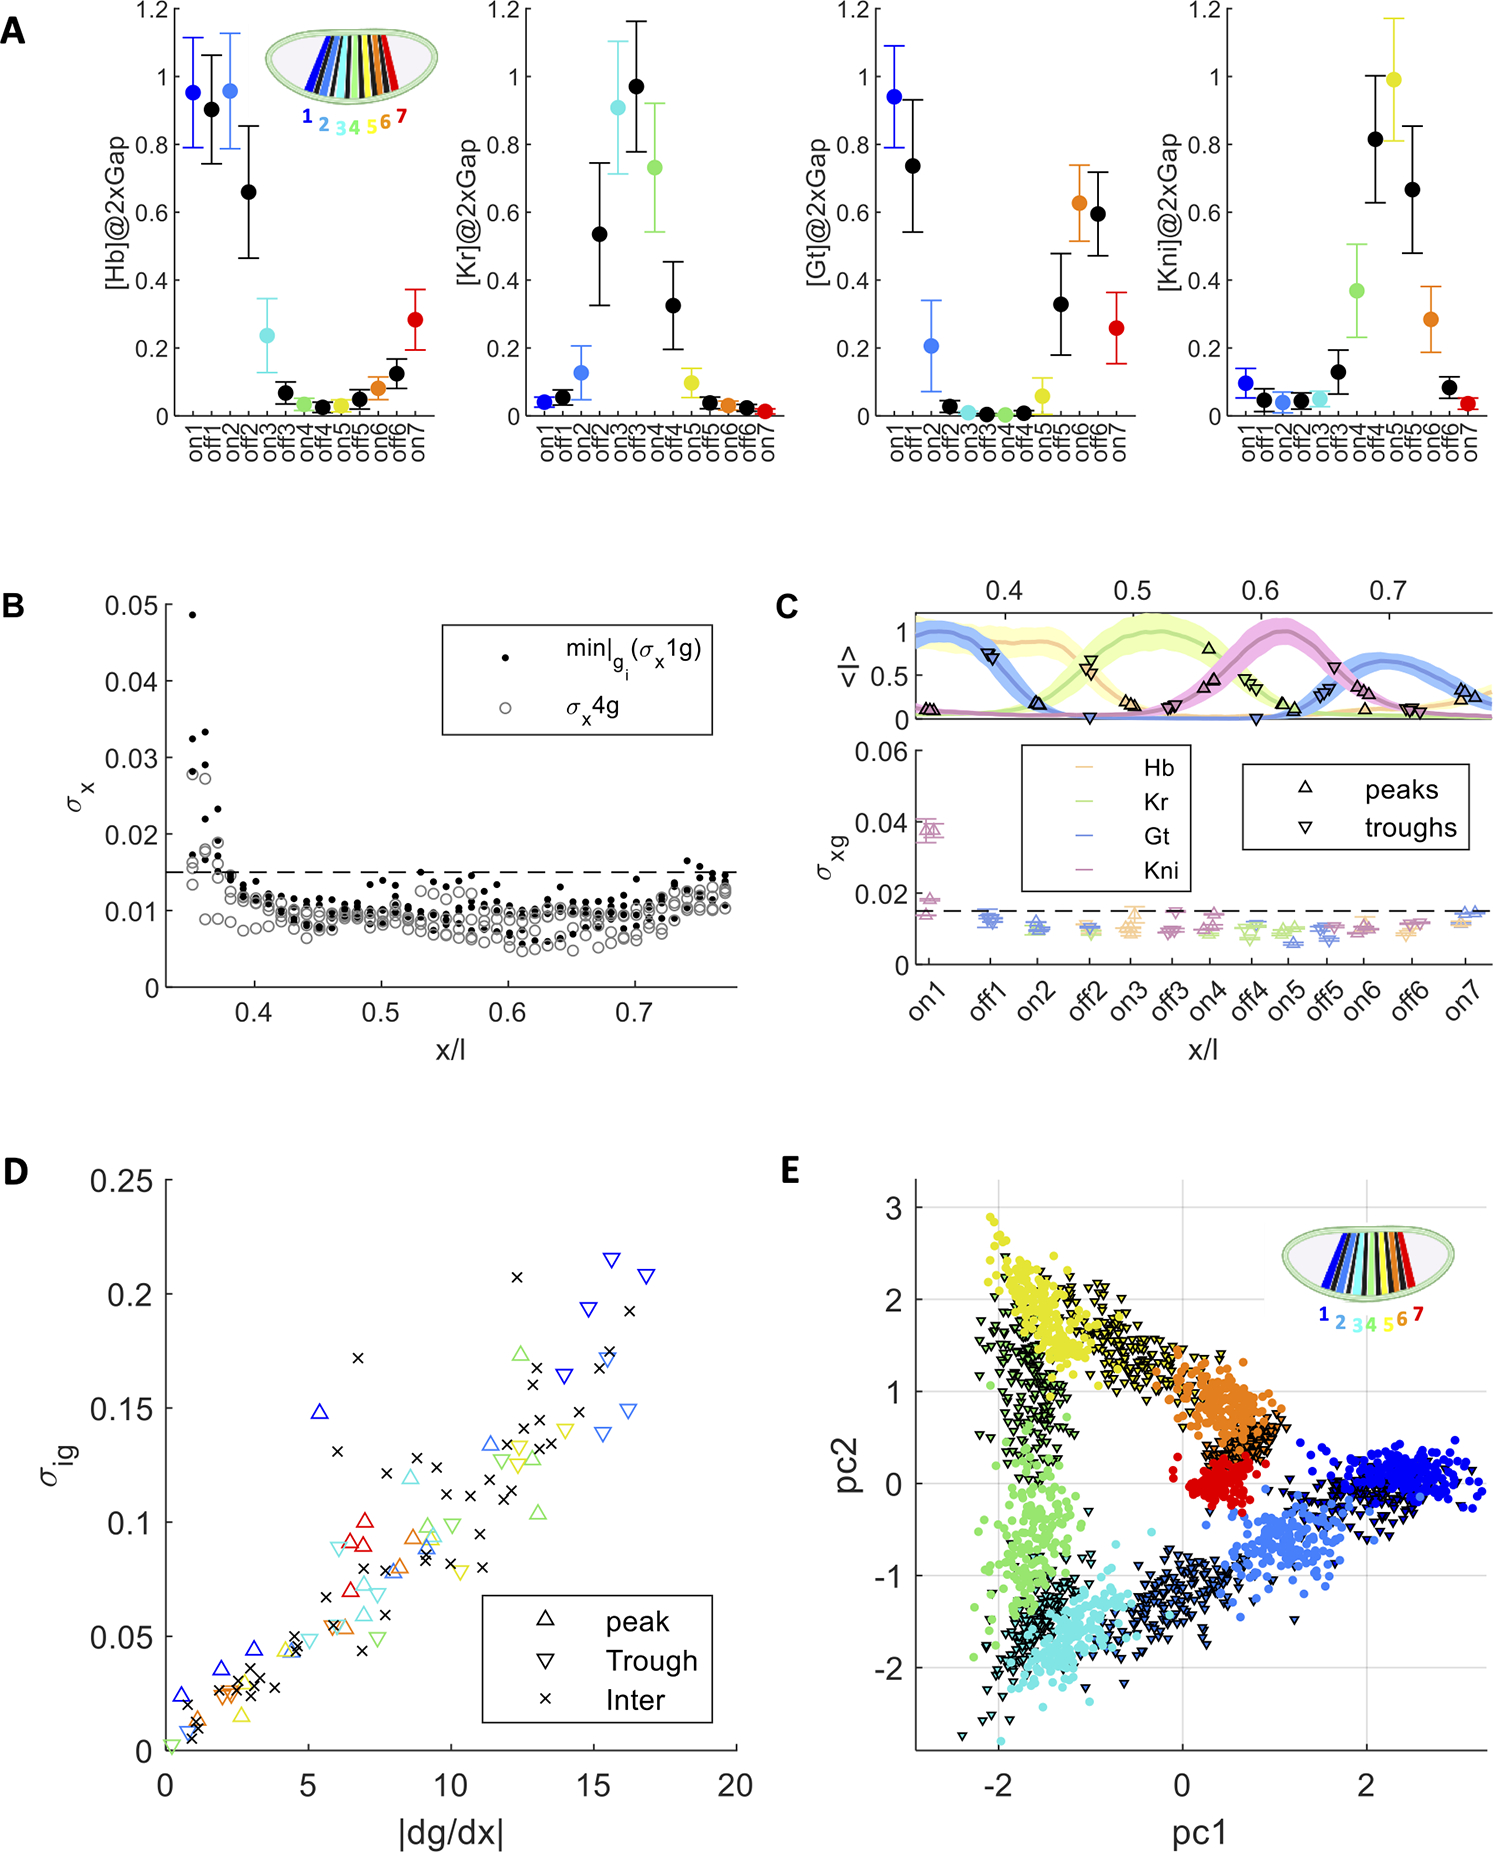
(A) Mean expression and standard deviation (pooled over all expression profiles in the four 2x experiments) as a function of Eve peak expression (color code in inset) and trough (black) locations along the AP axis (for each gap gene in an individual panel). (B) Positional error as a function of fractional AP axis position, with using all 4 gap genes (as in Ref. 14; gray circles) and using only the single gap gene that minimizes positional error at each position (black dots). At every x position, and are presented for the four 2x experiments. Dashed horizontal line at 1.5% egg length approximating the linear dimension of a single cell (i.e., the effective cell diameter). For each position, a single gap gene exists that guarantees a positional error below the 1.5% line. (C) Bottom panel as (B) with at Eve peaks (up-triangles) and troughs (down-triangles) with the color code indicating the specific gap gene providing the minimal for each position. Top panel shows mean and standard deviation of gap gene expression profiles along the AP axis. Triangles annotate location and level of gap gene leading to minimal . (D) Correlation between the local derivative dg/dx(x) and the code word range (defined by the standard deviation in A) for the most accurate gap gene for inter peak/trough positions (black x); as well as for peaks (up-triangles), and troughs (down-triangles), with stripe identity indicated by eve color code (see inset in A; trough color matches its preceding peak). (E) 1st and 2nd principal components (PC) of all 2x code words at Eve peaks from individual embryos at 42±4 min, computed separately for each 2x experiment (color indicates stripe identity). For each dataset PC1 and PC2 include ~80% of the data variability (~50% and ~30%, see variance and loadings in Figure S3E). Eve peaks are separable across the four pooled data sets and troughs intervene between peaks. (See Figure S3 for values of explained variance per experiment as well as contributions of individual gap genes per PC.)
Along the AP axis, the dynamic range for individual gap genes varies by as much as 25% of the average wild-type levels (Figure 3A & S3A). For each position, our analysis identifies at least one gap gene whose positional precision is sufficient to provide Eve stripe accuracy with an error close to the 1–2% EL (Figure 3B), and thus close to a single cell diameter. The gap gene providing this accuracy varies for each stripe (Figure 3C). For example, Eve stripe-2 can be accurately positioned by information from either Gt or Kr, confirming and extending previous findings whereas Eve stripe-3 can be predominantly positioned by the changing Hb concentration 6,18,20.
Curiously, the dynamic range of activity ( around the mean activity) for some specific high-precision-providing gap genes is large (Figure 3C and S3C). However, the positions at which they provide such high precision coincides with the gap gene pattern boundaries. Thus, the large dynamic range in activity is offset by a large local derivative (dg/dx), considering that the positional error is given by the ratio of and dg/dx (Methods). This argument is supported by a strong correlation between and the local derivative measured for the gap gene providing the highest accuracy level (Figure 3D). Overall, these results demonstrate that large expression level ranges in the code word repertoire can coexist with the observed precision in the downstream gene expression profiles, facilitated by our observation that single gap genes can account for precision of single Eve stripes.
Heterozygous gap mutants identify network-mediated effects
We next examine the eve locus’ response to code word perturbations by focusing on the heterozygous mutants where an individual gap gene is expressed in a single copy (i.e., at a 1x level). While Eve stripes may be slightly displaced, for all four gap genes the 1x backgrounds display seven stripes with 100% penetrance, and each stripe can be unequivocally matched to its corresponding wild-type stripe. We can thus compare code words for corresponding stripes in 1x and 2x embryos. Our analysis examines both gap gene expression at the points where stripes form in mutants and at the points where they would have formed in wild-type.
Of the four expression levels composing the code word for a particular Eve stripe in heterozygous mutants, one corresponds to the manipulated gap gene. Although our genetic manipulations halved the copy number of that gene, in most cases the average protein expression level is above 50% of the corresponding wild-type level (i.e., y=0.5x line in Figures 4A and S4A–D). Surprisingly, within each stripe observed in 1x mutants, expression levels of the three remaining gap genes are mostly unaffected by our manipulation and are within error bars of the corresponding stripe in wild-type (i.e., diagonal, y=x, in Figures 4A and S4A–S4D). The eve locus is thus tolerant to 50% dosage changes for one gap gene, but otherwise activates at wild-type expression levels for the remaining three gap genes.
Figure 4: Heterozygous gap mutants display small displacements in Eve stripes.

(A) Scatter plot of mean heterozygous versus homozygous gap gene expression levels (42±4 min into nc14) at corresponding 1x versus 2x Eve peak locations (identified at 50±5 min to enable network delay). For each 1x experiment there is one genetically manipulated gap gene with half wild-type dosage (red; 28 data points from seven stripes in four experiments). Data not falling on the half-diagonal (dashed y=0.5x line) must have experienced some compensatory effect from the gap gene network; most data points hovering above that line show compensation towards wild-type levels. For the unmanipulated gap genes, black and green data fall consistently on the diagonal (dashed y=x line), within gray-shaded error (for genotype breakdown see Figure S4A). Some stripes shift significantly in position along the AP axis (i.e., more than one cell diameter, green). (B) Top shows kymograph of Kni expression in 1xKr experiment (from Figure 2F), middle shows Eve pattern for 1xKr (from Figure S1B), and the bottom inset shows the displacement and positional error of each stripe (from Figure S1B, for stripe identity color code see C). Stripes 4, 5, and 6 show significantly displaced mean positions but maintain their wild-type eve-activating gap gene expression levels. For stripes 4 and 5 (see D and E, respectively, for the corresponding relevant subset of data points from A) this shift is accompanied by increased Kni expression (red kymograph region, highlighted by dashed green and yellow lines in B, respectively). For stripe 6, Gt is adjusting its level (see Figure S3E, orange diamond with green edges). (F) For green and black data in A, scatter plot of position shift (Δx) and the maximal change in expression level for gap genes at the mutant stripe position during the 10–42 (±4) min nc14 time interval. Position shift and intensity differential are linearly correlated, with all shifts being towards the anterior. (G) Projection of gap gene code words for Eve peaks from all heterozygous mutant embryos (squares, color-coded by stripe) onto the PC1–PC2 plane defined by wild-type Eve peaks (black triangles) at 42±4 min. Code words encoding different Eve peaks are clearly separable, yet their extends in the plane are wider (see Figure S4 for separability of heterozygous code words for peaks and troughs).
In 1x gap gene mutants, the positions where stripes form are in some cases shifted relative to where they would have formed in wild-type (Figure 1E and S1B). These shifts are possibly related to the reduction in the manipulated gene as well as subtle effects on the other gap genes in the network (Figure 2F–I) and are like those observed in the homozygous mutants (see below). For example, in heterozygous Kr mutant embryos, an increased Kni expression level due to an anterior shift of the Kni pattern is associated with an anterior shift of 1–2 cell diameters in the positions for Eve stripes 4 and 5 (Figure 4B). Even though both stripes occur where Kr expression is halved compared to wild-type, the Kni expression at the shifted position is identical to that found at the stripe in a wild-type background (Figures 4D and 4E). Note that the Kni expression domain has not expanded: both anterior and posterior boundaries have moved anterior, leading to the observed pattern shift (Figure 4B, top). Thus, the network interactions result in shifts of position rather than simple broadening of stripes.
More generally, in all cases where Eve stripes in 1x embryos show subtle positional shifts, these shifts are anterior and associated with corresponding expression level changes in the levels of other gap genes at the new stripe position and at the position where the stripe would have formed in wild-type. In each case, at the stripe position in the mutant, the change to the concertation of one of the genetically unperturbed correlates proportionally with the magnitude of the positional shift of the corresponding Eve stripe (Figure 4F and S4E). As discussed above this new position of the stripe closely recapitulates the expression levels of the three unperturbed genes that were associated with that specific stripe in the wild-type. These results are echoed in our PC analysis when we overlay the 1x code words with the wild-type code words (Figure 4G). While the dynamic ranges of eve activity-promoting expression levels increase slightly, the averages remain similar, and peaks and troughs are clearly separable (Figure S4G). Together these results suggest a potential network-level response to external perturbations.
Homozygous gap mutants identify canonical and novel code words
Although stripe patterns in homozygous mutants can be very different from wild-type, we examine whether homozygous mutant code words are sufficiently like wild-type code words to allow inferences of mutant stripe identities. To this end, we consider the first two principal components of the code words for the four cases of the null mutant backgrounds and compare them to the wild-type values (Figures 5A–5D). This analysis will be put to a test by comparing the outcome to previously published reporter assays for minimal stripe enhancers of eve. To simplify our task, we only focus on code words at Eve peaks, and refrain from analyzing the code words at trough positions.
Figure 5: Canonical and non-canonical code words in homozygous mutants.
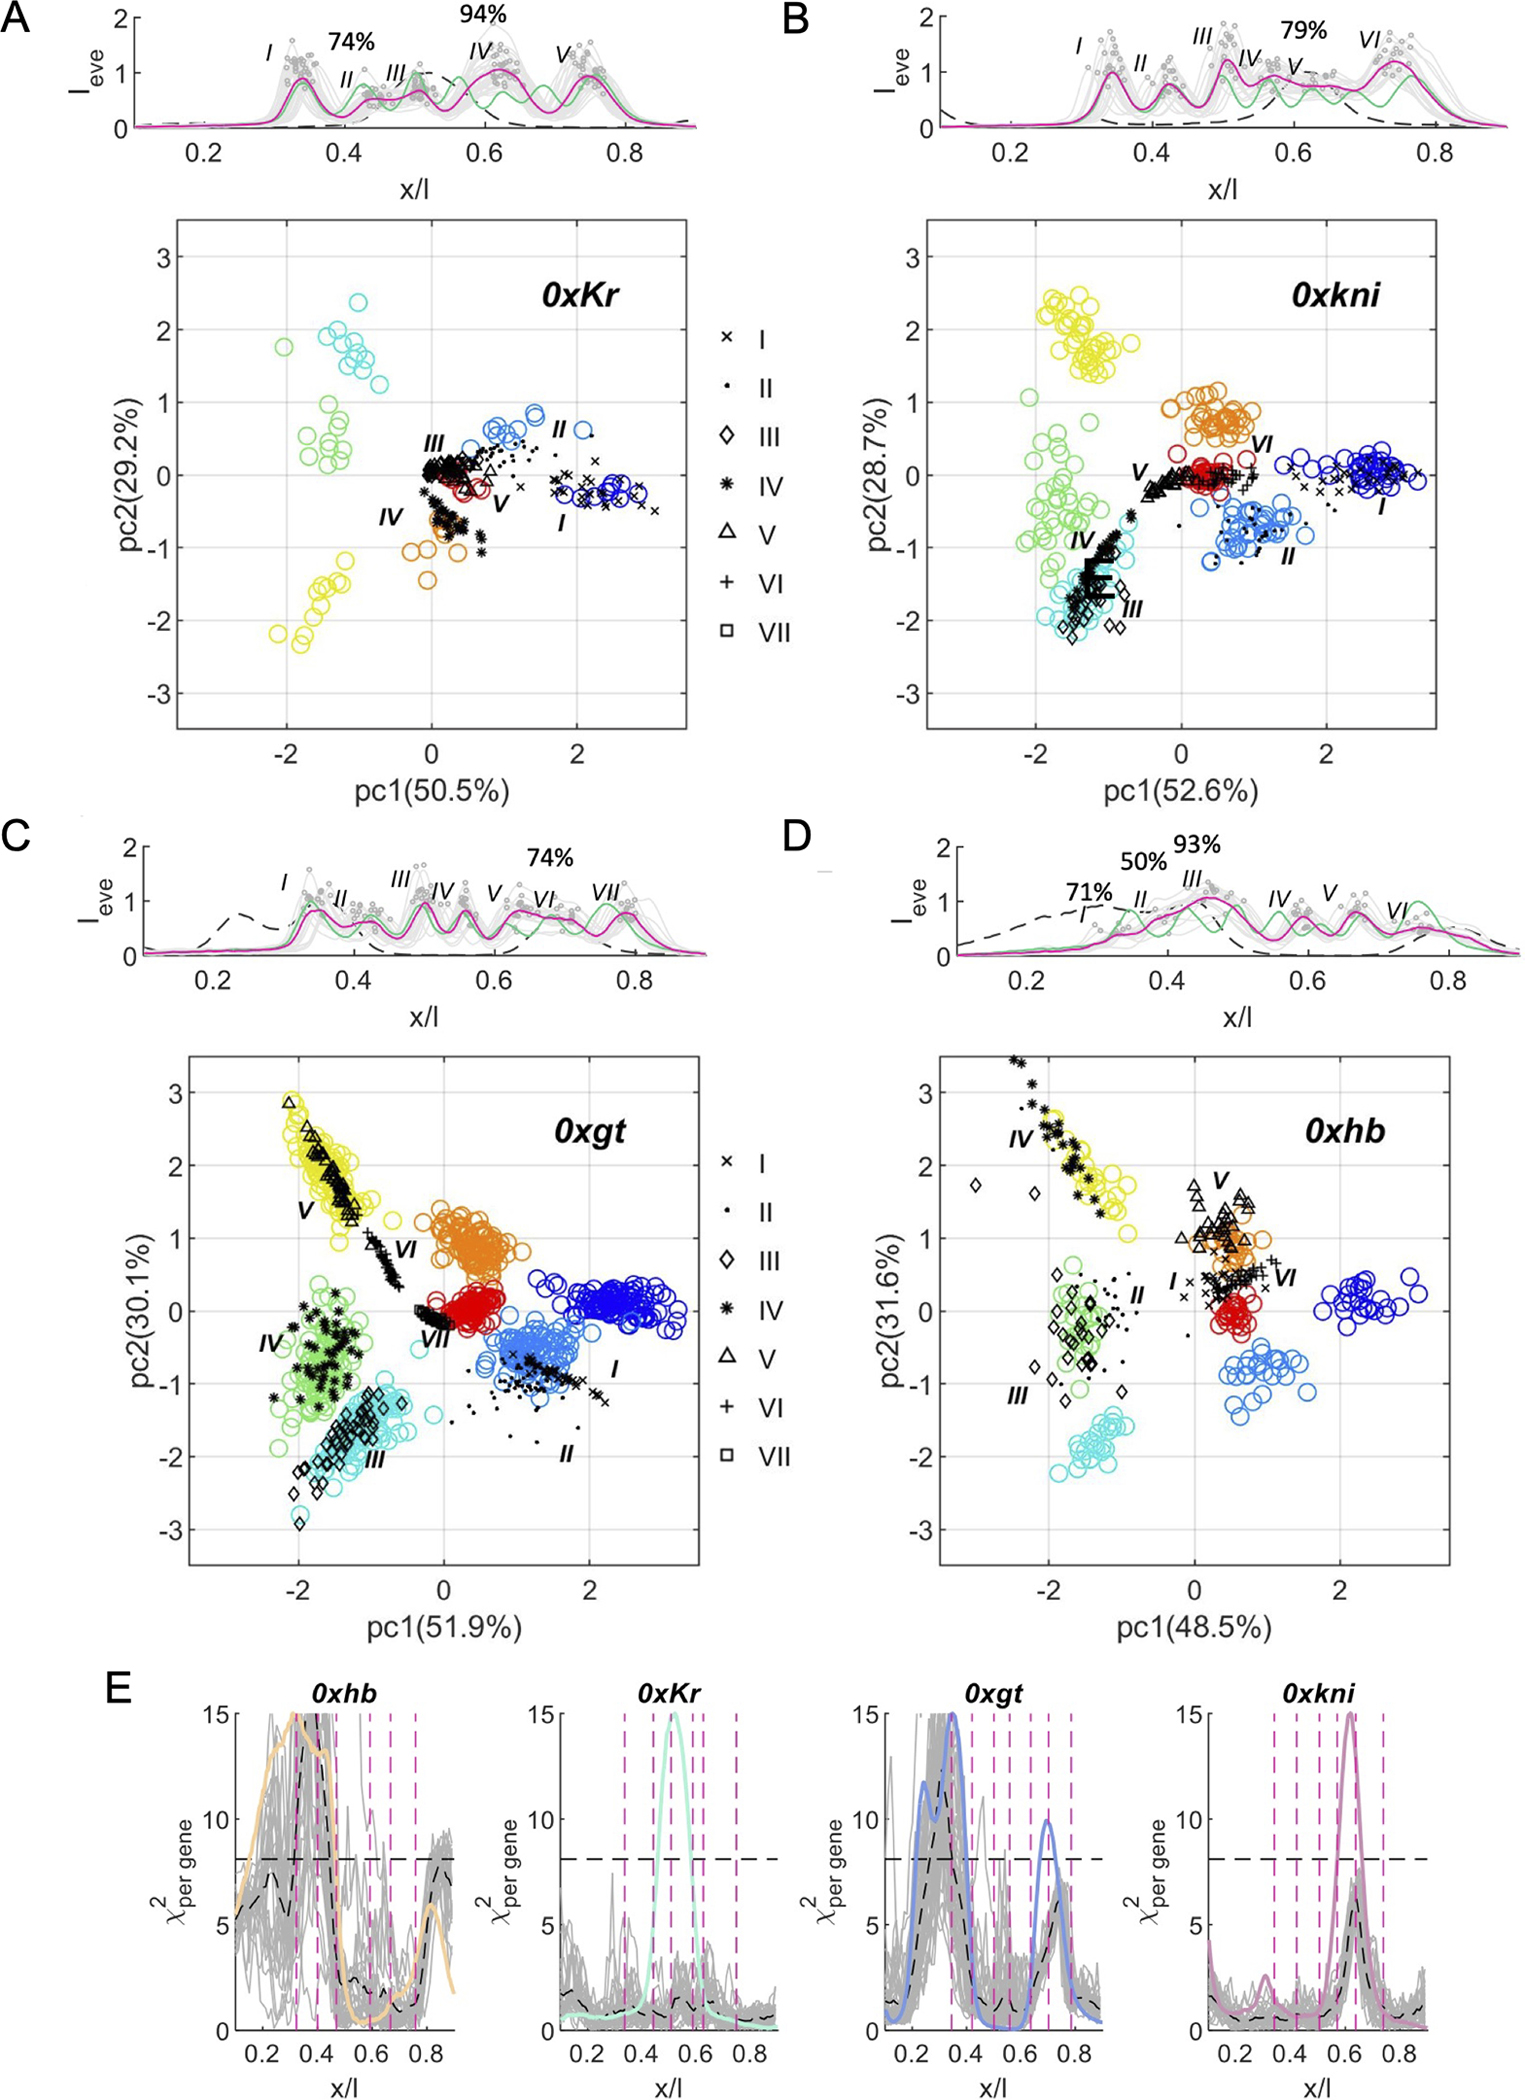
(A) Top panel shows expression patterns of Eve in individual embryos (solid gray) and the mean Eve pattern (magenta) in the 0xKr experiment; graph is overlayed with the mean 2xKr Eve pattern (green) and the mean wild-type expression pattern of Kr (dashed gray). Circles indicate peak position and Eve intensity in individual embryos. Roman numbers indicate the serial position of a peak along the AP axis. Percentages indicate partial stripe penetrance if lower than 97%. Bottom panel shows the projections of gap gene code words at Eve peaks (black) for 0xKr experiment onto the PC1–PC2 plane obtained for gap gene code words at Eve peaks in 2xKr (wild-type). Percentages on PC axes indicate the proportion of the wild-type variance explained by a particular PC. (B–D) Like A but for 0xkni (B), 0xgt (C), and 0xhb (D) experiments, respectively. Mutant stripe (black) identities can be inferred by their overlap with the wild-type stripe cloud (see Eve color code in Figure 4C) and/or proximity to more than one stripe. (E) -per gene 4 estimates for each position along the AP axis (x/L) the distance between code words from individual homozygous embryos and the wild-type reference distribution (see methods); gray lines for individual embryos, black dashed lines for mean -per gene. The wild-type expression profile of the removed gap gene is overlayed in color, as well as the mean Eve stripe positions for the homozygous null mutants (vertical magenta lines). Note that levels are only elevated above baseline in regions of the embryo that overlap with the removed gene domain. Only ~14% of 0x code words across the 0.1–0.9 EL span more distal than the maximal distance measured for a wild-type code word from its distribution across embryos (horizontal dashed lines).
In the case of a complete removal of Kr (Figure 5A), we typically observe five stripes, sequentially denoted with roman numerals from anterior to posterior (I-V). The identity of these stripes can be easily read off by visual inspection from the PC1—PC2 plane. Stripe I/II and IV/V largely recapitulate the anterior-most and posterior-most wild-type stripes, namely stripes 1 and 2 and stripes 6 and 7, respectively. No stripes in the mutant correspond to wild-type stripes 3, 4 and 5. Instead, stripe III, which forms right in the region of the central Kr domain, seems to be a duplication of wild-type stripe 7. This view is consistent with the polarity duplication observed in the final cuticle of Kr homozygous embryos 24,34, clarifying the identity of the previously unidentified associated abdominal segment. The proximity of stripe III code words in our PC analysis to both wild-type stripe-7 and stripe-2 is well reflected in previous reporter assays 19,20 and is consistent with the known impact of loss of Kr on expression of Hb and Gt expression 35. Furthermore, stripe II shows relatively low penetrance (74%), which is echoed by several code words that are falling between the wild-type clusters of stripes 1 and 2.
In homozygous kni mutants we observe six stripes. Stripes I/II/III and VI replicate the anterior-most three and the most posterior wild-type stripes, respectively (Figure 5B). Mutant stripe IV overlaps with wild-type stripe 3, along its border with stripe 4, matching reporter activity of both minimal stripe enhancers 4/6 15 and 3/7 19 at this position. In reporter assays, stripe V is activated by enhancer elements 4/6 15 and 3/7 19, and by a fragment that activated stripe 5 (as well as 1) 15. This specificity matches the occupancy of the corresponding code words in the empty region between stripe 7 (best match) and stripes 4 to 6. While cuticle interpretations for this mutant suggested a merger of stripes 3 to 7, the overlaps in our PC analysis suggest potential duplications as well.
In 0xgt we see seven stripes although I and II as well as V and VI are not well separated by non-expressing regions (Figure 5C). Stripes II, III, IV, V, and VII match stripes 2, 3, 4, 5, and 7, respectively. According to our PC analysis, stripe I is a duplication of stripe 2 as the corresponding data points largely overlap with the wild-type stripe 2 code words. Stripe VI represents an entirely novel code word that is positioned in the region between the wild-type stripes 4, 5 and 6, matching reporter experiments where both stripe elements 1/5 and 4/6 are contributing to eve expression at this position 15.
Lastly for 0xhb we identify six stripes with I–III not being easily separable (Figure 5D). Stripes III, IV and V match stripes 4, 5 and 6, respectively, whereas stripe VI is positioned between stripe 6 and 7. The posteriorly expanded activity of 4/6 (15) and anteriorly expanded 3/7 activity (19) results in a quasi-merging of stripe VI with both, stripes 6 and 7. Stripes I and II show partial penetrance (71% and 50%, respectively) and seem to be activated by novel code words. Although these stripes are in the anterior region of the embryo, stripe I falls between code words for stripes 6 and 7, and stripe II partially overlaps with code words for stripe 4. This shift in identity corresponds to the cuticle phenotype when both maternal and zygotic hb is removed. Our analysis however focusses on zygotic mutants that expressed maternal hb at earlier stages. It is unclear how such maternal Hb might rescue the anterior identities of these cells.
Are mutant code words truly novel?
To quantify the similarity between mutant code words and wild-type code words, we use a -analysis at each position along the body axis (Methods). In heterozygous gap mutants (Figure S5A), code words responsible for eve expression are mostly contained within the wild-type repertoire, with an overlap of ~99.9% between the two -distributions. In homozygous null mutants the -analysis only identifies radically new combinations for ~14% of the code words (Figure 5E). Note that a novel code word is determined when the -value calculated for a mutant code word exceeds the distance between the most extreme wild-type code word (marked as the dashed black horizontal line in Figures 5E and S5A). Among the total of 24 Eve stripes detected in our four homozygous data sets, we only identify three Eve stripes where deviations suggest novel code words, even under less strict criteria for novel code words.
While in 0xKr all code words remain within the wild-type repertoire, in 0xkni the -analysis suggest novel code words associated with stripe 5, a stripe that also shows 74% penetrance. In 0xgt, stripe I is activated by entirely novel code words (Figure 5E), however in the PC analysis the corresponding data points largely overlap with the wild-type stripe 2 code words (Figure 5D). Finally, in 0xhb the -analysis reveals novel code words for stripes I and II, which were also identified as such in our PC analysis. Based on this quantitatively more rigorous -analysis, the number of potential novel code words is therefore limited.
DISCUSSION
In our previous work 5, we introduced a decoding approach that identifies combinations of the four gap gene expression levels responsible for eliciting transcriptional activity in the Drosophila eve locus. We validated our approach by manipulating maternal genes like bicoid, nanos, and torso-like, which provide the initial spatial information in the embryo. While these manipulations led to sometimes subtle and at other times significant changes in Eve stripe location and identity, the associated changes in the gap gene expression levels leading to specific stripe formation did not significantly deviate from the wild-type repertoire of these combinations.
In this study, we took a different approach by directly manipulating gap genes themselves while leaving the maternal genes intact. These manipulations led to a much broader range of expression level combinations and elicited eve locus responses at novel combinations of gap gene expression levels, which we refer to as “novel code words.” Code words represent functional combinations of transcription factors that are read by a gene locus and participate in defining a cell’s fate.
Our study demonstrates that a wide repertoire of gap gene code words activates the eve locus in both wild-type and gap mutants. Notably, the accuracy of stripe positioning remains near ~1%, corresponding to single-cell precision. Even in homozygous null mutants with partial penetrance, the positional accuracy of Eve stripes is conserved. This partial penetrance of certain stripes accounts for the previously described variable body plan across mutant embryos with identical genetic backgrounds 24,25,28.
We observe that code words in gap mutants tend to show low divergence from the wild-type repertoire, particularly in regions of the embryo outside the wild-type expression domain of the perturbed gene, and often within it. This conservation and familiarity of code words seem to stem from interactions within the gap network. Conserved code words often appear where the non-manipulated gap genes respond to the genetic manipulation. This suggests that the gap gene network provides robustness against possible disturbances, contributing to its ability to adapt its expression under ongoing changing developmental changes.
Defining non-canonical code words
Throughout our study, we used two different measures to assess similarity between wild-type (canonical) and mutant code words: -analysis (Figures 5E and S5A) and proximity analysis in the PC1–PC2 plane (Figures 3, 4, and 5). These measures have their own limitations and are not interchangeable. -analysis shows that nearly all code words in heterozygous mutants are contained within the wild-type repertoire. However, deviations from the wild-type repertoire are identified for these mutants by PC analysis, where heterozygous code words occupy a notably wider regions of the PC1–PC2 plane. Increased distance according to the -analysis is observed only for homozygous mutants and only in embryo regions overlapping with the perturbed wild-type domain.
Our study integrates data from reporter assays of enhancer-specific activity under homozygous null background with our PC analysis. Thiw integration reveals a remarkable agreement between the proximity in the PC1 and PC2 plane and the activation of minimal stripe enhancer elements 15,18–20. The loss of enhancer specificity may underlie the variable body plan of homozygous gap mutants, with partial stripe penetrance stemming from different efficacies of activation of multiple enhancers.
We acknowledge that specific combinations of gap genes may determine activity differently under exogenous conditions used in most reporter studies. Such reporter-based assays may not duplicate the more complicated interaction with the rest of the genome that may be present in the endogenous control regions 33,36,37. Under endogenous conditions, the dynamic tertiary structure of the DNA around the eve locus may add a control layer that enables specificity of activation even in gap mutants. Measuring endogenously labeled activity under mutant backgrounds is necessarry to determine whether such non-canonical code words do indeed induce non-specific activation. Such experiments would teach us more about the scope of contribution of code words to transcriptional control and whether multi-activation of enhancers is an artificial result of the exogenous context.
Network response to genetic perturbations and the role of zygotic genes
The similarity of most mutant code words to canonical code words suggests the limit of the functional flexibility of the enhancers driving Eve expression. Canonical code words could result directly from our genetic manipulation, or the inevitable network response could result in novel code words. Our data therefore suggest compensating activity of the gap network following our genetic manipulation. Such correction capacity of gene networks may underlie the robustness manifested by the developing fly to a variety of documented perturbations 38–41.
Our findings agrees with previous reports, in which the maternal inputs to the segmentation gene network were manipulated 5,26. Our observation of partial penetrance of certain Eve stripes in mutants of specific gap genes has been previously documented in mutants of tailless (0xtll)29 and Kr (0xKr) 27. The proximity of the activation patterns of enhancer elements in mutants to the wild-type activation patterns provides an intuitive explanation for stripe identity in these mutants.
Our analysis of each gap gene mutant quantifies expression in large numbers of carefully timed fly embryos stained for all gap genes simultaneously or for individual gap genes and eve. Reproducibility of the patterns identified in each data set allows us to combine them and probe eve locus responses to various sets of gap gene level combinations. Although we have focused on a single time point during early embryo development, a more detailed analysis of the combined time points in the data sets will provide a dynamic component to our identified network interactions and their impact on Eve expression.
Limitations of the study
Despite our comprehensive analysis, limitations exist. While eve is well-conserved, our results may not apply to other genes or later developmental stages. Fixed embryo analysis, potential bias from focusing on major gap genes, and decorrelated measurements of Eve and Gap genes are also limitations of our study.
In summary, our study sheds light on the intricate regulatory network governing gene activation in the context of cellular identity formation. The conservation of code words, even in mutants, highlights the robustness of genetic networks and their capacity to adapt to developmental changes. Further investigations into the dynamic aspects of these networks and the role of code words in transcriptional control are warranted, and our work provides a valuable resource for such endeavors.
STAR Methods
Resource Availability
Lead contact
All information queries or requests for resources can be directed to and will be fulfilled by the lead contact, Thomas Gregor (tg2@princeton.edu).
Materials availability
All reagents and fly lines are available upon request.
Data and code availability
All processed data and custom software codes to generate all figures are available at https://zenodo.org/record/8341410. Raw confocal imaging data are available upon request.
Any additional information required to reanalyze the data reported in this work paper is available from the Lead Contact upon request.
Experimental model and study participant details
Drosophila fly strains
All the embryos from a cross between a pair of heterozygous parents for one of the 4 gap genes were obtained by allowing them to lay eggs for 2 hours, and then maturing the eggs for 2 more hours. Stocks were balanced as follows:
“kni-null” allele - a CRISPR-mediated replacement of the kni region (upstream regulatory regions and coding region) with a 2attp-dsRed cassette was performed 42. The homology arms were amplified from the genomic DNA of the nos-Cas9/CyO injection line (BDSC #78781). The two Cas9 cutting guide RNAs sequences used are [GGGAGGGCTTGATTCGGGAAAGG] and [CTTGAAGCTCATTAATTCCACGG]. PCRs from the dsRed to the flanking genomic regions were performed to verify the deletion. The allele was balanced with TM3, Sb balancer.
“gt-null” allele was produced in a similar manner. The cas9 injection line used was BDSC #51324. The two Cas9 cutting guide RNAs sequences used are [CGGCCGGCGAGGAAGTGAACGGG] and [TCTTACGTGTAAGAATTCATGGG]. The allele was balanced with FM7 balancer.
Method Details
Measuring gap gene expression
Protein levels of Gap genes were measured as previously reported 21 with slight adjustments as follows: we used rabbit anti-Kr along with mouse anti-Hb, guinea pig anti-Gt and rat anti-Kni. Secondary antibodies are, respectively, conjugated with Alexa-430 (mouse), Alexa-514 (rabbit), Alexa-568 (guinea pig), and Alexa-647 (rat) from Invitrogen, Grand Island, NY. Expression levels were normalized such that the mean expression levels of WT embryos ranged between 0 and 1, with background subtracted from individual embryos (the minimal value measured along its dorsal AP profile) and divided by the maximal value of the mean wild-type dorsal profile measured per gene. Specifically, gene expression profile of an individual embryo of any genotype was calculated as:
Where is the lowest raw fluorescence intensity of embryo , and is the highest raw fluorescence intensity value of the mean wild-type embryo fluorescence profile; is the raw fluorescence profile of an individual embryo of any genotype (mutant or wild-type). The fluorescent magnitude is linearly correlated with the concentrations of protein product, and thus serves as its proxy.
Measuring eve gene expression
To image Eve, we used mouse anti-Eve together with a guinea pig anti-Gap (Hb/Gt/Kr/Kni), according to the mutant stock we were imaging, to sort out genotypes of individual embryos. Secondary antibodies are, respectively, conjugated with Alexa-647 (mouse), and Alexa-568 (guinea pig) from Invitrogen, Grand Island, NY. Embryo fixation, antibody staining, imaging and profile extraction were performed as previously described 5,21. We used eve expression to extract the locations of expression troughs and peaks. Eve protein profiles were simultaneously measured in mutant and wild-type embryos in the time widows of 45- to 55-min into n.c. 14. Expression profiles were normalized as with the Gap staining, such that the mean expression levels for each gene in the wild-type subpopulation of embryos in each measurement ranged between 0 and 1, as described above for the gap gene measurement.
Quantitative comparison of gap protein levels across genotypes
As before 5, expression levels in mutants were measured quantitatively to enable comparison of their levels to those found in wild-type. To that end, homozygous and heterozygous mutants as well as wild-type embryos obtained from each heterozygous gap stock were fixed together, stained together, mounted together in a random order on a single slide and then imaged sequentially in a single session. As indicated above, our normalization of the fluorescence signals of gap genes from all mutant embryos results in comparable wild-type units for each gap gene across heterozygous, homozygous and their internal control of balancer over balancer (2xGap).
Genotype and time-stamp assignments
In order to sort out genotypes for embryos in the gap data, we first assigned each embryo with its time stamp estimation according to the progression of cellularization front 21,43,44. Next, we pooled embryos from a short time window together and segregated the heterozygous null embryos by threshold, since they were all naturally separable, and used automatic Kmean clustering, with k=2 for separating the heterozygous from the wild-type (balancer over balancer). We repeated this process with overlapping time windows, such that every embryo was assigned with a genotype 5 times, and the most likely genotype was selected. Embryos that showed ambiguous genotype according to repeated assignments were excluded. The resulting genotype proportion largely matches the mendelian expectation under the genetic conditions involved (25% wt, 25% homozygous null and 50% heterozygous mutants, except for 1xgt crossed with1xgt resulting in 50% wt and 25% of each heterozygous and homozygous mutants due to dosage compensation of the Gt protein in males, since gt resides on the X chromosome). For the Eve data we used a single time window (50±5min into nc14) and assigned genotype using kmeans with k=3.
Identifying eve peaks and troughs
Peak positions were programmatically identified per embryo as local maximum expression for a maximum of N peaks along the main trunk, with for all wild-type and mutant embryos. To avoid identification of small fluctuations of expression, a minimal inter-peak-interval was defined as ~3–4 cells. Additionally, heterozygous nulls profiles were less smooth, which often resulted in splitting a single clear major peak to 2 or more adjacent sub-peaks and were therefor slightly smoothed (by 2% egg length) to best identify the location of maximal expression. To identify eve troughs, the profiles were inverted, and an identical process was performed for . For the homozygous null data, a minimal peak prominence was also defined to avoid identification of very small fluctuations in expression as troughs.
Since in all the homozygous mutants the number of stripes and their locations varied across the population of embryos, the assignment of the serial number of a null stripe was performed as follows: after peak identification, the subset of embryos exhibiting the maximal number of stripes were pooled, and the mean position of each null stripe was calculated from this subset. The remaining embryos showing a partial set of stripes were assigned with a serial number per stripe according to its minimal distance from all the possible stripes in that genotype.
Estimating positional error and position displacement of Eve stripes
Positional error of eve is defined as the standard deviation of eve peak (or troughs) locations across the population of embryos of the same genotype. The displacement was defined only for the mutant embryos, as the distance between the stripe position of an individual mutant embryo from the mean position of the same stripe in the mutant. Therefor the error of the displacement of a given stripe is the positional error of that stripe. Since for the nulls stripes identity was unclear, Figures 1 and S1 display the minimal displacement from all stripes. Positional error measured at the gap level was performed for a single gene, 3 or 4 genes as previously described 13,14.
Estimating deviations from wild-type levels of gap proteins along time
To estimate the deviations from wild-type expression in mutant expression along time and across the egg we reconstructed the mean expression for each genotype using a sliding window of 8 min, such that the mean expression at any minute along nuclear cycle 14 was computed from embryos with time stamps of ±4 min around that time. The earliest time point for which this mean level was reliably estimated for all genotypes was 10 min, and due to the nature of the sliding window, the latest time point in the time series is 56 min (including embryos from 52–60 min into nc 14). After reconstructing this time series for each of the genotypes, the mean levels of the wild-type were subtracted from the mean levels of the mutant, such that positive differences indicate overexpression in the mutants (red shades in the kymographs of Figure 2), and negative differences indicate reduced expression of the mutants (blue shades) compared with the wild-type level at any position along time:
To estimate the noise level of expression intensity in our measurement, we bootstrapped the wild-type time series (n=400 repeats) and computed the difference between pairs of its resampled versions. Examples for these 200 resampled kymographs for the 2xGap are displayed at the leftmost column of Figure 2 for each measurement of a single gap gene manipulation. The noise level for each measurement session was estimated as ±2 standard deviations of the resampled difference of 2xGap per kymograph for all its position and times. The resulting difference, , below that level is below the limit of our measurement accuracy (demonstrated as grayed out pixels in Figure S2). The maximal of these standard deviations across all 16 kymographs for the 2xGap is 0.05 of the wild-type maximal expression per gene. We therefore use 0.1 () as the noise level limit when comparing the mean level found in wild-type and the mutants (grayed area around the unity line in Figures 4A, 4D, 4E, and S4A–D). This procedure was only computed for the gap data and not the eve data, since in this work we only used eve data for its positional ques and not its intensity.
Estimating positional error in gap gene expression
The positional error computed for the gap genes is taken from Dubuis et al. (2013)14. When computed for a single gap gene, , the positional error, , at position is given by:
Where is the derivative of along the egg and is the standard deviation of the expression magnitude of gene at position along the egg. This calculation is generalized for genes as follows:
With being the covariance matrix of the n genes joint expression, and is the inverse of . In the special case of n=1, , the standard deviation of the expression magnitude of the single gene in stake .
PCA of the wild-type repertoire of eve activation code words
Principal component analysis (PCA) was performed on gap gene expression quadruplets (i.e., code words) from individual wild-type embryos with timestamps between 38–46 min into nc14. PCA is performed on code words identified at the positions of mean Eve peaks in wild-type embryos from each internal control separately. To explore the similarity between the wild-type and the mutant gap code words that activate eve stripe enhancers, we projected the gap quadruplets from any other genotype onto the first 2 PCs obtained from the wild-type. Similar results were obtained when the PCA was performed on code words pooled from all internal control datasets (as aforementioned), or on code words from all positions along 10–90%EL in wild-type embryos from 6–60 min into NC 14.
–analysis
To estimate the novelty of gap code words that activate eve in the gap mutants we resorted to the per-gene measure 5, used to estimate the distance of a gap quadruplet from the distribution of gap quadruplets found at a given position along the egg:
With K =4 the number of genes used, are Hb, Kr, Gt and Kni levels at a given position , is the respective mean level across embryos, and is the 4X4 covariance matrix of . Since estimating the covariance is extremely sensitive to the measurement noise, we made sure that our gap data recaptures the 1% accuracy levels previously reported 5,13,14, as can be seen according to the for our internal control within the main trunk (Figure S2).
For the mutants, we took the minimal per-gene compared with the wild-type reference distributions at any position along the egg. Where this distance exceeded the maximal distance found for a wild-type code word from the distribution of code words found at its position across a population of wild-type embryos, the mutant code word is marked as non-canonical, or novel to the wild-type repertoire. Even regardless of this distance cutoff, the per-gene deviates from its baseline mainly for the homozygous null mutants, and only regions of the embryo that overlap with the wild-type expression domain of the removed gene. Note that for Kr nulls the correction capacity of the gap network is near perfect such that at any position along the egg canonical code words are composed, even at the absence of Kr.
Average nuclear response to genetic manipulation
In order to estimate the cellular response to the genetic manipulation in stake, we used the deviation from the wild-type expression, , and took the square-root of its average squared values over all positions and times, such that both increased expression and decreased expression relative to the wild-type receive equal weight, and each kymograph gets an estimate of response intensity within NC 14:
Where n is the number of pixels over all times and position per kymograph (n=800*47). To control for this value from each mutant kymograph, it is compared with obtained from all the bootstrapped versions of its internal control of 2xGap (n=200*800*47).
For each Kymograph we also calculated the spatial response by taking the square-root of the averaged square deviation across time, for each position:
Similarly, here we compare the resulting value per position and gene with that obtained from all the bootstrapped versions of its internal control (n=47*200).
Quantification and statistical analysis
Gap gene protein expression in mutant backgrounds alongside with their internal control (2xgap) was measured throughout nuclear cycle 14. Embryos from a given heterozygous-null gap stock were simultaneously fixed and stained for the 4 trunk gap gene proteins, such that all 3 genotypes from a given heterozygous gap gene stock were imaged sequentially in a single session. We imaged n = 749 embryos from the 1xhb stock, out of which 155 are identified as 2xhb embryos, 391 as heterozygous to hb null (1xhb) and 203 as homozygous to hb null (0xhb); n = 1186 embryos from the 1xgt stock, out of which 460 are identified as 2xgt embryos, 441 are 1xgt, and 285 are 0xgt; n = 702 embryos from the 1xkni stock, out of which 179 are identified as 2xkni embryos, 350 are 1xkni, and 173 0xkni; and n = 479 embryos from the 1xKr stock, out of which 89 are identified as 2xKr embryos, 256 as 1xKr, as 134 0xKr.
Eve protein levels were simultaneously labeled along with the gap gene under manipulation per stock, to enable genotype identification. Embryos from a given heterozygous-null gap stock were fixed, stained and imaged sequentially, focusing on embryos within the time window of 45–55 min into nc 14. We imaged n = 53 embryos from the 1xhb stock, out of which 12 are identified as 2xhb, 27 as 1xhb and 14 as 0xhb; n = 77 embryos from the 1xgt stock, out of which 40 are identified as 2xgt, 18 as 1xgt and 19 as 0xgt; n = 71 embryos from the 1xkni stock, out of which 18 are identified as 2xkni, 34 as 1xkni and 19 as 0xkni; and n = 107 embryos from the 1xKr stock, out of which 23 are identified as 2xKr, 49 as 1xKr and 35 as 0xKr.
Supplementary Material
Key resources table.
| REAGENT or RESOURCE | SOURCE | IDENTIFIER |
|---|---|---|
| Experimental models: Organisms/strains | ||
| D. melanogaster: Oregon-R, wild-type | Lab stock | Flybase: FBst1000077 |
| D. melanogaster: hb mutation | Eric F. Wieschaus (Princeton) | N/A |
| D. melanogaster: Kr mutation | Eric F. Wieschaus (Princeton) | N/A |
| D. melanogaster: kni mutation | Thomas Gregor (Princeton) (ML CRISPR) | N/A |
| D. melanogaster: gt mutation | Thomas Gregor (Princeton) (ML CRISPR) | N/A |
| Antibodies | ||
| Gap staining antibodies (guinea pig anti-Gt) | Eric F. Wieschaus (Princeton) | N/A |
| Gap staining antibodies (rat anti-Kni) | Eric F. Wieschaus (Princeton) | N/A |
| Gap staining antibodies (rabbit anti-Kr) | Eric F. Wieschaus (Princeton) | N/A |
| Gap staining antibodies (mouse anti-Hb) | Eric F. Wieschaus (Princeton) | N/A |
| Secondary antibodies Gap staining: Alexa-514 (rabbit) | Invitrogen, Grand Island, NY | Cat# A31558 |
| Secondary antibodies Gap staining: Alexa-568 (guinea pig) | Invitrogen, Grand Island, NY | Cat# A11075 |
| Secondary antibodies Gap staining: Alexa-647 (Rati | Invitrogen, Grand Island, NY | Cat # A21247 |
| Secondary antibodies Gap staining: Alexa-430 (mouse) | Invitrogen, Grand Island, NY | Catalog # A-11063 |
| Eve staining antibodies (mouse anti-Eve) | Eric F. Wieschaus (Princeton) | N/A |
| Eve staining antibodies (guinea pig anti-Gt) | Eric F. Wieschaus (Princeton) | N/A |
| Eve staining antibodies (guinea pig anti-Kr) | Eric F. Wieschaus (Princeton) | N/A |
| Eve staining antibodies (guinea pig anti-Hb) | Eric F. Wieschaus (Princeton) | N/A |
| Eve staining antibodies (guinea pig anti-Kni) | Eric F. Wieschaus (Princeton) | N/A |
| Secondary antibodies Eve staining: Alexa-647 (mouse) | Invitrogen, Grand Island, NY | Cat# PIA32728 |
| Secondary antibodies Eve staining: Alexa-568 (guinea pig) | Invitrogen, Grand Island, NY | Cat# A11075 |
| Software and algorithms | ||
| MATLAB R21B | MathWorks | https://www.mathworks.com |
| Custom MATLAB code | This paper | https://zenodo.org/record/8341410 |
Acknowledgements
We thank Marianne Bauer, Paul Francois, Melody Merle, Mariela Petkova, and Benjamin Zoller for comments, discussion, and suggestions. This work was supported in part by the U.S. National Science Foundation, through the Center for the Physics of Biological Function (PHY-1734030), and by National Institutes of Health Grants R01GM097275, U01DA047730, and U01DK127429 (all TG). ML is the recipient of a Human Frontier Science Program fellowship (LT000852/2016-L), EMBO long-term postdoctoral fellowship (ALTF 1401-2015), and the Rothschild postdoctoral fellowship. EW’s research is in part supported by funds from the Howard Hughes Medical Institute.
Footnotes
Declaration of interests
The authors declare no competing interests.
Contact for reagent and resource sharing
Further information and requests for resources and reagents should be directed to and will be fulfilled by the Lead Contact, Thomas Gregor (tg2@princeton.edu).
Publisher's Disclaimer: This is a PDF file of an unedited manuscript that has been accepted for publication. As a service to our customers we are providing this early version of the manuscript. The manuscript will undergo copyediting, typesetting, and review of the resulting proof before it is published in its final form. Please note that during the production process errors may be discovered which could affect the content, and all legal disclaimers that apply to the journal pertain.
REFERENCES
- 1.Biggin MD (2011). Animal transcription networks as highly connected, quantitative continua. Dev Cell 21, 611–626. 10.1016/J.DEVCEL.2011.09.008. [DOI] [PubMed] [Google Scholar]
- 2.Grosveld F, Staalduinen J, and Stadhouders R (2021). Transcriptional Regulation by (Super)Enhancers: From Discovery to Mechanisms. Annu Rev Genomics Hum Genet 22, 127–146. 10.1146/annurev-genom-122220-093818. [DOI] [PubMed] [Google Scholar]
- 3.Hosokawa H, and Rothenberg EV (2021). How transcription factors drive choice of the T cell fate. Nat Rev Immunol 21, 162–176. 10.1038/s41577-020-00426-6. [DOI] [PMC free article] [PubMed] [Google Scholar]
- 4.Palii CG, Cheng Q, Gillespie MA, Shannon P, Mazurczyk M, Napolitani G, Price ND, Ranish JA, Morrissey E, Higgs DR, et al. (2019). Single-Cell Proteomics Reveal that Quantitative Changes in Co-expressed Lineage-Specific Transcription Factors Determine Cell Fate. Cell Stem Cell 24, 812–820.e5. 10.1016/j.stem.2019.02.006. [DOI] [PMC free article] [PubMed] [Google Scholar]
- 5.Petkova MD, Tkacik G, Bialek W, Wieschaus EF, G.T., Petkova MD, Tkačik G, Bialek W, Wieschaus EF, and Gregor T (2019). Optimal decoding of cellular identities in a genetic network. Cell 176, 844–855.e15. 10.1016/j.cell.2019.01.007. [DOI] [PMC free article] [PubMed] [Google Scholar]
- 6.Lu P, Vogel C, Wang R, Yao X, and Marcotte EM (2007). Absolute protein expression profiling estimates the relative contributions of transcriptional and translational regulation. Nat Biotechnol 25, 117–124. 10.1038/nbt1270. [DOI] [PubMed] [Google Scholar]
- 7.Damante G, Tell G, and Di Lauro R (2000). A unique combination of transcription factors controls differentiation of thyroid cells. In Progress in Nucleic Acid Research and Molecular Biology (Academic Press; ), pp. 307–356. [DOI] [PubMed] [Google Scholar]
- 8.Mitchell PJ, and Tjian R (1989). Transcriptional regulation in mammalian cells by sequence-specific DNA binding proteins. Science 245, 371–378. 10.1126/science.2667136. [DOI] [PubMed] [Google Scholar]
- 9.Scholes C, DePace AH, and Sánchez Á (2017). Combinatorial Gene Regulation through Kinetic Control of the Transcription Cycle. Cell Syst 4, 97–108.e9. 10.1016/j.cels.2016.11.012. [DOI] [PMC free article] [PubMed] [Google Scholar]
- 10.Gregor T, Garcia HG, and Little SC (2014). The embryo as a laboratory: quantifying transcription in Drosophila. Trends in Genetics 30, 364–375. 10.1016/j.tig.2014.06.002. [DOI] [PMC free article] [PubMed] [Google Scholar]
- 11.Jaeger J (2011). The gap gene network. Cellular and Molecular Life Sciences 68, 243–274. 10.1007/s00018-010-0536-y. [DOI] [PMC free article] [PubMed] [Google Scholar]
- 12.Lawrence PA (1992). The making of a fly: The genetics of animal design (Blackwell Scientific Publications, Oxford, U.K.) 10.1002/mrd.1080370116. [DOI] [Google Scholar]
- 13.Tkačik G, Dubuis JO, Petkova MD, and Gregor T (2015). Positional information, Positional error, and readout precision in morphogenesis: A mathematical framework. Genetics 199, 39–59. 10.1534/genetics.114.171850. [DOI] [PMC free article] [PubMed] [Google Scholar]
- 14.Dubuis JO, Tkačik G, Wieschaus EF, Gregor T, and Bialek W (2013). Positional information, in bits. Proceedings of the National Academy of Sciences 110, 16301–16308. 10.1073/pnas.1315642110. [DOI] [PMC free article] [PubMed] [Google Scholar]
- 15.Fujioka M, Emi-Sarker Y, Yusibova GL, Goto T, and Jaynes JB (1999). Analysis of an even-skipped rescue transgene reveals both composite and discrete neuronal and early blastoderm enhancers, and multi-stripe positioning by gap gene repressor gradients. Development 126, 2527–2538. 10.1242/dev.126.11.2527. [DOI] [PMC free article] [PubMed] [Google Scholar]
- 16.Schroeder MD, Greer C, and Gaul U (2011). How to make stripes: deciphering the transition from non-periodic to periodic patterns in Drosophila segmentation. Development 138, 3067–3078. 10.1242/dev.062141. [DOI] [PMC free article] [PubMed] [Google Scholar]
- 17.Graham PL, Fischer MD, Giri A, and Pick L (2021). The fushi tarazu zebra element is not required for Drosophila viability or fertility. G3 (Bethesda) 11. 10.1093/G3JOURNAL/JKAB300. [DOI] [PMC free article] [PubMed] [Google Scholar]
- 18.Small S, Blair A, and Levine M (1992). Regulation of even-skipped stripe 2 in the Drosophila embryo. EMBO J 11, 4047–4057. 10.1002/j.1460-2075.1992.tb05498.x. [DOI] [PMC free article] [PubMed] [Google Scholar]
- 19.Small S, Blair A, and Levine M (1996). Regulation of Two Pair-Rule Stripes by a Single Enhancer in theDrosophilaEmbryo. Dev Biol 175, 314–324. 10.1006/dbio.1996.0117. [DOI] [PubMed] [Google Scholar]
- 20.Small S, Kraut R, Hoey T, Warrior R, and Levine M (1991). Transcriptional regulation of a pair-rule stripe in Drosophila. Genes Dev 5, 827–839. 10.1101/gad.5.5.827. [DOI] [PubMed] [Google Scholar]
- 21.Dubuis JO, Samanta R, and Gregor T (2013). Accurate measurements of dynamics and reproducibility in small genetic networks. Mol Syst Biol 9, 639. 10.1038/msb.2012.72. [DOI] [PMC free article] [PubMed] [Google Scholar]
- 22.Edgar BA, Weir MP, Schubiger G, and Kornberg T (1986). Repression and turnover pattern fushi tarazu RNA in the early Drosophila embryo. Cell 47, 747–754. 10.1016/0092-8674(86)90517-9. [DOI] [PubMed] [Google Scholar]
- 23.Lehmann R, and Nüsslein-Volhard C (1987). hunchback, a gene required for segmentation of an anterior and posterior region of the Drosophila embryo. Dev Biol 119, 402–417. 10.1016/0012-1606(87)90045-5. [DOI] [PubMed] [Google Scholar]
- 24.Wieschaus E, Nusslein-Volhard C, and Kluding H (1984). Krüppel, a gene whose activity is required early in the zygotic genome for normal embryonic segmentation. Dev Biol 104, 172–186. 10.1016/0012-1606(84)90046-0. [DOI] [PubMed] [Google Scholar]
- 25.Nüsslein-Volhard C, and Wieschaus E (1980). Mutations affecting segment number and polarity in Drosophila. Nature 287, 795–801. 10.1038/287795a0. [DOI] [PubMed] [Google Scholar]
- 26.Staller MV, Fowlkes CC, Bragdon MDJ, Wunderlich Z, Estrada J, and DePace AH (2015). A gene expression atlas of a bicoid-depleted Drosophila embryo reveals early canalization of cell fate. Development 142, 587–596. 10.1242/dev.117796. [DOI] [PMC free article] [PubMed] [Google Scholar]
- 27.Surkova S, Golubkova E, Manu, Panok L, Mamon L, Reinitz J, and Samsonova M (2013). Quantitative dynamics and increased variability of segmentation gene expression in the Drosophila Krüppel and knirps mutants. Dev Biol 376, 99–112. 10.1016/j.ydbio.2013.01.008. [DOI] [PubMed] [Google Scholar]
- 28.Waddington CH (1942). Canalization of Development and the Inheritance of Acquired Characters. Nature 150, 563–565. 10.1038/150563a0. [DOI] [PubMed] [Google Scholar]
- 29.Janssens H, Crombach A, Richard Wotton K, Cicin-Sain D, Surkova S, Lu Lim C, Samsonova M, Akam M, and Jaeger J (2013). Lack of tailless leads to an increase in expression variability in Drosophila embryos. Dev Biol 377, 305–317. 10.1016/j.ydbio.2013.01.010. [DOI] [PMC free article] [PubMed] [Google Scholar]
- 30.Jaeger J, Blagov M, Kosman D, Kozlov KN, Manu, Myasnikova E, Surkova S, Vanario-Alonso CE, Samsonova M, Sharp DH, et al. (2004). Dynamical analysis of regulatory interactions in the gap gene system of Drosophila melanogaster. Genetics 167, 1721–1737. 10.1534/genetics.104.027334. [DOI] [PMC free article] [PubMed] [Google Scholar]
- 31.Bieler J, Pozzorini C, and Naef F (2011). Whole-embryo modeling of early segmentation in drosophila identifies robust and fragile expression domains. Biophys J 101, 287–296. 10.1016/j.bpj.2011.05.060. [DOI] [PMC free article] [PubMed] [Google Scholar]
- 32.Seyboldt R, Lavoie J, Henry A, Vanaret J, Petkova MD, Gregor T, and Francois P (2022). Latent space of a small genetic network: Geometry of dynamics and information. Proc Natl Acad Sci U S A 119. 10.1073/PNAS.2113651119/-/DCSUPPLEMENTAL. [DOI] [PMC free article] [PubMed] [Google Scholar]
- 33.Galupa R, Alvarez-Canales G, Borst NO, Fuqua T, Gandara L, Misunou N, Richter K, Alves MRP, Karumbi E, Perkins ML, et al. (2023). Enhancer architecture and chromatin accessibility constrain phenotypic space during Drosophila development. Dev Cell 58, 51–62.e4. 10.1016/J.DEVCEL.2022.12.003. [DOI] [PMC free article] [PubMed] [Google Scholar]
- 34.Gloor H (1950). Schädigungsmuster eines Letalfaktors (Kr) von Drosophila melanogaster. Arch. Jul. Klaus Stiftung 29, 277–287. [Google Scholar]
- 35.Kozlov K, Surkova S, Myasnikova E, Reinitz J, and Samsonova M (2012). Modeling of Gap Gene Expression in Drosophila Kruppel Mutants. PLoS Comput Biol 8. 10.1371/journal.pcbi.1002635. [DOI] [PMC free article] [PubMed] [Google Scholar]
- 36.Finn EH, and Misteli T (2019). Molecular basis and biological function of variability in spatial genome organization. Science (1979) 365, eaaw9498. 10.1126/science.aaw9498. [DOI] [PMC free article] [PubMed] [Google Scholar]
- 37.Stadhouders R, Filion GJ, and Graf T (2019). Transcription factors and 3D genome conformation in cell-fate decisions. Nature 569, 345–354. 10.1038/s41586-019-1182-7. [DOI] [PubMed] [Google Scholar]
- 38.Birchler JA, Riddle NC, Auger DL, and Veitia RA (2005). Dosage balance in gene regulation: biological implications. Trends in Genetics 21, 219–226. 10.1016/j.tig.2005.02.010. [DOI] [PubMed] [Google Scholar]
- 39.Chong J, Amourda C, and Saunders TE (2018). Temporal development of Drosophila embryos is highly robust across a wide temperature range. J R Soc Interface 15, 20180304. 10.1098/rsif.2018.0304. [DOI] [PMC free article] [PubMed] [Google Scholar]
- 40.Frankel N, Davis GK, Vargas D, Wang S, Payre F, and Stern DL (2010). Phenotypic robustness conferred by apparently redundant transcriptional enhancers. Nature 466, 490–493. 10.1038/nature09158. [DOI] [PMC free article] [PubMed] [Google Scholar]
- 41.Lucchetta EM, Lee JH, Fu LA, Patel NH, and Ismagilov RF (2005). Dynamics of Drosophila embryonic patterning network perturbed in space and time using microfluidics. Nature 434, 1134–1138. 10.1038/nature03509. [DOI] [PMC free article] [PubMed] [Google Scholar]
- 42.Levo M, Raimundo J, Yang Bing X, Sisco Z, Batut PJ, Ryabichko S, Gregor T, and Levine MS (2022). Transcriptional coupling of distant regulatory genes in living embryos. | Nature | 605. 10.1038/s41586-022-04680-7. [DOI] [PMC free article] [PubMed] [Google Scholar]
- 43.Gregor T, Tank DW, Wieschaus EF, and Bialek W (2007). Probing the Limits to Positional Information. Cell 130, 153–164. 10.1016/j.cell.2007.05.025. [DOI] [PMC free article] [PubMed] [Google Scholar]
- 44.Lecuit T, Samanta R, and Wieschaus E (2002). slam encodes a developmental regulator of polarized membrane growth during cleavage of the Drosphila embryo. Dev Cell 2, 425–436. 10.1016/S1534-5807(02)00141-7. [DOI] [PubMed] [Google Scholar]
- 45.Liu F, Morrison AH, and Gregor T (2013). Dynamic interpretation of maternal inputs by the Drosophila segmentation gene network. Proc Natl Acad Sci U S A 110, 6724–6729. 10.1073/pnas.1220912110. [DOI] [PMC free article] [PubMed] [Google Scholar]
Associated Data
This section collects any data citations, data availability statements, or supplementary materials included in this article.
Supplementary Materials
Data Availability Statement
All processed data and custom software codes to generate all figures are available at https://zenodo.org/record/8341410. Raw confocal imaging data are available upon request.
Any additional information required to reanalyze the data reported in this work paper is available from the Lead Contact upon request.