

Abstract
Cells cultured in 3D fibrous biopolymer matrices exert traction forces on their environment that induce deformations and remodeling of the fiber network. By measuring these deformations, the traction forces can be reconstructed if the mechanical properties of the matrix and the force-free matrix configuration are known. These requirements severely limit the applicability of traction force reconstruction in practice. In this study, we test whether force-induced matrix remodeling can instead be used as a proxy for cellular traction forces. We measure the traction forces of hepatic stellate cells and different glioblastoma cell lines and quantify matrix remodeling by measuring the fiber orientation and fiber density around these cells. In agreement with simulated fiber networks, we demonstrate that changes in local fiber orientation and density are directly related to cell forces. By resolving Rho-kinase (ROCK) Inhibitor-induced changes of traction forces and fiber alignment and density in hepatic stellate cells, we show that the method is suitable for drug screening assays. We conclude that differences in local fiber orientation and density, which are easily measurable, can be used as a qualitative proxy for changes in traction forces. The method is available as an open-source Python package with a graphical user interface.
Graphical Abstract

Introduction
Actin and myosin are two highly abundant proteins in most cells, which enables them to generate forces for contraction (1–3) and a wide range of other essential biological processes including cell division (4, 5), mechano-sensing (6, 7), migration (8, 9), or wound closure (10, 11). Pathological processes such as inflammatory diseases (12), fibrosis (13–15), and epithelial-to-mesenchymal transition in cancer (16) are often accompanied by changes in cellular force generation.
To study cellular force generation in vitro, different qualitative and quantitative methods have been developed. For traction force measurements under 2D cell culture conditions, cells can be seeded on a thin, flexible silicone membrane. Cellular forces cause the membrane to wrinkle, from which the location and magnitude of cell tractions can be estimated (17–19). Quantitative and locally highly resolved 2D maps of traction forces are obtained by plating cells on flat, elastic polyacrylamide hydrogels, with beads embedded near the gel surface.
From the bead movements that arise when cells are trypsinized or when cell forces are relaxed with pharmacological agents (e.g using cytochalasin D), the cell forces can be reconstructed (20–22).
For traction force measurements under 3D cell culture conditions, the shrinkage of a floating collagen gel with embedded cells can be measured over time. The speed and extent of collagen gel shrinkage gives a rough qualitative measure of the overall cellular force generation (23).
It is also possible to obtain a local map of traction forces generated by cells in a 3D collagen gel (24, 25). However, 3D traction force measurements (3D TFM) in highly non-linear biopolymer hydrogels, such as collagen gels, are technically demanding, as a relatively large volume of the matrix surrounding a cell must be repeatedly imaged using confocal microscopy. Moreover, the mechanical behaviour of the extracellular matrix must be measured and described by a suitable material model. This in itself is challenging: when cells exert traction forces on the fibers of a 3D network (e.g. collagen or fibrin), some fibers buckle, others align in force direction (26, 27), and this in turn may cause a local softening or stiffening of the matrix (25, 28). In addition, 3D force evaluation requires significant computational effort to solve an inverse, mathematically ill-posed nonlinear problem using finite element analysis. Due to their complexity, 3D force measurements are rarely performed.
In this study, we developed a method to quantify the degree of local fiber orientation and density around contractile cells in 3D fiber networks. Based on computational simulations of fiber networks as well as cell experiments in collagen networks, we demonstrate that higher fiber alignment and density correlate with higher cell contractility. We exploit this correlation to measure and interpret fiber orientation and density around contractile cells as a proxy for cellular forces in 3D collagen networks. Compared to regular 3D traction force measurements, this method requires 3D imaging of smaller volumes, no additional imaging after drug-induced relaxation, no knowledge of the rheological properties of the extracellular matrix, and much less computational power for data analysis (Fig. 1). The method can be applied as a drugscreening assay and is available as an open source Python package (29).
Fig. 1.

Comparison of traction force microscopy vs. quantification of matrix remodelling fiber alignment and fiber intensity
Results
Quantification and validation of fiber alignment
In this study, we embed calcein-stained hepatic stellate cells in a 3D collagen type I hydrogel and acquire image stacks of the fiber network around individual cells using second harmonic generation microscopy or confocal reflection microscopy (Fig. 2a, SI Fig. 1,3, SI Video 15,16). The direction of the collagen fibers (Fig. 2b) is determined using structure tensor analysis (30–35) as explained in Methods. We then compute the angular deviation between the fiber direction and the vector pointing to the cell center, and transform the angular deviation into an orientation value (Eq. 6) that ranges from −1 (fibers are oriented perpendicular to the center-line) to +1 (fibers are oriented parallel to the center-line (Fig. 2c).
Fig. 2. Analysis of fiber alignment:

a, Maximum intensity projection of the collagen fiber structure around individual hepatic stellate cells imaged using second harmonic generation microscopy. The cell outline is determined from calcein-labeled images (inset). Black lines indicate lines of equal distances from the cell outline (“shells”). b, Fiber orientation vectors calculated using structure tensor analysis (Eq. 2). Arrow length is scaled by the coherence (anisotropy) of the structure (longer arrows indicate higher degree of alignment) (Eq. 5). c, Orientation field showing the magnitude of the angle between fiber orientation vectors and the vector pointing to the center of the segmented cell, normalized according to Eq. 6, as illustrated in (d). d, Fibers perpendicular to the vector pointing to the center of the segmented cell have an orientation of −1, fibers parallel to the cell vector have an orientation of +1, and fibers with an angle of ±45° have an orientation of 0.
To validate the analysis, we generate artificial images of networks with radially or concentrically aligned fibers of varying thickness and density (Fig. 3a). Additionally, we simulate diagonal line networks and images containing only Gaussian noise. The cell is represented by a sphere at the image center. As expected, for radially oriented line networks our method yields an orientation close to unity. Gaussian noise and diagonal lines both show an orientation close to 0, and concentric line networks show an orientation close to −1 (Fig. 3b).
Fig. 3. Validation of fiber orientation analysis:

a, Fiber networks are simulated around circular non-contractile inclusions as Gaussian noise (representing dense, random fibers below the microscope’s resolution limit), or as diagonal, radial, or concentric lines. b, The resulting mean values of fiber orientation corresponding to the geometries of the simulated fiber networks c, A non-contractile inclusion is placed at the center of a confocal image of a 1.0 mg/m collagen gel polymerized at room temperature (left). Fiber orientation is compared to collagen gels containing contractile hepatic stellate cells after four days of culture (right). d, The mean fiber orientation confirms that collagen gels show random fiber orientation and that contractile cells induce fiber alignment (mean±sd, n = number of analyzed images).
To verify that fiber orientation is indeed a result of cell contractility and not an intrinsic property of the extracellular matrix (ECM), we analyze confocal reflection images of collagen gels containing no cells (Fig. 3c). These fiber networks show a near random orientation (0.027±0.050; mean±sd). In contrast, fibers in collagen gels (1 mg/ml) containing hepatic stellate cells (HSCs) after four days of culture are aligned towards the cell center, with a pronounced increase in mean orientation (0.286±0.117; Fig. 3d).
Fiber networks around contractile cells
To investigate how contractile forces generated by cells give rise to spatial profiles of the fiber network orientation values, we simulate different cell-ECM interactions. First, we generate a disordered network of elastic fibers with no preferred orientation, mimicking an unloaded ECM. We then apply forces of various magnitudes in a dipole or quadrupole arrangement to mimic contractile cells (Fig. 4a).
Fig. 4. Fiber network model:

a, Fiber network simulations (green) with contractile cells modelled as force dipoles (top, 2 point forces of 5000 pN, distance approx. 125 px) or quadrupoles (bottom, 4 point of 5000 pN, distance approx. 125 px). Contractility refers to the sum of individual point forces. b, Angular distribution of fiber orientation around a dipole or quadrupole (light green, cones bin width 5°), or for a cell-free network (gray). c, Fiber networks (black/white) and resulting orientation fields (blue/red) for a series of differently contractile quadrupoles. The mean fiber orientation (d, left) and fiber intensity close to the cell surface (d, right) increases with contractility similarly for both dipoles and quandrupoles. e) Fiber orientation (left) and fiber intensity (right) as a function of the distance from the outer cell contour, for dipoles (gray) and quadrupoles (green) and different contractilities.
As a result, fiber network densification and reorientation emerge that follow the shape of the force dipoles or quadrupoles (Fig. 4a–c). Increased force results in increased orientation and local densification (intensity) (Fig. 4d). Both the orientation and the intensity decrease with the distance from the cell, with orientation decaying more slowly (Fig. 4e). For a given force magnitude, the orientation and intensity values around dipoles and quadrupoles are similar, demonstrating that both scalar representations of force-induced fiber remodeling are largely insensitive to the details of how the forces are spatially arranged.
Cell contractility correlates with fiber alignment and density
Next, we test if the positive, monotonic relationship between cell contractility and the surrounding collagen fiber orientation predicted by our simulated fiber network model as well as by previously published models (26, 27) can be experimentally verified. For this, we measure 3D traction forces (25) of three differently contractile primary glioblastoma cell lines embedded in collagen hydrogels (Fig. 5a, left) (36–39). The WK1 cell line (classical subtype) exhibit larger forces compared to the RN1 (mesenchymal subtype) and JK2 (proneural subtype) cell line (39). As 3D traction force measurements involve confocal imaging of the collagen matrix around each cell, we use the same data set to also evaluate the collagen fiber orientation intensity around the cell surface in distance shells spaced 10 μm apart. To compare measurements of cells obtained at different depths within the collagen gel, which can change the overall brightness of the image, the intensity within the first distance shell is normalized by the average intensity of the two outermost shells (Fig. 2a and SI Fig. 1).
Fig. 5. Cell contractility correlates with collagen fiber orientation and collagen intensity:

a, Contractility, collagen orientation and collagen intensity (mean±se) for three different primary glioma neural stem cell lines (WK1, RN1, JK1). n denotes the number of individual cells. b, Correlation of cell contractility with fiber orientation for three glioma cell lines. P indicates Pearson correlation coefficient. c, Correlation of cell contractility with relative collagen fiber density (as measured from the local image intensity at a distance of 5 μm around the cell outline) for three glioma cell lines. P indicates Pearson correlation coefficient. d, Time evolution of the relative increase in collagen fiber density (from the local image intensity at a distance of 5 μm around the cell outline; mean±se, left) and of the fiber orientation averaged over the image (mean±se, right) over a time course of 8 days after seeding hepatic stellate cells in collagen gels. e, Relative collagen fiber density (left) and fiber orientation (right), averaged over 5 μm wide areas around the cell outline, for different distances from the cell surface, for different days after seeding hepatic stellate cells in collagen gels. Data points represent the mean, shaded areas indicate mean±se. f, Matrix deformations around a representative hepatic stellate cell (left) embedded in 1.0 mg/ml collagen for 3 days. 95 percentile of the matrix deformations calculated over 20 μm wide shells as a function of distance from the deformation epicenter (right). Scalebar indicates 100 μm. Data points represent the mean, shaded areas indicate one standard error around the mean.
Both, collagen orientation and intensity increase with higher contractility (Fig. 5a). Additionally, we observe a statistically significant positive correlation between collagen orientation and contractility of individual cells for all three cell types (Pearson correlation coefficient P=0.61±0.09, mean±sd; Fig. 5b). We also observe a statistically significant positive correlation between collagen intensity and contractility (P=0.48+0.07, mean±sd; Fig. 5c). Although both findings qualitatively confirm the model predictions of a close relationship between contractility, fiber orientation and fiber intensity, the substantial variability in the data and the nonlinear shape of the relationships indicate that fiber orientation or intensity cannot quantitatively predict the contractility of an individual cell.
Matrix remodelling over time
Next, we investigate the time course of matrix remodeling after cell seeding. The orientation and intensity of collagen fibers around HSCs are measured at 1, 3, 6, and 8 days after seeding. We observe that both quantities increase with culture time (Fig. 5d,e). Time-lapse imaging demonstrates that hepatic stellate cells progressively contract and align collagen over time (SI Video 18–21).
Contrary to model predictions, we observe that the fiber orientation radially increases over a distance of 10-15 μm from the cell surface and only begins to decrease at further distances (Fig. 5e, right). This discrepancy may be explained by local details of how cells interact with the surrounding matrix, as well as by fiber remodelling processes e.g. due to proteolytic processes or the secretion of matrix fibers. All of these processes are expected to modulate how the collagen structure locally reorients and remodels in response to local forces. The measured fiber intensities close to the cell surface, however, agree with the model predictions (Fig. 4e). Together, this suggests that for maximum robustness, fiber intensities should best be analyzed close to the cell surface, and fiber orientation should best be analyzed at distances larger than 20 μm away from the cell surface.
Long-range propagation of matrix remodelling for drug-screening assays
In a non-linear fibrous matrix that deforms locally in a non-affine manner, such as collagen or fibrin, matrix deformations propagate over much further distances compared to linear elastic materials (25, 38, 40). To explore the relationship between cell contractility (Fig. 6a,b) and long-range propagation of matrix deformations (Fig. 6c) , fiber orientation (Fig. 6d–f), and fiber density (intensity) (Fig. 6g–i), we measure these parameters for hepatic stellate cells cultured for 2 days in collagen gels. Fiber orientation and intensity are evaluated in intensity projected image stacks around the centered cells (Fig. 6e,h) as well as in 10 μm spaced distance shells up to a distance of 150 μm around the cells (Fig. 6f,i). Cells are cultured in the absence (control) and presence of 10 μM Rho-kinase (ROCK) Inhibitor Y-27632. Rock-inhibition is known to reduce contractile force generation, and the Rock-pathway is of particular interest for liver fibrosis where it has been linked to the activation of hepatic stellate cells (41).
Fig. 6. Matrix remodelling as a drug screening assay:
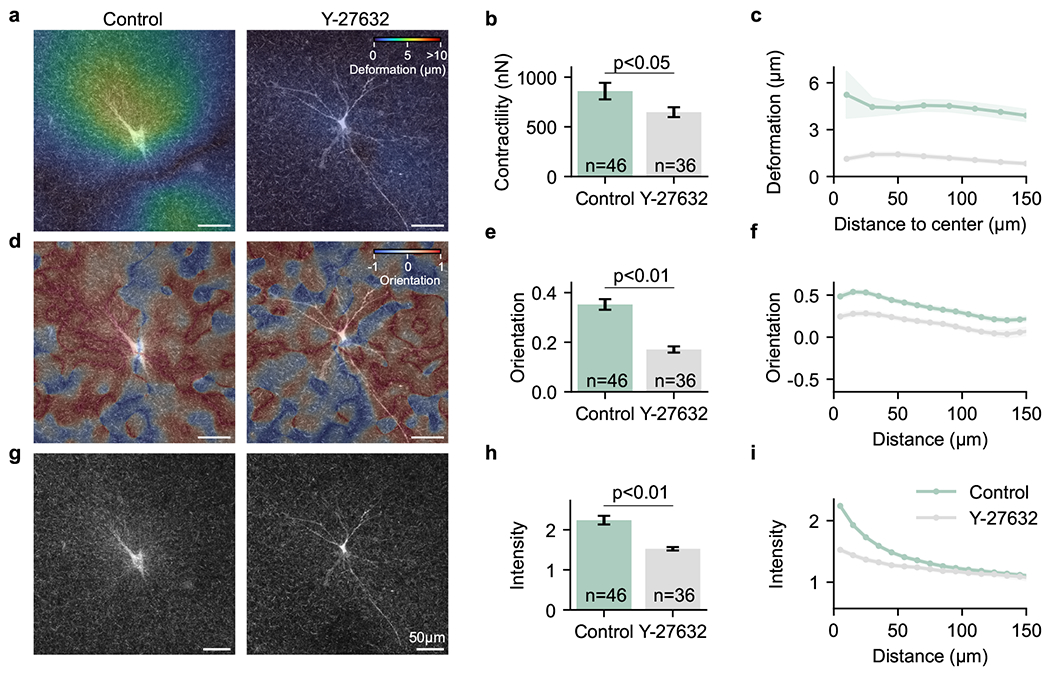
Hepatic stellate cells are embedded in 1.2 mg/ml collagen hydrogels and cultured without (left) and with the addition of 10 μM Rock-Inhibitor Y-27632 (right) for 2 days. a, Images show an overlay of maximum intensity projections of the collagen (20 μm z-height of confocal reflection signal) around the cell and maximum intensity projections of the calcein stained cell. Colormap shows matrix deformations calculated using an optical flow algorithm from images taken before and after actin depolymerization with cytochalasin D (42) for a representative cell for each condition (see Suppl. Fig. 6 for more cells). b, From the 3D matrix deformations, the cell contractility is computed using traction force microscopy for control cells and cells treated with 10 μM Rho-kinase (Rock) Inhibitor (Y-27632). A significantly lower contractility is observed for cells treated with Rock-Inhibitor (mean±se; independent sample t-test). c, 3D Matrix deformations are averaged in 20 μm sized distance shells around the force center. d, Similar to a, color indicates the collagen fiber orientation of control cells and cells treated with 10 μM Rock-Inhibitor. e, Averaged collagen fiber orientation shows significantly lower values for cells treated with Rock-Inhibitor (mean±se; independent sample t-test). f, Fiber orientation is averaged in 10 μm sized distance shells around the cell center. g Similar to a, increased collagen intensity is observed for control cells. h, Averaged collagen intensity (intensity close to the cell surface (10 μM) normalized by the outer collagen intensity) shows a significantly lower value for cells treated with 10 μM Rock-Inhibitor (mean±se; independent sample t-test). i, Fiber intensity (normalized by the outer collagen intensity) is averaged in 10 μm sized distance shells around the cell center. Y-27632 treated cells with lower contractility, fiber orientation and fiber intensity also exhibit pronounced morphological differences compared to the more compact control cells (more cells shown in SI Fig. 6).
We find that matrix deformations propagate over long distances around hepatic stellate cells (Fig. 5f, 6c). Collagen fiber orientations (Fig. 5e, 6f) propagate in a similar manner, in agreement with the simulated fiber network model (Fig. 4e, green line: 20 nN), and also consistent with our findings in glioblastoma cells (SI Fig. 4,5). The modelled intensities (Fig. 4e) and the measured intensities (Fig. 5e, 6i) agree equally well; both decrease faster with distance compared to fiber orientation.
After two days of culture, we find that cells treated with 10 μM Rho-kinase (Rock) Inhibitor (Y-27632) show significantly lower contractile forces compared to control cells (Fig. 6b). In line with this finding, we observe that also the collagen fiber orientation and fiber intensity are significantly (p < 0.01) smaller (Fig. 6, SI Fig. 6). This demonstrates that both fiber orientation and fiber intensity are sensitive to drug-induced changes in cell contractility.
Since measurements of 3D traction forces require the relaxation of cell forces by adding the actin depolymerizing agent cytochalasin D (SI Video 17), we can quantify the residual fiber orientation and intensity in the matrix under force-free conditions. After drug-relaxation, the fiber orientation and intensity relax by approx. 30% (SI Fig. 7).
This indicates the presence of strong remodelling processes already after 2 days of culture, e.g. due to proteolytic activities, plastic deformations, or crosslinking. This is of particular interest for comparing fiber orientation and intensity measurements with traction force microscopy: traction force methods account only for elastically stored forces in the matrix that are released within a finite time period after addition of a force-relaxing drug. By contrast, fiber orientation and intensity measurements report both, elastic and non-elastic (viscous or plastic) matrix deformations.
Estimation of cell-generated forces from the local fiber orientation and and fiber density around cells is not limited to collagen hydrogels, but can also be applied to other fibrous matrices, such as fibrin gels. We observe a similar propagation of fiber orientation and fiber density (SI Fig. 8) for human lung fibroblasts cultured in fibrin gels.
In summary, fiber orientation and fiber intensity around contractile cells can be used for qualitatively estimating cellular force generation in fibrous 3D matrices. The method is particularly suitable for drug screening assays where the absolute values of cell contractility are less relevant and only drug-induced differences in cell contractility are of interest. In contrast to 3D TFM, fiber orientation and fiber intensity measurements are relatively simple. They do not require the addition of a force-relaxing compound, which allows for higher throughput and repeated measurements over time of the same cells or on the same sample. To analyze the fiber images and extract the relevant information, we have developed an open source Python package (29) with a graphical user interface (SI Fig. 9).
Discussion
In this study, we quantify matrix remodeling around contractile cells in 3D fiber matrices by measuring the fiber orientation and fiber density. Using fiber network models and cell experiments in collagen fiber networks, we demonstrate both theoretically and experimentally a correlation between fiber orientation, fiber intensity, and cell contractility. Exploiting this correlation allows us to interpret fiber remodelling as a proxy for cell contractility. We demonstrate that the method can be applied as a drug-screening assay to qualitatively estimate changes in cell contractility. This method does not require knowledge of the matrix mechanical properties, and is experimentally and computationally simpler compared to classical traction force measurements.
Fiber orientation and intensity are both sensitive to changes in cell contractility, but to a different degree. Collagen and fibrin fiber orientation around contracting cells shows long-range propagation, similar to fiber deformation, whereas fiber intensity decreases more rapidly with distance. This implies that when analyzing the far field, fiber orientation - although it is more difficult to quantify than intensity - may provide a more robust measure of cell contractility. However, close to the cell, fiber intensity is more sensitive to cell contractility compared to fiber orientation, which shows a non-monotonic behavior in the form of an initial increase over a ~20 μm distance before it decreases (Fig. 5, 6, SI. Fig. 4). This behavior arises because we compute the fiber orientation relative to the cell center, which averages the contribution of the individual cell protrusions. In addition, accumulated or secreted collagen near the cell surface may also interfere with the orientation analysis.
While a sufficiently large size of the imaged matrix in the horizontal (x,y) plane is important for resolving the far-field, the height (z-direction) of the imaged volume around the cell needs to be sufficiently small. For our analysis, we use maximum intensity projections to incorporate collagen fibers from different layers around individual cells, with a total z-height between 10-50 μm, depending on the cell type. If the z-height of the imaged volume is too large, undeformed collagen outside the cell plane may reduce the overall sensitivity, while for a height that is too small, regions of re-modeled collagen may be missed.
We observe an increased collagen fiber orientation and fiber density when fibroblasts are cultured in collagen gels with increasing concentrations between 0.6 and 2.4 mg/ml (SI Fig. 10). By contrast, the relative increase in collagen intensity close to the cells remains similar between different concentrations. Therefore, the matrix fiber concentration, which sets the matrix stiffness and hence the degree to which the fibers re-orient and remodel in response to forces, needs to be adjusted according to the expected range of contractile cell forces, which in turn is cell-type specific. For the experiments presented in this study, however, we obtained good results for a large range of different cells (HSCs, CAFs, glioma cells, single cells and spheroids) with a single collagen concentration (1.0 - 1.2 mg/ml), suggesting that this concentration is a good starting point when using the method for previously unexplored cell types. In the case of lung fibroblasts in fibrin matrices, a concentration of 3 mg/ml gave satisfactory results comparable to the orientation and density responses seen in collagen.
For different experimental setups and matrices (collagen, fibrin), a suitable window size for the analysis must be chosen. A good starting point for the window size is the pore size of the fiber network. This window size can then be optimized by finding the size at which the orientation value becomes a maximum. A relationship between orientation and window size for a typical example image is shown in (SI Fig. 2). The Python implementation of our method provides an algorithm for automatically determining the optimal window size.
In addition to estimating contractile forces, quantification of altered matrix remodeling may also be of interest for studying disease processes such as fibrosis and cancer (13–15, 43–47). For example, so-called Tumor-Associated Collagen Signatures (TACS) have been introduced as prognostic markers in cancer. The metric TACS-1 denotes an increased accumulation of collagen around the tumor, which is related to the fiber intensity in our approach. TACS-2 denotes stretched collagen in proximity to the tumor surface as the tumor grows, which is related to the fiber orientation in our approach (13, 43–46, 48). In fibrosis, cells transmit mechanical signals over long distances, and mechanically mediated cell-cell communication plays a role in the activation of quiescent cells (49–54). In particular the fiber orientation, which is sensitive to matrix remodelling in the far-field, may therefore be a useful metric to explore and quantify fibrotic disease progression and cell-cell-communication (see SI. Fig. 11,12, SI Video 19,21 for breast cancer and liver fibroblasts).
The method can be applied to detect dynamic changes in fiber orientation also on shorter timescales (e.g. minutes or even seconds; SI Fig. 13). This may be of interest for monitoring tensional homeostasis or the development of aligned collagen bands between neighboring cells (SI Video 22).
The method requires a motorized confocal microscope for observing the fiber networks (e.g., collagen or fibrin). The network fibers themselves can be visualized with either fluorescence-, reflection- or 2nd harmonic generation imaging. For the computational analysis, we provide a Python package with a graphical user interface that is easy to install and runs on any standard PC (55). Compared to 3D traction force microscopy, our method allows for higher throughput, since samples do not need to be relaxed by additional drug treatment (e.g. cytochalasin D), and is also suitable for repeated measurements of the same sample over long periods of time or for multicellular spheroids (SI Fig. 12).
Material and Methods
Cell Culture.
Hepatic stellate cells (HSC):
Primary human cryopreserved hepatic stellate cells (HUCLS, Lonza, Basel) are cultured at 37°C, 95% humidity and 5% CO2 in human hepatic stellate cell growth medium (MCST250, Lonza, Basel).
Human Lung Fibroblasts (NHLF):
Normal Human Lung Fibroblasts (NHLF, Lonza, Basel) are cultured at 37°C, 95% humidity and 5% CO2 in Fibroblast Growth Medium (FGM-2, Lonza, Basel).
Glioma neural stem cells (GNS):
Patient-derived glioma neural stem cells (WK1, RN1, JK2) are provided by the QIMR Berghofer Medical Research Institute in Brisbane (36, 37, 56). Cells are cultured at 37°C, 95% humidity and 5% CO2 in knockout DMEM/F-12 medium supplemented with recombinant human EGF (20 ng/ml), recombinant human FGFb (10 ng/ml), glutamine (20 mM/ml), penicillin/streptomycin (100 U/ml) and StemPro neural supplement (20 ng/ml), all from Thermo Fisher Scientific, Waltham, as well as heparin (20 ng/ml, Sigma-Aldrich, St. Louis). Cell culture flasks are coated with 1% growth factor-reduced Matrigel (BD Biosciences, Mississauga) diluted in DMEM medium (high glucose, Thermo Fisher Scientific, Waltham).
Luminal b breast cancer-associated fibroblasts (CAF):
Luminal B breast cancer-associated fibroblasts (CAFs) are isolated from patient tissue samples as previously described (38). Human tissue collection was approved by the Ethics Committee of the Friedrich-Alexander University Erlangen-Nurnberg, Germany (#99_15Bc) in accordance with the World Medical Association Declaration of Helsinki. Cells are cultivated at 37°C, 95% humidity and 5% CO2 in Epicult basal medium with Supplement C (Epicult-C human media kit, Stem Cell Technologies, Vancouver), 5% FCS, 1% penicillin, and 1% streptomycin.
Fiber orientation and intensity analysis.
The fiber orientation and intensity analysis are based on a maximum intensity projected image of the fiber network, and a maximum intensity projected image of the cell, computed from image stacks with variable size (specified below for the individual experiments). Cell area and position are segmented from the cell image using contrast enhancement, Gaussian filtering, morphological operations and Otsu’s thresholding (57). The cell area is excluded from further analysis. The fiber image is contrast-enhanced and Gaussian-filtered (sigma = 0.5 pixel). The predominant matrix fiber orientation is determined based on structure tensor analysis (30–32), implemented similar to previously described approaches (33–35). Specifically, the local structure tensor is computed from the partial derivatives of the pixel intensities in the x-direction and y-direction of the image according to Eq. 1 (30–32). At each pixel p, we use the local structure tensor S0 in a surrounding region by convolution with a Gaussian kernel w. Structural features with much smaller length-scales compared to the size of this region are therefore not contributing to the structure tensor S (Eq. 2). The size of the convolution region is defined by the standard deviation σ (also referred to as window-size) of the Gaussian kernel w (Eq. 3). In this study, the window-size is set in the range of 7-10 μm, which is about twice the collagen pore size of 5.5 μm (SI Fig. 2, values specified below for individual experiments).
| (1) |
| (2) |
| (3) |
From the structure tensor S, we compute the corresponding eigenvectors and that encode the orientation vector of the structures (e.g., of a matrix fiber). The eigenvector belonging to the larger eigenvalue indicates the direction with the highest pixel intensity gradient of the structure, whereas the eigenvector belonging to the smaller eigenvalue points perpendicular to the gradient direction and therefore is the orientation vector of the structure (Eq. 4) (58).
| (4) |
Based on the eigenvalues , we can also quantify the anisotropy of the structure orientation, also referred to as coherence (Eq. 5) (32, 33).
| (5) |
A coherency of 0 indicates isotropically oriented structures, whereas a value of 1 indicates perfect alignment (32). Next, we calculate the angular deviation between the structure orientation and the vector pointing towards the cell center from the magnitude of the scalar product between the two vectors. The angular deviation is then transformed into a orientation value that ranges from −1, if the structure is perpendicular to the center-line, up to 1, if the structure is parallel to the center-line. A value 0 corresponds to a orientation of 45° (Eq. 6).
| (6) |
If the the local intensity or the local coherency of the fiber image is low, the local orientations cannot be computed with high confidence. Therefore, when averaging for each cell, the local values are weighted by the local coherence and the local image intensity according to Eq. 7. In addition, regions near the image borders (40 px) and the cell-occupied area are excluded from the analysis.
| (7) |
Local collagen orientation values around each cell are then averaged over the entire image (Fig. 2c,d, SI Fig. 3), averaged over areas bounded by equidistant lines (“shells”) around the cell contour (Fig. 2a), or averaged over azimuthal bins (“cones”) around the cell center (Fig. 4b, SI Fig. 1). Further, the collagen intensity is normalized to the mean collagen intensity within the two most distant shells. The normalized intensity in the first distance shell, close to the cell surface, is then used as measure of the increased fiber intensity per cell.
Artificial line networks.
Spherical artificial cells (diameter 200 px, n = 30) are placed in images (1024×1024 px) with diagonal, radial and concentric lines around the cell center. The line widths in the images are varied between 1 px and 5 px (step size: 1 px). The number of fibers is varied between 50 and 100 (step size: 10). Additionally, artificial cells are placed in images containing Gaussian noise (n = 30). The orientation analysis is performed using a window-size of 10 px.
Simulated fiber networks.
The fiber network simulations are set up as described in our previous studies (59, 60). Briefly, fibers are polymerized from monomeric units (800 nm long cylindrical segments) in random directions during network formation. Neighboring fibers are interconnected by crosslinks. Fibers segments have a bending stiffness (spring constant) of 7.54·10−16 Nm−1 and an extensional stiffness (spring constant) of 0.055 Nm−1. Cell tractions are simulated by using either a dipole or a quadrupole force loading scheme. Forces of equal magnitude pointing toward the center are applied to all fibers within 2 (dipole) or 4 (quadrupole) regions (10×10 px area). The distance between the loading regions is approximateley 125 px (30 μm). For dipole loading, the contractility values refer to the single force magnitude multiplied by 2, and for quadrupole loading, the values refer to the force magnitude multiplied by 4.
The simulation domain size is 200x200x1 μm for computational feasibility. Fiber orientation analysis is performed using a window-size of 10 px (approx. 2.4 μm). Polar averaging is performed using 5°-sized angle sections (“cones”). The fiber orientation and intensity propagation are evaluated in 20 px (approx. 4.8 μm) spaced distance shells around the cell. The intensity is normalized to the intensity of the two outermost shells within the field of view.
Glioma neural stem cells (GNS) experiments.
Single cell traction force analysis:
Traction force experiments of glioma neural stem cells are conducted as described previously (38). In brief, collagen type I hydrogels are prepared using a 1:2 mass ratio of acid-dissolved rat tail (R) and bovine skin (G1) collagen (Matrix Bioscience, Mörlenbach) dissolved in a solution of 1 vol part NaHCO3, 1 vol part 10×DMEM and 8 vol parts H2O. The pH of the solution is adjusted to 9 by adding NaOH (1 M). Cells and collagen solution are transferred to a 35 mm dish (bottom layer: 1.75 ml collagen prepolymerized for 2.5 minutes, top layer: 250 μl collagen containing 15.0000 cells) and polymerized at 37° for 60 minutes at a final collagen concentration of 1.2 mg/ml. Subsequently, 2 ml of cell culture medium are added, and after an additional waiting time of at least two hours, a cubic volume V=(370 μm)3 (voxel-size 0.72× 0.72×0.74 μm) around individual cells is imaged in confocal reflection and brightfield mode using an upright confocal laser scanning microscope equipped with a 1.0 NA 20x dip-in objective (Leica SP5, Leica, Wetzlar). The relaxed reference state of the collagen is acquired 30 minutes after cytochalasin D treatment (20 μM). Cell-generated forces are calculated from the resulting matrix deformations as described in (38) using the elastic network optimizer Saeno (25). Three independent experiments are conducted for each cell type.
Analysis of matrix remodelling:
Maximum intensity projected images of the collagen fiber network (confocal reflection mode) and the cell outline (brightfield mode) are calculated using 20 μm (z-height) stacks around the cells. Cells are segmented based on the projected brightfield image using Otsu-thresholding (61), and the fiber orientation is calculated from the projected confocal reflection images as described above. The relative increase in collagen fiber intensity around the cell is calculated from the first 10 μm distance shell normalized to the two outermost shells. For the collagen orientation analysis, a window-size of 10 μm is chosen.
Hepatic stellate cells (HSCs) experiments.
Analysis of matrix remodelling (time course analysis, Fig.5d,e):
Collagen type I hydrogels (RAFT Reagent Kit for 3D culture, Lonza, Basel) are prepared on ice to a final collagen concentration of 1.0 mg/ml. The collagen solution is mixed with hepatic stellate cells and transferred to a 96-well plate (μ-Plate, Ibidi, Grafelfing), seeding 4000 HSCs in 200 μl collagen solution per well. Gels are polymerized at room temperature (RT) for 10 minutes, after which 350 μl of HSC-medium is added per well. Prior to imaging, cells are stained with calcein (Celltrace Calcein Red-Orange AM, Invitrogen, Waltham). 100 μl medium is removed from each well and replaced with 100 μl calcein-medium solution for a final calcein concentration of 1.5 μM. Samples are incubated for 15 min at 37°C, gently washed 3 times with medium (leaving a 100 μl medium layer over the gel surface) and covered with 250 μl of fresh medium. Samples are transferred to a multiphoton excitation microscope equipped with a 1.0 NA 25x objective (FVMPE-RS, Olympus, Tokyo). Image stacks (xy= 255×255 μm, 0.318 μm per pixel) are recorded around individual cells using brightfield mode, second-harmonic generation, and calcein fluorescence. For experiments shown in Fig. 5b, a stack height of 70 μm with a z-step of 2 μm is recorded. Cells are segmented based on the projected calcein-stained image, and the fiber orientation is calculated based on the projected confocal reflection image of the surrounding collagen. The collagen orientation and fiber intensities are calculated over 5 μm distance shells and normalized to the intensity of the two outermost shells within the field of view. A window-size of 7 μm is used for the collagen orientation analysis.
Particle image velocimetry (Fig. 5f):
Image stacks around individual cells (xyz = 509×509×148 μm, with a voxel-size of 0.636×0.636×2 μm) are recorded once before and 4 h after actin-depolymerization using 10 μm cytochalasin D (Sigma-Aldrich, St. Louis) using brightfield and second-harmonic generation imaging microscopy. 3D matrix deformations are then calculated between the contracted and the relaxed state of the collagen matrix using 3D Particle Image Velocimetry (29, 62). Here, a window-size of 35 μm together with 60% overlap between neighbouring windows (SI Fig. 14) and a signal-to-noise threshold of 1.3 are used. Deformation fields are drift corrected, and the deformation epicenter is determined as described in (25, 29). In order to minimize bias from noise, we only consider deformations that point ±60° towards the deformation epicenter. We calculate the 95 percentile of absolute matrix deformations over 20 μm distance shells around the cell center. For the data shown in Fig.6c, the force epicenter is used instead of the deformation epicenter.
Single cell traction force analysis (TFM, Fig. 6):
Traction force experiments of hepatic cells are conducted as described in (29, 38). Collagen type I hydrogels are prepared using a 1:2 mass ratio of acid-dissolved rat tail (R) and bovine skin (G1) collagen (Matrix Bioscience, Mörlenbach) that are dissolved in a solution of 1 vol part NaHCO3, 1 vol part 10 × DMEM and 8 vol parts H2O. The pH of the solution is adjusted to a value of 9 by adding NaOH (1 M). 35.000 cells are mixed with 3 ml collagen solution (final collagen concentration of 1.2 mg/ml) and transferred to a 35 mm Petri dish (Greiner AG, Austria) and polymerized at 37° for 60 minutes. Subsequently, 2 ml of cell culture medium containing either 10 μm Rho-kinase (Rock) Inhibitor Y-27632 (Sigma-Aldrich, St. Louis) or identical amounts of PBS (control) are added. Two days after embedding, the medium is replaced (with fresh Rock-Inhibitor or PBS). Prior to imaging, cells are stained with 2 μM calcein AM (Thermo Fisher Scientific, Waltham) and incubated for 20 min. Samples from three independent experiments are imaged with an upright confocal laser scanning microscope (Leica SP5, Leica, Wetzlar) equipped with a 20x dip-in objective (NA 1.0, Leica, Wetzlar) at 37°C and 5% CO2. A cubic volume V=(370 μm)3 is imaged around individual cells in confocal reflectance, brightfield, and fluorescence modes (voxel-size 0.72×072×0.99 μm/pixel). The force-free reference state of the collagen is recorded 30 minutes after actin-depolymerization with 10 μM cytochalasin D (Sigma-Aldrich, St. Louis). 3D matrix deformations are quantified using Particle Image Velocimetry (OpenPIV) with a window-size of 35 μm (SI Fig.14) and an overlap of 60% between neighbouring windows (29, 62). From the drift-corrected deformation fields, we compute the cell-generated forces using the software Saenopy (29), a Python implementation of the elastic network optimizer Saeno (25). Force regularization is performed using a regularization parameter of α = 1010, with nonlinear elastic material parameters for 1.2 mg/ml collagen gels (linear stiffness k0=6062, linear strain range λs=0.0804, stiffening coefficient ds=0.034, and buckling coefficient d0=0.0025 (29)).
Analysis of matrix remodelling (TFM Data, Fig. 6):
Maximum intensity-projected images of the collagen fiber networks (confocal reflection mode) and the calcein-stained cells (confocal fluorescence) are calculated from 20 μm (z-height) image stacks. Cells are segmented using Otsu-thresholding (61), and the fiber orientation is calculated from the projected confocal reflection images as described above. Relative increase in collagen fiber intensity around the cell is calculated from the first 10 μm distance shell normalized to the two outermost shells. For the collagen orientation analysis, a window-size of 10 μm is chosen.
Lung fibroblasts (NHLF) experiments.
Normal Human Lung Fibroblasts (NHLF, Lonza, Basel) are embedded in fluorescently labeled fibrin gels as previously described (59). NHLF are labeled with CellTracker (30 min incubation at a concentration of 0.66 μM, CellTracker Green CMFDA, Thermo Fisher Scientific, Waltham). Bovine fibrinogen is labeled with a fluorescent reactive dye (Alexa Fluor 647 NHS succinimidyl ester, Thermo Fisher Scientific, Waltham). After purification from the unreacted dye via dialysis, the fibrinogen (6 mg/ml) is mixed 1:1 with bovine thrombin (2 unit/ml) and added to a NHLF cell pellet for a final concentration of 50,000 cells/ml, 3 mg/ml fibrinogen and 1 unit/ml thrombin. The mixture of fibrin gels and NHLFs is pipetted into PDMS chambers (1.3 mm ×1.3 mm×130 μm) as previously described (59). After 4 hours of incubation, samples are transferred to a confocal microscope (SPE, Leica, Wetzlar) equipped with a 10x 0.4 NA objective (Leica, Wetzlar). Confocal image stacks (xyz=256×256×58 μm, with a voxel-size of 0.5×0.5×0.5 μm/px) are acquired around individual cells. Maximum intensity projected images are calculated from 20 μm (z-height) stacks around the cells. Cells are segmented using Otsu-thresholding (61), and the fiber orientation is calculated from the projected confocal reflection images as described above. Relative increase in collagen fiber intensity around the cell is calculated from the first 10 μm distance shell normalized to the two outermost shells. For the collagen orientation analysis, a window-size of 10 μm is chosen.
Breast cancer-associated fibroblast (CAFs) experiments.
Single cell experiments:
Experiments with CAFs are conducted similarly to the HSC traction force experiments. Here, we use final collagen concentrations of 0.6 mg/ml, 1.2 mg/ml, or 2.4 mg/ml. Cells (20.000 per gel) are cultured in collagen gels for 3 days prior to imaging. Fiber orientation is evaluated using maximum intensity-projections (10 μm z-height around the centered cells) of the collagen fiber networks from confocal reflection images. The cells are calcein-stained and imaged with confocal fluorescence microscopy for segmenting the cell outline using Otsu-thresholding (61). Relative increase in collagen fiber intensity around the cell is calculated from the first 10 μm distance shell normalized to the two outermost shells. For the collagen orientation analysis, a window-size of 10 μm is chosen.
Spheroid measurements:
Multicellular spheroids are formed from 4000 cells in 100 μl medium by culturing for 1 day in non-adhesive U-well plates (Greiner, Kremsmünster). The next day, 8-12 spheroids are embedded in 1.2 mg/ml collagen gels (Matrix Bioscience, Mörlenbach) using a previously described two-layer gel approach (38) to prevent the spheroids from sinking to bottom of the dish (1.5 ml collagen solution per layer, first layer polymerized for 20 minutes).
Characterization of collagen gels.
Collagen type I hydrogels (RAFT Reagent Kit for 3D culture, Lonza, Basel) are prepared on ice to a final collagen concentrations of 1.0 mg/ml and polymerized at room temperature in a 96-well plate (200 μl volume per well, μ-Plate, Ibidi, Grüfelfing). Samples are transferred to a multiphoton excitation microscope (Olympus FVMPE-RS Microscope, Tokyo) equipped with a 25x objective (Olympus XLPLN25XSVMP, NA 1.0, Tokyo) and imaged at 37°C, 95% humidity and 5% CO2. Image stacks (xyz=255x255x50 μm, with a voxel-size of 0.249x0.249x0.5 μm are acquired using second-harmonic imaging microscopy. Image stacks are binarized, and the 3D pore size is extracted as described in (63, 64).
Supplementary Material
ACKNOWLEDGEMENTS
This work was funded by grants from the German Research Foundation (DFG TRR-SFB 225 – project 326998133 – subprojects A01, B09, C02 and C05; STR 923/6-1), and the Emerging Fields Initiative ofthe University of Erlangen–Nuremberg. We thank the ENB Biological Physics program of the University Bayreuth for support, and Ricardo Henriques for the use of the latex layout.
Footnotes
Publisher's Disclaimer: This is a PDF file of an unedited manuscript that has been accepted for publication. As a service to our customers we are providing this early version of the manuscript. The manuscript will undergo copyediting, typesetting, and review of the resulting proof before it is published in its final form. Please note that during the production process errors may be discovered which could affect the content, and all legal disclaimers that apply to the journal pertain.
Conflict of Interest. MR, IM, EG and DB are or have been employed by Novartis. All authors declare no conflict of interest.
Data Availability.
The software is available as an open-source Python package with a graphical user interface on GitHuB (55). Figures are created using the Python package Pylustrator (65) and MetBrewer (66). The data of this study are available upon request from the corresponding author.
Bibliography
- 1.Sprrer Marina, Kah Delf, Gerum Richard C., Reischl Barbara, Huraskin Danyil, Dessalles Claire A., Schneider Werner, Goldmann Wolfgang H., Herrmann Harald, Thievessen Ingo, Clemen Christoph S., Friedrich Oliver, Hashemolhosseini Said, Schröder Rolf, and Fabry Ben. The desmin mutation R349P increases contractility and fragility of stem cellgenerated muscle micro-tissues. Neuropathology and Applied Neurobiology, 48(3):1–11, 2022. ISSN 13652990. doi: 10.1111/nan.12784. [DOI] [PubMed] [Google Scholar]
- 2.Rausch Martin, Böhringer David, Steinmann Martin, Schubert Dirk W., Schrüfer Stefan, Mark Christoph, and Fabry Ben. Measurement of Skeletal Muscle Fiber Contractility with High-Speed Traction Microscopy. Biophysical Journal, 118(3):657–666, 2020. ISSN 15420086. doi: 10.1016/j.bpj.2019.12.014. [DOI] [PMC free article] [PubMed] [Google Scholar]
- 3.Kim HR, Appel S, Vetterkind S, Gangopadhyay SS, and Morgan KG. Smooth muscle signalling pathways in health and disease: Contractility in Health and DiseaseReview Series. Journal of Cellular and Molecular Medicine, 12(6A):2165–2180, 2008. ISSN 15821838. doi: 10.1111/j.1582-4934.2008.00552.x. [DOI] [PMC free article] [PubMed] [Google Scholar]
- 4.Scholey Jonathan M., Brust-Mascher Ingrid, and Mogilner Alex. Cell division. Nature, 422 (6933):746–752, 2003. ISSN 00280836. doi: 10.1038/nature01599. [DOI] [PubMed] [Google Scholar]
- 5.Fink Jenny, Carpi Nicolas, Betz Timo, Bétard Angelique, Chebah Meriem, Azioune Ammar, Bornens Michel, Sykes Cecile, Fetler Luc, Cuvelier Damien, and Piel Matthieu. External forces control mitotic spindle positioning. Nature Cell Biology, 13(7):771–778, 2011. ISSN 14657392. doi: 10.1038/ncb2269. [DOI] [PubMed] [Google Scholar]
- 6.Koser David E., Thompson Amelia J., Foster Sarah K., Dwivedy Asha, Pillai Eva K., Sheridan Graham K., Svoboda Hanno, Viana Matheus, Costa Luciano Da F., Guck Jochen, Holt Christine E., and Franze Kristian. Mechanosensing is critical for axon growth in the developing brain. Nature Neuroscience, 2016. ISSN 15461726. doi: 10.1038/nn.4394. [DOI] [PMC free article] [PubMed] [Google Scholar]
- 7.Pérez-González Carlos, Ceada Gerardo, Greco Francesco, Matejcic Marija, Gómez-González Manuel, Castro Natalia, Kale Sohan, Álvarez-Varela Adrián, Roca-Cusachs Pere, Batlle Eduard, Matic Vignjevic Danijela, Arroyo Marino, Trepat Xavier, and Matic Vignjevic Danijela. Mechanical compartmentalization of the intestinal organoid enables crypt folding and collective cell migration. bioRxiv, pages 1–26, 2020. [DOI] [PMC free article] [PubMed] [Google Scholar]
- 8.Tambe Dhananjay T., Hardin C. Corey, Angelini Thomas E., Rajendran Kavitha, Park Chan Young, Serra-Picamal Xavier, Zhou Enhua H., Zaman Muhammad H., Butler James P., Weitz David A., Fredberg Jeffrey J., and Trepat Xavier. Collective cell guidance by co-operative intercellular forces. Nature Materials, 10(6):469–475, 2011. ISSN 14764660. doi: 10.1038/nmat3025. [DOI] [PMC free article] [PubMed] [Google Scholar]
- 9.Raghuraman Swetha, Schubert Ann-Sophie, Bröker Stephan, Jurado Alejandro, Müller Annika, Brandt Matthias, Vos Bart E., Hofemeier Arne D., Abbasi Fatemeh, Stehling Martin, Wittkowski Raphael, and Betz Timo. Pressure drives rapid burst-like collective migration from 3D cancer aggregates. bioRxiv, page 2021.04.25.441311, 2021. [DOI] [PMC free article] [PubMed] [Google Scholar]
- 10.Li Bin and Wang James H C. Fibroblasts and myofibroblasts in wound healing: Force generation and measurement. Journal of Tissue Viability, 2011. ISSN 0965206X. doi: 10.1016/j.jtv.2009.11.004. [DOI] [PMC free article] [PubMed] [Google Scholar]
- 11.Darby Ian A., Laverdet Betty, Bonté Frédéric, and Desmoulière Alexis. Fibroblasts and myofibroblasts in wound healing, 2014. ISSN 11787015. [DOI] [PMC free article] [PubMed] [Google Scholar]
- 12.Martínez-Sánchez Luz del Carmen, Ngo Phuong Anh, Pradhan Rashmita, Becker Lukas-Sebastian, Boehringer David, Soteriou Despina, Kubankova Marketa, Schweitzer Christine, Koch Tatyana, Thonn Veronika, Erkert Lena, Stolzer Iris, Günther Claudia, Becker Christoph, Weigmann Benno, Klewer Monika, Daniel Christoph, Amann Kerstin, Tenzer Stefan, Atreya Raja, Bergo Martin, Brakebusch Cord, Watson Alastair J M, Guck Jochen, Fabry Ben, Atreya Imke, Neurath Markus F, and López-Posadas Rocío. Epithelial RAC1-dependent cytoskeleton dynamics controls cell mechanics, cell shedding and barrier integrity in intestinal inflammation. Gut, 72(2):275 LP–294, 2 2023. doi: 10.1136/gutjnl-2021-325520. [DOI] [PMC free article] [PubMed] [Google Scholar]
- 13.Provenzano PP, Inman DR, Eliceiri KW, and Keely PJ. Matrix density-induced mechanoregulation of breast cell phenotype, signaling and gene expression through a FAK-ERK linkage. Oncogene, 28(49):4326–4343, 2009. ISSN 09509232. doi: 10.1038/onc.2009.299. [DOI] [PMC free article] [PubMed] [Google Scholar]
- 14.Ortiz Cristina, Schierwagen Robert, Schaefer Liliana, Klein Sabine, Trepat Xavier, and Trebicka Jonel. Extracellular Matrix Remodeling in Chronic Liver Disease. 2021. [DOI] [PMC free article] [PubMed] [Google Scholar]
- 15.Winkler Juliane, Abisoye-Ogunniyan Abisola, Metcalf Kevin J., and Werb Zena. Concepts of extracellular matrix remodelling in tumour progression and metastasis. Nature Communications, 11(1):1–19, 2020. ISSN 20411723. doi: 10.1038/s41467-020-18794-x. [DOI] [PMC free article] [PubMed] [Google Scholar]
- 16.Przybyla Laralynne, Muncie Jonathon M., and Weaver Valerie M.. Mechanical Control of Epithelial-to-Mesenchymal Transitions in Development and Cancer. Annual Review of Cell and Developmental Biology, 32:527–554, 2016. ISSN 15308995. doi: 10.1146/annurev-cellbio-111315-125150. [DOI] [PubMed] [Google Scholar]
- 17.Harris Albert K., Wild Patricia, and Stopak David. Silicone rubber substrata: A new wrinkle in the study of cell locomotion. Science, 1980. ISSN 00368075. doi: 10.1126/science.6987736. [DOI] [PubMed] [Google Scholar]
- 18.Harris Albert K., Stopak David, and Wild Patricia. Fibroblast traction as a mechanism for collagen morphogenesis. Nature, 1981. ISSN 00280836. doi: 10.1038/290249a0. [DOI] [PubMed] [Google Scholar]
- 19.Kawada N, Klein H, and Decker K. Eicosanoid-mediated contractility of hepatic stellate cells. Biochemical Journal, 285(2):367–371, 1992. ISSN 02646021. doi: 10.1042/bj2850367. [DOI] [PMC free article] [PubMed] [Google Scholar]
- 20.Dembo Micah and Wang Yu-Li. Stresses at the Cell-to-Substrate Interface during Locomotion of Fibroblasts. Technical report, 1999. [DOI] [PMC free article] [PubMed] [Google Scholar]
- 21.Butler JP, Tolic-Norrelykke IM, Fabry B, and Fredberg JJ. Traction fields, moments, and strain energy that cells exert on their surroundings. AJP: Cell Physiology, 2002. ISSN 0363-6143. doi: 10.1152/ajpcell.00270.2001. [DOI] [PubMed] [Google Scholar]
- 22.Sabass Benedikt, Gardel Margaret L., Waterman Clare M., and Schwarz Ulrich S.. High resolution traction force microscopy based on experimental and computational advances. Biophysical Journal, 94(1):207–220, 2008. ISSN 00063495. doi: 10.1529/biophysj.107.113670. [DOI] [PMC free article] [PubMed] [Google Scholar]
- 23.Bell E, Ivarsson B, and Merrill C. Production of a tissue-like structure by contraction of collagen lattices by human fibroblasts of different proliferative potential in vitro, 1979. ISSN 00278424. [DOI] [PMC free article] [PubMed] [Google Scholar]
- 24.Franck Christian, Maskarinec Stacey A., Tirrell David A., and Ravichandran Guruswami. Three-dimensional traction force microscopy: A new tool for quantifying cell-matrix interactions. PLoS ONE, 6(3), 2011. ISSN 19326203. doi: 10.1371/journal.pone.0017833. [DOI] [PMC free article] [PubMed] [Google Scholar]
- 25.Steinwachs Julian, Metzner Claus, Skodzek Kai, Lang Nadine, Thievessen Ingo, Mark Christoph, Münster Stefan, Aifantis Katerina E., and Fabry Ben. Three-dimensional force microscopy of cells in biopolymer networks. Nature Methods, 2016. ISSN 15487105. doi: 10.1038/nmeth.3685. [DOI] [PubMed] [Google Scholar]
- 26.Ahmadzadeh Hossein, Webster Marie R., Behera Reeti, Valencia Angela M.Jimenez, Wirtz Denis, Weeraratna Ashani T., and Shenoy Vivek B.. Modeling the two-way feedback between contractility and matrix realignment reveals a nonlinear mode of cancer cell invasion. Proceedings of the National Academy of Sciences of the United States of America, 114(9):E1617–E1626, 2017. ISSN 10916490. doi: 10.1073/pnas.1617037114. [DOI] [PMC free article] [PubMed] [Google Scholar]
- 27.Abhilash AS, Baker Brendon M., Trappmann Britta, Chen Christopher S., and Shenoy Vivek B.. Remodeling of fibrous extracellular matrices by contractile cells: Predictions from discrete fiber network simulations. Biophysical Journal, 107(8):1829–1840, 2014. ISSN 15420086. doi: 10.1016/j.bpj.2014.08.029. [DOI] [PMC free article] [PubMed] [Google Scholar]
- 28.Licup Albert James, Münster Stefan, Sharma Abhinav, Sheinman Michael, Jawerth Louise M., Fabry Ben, Weitz David A., and MacKintosh Fred C.. Stress controls the mechanics of collagen networks. 3 2015. doi: 10.1073/pnas.1504258112. [DOI] [PMC free article] [PubMed] [Google Scholar]
- 29.Böhringer David, Cóndor Mar, Bischof Lars, Czerwinski Tina, Gampl Niklas, Ngo Phuong Anh, Bauer Andreas, Voskens Caroline, López-Posadas Rocío, Franze Kristian, Bud-day Silvia, Mark Christoph, Fabry Ben, and Gerum Richard. Dynamic traction force measurements of migrating immune cells in 3D matrices. bioRxiv, page 2022.11.16.516758, 1 2023. doi: 10.1101/2022.11.16.516758. [DOI] [Google Scholar]
- 30.Knutsson Hans, Westin Carl-Fredrik, and Andersson Mats. Representing Local Structure Using Tensors II BT - Image Analysis. pages 545–556, Berlin, Heidelberg, 2011. Springer Berlin Heidelberg. ISBN 978-3-642-21227-7. [Google Scholar]
- 31.Bigun Josef and Granlund Gösta H. Optimal Orientation Detection of Linear Symmetry. In IEEE International Conference on Computer Vision, 1987. [Google Scholar]
- 32.Jähne Bernd. Spatio-Temporal Image Processing. In Lecture Notes in Computer Science, 1993. [Google Scholar]
- 33.Püspöki Zsuzsanna, Storath Martin, Sage Daniel, and Unser Michael. Transforms and operators for directional bioimage analysis: A survey. Advances in Anatomy Embryology and Cell Biology, 219:69–93, 2016. ISSN 03015556. doi: 10.1007/978-3-319-28549-8{\_}3. [DOI] [PubMed] [Google Scholar]
- 34.Fonck Edouard, Feigl Georg G., Fasel Jean, Sage Daniel, Unser Michael, Rüfenacht Daniel A., and Stergiopulos Nikolaos. Effect of aging on elastin functionality in human cerebral arteries. Stroke, 40(7):2552–2556, 2009. ISSN 00392499. doi: 10.1161/STROKEAHA.108.528091. [DOI] [PubMed] [Google Scholar]
- 35.Rezakhaniha R, Agianniotis A, Schrauwen JTC, Griffa A, Sage D, Bouten CVC, Van De Vosse FN, Unser M, and Stergiopulos N. Experimental investigation of collagen waviness and orientation in the arterial adventitia using confocal laser scanning microscopy. Biomechanics and Modeling in Mechanobiology 11(3-4):461–473, 2012. ISSN 16177959. doi: 10.1007/s10237-011-0325-z. [DOI] [PubMed] [Google Scholar]
- 36.Day Bryan W., Brett Stringer W., Wilson John, Jeffree Rosalind L., Jamieson Paul R., Ensbey Kathleen S., Bruce Zara C., Inglis Po, Allan Suzanne, Winter Craig, Tollesson Gert, Campbell Scott, Lucas Peter, Findlay Wendy, Kadrian David, Johnson David, Robertson Thomas, Johns Terrance G., Bartlett Perry F., Osborne Geoffrey W., and Boyd Andrew W.. Glioma surgical aspirate: A viable source of tumor tissue for experimental research. Cancers, 5(2):357–371,2013. ISSN 20726694. doi: 10.3390/cancers5020357. [DOI] [PMC free article] [PubMed] [Google Scholar]
- 37.Grundy Thomas James, Orcheston-Findlay Louise, de Silva Eshana, Jegathees Thuvarahan, Prior Victoria, Sarker Farhana Amy, and O’Neill Geraldine Margaret. Mechanosensitive expression of the mesenchymal subtype marker connective tissue growth factor in glioblastoma. Scientific Reports, 12(1):1–11, 2022. ISSN 20452322. doi: 10.1038/s41598-022-19175-8. [DOI] [PMC free article] [PubMed] [Google Scholar]
- 38.Mark Christoph, Grundy Thomas J, Strissel Pamela L, Böhringer David, Grummel Nadine, Gerum Richard, Steinwachs Julian, Hack Carolin C, Beckmann Matthias W, Eckstein Markus, Strick Reiner, O’Neill Geraldine M, and Fabry Ben. Collective forces of tumor spheroids in three-dimensional biopolymer networks. eLife, 9:e51912, 4 2020. ISSN 2050-084X. doi: 10.7554/eLife.51912. [DOI] [PMC free article] [PubMed] [Google Scholar]
- 39.Stringer Brett W, Day Bryan W, D’Souza Rochelle C J, Jamieson Paul R, Ensbey Kathleen S, Bruce Zara C, Lim Yi Chieh, Goasdoué Kate, Offenhäuser Carolin, Akgül Seçkin, Allan Suzanne, Robertson Thomas, Lucas Peter, Tollesson Gert, Campbell Scott, Winter Craig, Do Hongdo, Dobrovic Alexander, Inglis Po-Ling, Jeffree Rosalind L, Johns Terrance G, and Boyd Andrew W. A reference collection of patient-derived cell line and xenograft models of proneural, classical and mesenchymal glioblastoma. Scientific Reports, 9(1): 4902, 2019. ISSN 2045-2322. doi: 10.1038/s41598-019-41277-z. [DOI] [PMC free article] [PubMed] [Google Scholar]
- 40.Burkel Brian and Notbohm Jacob. Mechanical response of collagen networks to nonuniform microscale loads. Soft Matter, 2017. ISSN 17446848. doi: 10.1039/c7sm00561j. [DOI] [PubMed] [Google Scholar]
- 41.Murata Toru, Arii Shigeki, Nakamura Toshio, Mori Akira, Kaido Toshimi, Furuyama Hiroaki, Furumoto Katsuyoshi, Nakao Teizo, Isobe Naoki, and Imamura Masayuki. Inhibitory effect of Y-27632, a ROCK inhibitor, on progression of rat liver fibrosis in association with inactivation of hepatic stellate cells. Journal of Hepatology 35(4):474–481,2001. ISSN 01688278. doi: 10.1016/S0168-8278(01)00169-6. [DOI] [PubMed] [Google Scholar]
- 42.Besnerais Guy Le and Champagnat Frédéric. Dense optical flow by iterative local window registration. Proceedings - International Conference on Image Processing, ICIP, 1:134–137, 2005. ISSN 15224880. doi: 10.1109/ICIP.2005.1529706. [DOI] [Google Scholar]
- 43.Ouellette Jonathan N., Drifka Cole R., Pointer Kelli B., Liu Yuming, Lieberthal Tyler J., Kao W. John, Kuo John S., Loeffler Agnes G., and Eliceiri Kevin W.. Navigating the collagen jungle: The biomedical potential of fiber organization in cancer. Bioengineering, 8(2):1–19, 2021. ISSN 23065354. doi: 10.3390/bioengineering8020017. [DOI] [PMC free article] [PubMed] [Google Scholar]
- 44.Eliceiri KevinW, Conklin MatthewW, Bredfeldt JeremyS, Mackie ThomasR, Liu Yuming, and Keely PatriciaJ. Automated quantification of aligned collagen for human breast carcinoma prognosis. Journal of Pathology Informatics, 5(1):28, 2014. ISSN 2153-3539. doi: 10.4103/2153-3539.139707. [DOI] [PMC free article] [PubMed] [Google Scholar]
- 45.Provenzano Paolo P., Eliceiri Kevin W., Campbell Jay M., Inman David R., White John G., and Keely Patricia J.. Collagen reorganization at the tumor-stromal interface facilitates local invasion. BMC Medicine, 4:1–15, 2006. ISSN 17417015. doi: 10.1186/1741-7015-4-38. [DOI] [PMC free article] [PubMed] [Google Scholar]
- 46.Provenzano Paolo P., Inman David R., Eliceiri Kevin W., Knittel Justin G., Yan Long, Rueden Curtis T., White John G., and Keely Patricia J.. Collagen density promotes mammary tumor initiation and progression. BMC Medicine, 6:1–15, 2008. ISSN 17417015. doi: 10.1186/1741-7015-6-11. [DOI] [PMC free article] [PubMed] [Google Scholar]
- 47.Han Weijing, Chen Shaohua, Yuan Wei, Fan Qihui, Tian Jianxiang, Wang Xiaochen, Chen Longqing, Zhang Xixiang, Wei Weili, Liu Ruchuan, Qu Junle, Jiao Yang, Austin Robert H., and Liu Liyu. Oriented collagen fibers direct tumor cell intravasation. Proceedings of the National Academy of Sciences of the United States of America, 113(40):11208–11213, 2016. ISSN 10916490. doi: 10.1073/pnas.1610347113. [DOI] [PMC free article] [PubMed] [Google Scholar]
- 48.Antoine Elizabeth E., Vlachos Pavlos P., and Rylander Marissa Nichole. Review of Collagen I Hydrogels for Bioengineered Tissue Microenvironments: Characterization of Mechanics, Structure, and Transport. Tissue Engineering Part B: Reviews, 20(6):683–696, 2014. ISSN 1937-3368. doi: 10.1089/ten.teb.2014.0086. [DOI] [PMC free article] [PubMed] [Google Scholar]
- 49.Humphries DL, Grogan JA, and Gaffney EA. Mechanical Cell–Cell Communication in Fibrous Networks: The Importance of Network Geometry. Bulletin of Mathematical Biology, 79(3):498–524, 2017. ISSN 15229602. doi: 10.1007/s11538-016-0242-5. [DOI] [PMC free article] [PubMed] [Google Scholar]
- 50.Nahum Assaf, Koren Yoni, Natan Sari, Goren Shahar, Lesman Ayelet, and Zaritsky Assaf. Quantifying the dynamics of long-range cell-cell mechanical communication. bioRxiv, page 2020.07.30.223149, 2020. [Google Scholar]
- 51.Szulczewski Joseph M, Inman David R, Proestaki Maria, Notbohm Jacob, Burkel Brian M, and Ponik Suzanne M. Cell-Scale Biophysical Cues from Collagen Fiber Architecture Instruct Cell Behavior and the Propagation of Mechanosensory Signals. bioRxiv, page 2020.08.12.248179, 2020. [Google Scholar]
- 52.Kang Ningling. Mechanotransduction in Liver Diseases. Seminars in Liver Disease, 40(1): 84–90, 2020. ISSN 10988971. doi: 10.1055/s-0039-3399502. [DOI] [PMC free article] [PubMed] [Google Scholar]
- 53.Song Ziwei, Gupta Kapish, Ng Inn Chuan, Xing Jiangwa, Yang Yi An, and Yu Hanry. Mechanosensing in liver regeneration. Seminars in Cell and Developmental Biology, 71:153–167, 2017. ISSN 10963634. doi: 10.1016/j.semcdb.2017.07.041. [DOI] [PubMed] [Google Scholar]
- 54.Nahum Assaf, Koren Yoni, Ergaz Bar, Natan Sari, Goren Shahar, Kolel Avraham, Jagadeeshan Sankar, Elkabets Moshe, Lesman Ayelet, and Zaritsky Assaf. Inference of long-range cell-cell mechanical communication from ECM remodeling fluctuations. bioRxiv, page 2020.07.30.223149, 2022. [DOI] [PMC free article] [PubMed] [Google Scholar]
- 55.Böhringer David, Bauer Andreas, and Richard Gerum. CompactionAnalyzer Github Project: https://github.com/davidbhr/CompactionAnalyzer, 2021.
- 56.Grundy Thomas James, Leon Ellen De, Griffin Kaitlyn Rose, Stringer Brett William, Day Bryan William, Fabry Ben, Justin Cooper-White, and O’Neill Geraldine Margaret. Differential response of patient-derived primary glioblastoma cells to environmental stiffness. Scientific Reports, 6(March):4–13, 2016. ISSN 20452322. doi: 10.1038/srep23353. [DOI] [PMC free article] [PubMed] [Google Scholar]
- 57.Otsu N. A Threshold Selection Method from Gray-Level Histograms. IEEE Transactionson Systems, Man, and Cybernetics, 9(1):62–66, 1979. ISSN 0018-9472. doi: 10.1109/TSMC.1979.4310076. [DOI] [Google Scholar]
- 58.Brox Thomas, Weickert Joachim, Burgeth Bernhard, and Mrázek Pavel. Nonlinear structure tensors. Image and Vision Computing, 24(1):41–55, 2006. ISSN 02628856. doi: 10.1016/j.imavis.2005.09.010. [DOI] [Google Scholar]
- 59.Malandrino Andrea, Trepat Xavier, Kamm Roger D., and Mak Michael. Dynamic filopodial forces induce accumulation, damage, and plastic remodeling of 3D extracellular matrices. PLoS Computational Biology, 15(4):1–26, 2019. ISSN 15537358. doi: 10.1371/journal.pcbi.1006684. [DOI] [PMC free article] [PubMed] [Google Scholar]
- 60.Mak Michael. Impact of crosslink heterogeneity on extracellular matrix mechanics and remodeling. Computational and Structural Biotechnology Journal, 18:3969–3976, 2020. ISSN 20010370. doi: 10.1016/j.csbj.2020.11.038. [DOI] [PMC free article] [PubMed] [Google Scholar]
- 61.Otsu N. OTSU paper. IEEE Transactions on Systems, Man and Cybernetics, 20(1):62–66, 1979. ISSN 0018-9472. [Google Scholar]
- 62.Liberzon Alex, Lasagna Davide, Aubert Mathias, Bachant Pete, Käufer Theo, jakirkham, Bauer Andreas, Vodenicharski Boyko, Dallas Cameron, Borg Joe, tomerast, and ranleu. OpenPIV/openpiv-python: OpenPIV - Python (v0.22.2) with a new extended search PIV grid option. 7 2020. doi: 10.5281/ZENODO.3930343. [DOI] [Google Scholar]
- 63.Lang Nadine R., Münster Stefan, Metzner Claus, Krauss Patrick, Schürmann Sebastian, Lange Janina, Aifantis Katerina E., Friedrich Oliver, and Fabry Ben. Estimating the 3D pore size distribution of biopolymer networks from directionally biased data. Biophysical Journal, 105(9):1967–1975, 2013. ISSN 00063495. doi: 10.1016/j.bpj.2013.09.038. [DOI] [PMC free article] [PubMed] [Google Scholar]
- 64.Krauss Patrick, Metzner Claus, Lange Janina, Lang Nadine, and Fabry Ben. Parameter-free binarization and skeletonization of fiber networks from confocal image stacks. PLoS ONE, 7(5):1–8, 2012. ISSN 19326203. doi: 10.1371/journal.pone.0036575. [DOI] [PMC free article] [PubMed] [Google Scholar]
- 65.Gerum Richard. Pylustrator: Code Generation for Reproducible Figures for Publication. Journal of Open Source Sofiware, 5(51):1989, 2020. ISSN 2475-9066. doi: 10.21105/joss.01989. [DOI] [Google Scholar]
- 66.Mills Blake Robert. MetBrewer Github Project: https://github.com/BlakeRMills/MetBrewer.
- 67.Yen Jui Cheng, Chang Fu Juay, and Chang Shyang. A New Criterion for Automatic Multilevel Thresholding. IEEE Transactions on Image Processing, 4(3):370–378, 1995. ISSN 19410042. doi: 10.1109/83.366472. [DOI] [PubMed] [Google Scholar]
- 68.Sato Yoshinobu, Nakajima Shin, Shiraga Nobuyuki, Atsumi Hideki, Yoshida Shigeyuki, Koller Thomas, Gerig Guido, and Kikinis Ron. Three-dimensional multi-scale line filter for segmentation and visualization of curvilinear structures in medical images. Medical Image Analysis, 2(2):143–168, 6 1998. ISSN 1361-8415. doi: 10.1016/S1361-8415(98)80009-1. [DOI] [PubMed] [Google Scholar]
Associated Data
This section collects any data citations, data availability statements, or supplementary materials included in this article.
Supplementary Materials
Data Availability Statement
The software is available as an open-source Python package with a graphical user interface on GitHuB (55). Figures are created using the Python package Pylustrator (65) and MetBrewer (66). The data of this study are available upon request from the corresponding author.