

Abstract
Body fatness is considered a probable risk factor for biliary tract cancer (BTC), whereas cholelithiasis is an established factor. Nevertheless, although obesity is an established risk factor for cholelithiasis, previous studies of the association of BMI and BTC did not take the effect of cholelithiasis fully into account. To better understand the effect of BMI on BTC, we conducted a pooled analysis using population-based cohort studies in Asians.
In total, 905,530 subjects from 21 cohort studies participating in the Asia Cohort Consortium were included. BMI was categorized into four groups: underweight (<18.5 kg/m2); normal (18.5–22.9 kg/m2); overweight (23–24.9 kg/m2); and obese (25+ kg/m2). The association between BMI and BTC incidence and mortality was assessed using hazard ratios (HR) and 95% confidence intervals (CIs) by Cox regression models with shared frailty. Mediation analysis was used to decompose the association into a direct and an indirect (mediated) effect.
Compared with normal BMI, high BMI was associated with BTC mortality (HR 1.19 [CI 1.02–1.38] for males, HR 1.30 [1.14–1.49] for females). Cholelithiasis had significant interaction with BMI on BTC risk. BMI was associated with BTC risk directly and through cholelithiasis in females, whereas the association was unclear in males. When cholelithiasis was present, BMI was not associated with BTC death in either males or females. BMI was associated with BTC death among females without cholelithiasis. This study suggests BMI is associated with BTC mortality in Asians. Cholelithiasis appears to contribute to the association; and moreover, obesity appears to increase BTC risk without cholelithiasis.
Keywords: Biliary tract cancer, Body Mass Index, Obesity, Pooled analysis, Asia Cohort Consortium
Graphical Abstract

Introduction
Biliary tract cancer (BTC) is a malignancy that arises from the gallbladder and bile duct. Although the worldwide incidence of BTC is low, accounting for approximately 1% of global cancer mortality (1), incidence is relatively high in Asian countries (2, 3). Body fatness is considered a probable risk factor for BTC. Previous meta-analyses showed statistically significant increased risk among overweight (25≤BMI<30, summary relative risk 1.10–1.26) and obese (BMI≥30, summary relative risk 1.48–1.72) subjects (4, 5, 6, 7, 8). Given that the distribution of BMI and risk of obesity-related diseases differ between Asians and non-Asians, the risk of BTC related to obesity may also vary between these populations. To date, however, the effect of BMI on incidence in Asians has not been comprehensively investigated.
Cholelithiasis, a medical condition in which gallstones are formed in the gallbladder or bile ducts, is an established risk factor for BTC (9, 10, 11). Importantly, while obesity is an established risk factor for cholelithiasis (12), most previous studies of the association between BMI and BTC risk did not appropriately account for cholelithiasis (5). Moreover, because cholelithiasis is an intermediate variable between obesity and BTC, statistical adjustment by cholelithiasis is analytically inappropriate in assessing the association between BMI and BTC risk and might introduce bias. The direction of this bias is not predictable (13). Examining the association of BMI with BTC risk therefore requires statistical techniques that treat cholelithiasis as an intermediate variable. Of note, evaluating the proportion of effect mediated by cholelithiasis might provide insights into the biological pathways of BTC and help in the development of prevention strategies.
Here, to elucidate the association between obesity and BTC risk in Asian populations, we conducted a large pooled analysis of population-based cohort studies in Asians. In particular, we focused on the heterogeneous and mediating effect of BMI by cholelithiasis status.
Materials and Methods
Study populations
Details of the Asia Cohort Consortium (ACC) have been described elsewhere (14, 15). Briefly, the ACC is a research platform for cross-cohort collaborative projects which aims to elucidate the association between genetics, environmental exposures, and the etiology of disease through pooled analysis of participating cohorts. The ACC includes a total of 44 cohort studies from 10 countries which involve more than one million Asians.
Each individual cohort study reported information regarding various environmental factors, past history, family history, and others using questionnaires, anthropometric measurements, and laboratory tests as appropriate, and followed up on new cancer cases and death according to individual ascertainment systems in each country. The ACC’s coordinating center (Japan National Cancer Center) sent the list of required variables to a principal investigator for each cohort, who then returned the cleaned raw data to the coordinating center. The coordinating center then harmonized the data.
Of the 44 cohort studies, the present study included 21 cohorts involving 905 530 subjects that collected baseline information on BMI and follow-up data on BTC. The participating cohorts were as follows: Health Effects for Arsenic Longitudinal Study Bangladesh (HEALS) (16); Linxian General Population Trial Cohort (Linxian) (17); Shanghai Cohort Study (SCS) (18); Shanghai Men’s Health Study (SMHS) (19); Shanghai Women’s Health Study (SWHS) (20); Mumbai Cohort Study (Mumbai) (21); Golestan Cohort Study (Golestan) (22); Japan Public Health Center-based Prospective Study (JPHC1, JPHC2) (23); Japan Collaborative Cohort Study (JACC) (24); Miyagi Cohort (Miyagi) (25); Ohsaki National Health Insurance Cohort Study (Ohsaki) (26); Life Span Study Cohort (LSS) (27); Takayama Study (Takayama) (28); Three Prefecture Cohort Study Miyagi (Miyagi3P) (29); Three Prefecture Cohort Study Aichi (Aichi3P) (29); Korean Multi-center Cancer Cohort Study (KMCC) (30); Seoul Male Cancer Cohort (SeoulM) (31); Korean National Cancer Center Cohort (KNCC) (32); The Namwon Study (Namwon) (33); and Community-based Cancer Screening Project (CBCSP) (34, 35). Subjects who met the following criteria were excluded: no information on age, sex, or BMI; height less than 100cm; weight less than 30kg; and BMI less than 14 or more than 40. Subjects with a past history of any cancer were also excluded.
Outcome and exposure
Outcome
Death outcomes were identified by data linkage to death certificates and active follow-up surveys. The cause of death was defined using the International Classification of Diseases, Ninth Revision (ICD-9) or Tenth Revision (ICD-10). BTC was defined as 156.0–156.9 in ICD-9 or C23 and C24 in ICD-10. BTC subsite mortality was available in 16 cohort studies. BTC subsites of intrahepatic bile duct cancer (iBDC), gallbladder cancer (GBC), and extrahepatic bile duct cancer (eBDC) were defined as 155.1, 156.0, and 156.1–156.9 (ICD-9), or C22.1, C23, and C24 (ICD-10), respectively. Total BTC (tBTC) included all subsites of BTC (iBDC, GBC, and eBDC). As a secondary outcome, BTC incidence was available in 14 cohort studies. Cancer incidence was coded according to the International Classification of Diseases for Oncology Third Edition (ICD-O-3). Coding of BTC incidence was as follows: BTC, C23 and C24; tBTC, C22.1, C23, and C24; GBC, C23; and eBDC, C24.
Exposure
The association between BMI and body fatness differs between Asian populations and other ethnicities (36). Accordingly, BMI was categorized into four groups according to the criteria for Asians proposed by WHO (37): underweight (<18.5 kg/m2); normal (18.5–22.9 kg/m2); overweight (23–24.9 kg/m2); and obese (25+ kg/m2). BMI was dichotomized to <25 and ≥25 kg/m2 for interaction analysis.
Statistical analysis
The follow-up period for mortality was from the date of baseline to the date of death or end of the specific cohort study, whichever came first. The follow-up period for BTC incidence was from the date of baseline to the date of BTC diagnosis, date of death, or end of the specific cohort study, whichever came first. The incidence of cancers other than BTC was not censored. Associations were evaluated using hazard ratios (HRs) and 95% confidence intervals (CIs) calculated by multivariable Cox regression models. The shared frailty model was used to account for within-cohort correlation among observations that share a common unobserved factor (frailty) (38, 39). HR and 95%CI were calculated for males and females separately. Three types of HR were estimated from three models: model 1, adjusted for age; model 2, adjusted for all potential confounders; and model 3, adjusted for all potential confounders but excluding the first two years of follow-up. Model 3 was performed as a sensitivity analysis to assess reverse causation. Age, education, population density, marriage status, past history of chronic heart disease, diabetes, hypertension, smoking status, and alcohol drinking were collected as potential confounders. Because cholelithiasis is an intermediate variable, past history of cholelithiasis was not included in the three models, but was used for stratification. Through stratification, the heterogeneity of associations based on the presence or absence of the intermediate factor can be assessed.
Interaction was assessed using the interaction term included in the Cox model. The interaction term was defined as the multiplication of two dichotomous variables: sex (0: male and 1: female) and BMI (0: <25 and 1: ≥25); past history of cholelithiasis (0: absent and 1: present) and BMI (0: <25 and 1: ≥25).
A mediation analysis was conducted to decompose the total effect of BMI≥25kg/m2 on BTC risk into four components: pure indirect effect, reference interaction, mediated interaction and controlled direct effect, using the med4way command of STATA (40, 41, 42). We assumed the exposure, mediator, and outcome were BMI≥25kg/m2, past history of cholelithiasis, and BTC mortality or incidence, respectively. A causal diagram of BMI, cholelithiasis, and BTC is depicted in Figure 1. To estimate the four components of the effects, we used two models: a logistic regression model for the mediator (cholelithiasis) conditioned on the exposure (BMI) and covariates; and a Cox regression model for the outcome (BTC mortality or incidence) conditioned on the exposure, the mediator, and the covariates. A direct effect was defined as a combination of the controlled direct effect and the reference interaction. A total natural indirect effect (indirect effect) was defined as a combination of the mediation interaction and the pure indirect effect. A pure natural direct effect (direct effect) means the effect of BMI on the risk of BTC that was independent of cholelithiasis (the controlled direct effect and the reference interaction). In contrast, an indirect effect represents the effect of mediated pathways; that is, the effect of BMI on BTC risk through cholelithiasis.
Figure 1.
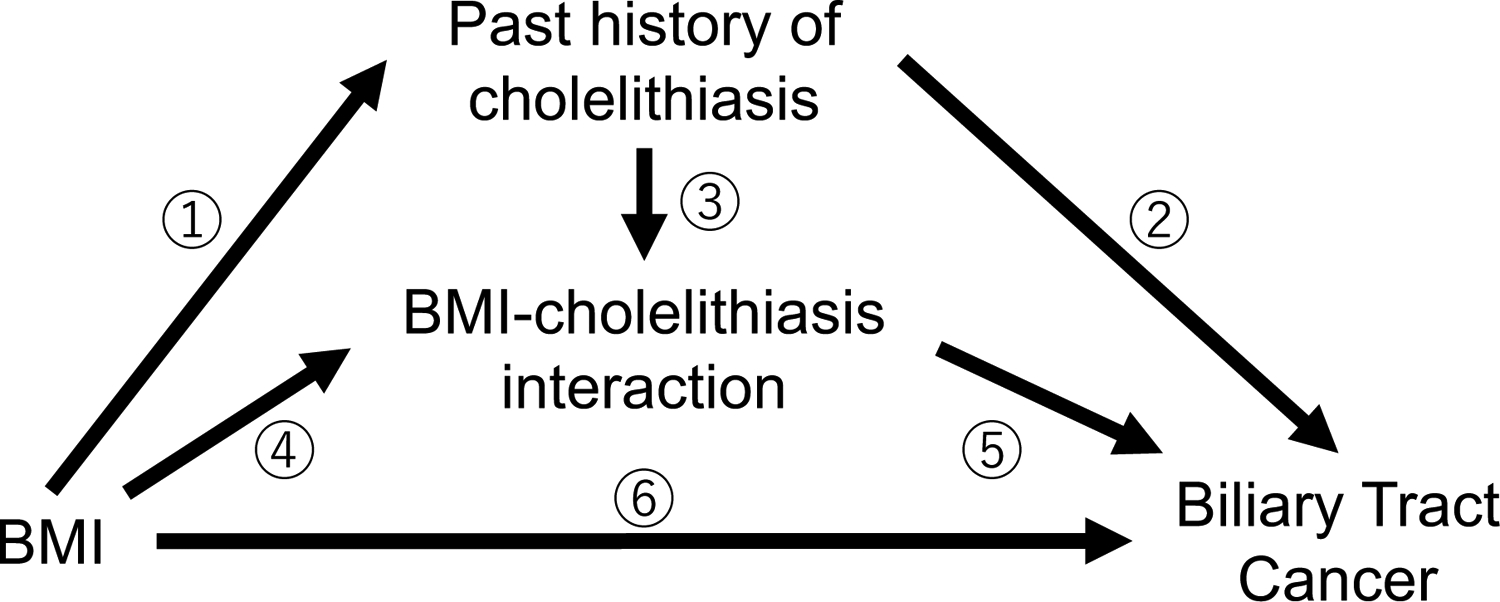
Causal diagram of BMI, cholelithiasis, and biliary tract cancer.
The total effect between BMI and biliary tract cancer can be decomposed into four components: a pure indirect effect (①②); a mediated interaction effect (①③⑤); a reference interaction effect (④⑤); and a controlled direct effect (⑥). A direct effect was defined as a combination of the controlled direct effect and the reference interaction effect. An indirect effect was defined as a combination of the mediation interaction effect and the pure indirect effect.
All statistical tests were two-sided. A p-value less than 0.05 was defined as the threshold of significance. All analyses were conducted using STATA version 16.0 (Stata Corp LP, Collage Station, TX, USA).
Results
In total, 905,530 subjects from 21 cohorts in Bangladesh, China, India, Iran, Japan, Korea, and Taiwan were included in the study. Cohort profiles and baseline characteristics of study subjects are shown in Table 1 and Supplementary Table 1, respectively. During a mean follow-up period of 14.0 years, we identified 2353 BTC deaths from 21 cohorts and 2905 BTC incident cases from 14 cohorts (Supplementary Table 2).
Table 1.
Cohort profiles
| Cohort name | Country | No. of subjects | Age at baseline | Mean follow up time (years) | Person-Years | No. of BTC deaths |
|---|---|---|---|---|---|---|
| HEALS | Bangladesh | 19,591 | 17–75 | 10.0 | 195,118 | 9 |
| Linxian | China | 29,446 | 26–82 | 21.3 | 626,057 | 20 |
| SCS | China | 18,092 | 30–78 | 22.2 | 401,021 | 84 |
| SMHS | China | 59,466 | 40–74 | 11.9 | 709,130 | 72 |
| SWHS | China | 69,810 | 40–70 | 17.4 | 1,215,881 | 163 |
| Mumbai | India | 145,047 | 35–98 | 5.2 | 756,247 | 33 |
| Golestan | Iran | 49,064 | 36–81 | 12.4 | 610,801 | 39 |
| JPHC1 | Japan | 41,775 | 40–59 | 21.0 | 878,749 | 160 |
| JPHC2 | Japan | 54,425 | 40–69 | 17.8 | 966,219 | 232 |
| JACC | Japan | 85,229 | 40–79 | 16.0 | 1,362,562 | 434 |
| Miyagi | Japan | 44,322 | 40–64 | 21.6 | 955,534 | 187 |
| Ohsaki | Japan | 46,018 | 40–80 | 10.8 | 497,923 | 157 |
| LSS | Japan | 49,424 | 19–98 | 21.9 | 1,084,701 | 322 |
| Takayama | Japan | 28,974 | 35–101 | 13.7 | 397,295 | 100 |
| Miyagi3P | Japan | 28,956 | 40–98 | 11.6 | 336,019 | 59 |
| Aichi3P | Japan | 32,069 | 40–103 | 11.6 | 371,678 | 91 |
| KMCC | Korea | 18,771 | 15–91 | 13.9 | 261,251 | 83 |
| SeoulM | Korea | 13,953 | 25–82 | 15.6 | 217,504 | 34 |
| KNCC | Korea | 37,266 | 16–85 | 9.4 | 350,707 | 9 |
| Namwon | Korea | 10,182 | 44–74 | 12.4 | 126,498 | 33 |
| CBCSP | Taiwan | 23,650 | 29–66 | 15.2 | 360,661 | 32 |
| Total | 905,530 | 15–103 | 14.0 | 12,681,555 | 2353 |
Abbreviations: HEALS, Health Effects for Arsenic Longitudinal Study Bangladesh; Linxian, Linxian General Population Trial Cohort; SCS, Shanghai Cohort Study; SMHS, Shanghai Men’s Health Study; SWHS, Shanghai Women’s Health Study; Mumbai, Mumbai Cohort Study; Golestan, Golestan Cohort Study; JPHC, Japan Public Health Center-based prospective Study; JPHC2, Japan Public Health Center-based prospective Study; JACC, Japan Collaborative Cohort Study; Miyagi, Miyagi Cohort Study; Ohsaki, Ohsaki National Health Insurance Cohort Study; LSS, Life Span Study Cohort; Takayama, Takayama Study; Miyagi3P, Three Prefecture Cohort Study Miyagi; Aichi3P, Three Prefecture Cohort Study Aichi; KMCC, Korean Multi-center Cancer Cohort Study; SeoulM, Seoul Male Cancer Cohort; KNCC, Korean National Cancer Center Cohort; Namwon, The Namwon Study; CBCSP, Community-based Cancer Screening Project
The effect of BMI on the risk of BTC mortality is shown in Table 2. Among males, obese BMI in reference to normal BMI was positively associated with BTC mortality with an adjusted HR of 1.19 (95%CI, 1.02–1.38). Male BMI had a similar positive association with eBDC, but not with iBDC or GBC. BMI ≥25 kg/m2 among females was significantly associated with elevated risk of BTC mortality (HR 1.30, 95%CI 1.14–1.49). This association was consistent in all subsites (tBTC, iBDC, GBC, and eBDC). The effects of BMI on the risk of BTC mortality had no statistically significant interaction with sex.
Table 2.
BMI and biliary tract cancer mortality
| BMI | Cases | HR1 | 95% CI | trend-p | HR2 | 95% CI | trend-p | HR3 | 95% CI | trend-p | |||
|---|---|---|---|---|---|---|---|---|---|---|---|---|---|
| Biliary tract cancer | |||||||||||||
| Males | 0.001 | 0.001 | 0.001 | ||||||||||
| <18.5 | 57 | 0.87 | (0.66 | -1.14) | 0.87 | (0.66 | -1.14) | 0.79 | (0.59 | -1.07) | |||
| 18.5– <23 | 513 | Reference | Reference | Reference | |||||||||
| 23≤ <25 | 270 | 1.06 | (0.92 | -1.23) | 1.06 | (0.91 | -1.23) | 1.05 | (0.90 | -1.22) | |||
| ≥25 | 275 | 1.19 | (1.02 | -1.38) | 1.19 | (1.02 | -1.38) | 1.17 | (1.00 | -1.37) | |||
| Females | <0.001 | <0.001 | <0.001 | ||||||||||
| <18.5 | 83 | 0.95 | (0.75 | -1.21) | 0.95 | (0.75 | -1.21) | 0.97 | (0.76 | -1.23) | |||
| 18.5– <23 | 484 | Reference | Reference | Reference | |||||||||
| 23≤ <25 | 275 | 1.16 | (1.00 | -1.35) | 1.16 | (1.00 | -1.35) | 1.18 | (1.01 | -1.38) | |||
| ≥25 | 396 | 1.30 | (1.14 | -1.50) | 1.30 | (1.14 | -1.49) | 1.32 | (1.14 | -1.52) | |||
| Interaction | 0.939 | 0.968 | 0.859 | ||||||||||
| Total biliary tract cancer | |||||||||||||
| Males | 0.001 | 0.001 | 0.001 | ||||||||||
| <18.5 | 47 | 0.85 | (0.63 | -1.15) | 0.85 | (0.63 | -1.15) | 0.77 | (0.55 | -1.06) | |||
| 18.5– <23 | 478 | Reference | Reference | Reference | |||||||||
| 23≤ <25 | 250 | 1.04 | (0.89 | -1.21) | 1.04 | (0.89 | -1.21) | 1.05 | (0.89 | -1.23) | |||
| ≥25 | 246 | 1.16 | (0.99 | -1.36) | 1.16 | (0.99 | -1.35) | 1.15 | (0.98 | -1.35) | |||
| Females | <0.001 | <0.001 | <0.001 | ||||||||||
| <18.5 | 78 | 1.01 | (0.79 | -1.29) | 1.01 | (0.79 | -1.30) | 1.02 | (0.79 | -1.31) | |||
| 18.5– <23 | 430 | Reference | Reference | Reference | |||||||||
| 23≤ <25 | 236 | 1.15 | (0.98 | -1.35) | 1.15 | (0.98 | -1.35) | 1.16 | (0.98 | -1.36) | |||
| ≥25 | 327 | 1.33 | (1.15 | -1.54) | 1.32 | (1.14 | -1.53) | 1.33 | (1.15 | -1.55) | |||
| Interaction | 0.805 | 0.843 | 0.688 | ||||||||||
| Intrahepatic bile duct | |||||||||||||
| Males | 0.228 | 0.249 | 0.125 | ||||||||||
| <18.5 | 5 | 0.64 | (0.26 | -1.59) | 0.64 | (0.26 | -1.60) | 0.71 | (0.29 | -1.78) | |||
| 18.5– <23 | 82 | Reference | Reference | Reference | |||||||||
| 23≤ <25 | 34 | 0.74 | (0.50 | -1.11) | 0.74 | (0.49 | -1.11) | 0.80 | (0.53 | -1.21) | |||
| ≥25 | 48 | 1.11 | (0.77 | -1.60) | 1.10 | (0.77 | -1.59) | 1.19 | (0.82 | -1.72) | |||
| Females | 0.041 | 0.027 | 0.028 | ||||||||||
| <18.5 | 5 | 0.87 | (0.34 | -2.22) | 0.87 | (0.34 | -2.21) | 0.87 | (0.34 | -2.21) | |||
| 18.5– <23 | 43 | Reference | Reference | Reference | |||||||||
| 23≤ <25 | 25 | 1.09 | (0.66 | -1.79) | 1.10 | (0.67 | -1.81) | 1.06 | (0.64 | -1.75) | |||
| ≥25 | 43 | 1.52 | (0.99 | -2.34) | 1.57 | (1.02 | -2.40) | 1.57 | (1.02 | -2.41) | |||
| Interaction | 0.664 | 0.686 | 0.724 | ||||||||||
| Gallbladder | |||||||||||||
| Males | 0.407 | 0.385 | 0.645 | ||||||||||
| <18.5 | 20 | 1.17 | (0.72 | -1.89) | 1.16 | (0.72 | -1.89) | 1.08 | (0.64 | -1.83) | |||
| 18.5– <23 | 128 | Reference | Reference | Reference | |||||||||
| 23≤ <25 | 61 | 0.99 | (0.73 | -1.34) | 0.99 | (0.72 | -1.34) | 1.03 | (0.75 | -1.41) | |||
| ≥25 | 48 | 0.88 | (0.63 | -1.24) | 0.88 | (0.62 | -1.23) | 0.90 | (0.63 | -1.27) | |||
| Females | 0.010 | 0.011 | 0.017 | ||||||||||
| <18.5 | 35 | 0.97 | (0.67 | -1.40) | 0.97 | (0.67 | -1.40) | 0.91 | (0.62 | -1.34) | |||
| 18.5– <23 | 190 | Reference | Reference | Reference | |||||||||
| 23≤ <25 | 96 | 1.08 | (0.84 | -1.38) | 1.08 | (0.84 | -1.38) | 1.03 | (0.80 | -1.34) | |||
| ≥25 | 140 | 1.30 | (1.04 | -1.62) | 1.29 | (1.03 | -1.61) | 1.26 | (1.00 | -1.59) | |||
| Interaction | 0.082 | 0.084 | 0.116 | ||||||||||
| Extrahepatic bile duct | |||||||||||||
| Males | <0.001 | <0.001 | <0.001 | ||||||||||
| <18.5 | 26 | 0.78 | (0.52 | -1.18) | 0.78 | (0.52 | -1.17) | 0.68 | (0.44 | -1.05) | |||
| 18.5– <23 | 281 | Reference | Reference | Reference | |||||||||
| 23≤ <25 | 166 | 1.18 | (0.97 | -1.43) | 1.17 | (0.97 | -1.42) | 1.14 | (0.94 | -1.39) | |||
| ≥25 | 166 | 1.33 | (1.09 | -1.62) | 1.33 | (1.09 | -1.62) | 1.28 | (1.04 | -1.56) | |||
| Females | 0.012 | 0.014 | 0.009 | ||||||||||
| <18.5 | 42 | 1.08 | (0.77 | -1.50) | 1.08 | (0.77 | -1.51) | 1.14 | (0.81 | -1.60) | |||
| 18.5– <23 | 215 | Reference | Reference | Reference | |||||||||
| 23≤ <25 | 127 | 1.26 | (1.01 | -1.58) | 1.26 | (1.01 | -1.58) | 1.31 | (1.05 | -1.65) | |||
| ≥25 | 161 | 1.32 | (1.07 | -1.63) | 1.32 | (1.07 | -1.63) | 1.36 | (1.10 | -1.69) | |||
| Interaction | 0.356 | 0.336 | 0.527 | ||||||||||
HR1, Adjusted for age; HR2, Adjusted for age, education, population density, marriage status, past history of CHD, stroke, DM, hypertension, smoking status and alchol drinking status.
Abbreviations: BMI, body mass index; CI, confidence interval; HR, hazard ratio
The associations of BMI with BTC incidence were similar to those with mortality (Supplemental Table 3). BMI in males was associated with BTC, tBTC, iBDC, and eBDC incidence, whereas male GBC was not associated with BMI. For females, BMI was associated with the incidence of BTC and in all subsites. The effect of BMI might have varied even within Asian populations. East Asians showed similar results to the overall analysis, but the number of cases was limited, necessitating further investigation of the effect of BMI in West Asian and South Asian populations (Supplementary Table 4).
Cholelithiasis in males had no statistically significant association with mortality of BTC or its subtypes (Table 3). In contrast, among females, cholelithiasis was a statistically significant risk factor for mortality of BTC and its subtypes. The effects of cholelithiasis on BTC incidence were similar to those on BTC mortality.
Table 3.
Cholelithiasis and biliary tract cancer mortality and incidence.
| Site | Cases | HR1 | 95% CI | HR2 | 95% CI | HR3 | 95% CI | |||||
|---|---|---|---|---|---|---|---|---|---|---|---|---|
| Mortality | ||||||||||||
| Males | ||||||||||||
| Biliary Tract Cancer | 574 | 1.40 | (0.97 | -2.00) | 1.39 | (0.97 | -1.99) | 1.23 | (0.82 | -1.83) | ||
| total Biliary Tract Cancer | 538 | 1.34 | (0.94 | -1.93) | 1.36 | (0.95 | -1.95) | 1.21 | (0.81 | -1.80) | ||
| Intrahepatic bile duct | 92 | 1.69 | (0.73 | -3.90) | 1.69 | (0.73 | -3.90) | 1.84 | (0.79 | -4.26) | ||
| Gallbladder | 113 | 0.98 | (0.40 | -2.41) | 0.98 | (0.40 | -2.41) | 0.67 | (0.21 | -2.11) | ||
| Extrahepatic bile duct | 341 | 1.43 | (0.93 | -2.21) | 1.43 | (0.92 | -2.21) | 1.25 | (0.77 | -2.03) | ||
| Females | ||||||||||||
| Biliary Tract Cancer | 628 | 3.00 | (2.45 | -3.66) | 2.99 | (2.44 | -3.66) | 2.94 | (2.39 | -3.63) | ||
| total Biliary Tract Cancer | 469 | 2.67 | (2.06 | -3.46) | 2.68 | (2.06 | -3.48) | 2.60 | (1.97 | -3.43) | ||
| Intrahepatic bile duct | 57 | 2.92 | (1.42 | -6.01) | 3.00 | (1.45 | -6.20) | 3.12 | (1.51 | -6.45) | ||
| Gallbladder | 183 | 3.08 | (2.07 | -4.59) | 3.12 | (2.09 | -4.67) | 2.89 | (1.87 | -4.49) | ||
| Extrahepatic bile duct | 230 | 2.40 | (1.64 | -3.51) | 2.37 | (1.61 | -3.50) | 2.37 | (1.58 | -3.56) | ||
| Incidence | ||||||||||||
| Males | ||||||||||||
| Biliary Tract Cancer | 839 | 1.34 | (0.99 | -1.81) | 1.33 | (0.98 | -1.79) | 1.25 | (0.90 | -1.73) | ||
| total Biliary Tract Cancer | 430 | 1.82 | (1.24 | -2.67) | 1.81 | (1.23 | -2.65) | 1.62 | (1.06 | -2.46) | ||
| Intrahepatic bile duct | 122 | 1.78 | (0.82 | -3.85) | 1.76 | (0.81 | -3.82) | 1.37 | (0.55 | -3.39) | ||
| Gallbladder | 201 | 1.33 | (0.74 | -2.40) | 1.34 | (0.74 | -2.41) | 1.25 | (0.66 | -2.37) | ||
| Extrahepatic bile duct | 505 | 1.17 | (0.79 | -1.73) | 1.15 | (0.78 | -1.71) | 1.09 | (0.71 | -1.67) | ||
| Females | ||||||||||||
| Biliary Tract Cancer | 856 | 2.62 | (2.19 | -3.14) | 2.63 | (2.19 | -3.15) | 2.57 | (2.13 | -3.11) | ||
| total Biliary Tract Cancer | 521 | 2.94 | (2.35 | -3.68) | 2.92 | (2.33 | -3.67) | 2.82 | (2.23 | -3.58) | ||
| Intrahepatic bile duct | 66 | 3.14 | (1.52 | -6.46) | 3.22 | (1.56 | -6.64) | 2.88 | (1.34 | -6.18) | ||
| Gallbladder | 396 | 3.21 | (2.51 | -4.10) | 3.23 | (2.52 | -4.14) | 3.28 | (2.53 | -4.26) | ||
| Extrahepatic bile duct | 416 | 2.13 | (1.61 | -2.82) | 2.10 | (1.58 | -2.79) | 1.97 | (1.45 | -2.66) | ||
HR1, Adjusted for BMI and age; HR2, Adjusted for BMI, age, education, population density, marriage status, past history of CHD, stroke, DM, hypertension, smoking status and alchol drinking status.; HR3, Excluded early cases and adjusted for the same variables as HR2.
Abbreviations: BMI, body mass index; CI, confidence interval; HR, hazard ratio
Table 4 shows the direct and indirect effects of BMI on BTC mortality. BMI ≥25kg/m2 had neither direct nor indirect effects on BTC mortality in males. In contrast, direct and indirect effects on male BTC incidence were statistically significant (Supplementary Table 5). A marginally statistically significant positive direct effect (HR 1.20, 95%CI 0.98–1.47) and statistically significant positive indirect effect (HR 1.04, 95%CI 1.02–1.06) on BTC mortality were observed in females. Consistent statistically significant direct and indirect effects were observed in tBDC and GBC. The direct and indirect effects on BTC incidence in females were also consistently statistically significant.
Table 4.
Total, direct, and indirect effects of BMI for the risk of biliary tract cancer mortality.
| Model 1 | Model 2 | Model 3 | |||||||||
|---|---|---|---|---|---|---|---|---|---|---|---|
| HR | 95% CI | HR | 95% CI | HR | 95% CI | ||||||
| Males | |||||||||||
| Biliary Tract Cancer | |||||||||||
| Total effect | 1.16 | (0.94 | -1.44) | 1.16 | (0.93 | -1.44) | 1.14 | (0.91 | -1.43) | ||
| Direct effect | 1.16 | (0.93 | -1.43) | 1.15 | (0.93 | -1.43) | 1.14 | (0.91 | -1.42) | ||
| Indirect effect | 1.00 | (1.00 | -1.01) | 1.00 | (1.00 | -1.01) | 1.00 | (1.00 | -1.01) | ||
| total Biliary Tract Cancer | |||||||||||
| Total effect | 1.08 | (0.87 | -1.34) | 1.06 | (0.86 | -1.31) | 1.06 | (0.85 | -1.31) | ||
| Direct effect | 1.08 | (0.87 | -1.33) | 1.05 | (0.85 | -1.30) | 1.05 | (0.84 | -1.31) | ||
| Indirect effect | 1.01 | (1.00 | -1.01) | 1.01 | (1.00 | -1.01) | 1.00 | (1.00 | -1.01) | ||
| Intrahepatic bile duct | |||||||||||
| Total effect | 1.14 | (0.66 | -1.96) | 1.10 | (0.65 | -1.88) | 1.27 | (0.69 | -2.33) | ||
| Direct effect | 1.13 | (0.65 | -1.94) | 1.09 | (0.64 | -1.86) | 1.25 | (0.68 | -2.30) | ||
| Indirect effect | 1.01 | (0.99 | -1.03) | 1.01 | (0.99 | -1.03) | 1.01 | (0.99 | -1.03) | ||
| Gallbladder | |||||||||||
| Total effect | 0.76 | (0.53 | -1.08) | 0.73 | (0.52 | -1.02) | 0.77 | (0.53 | -1.11) | ||
| Direct effect | 0.76 | (0.53 | -1.08) | 0.73 | (0.52 | -1.01) | 0.76 | (0.53 | -1.11) | ||
| Indirect effect | 1.00 | (0.99 | -1.01) | 1.00 | (0.99 | -1.01) | 1.00 | (0.99 | -1.01) | ||
| Extrahepatic bile duct | |||||||||||
| Total effect | 1.24 | (0.93 | -1.67) | 1.24 | (0.92 | -1.66) | 1.16 | (0.86 | -1.55) | ||
| Direct effect | 1.23 | (0.92 | -1.66) | 1.23 | (0.91 | -1.65) | 1.15 | (0.86 | -1.55) | ||
| Indirect effect | 1.01 | (1.00 | -1.02) | 1.01 | (1.00 | -1.02) | 1.00 | (1.00 | -1.01) | ||
| Females | |||||||||||
| Biliary Tract Cancer | |||||||||||
| Total effect | 1.25 | (1.02 | -1.54) | 1.28 | (1.03 | -1.58) | 1.25 | (1.01 | -1.56) | ||
| Direct effect | 1.20 | (0.98 | -1.47) | 1.23 | (1.00 | -1.52) | 1.21 | (0.98 | -1.50) | ||
| Indirect effect | 1.04 | (1.02 | -1.06) | 1.04 | (1.02 | -1.05) | 1.03 | (1.02 | -1.05) | ||
| total Biliary Tract Cancer | |||||||||||
| Total effect | 1.48 | (1.13 | -1.94) | 1.45 | (1.11 | -1.89) | 1.44 | (1.09 | -1.90) | ||
| Direct effect | 1.44 | (1.11 | -1.89) | 1.41 | (1.08 | -1.84) | 1.41 | (1.07 | -1.86) | ||
| Indirect effect | 1.02 | (1.00 | -1.05) | 1.02 | (1.01 | -1.04) | 1.02 | (1.00 | -1.04) | ||
| Intrahepatic bile duct | |||||||||||
| Total effect | 2.85 | (0.97 | -8.39) | 2.40 | (0.88 | -6.49) | 2.56 | (0.91 | -7.26) | ||
| Direct effect | 2.82 | (0.96 | -8.30) | 2.36 | (0.88 | -6.36) | 2.52 | (0.90 | -7.10) | ||
| Indirect effect | 1.01 | (0.95 | -1.08) | 1.02 | (0.96 | -1.08) | 1.02 | (0.96 | -1.08) | ||
| Gallbladder | |||||||||||
| Total effect | 1.81 | (1.12 | -2.94) | 1.67 | (1.05 | -2.65) | 1.51 | (0.95 | -2.40) | ||
| Direct effect | 1.71 | (1.07 | -2.73) | 1.58 | (1.01 | -2.47) | 1.45 | (0.93 | -2.28) | ||
| Indirect effect | 1.06 | (1.01 | -1.11) | 1.06 | (1.01 | -1.11) | 1.04 | (1.00 | -1.08) | ||
| Extrahepatic bile duct | |||||||||||
| Total effect | 1.12 | (0.81 | -1.55) | 1.16 | (0.82 | -1.62) | 1.20 | (0.84 | -1.72) | ||
| Direct effect | 1.12 | (0.81 | -1.54) | 1.15 | (0.82 | -1.61) | 1.19 | (0.83 | -1.72) | ||
| Indirect effect | 1.00 | (0.98 | -1.02) | 1.00 | (0.98 | -1.02) | 1.01 | (0.99 | -1.03) | ||
Model 1, Adjusted for age and cohort; Model 2, Adjusted for age, cohort, education, population density, marriage status, past history of CHD, stroke, DM, hypertension, smoking status and alchol drinking status.
Abbreviations: CI, confidence interval; HR, hazard ratio
The association between BMI and BTC mortality stratified by cholelithiasis is shown in Table 5. Information on cholelithiasis and BTC death was available in 11 cohort studies (Supplementary Table 2). Cholelithiasis had statistically significant interaction with BMI for BTC mortality risk in males and females (interaction-p 0.043 and <0.001, respectively). When cholelithiasis was present, the association between BMI and BTC risk was not observed in either males and females. Although the number of male BTC cases with cholelithiasis was limited, the association between BMI and BTC could not be well assessed. In contrast, obesity was associated with BTC among females without cholelithiasis. As for males without cholelithiasis, BMI was not associated with BTC, except eBDC. These cholelithiasis-stratified effects of BMI on BTC incidence were similar to those on BTC mortality (Supplemental Table 6).
Table 5.
BMI and biliary tract cancer mortality stratified by cholelithiasis
| BMI | Cases | HR1 | 95% CI | trend-p | HR2 | 95% CI | trend-p | HR3 | 95% CI | trend-p | ||||
|---|---|---|---|---|---|---|---|---|---|---|---|---|---|---|
| Males | ||||||||||||||
| Biliary Tract Cancer | ||||||||||||||
| Cholelithiasis (+) | 0.615 | 0.525 | 0.618 | |||||||||||
| <18.5 | 0 | NE | NE | NE | ||||||||||
| 18.5– <23 | 15 | Reference | Reference | Reference | ||||||||||
| 23≤ <25 | 4 | 0.40 | (0.13 | –1.21) | 0.37 | (0.12 | –1.14) | 0.46 | (0.15 | –1.45) | ||||
| ≥25 | 13 | 1.16 | (0.54 | –2.48) | 1.22 | (0.57 | –2.63) | 1.20 | (0.50 | –2.90) | ||||
| Cholelithiasis (−) | 0.177 | 0.183 | 0.240 | |||||||||||
| <18.5 | 22 | 1.09 | (0.70 | –1.69) | 1.09 | (0.70 | –1.69) | 1.09 | (0.70 | –1.69) | ||||
| 18.5– <23 | 211 | Reference | Reference | Reference | ||||||||||
| 23≤ <25 | 131 | 1.04 | (0.84 | –1.30) | 1.04 | (0.84 | –1.30) | 0.99 | (0.79 | –1.24) | ||||
| ≥25 | 145 | 1.19 | (0.96 | –1.48) | 1.19 | (0.96 | –1.48) | 1.15 | (0.92 | –1.44) | ||||
| Interaction | 0.042 | 0.043 | 0.217 | |||||||||||
| total Biliary Tract Cancer | ||||||||||||||
| Cholelithiasis (+) | 0.370 | 0.358 | 0.511 | |||||||||||
| <18.5 | 0 | NE | NE | NE | ||||||||||
| 18.5– <23 | 14 | Reference | Reference | Reference | ||||||||||
| 23≤ <25 | 4 | 0.41 | (0.14 | –1.26) | 0.40 | (0.13 | –1.23) | 0.48 | (0.15 | –1.53) | ||||
| ≥25 | 14 | 1.27 | (0.60 | –2.68) | 1.27 | (0.60 | –2.71) | 1.20 | (0.51 | –2.82) | ||||
| Cholelithiasis (−) | 0.224 | 0.224 | 0.228 | |||||||||||
| <18.5 | 18 | 1.06 | (0.65 | –1.73) | 1.06 | (0.65 | –1.73) | 1.06 | (0.65 | –1.73) | ||||
| 18.5– <23 | 208 | Reference | Reference | Reference | ||||||||||
| 23≤ <25 | 118 | 0.94 | (0.75 | –1.18) | 0.94 | (0.75 | –1.18) | 0.92 | (0.73 | –1.17) | ||||
| ≥25 | 125 | 1.06 | (0.85 | –1.33) | 1.06 | (0.85 | –1.33) | 1.05 | (0.83 | –1.32) | ||||
| Interaction | 0.035 | 0.038 | 0.190 | |||||||||||
| Intrahepatic bile duct | ||||||||||||||
| Cholelithiasis (+) | 0.881 | 0.987 | 0.987 | |||||||||||
| <18.5 | 0 | NE | NE | NE | ||||||||||
| 18.5– <23 | 3 | Reference | Reference | Reference | ||||||||||
| 23≤ <25 | 0 | NE | NE | NE | ||||||||||
| ≥25 | 3 | 1.18 | (0.24 | –5.92) | 1.08 | (0.21 | –5.65) | 1.08 | (0.21 | –5.65) | ||||
| Cholelithiasis (−) | 0.662 | 0.559 | 0.263 | |||||||||||
| <18.5 | 2 | 0.76 | (0.18 | –3.18) | 0.76 | (0.18 | –3.18) | 0.76 | (0.18 | –3.18) | ||||
| 18.5– <23 | 39 | Reference | Reference | Reference | ||||||||||
| 23≤ <25 | 13 | 0.52 | (0.28 | –0.98) | 0.53 | (0.28 | –0.99) | 0.61 | (0.32 | –1.17) | ||||
| ≥25 | 21 | 0.87 | (0.51 | –1.49) | 0.90 | (0.52 | –1.54) | 1.05 | (0.60 | –1.83) | ||||
| Interaction | 0.216 | 0.217 | 0.256 | |||||||||||
| Gallbladder | ||||||||||||||
| Cholelithiasis (+) | 0.689 | 0.750 | 0.458 | |||||||||||
| <18.5 | 0 | NE | NE | NE | ||||||||||
| 18.5– <23 | 3 | Reference | Reference | Reference | ||||||||||
| 23≤ <25 | 0 | NE | NE | NE | ||||||||||
| ≥25 | 2 | 0.83 | (0.13 | –5.10) | 0.86 | (0.14 | –5.46) | 3.15 | (0.23 | –42.93) | ||||
| Cholelithiasis (−) | 0.068 | 0.070 | 0.197 | |||||||||||
| <18.5 | 5 | 1.17 | (0.46 | –2.95) | 1.17 | (0.46 | –2.95) | 1.17 | (0.46 | –2.95) | ||||
| 18.5– <23 | 52 | Reference | Reference | Reference | ||||||||||
| 23≤ <25 | 23 | 0.73 | (0.44 | –1.19) | 0.72 | (0.44 | –1.19) | 0.74 | (0.44 | –1.24) | ||||
| ≥25 | 19 | 0.63 | (0.37 | –1.06) | 0.62 | (0.37 | –1.06) | 0.65 | (0.38 | –1.13) | ||||
| Interaction | 0.543 | 0.570 | 0.528 | |||||||||||
| Extrahepatic bile duct | ||||||||||||||
| Cholelithiasis (+) | 0.177 | 0.150 | 0.536 | |||||||||||
| <18.5 | 0 | NE | NE | NE | ||||||||||
| 18.5– <23 | 8 | Reference | Reference | Reference | ||||||||||
| 23≤ <25 | 4 | 0.73 | (0.22 | –2.43) | 0.68 | (0.20 | –2.29) | NE | ||||||
| ≥25 | 10 | 1.57 | (0.61 | –4.06) | 1.60 | (0.62 | –4.17) | NE | ||||||
| Cholelithiasis (−) | 0.014 | 0.016 | 0.067 | |||||||||||
| <18.5 | 11 | 1.10 | (0.59 | –2.05) | 1.10 | (0.59 | –2.05) | 1.10 | (0.59 | –2.05) | ||||
| 18.5– <23 | 117 | Reference | Reference | Reference | ||||||||||
| 23≤ <25 | 83 | 1.20 | (0.90 | –1.59) | 1.19 | (0.90 | –1.58) | 1.10 | (0.82 | –1.47) | ||||
| ≥25 | 86 | 1.34 | (1.01 | –1.78) | 1.33 | (1.00 | –1.77) | 1.22 | (0.91 | –1.64) | ||||
| Interaction | 0.044 | 0.041 | NE | |||||||||||
| Females | ||||||||||||||
| Biliary Tract Cancer | ||||||||||||||
| Cholelithiasis (+) | 0.924 | 0.910 | 0.786 | |||||||||||
| <18.5 | 8 | 1.60 | (0.74 | –3.45) | 1.60 | (0.74 | –3.45) | 1.60 | (0.74 | –3.45) | ||||
| 18.5– <23 | 42 | Reference | Reference | Reference | ||||||||||
| 23≤ <25 | 23 | 0.75 | (0.45 | –1.25) | 0.76 | (0.45 | –1.26) | 0.83 | (0.49 | –1.39) | ||||
| ≥25 | 57 | 0.99 | (0.66 | –1.49) | 0.98 | (0.65 | –1.48) | 0.98 | (0.64 | –1.50) | ||||
| Cholelithiasis (−) | 0.001 | 0.002 | 0.001 | |||||||||||
| <18.5 | 23 | 1.05 | (0.68 | –1.64) | 1.05 | (0.68 | –1.64) | 1.05 | (0.68 | –1.64) | ||||
| 18.5– <23 | 160 | Reference | Reference | Reference | ||||||||||
| 23≤ <25 | 121 | 1.36 | (1.07 | –1.72) | 1.35 | (1.06 | –1.71) | 1.38 | (1.08 | –1.76) | ||||
| ≥25 | 168 | 1.41 | (1.13 | –1.76) | 1.39 | (1.11 | –1.74) | 1.40 | (1.11 | –1.76) | ||||
| Interaction | <0.001 | <0.001 | <0.001 | |||||||||||
| total Biliary Tract Cancer | ||||||||||||||
| Cholelithiasis (+) | 0.717 | 0.619 | 0.322 | |||||||||||
| <18.5 | 5 | 1.65 | (0.62 | –4.38) | 1.65 | (0.62 | –4.38) | 1.65 | (0.62 | –4.38) | ||||
| 18.5– <23 | 25 | Reference | Reference | Reference | ||||||||||
| 23≤ <25 | 14 | 0.86 | (0.45 | –1.67) | 0.88 | (0.45 | –1.69) | 0.99 | (0.51 | –1.95) | ||||
| ≥25 | 26 | 0.98 | (0.56 | –1.69) | 0.94 | (0.54 | –1.63) | 0.91 | (0.50 | –1.65) | ||||
| Cholelithiasis (−) | <0.001 | <0.001 | <0.001 | |||||||||||
| <18.5 | 21 | 1.54 | (0.96 | –2.46) | 1.54 | (0.96 | –2.46) | 1.54 | (0.96 | –2.46) | ||||
| 18.5– <23 | 113 | Reference | Reference | Reference | ||||||||||
| 23≤ <25 | 99 | 1.55 | (1.18 | –2.03) | 1.54 | (1.17 | –2.02) | 1.55 | (1.16 | –2.05) | ||||
| ≥25 | 141 | 1.72 | (1.34 | –2.21) | 1.68 | (1.31 | –2.17) | 1.71 | (1.31 | –2.22) | ||||
| Interaction | <0.001 | <0.001 | 0.001 | |||||||||||
| Intrahepatic bile duct | ||||||||||||||
| Cholelithiasis (+) | 0.735 | 0.828 | 0.828 | |||||||||||
| <18.5 | 0 | NE | NE | NE | ||||||||||
| 18.5– <23 | 4 | Reference | Reference | Reference | ||||||||||
| 23≤ <25 | 2 | 0.69 | (0.13 | –3.79) | 0.73 | (0.13 | –4.06) | 0.73 | (0.13 | –4.06) | ||||
| ≥25 | 3 | 0.63 | (0.14 | –2.81) | 0.70 | (0.15 | –3.24) | 0.70 | (0.15 | –3.24) | ||||
| Cholelithiasis (−) | <0.001 | <0.001 | <0.001 | |||||||||||
| <18.5 | 1 | 1.64 | (0.20 | –13.40) | 1.64 | (0.20 | –13.40) | 1.64 | (0.20 | –13.40) | ||||
| 18.5– <23 | 7 | Reference | Reference | Reference | ||||||||||
| 23≤ <25 | 15 | 3.42 | (1.39 | –8.38) | 3.41 | (1.39 | –8.39) | 3.18 | (1.28 | –7.90) | ||||
| ≥25 | 24 | 4.12 | (1.77 | –9.57) | 4.11 | (1.76 | –9.59) | 4.11 | (1.76 | –9.60) | ||||
| Interaction | 0.490 | 0.495 | 0.475 | |||||||||||
| Gallbladder | ||||||||||||||
| Cholelithiasis (+) | 0.206 | 0.225 | 0.968 | |||||||||||
| <18.5 | 2 | 2.51 | (0.51 | –12.34) | 2.51 | (0.51 | –12.34) | 2.51 | (0.51 | –12.34) | ||||
| 18.5– <23 | 7 | Reference | Reference | Reference | ||||||||||
| 23≤ <25 | 5 | 1.11 | (0.35 | –3.50) | 1.11 | (0.35 | –3.53) | 1.28 | (0.39 | –4.23) | ||||
| ≥25 | 16 | 2.18 | (0.89 | –5.32) | 2.11 | (0.86 | –5.18) | 1.82 | (0.68 | –4.90) | ||||
| Cholelithiasis (−) | 0.002 | 0.003 | 0.004 | |||||||||||
| <18.5 | 7 | 1.30 | (0.59 | –2.91) | 1.30 | (0.59 | –2.91) | 1.30 | (0.59 | –2.91) | ||||
| 18.5– <23 | 48 | Reference | Reference | Reference | ||||||||||
| 23≤ <25 | 35 | 1.27 | (0.82 | –1.96) | 1.25 | (0.81 | –1.93) | 1.16 | (0.73 | –1.84) | ||||
| ≥25 | 56 | 1.57 | (1.06 | –2.31) | 1.52 | (1.03 | –2.25) | 1.42 | (0.95 | –2.14) | ||||
| Interaction | <0.001 | <0.001 | <0.001 | |||||||||||
| Extrahepatic bile duct | ||||||||||||||
| Cholelithiasis (+) | 0.116 | 0.093 | 0.205 | |||||||||||
| <18.5 | 3 | 1.40 | (0.40 | –4.99) | 1.40 | (0.40 | –4.99) | 1.40 | (0.40 | –4.99) | ||||
| 18.5– <23 | 15 | Reference | Reference | Reference | ||||||||||
| 23≤ <25 | 7 | 0.75 | (0.30 | –1.85) | 0.74 | (0.30 | –1.82) | 0.86 | (0.34 | –2.16) | ||||
| ≥25 | 7 | 0.45 | (0.18 | –1.10) | 0.43 | (0.17 | –1.06) | 0.50 | (0.20 | –1.27) | ||||
| Cholelithiasis (−) | 0.355 | 0.404 | 0.264 | |||||||||||
| <18.5 | 13 | 1.66 | (0.90 | –3.07) | 1.66 | (0.90 | –3.07) | 1.66 | (0.90 | –3.07) | ||||
| 18.5– <23 | 58 | Reference | Reference | Reference | ||||||||||
| 23≤ <25 | 49 | 1.54 | (1.05 | –2.26) | 1.54 | (1.05 | –2.26) | 1.66 | (1.11 | –2.49) | ||||
| ≥25 | 61 | 1.52 | (1.05 | –2.18) | 1.50 | (1.04 | –2.16) | 1.60 | (1.09 | –2.36) | ||||
| Interaction | 0.425 | 0.435 | 0.361 | |||||||||||
HR1, Adjusted for age; HR2, Adjusted for age, education, population density, marriage status, past history of CHD, stroke, DM, hypertension, smoking status and alchol drinking status.
Abbreviations: BMI, body mass index; CI, confidence interval; HR, hazard ratio
Discussion
This pooled analysis of 21 Asian population-based cohort studies suggests that a BMI of 25kg/m2 or more was associated with elevated BTC incidence and mortality risk. The association was evident for eBDC among males and all subsites among females. Mediation analysis suggested that BMI has both direct and indirect statistically significant associations with BTC risk in females, whereas direct and indirect effects were unclear in males. Stratification by cholelithiasis suggested that a BMI of 25kg/m2 or more was not associated with BTC among those with cholelithiasis, although cholelithiasis was a statistically significant risk factor for BTC risk.
The direct and indirect effects of mediation analysis suggest that obesity has two pathways in BTC carcinogenesis. Additionally, interactions of cholelithiasis suggest that obesity has different effects on BTC in these two pathways. Obesity and subsequent dyslipidemia likely enhance cholesterol synthesis and secretion (43), and in turn affect the risk of cholesterol gallstone development (44). Our present results confirm that symptomatic cholelithiasis is a statistically significant risk factor for BTC, and that BMI is not associated with BTC risk among subjects with symptomatic cholelithiasis. Direct mechanical stress and inflammation caused by gallstones would be a strong and sufficient risk factor for BTC carcinogenesis (45, 46), such that obesity becomes insufficient after gallstone formation. It is also possible that individuals with a history of symptomatic cholelithiasis are more likely to change their lifestyle to lose weight. Treatment of cholelithiasis may also alter risk. Repeated weight measurements and detailed treatment information are needed to answer these questions. Because of the low prevalence of male cholelithiasis, an effect of a cholelithiasis-mediated pathway on BTC risk in males was not clear even in this pooled analysis, which in turn suggests that the association in males is weak, if indeed present, in Asian populations at least.
On the other hand, this study also suggested that obesity affects BTC risk in the absence of symptomatic cholelithiasis. Several biological mechanisms between obesity and cancer have been proposed: adiponectin and adipocytokines; chronic low-level inflammation; insulin and insulin-like growth factors (IGFs); and sex hormones (47). In particular, insulin and IGFs might contribute to BTC carcinogenesis without cholelithiasis. Increased serum IGF level would promote increased cancer risk by promoting cell cycle progression and inhibition of apoptosis (48). Insulin likely leads to increased levels of oxidative stress, which causes DNA damage by promoting the metabolic activity of the cell (49). These findings support the possibility that obesity increases BTC risk without the involvement of cholelithiasis.
This study also suggests a difference in the effect of obesity between Asians and other ethnicities. A previous pooled individual data analysis in a population which was 80% white, 4% black, and 13% Asian/Pacific Islander reported a GBC risk of 1.31 (95%CI, 1.11–1.54) for overweight and 1.72 (1.41–2.08) for obesity (50), which were larger than those in Asians in our present study. Similarly, HRs for both intrahepatic and extrahepatic bile duct cancer were larger in the pooled analysis than in Asians. Therefore, the magnitude of the association between BMI and BTC risk might be smaller in Asians compared with other ethnicities.
A strength of this pooled analysis is its inclusion of more than 900,000 subjects from seven Asian countries. Although the impact of obesity on BTC might differ between Asian and other populations, our present study showed an Asian-specific effect of obesity. Indeed, the effect of BMI may vary even among Asian populations. Similar results were observed among East Asians, although the limited number of cases necessitates further investigation of the effect of BMI in West Asian and South Asian populations. A second strength is its robust consideration of potential confounding. To our knowledge, only a few studies have used cholelithiasis as an adjusting and/or stratifying factor (51). Our study is the first population-based cohort study to clarify the association between BMI and BTC risk stratified by cholelithiasis in an Asian population. In addition, we used mediation analysis to decompose the effects of BMI that were mediated by cholelithiasis and those that were not.
Several limitations of this study should also be mentioned. First, detailed information on cholelithiasis was not available. History of cholelithiasis at baseline was self-reported. Because most gallstones are asymptomatic (52, 53), some subjects reporting no history of cholelithiasis may have in fact had gallstones of which they were unaware. No information was available on the incidence or treatment of cholelithiasis during the follow-up period. This lack of information and resulting misclassification would have diminished the impact of the association. The effects of cholelithiasis on BTC risk observed in this study mainly reflect symptomatic cholelithiasis, and asymptomatic gallstones may have different effects. Second, BMI was the only measure of obesity. Although several methods of evaluating body fatness are available, BMI is easily measured, widely available, and widely accepted as a standard and sufficiently accurate measure of body fatness (37). Third, insufficient control of mediator-outcome confounding, which is an assumption in mediation analysis, might have introduced potential bias (42). Despite taking as many factors into account as possible in this pooled analysis, there may be unmeasured or unknown confounding factors that cause both cholelithiasis and BTC.
In conclusion, obesity was associated with BTC risk both directly and through symptomatic cholelithiasis in this large Asian population. To prevent BTC, Asians are recommended to maintain a healthy weight which ensures a BMI of 18.5 to 22.9. Further epidemiological studies of BTC with consideration to cholelithiasis are warranted.
Supplementary Material
Novelty and Impact.
In biliary tract cancer (BTC), while obesity is considered a probable risk factor, cholelithiasis is an established risk factor. Nevertheless, previous studies of obesity and BTC have not fully accounted for cholelithiasis. We conducted a pooled analysis of 905,530 subjects from 21 cohort studies participating in the Asia Cohort Consortium. Results confirmed the association of BMI with BTC risk in Asians. Moreover, obesity affects BTC risk through cholelithiasis, and may also increase BTC risk without cholelithiasis.
Funding
This work was supported by National Cancer Center Research and Development Fund (2021-A-16). The following grants supported the participating cohort studies and the Asia Cohort Consortium: Health Effects for Arsenic Longitudinal Study Bangladesh (HEALS), National Institute of Environmental Health Science; Linxian General Population Trial Cohort, National Cancer Institute, National Institutes of Health, USA; Shanghai Cohort Study (SCS), National Institutes for Health, R01CA0403092, R01CA144034, UM1CA182876; Shanghai Men’s Health Study (SMHS), The US National Cancer Institute, UM1 CA173640 (Principal Investigator: Xiao-Ou Shu); Shanghai Women’s Health Study (SWHS), The US National Cancer Institute, R37 CA070867 and UM1 CA182910 (Principal Investigator: Wei Zheng); Mumbai Cohort Study, International Agency for Research on Cancer, Lyon, France; Clinical Trials Service Unit, Oxford, UK; World Health Organisation, Geneva, Switzerland; Golestan Cohort Study, The Digestive Diseases Research Institute (DDRI), Tehran University of Medical Sciences, Iran (Grant Number: 81/15), Cancer Research United Kingdom (grant No: C20/A5860), the Intramural Research Program of the U.S. National Cancer Institute at National Institutes of Health (Z01 CP000185-03); Japan Public Health Center-based Prospective Study (JPHC Study) 1, National Cancer Center Research and Development Fund (since 2011), 23-A-31(toku), 26-A-2, 29-A-4 and 2020-A-4; A Grant-in-Aid for Cancer Research from the Ministry of Health, Labour and Welfare of Japan (from 1989 to 2010); Japan Public Health Center-based Prospective Study (JPHC Study) 2, National Cancer Center Research and Development Fund (since 2011), 23-A-31(toku), 26-A-2, 29-A-4 and 2020-A-4; A Grant-in-Aid for Cancer Research from the Ministry of Health, Labour and Welfare of Japan (from 1989 to 2010); Japan Collaborative Cohort Study (JACC), National Cancer Center Research and Development Fund, A Grant-in-Aid for Cancer Research; Grant for Health Services and Grant for Comprehensive Research on Cardiovascular and Life-Style Related Diseases from the Ministry of Health, Labour and Welfare, Japan; Grant for Scientific Research from the Ministry of Education, Culture, Sports, Science and Technology, Japan; Miyagi Cohort, National Cancer Center Research and Development Fund; Ohsaki National Health Insurance Cohort Study, National Cancer Center Research and Development Fund; Life Span Study Cohort, The Japanese Ministry of Health, Labour and Welfare and the US Department of Energy; Takayama Study, National Cancer Center Research and Development Fund; 3 Prefecture Miyagi, National Cancer Center Research and Development Fund; 3 Prefecture Aichi, The Japanese Ministry of the Environment (former Environment Agency); Korean Multi-center Cancer Cohort Study (KMCC), National Research Foundation of Korea (NRF), funded by the Ministry of Science, ICT & Future Planning, 2016R1A2B4014552; Seoul Male Cancer Cohort, National R&D Program for Cancer Control, Ministry of Health & Welfare, Republic of Korea, 0520160-1; Korean National Cancer Center Cohort (KNCC), National Cancer Center Research Grant, 1510040, 1810090, 1910330; Namwon, Chonnam National University Hwasun Hospital Research grant, HCRI21019, HCRI18007-1, HCRI16911-1; Community-based Cancer Screening Project (CBCSP), Ministry of Health and Welfare and Ministry of Science and Technology, Taiwan; ACC Coordinating Center, National Cancer Center Research and Development Fund, 30-A-15
Abbreviations
- ACC
Asia Cohort Consortium
- BMI
body mass index
- BTC
biliary tract cancer
- CI
confidence interval
- eBDC
extrahepatic bile duct cancer
- GBC
gallbladder cancer
- HR
hazard ratio
- iBDC
intrahepatic bile duct cancer
- ICD-O-3
International Classification of Diseases for Oncology Third Edition
- ICD-9
International Classification of Diseases, Ninth Revision
- ICD-10
International Classification of Diseases, Tenth Revision
- tBDC
total bile duct cancer
- WHO
World Health Organization
Footnotes
Conflict of Interest
The authors have no competing financial relationships to disclose.
Ethics Statement
Pooled analysis of the ACC cohorts was approved by the ethical committee of the National Cancer Center Japan (number 2014–041) and each study was approved by respective ethic committees overseeing the participating studies. Informed consent was obtained from all participants.
Data availability statement
Investigators who are interested in using Asia Cohort Consortium data can submit an application for committee review and, upon reasonable request and with the approval of the Institutional Review Board, may be granted access. Further information is available from the corresponding author (https://www.asiacohort.org/).
References
- 1.Global Burden of Disease Collaborative Network. Global Burden of Disease Study 2019 (GBD 2019) Results. Seattle, United States: Institute for Health Metrics and Evaluation (IHME); 2020. [Available from: https://vizhub.healthdata.org/gbd-results/. [Google Scholar]
- 2.Ouyang G, Liu Q, Wu Y, Liu Z, Lu W, Li S, et al. The global, regional, and national burden of gallbladder and biliary tract cancer and its attributable risk factors in 195 countries and territories, 1990 to 2017: A systematic analysis for the Global Burden of Disease Study 2017. Cancer. 2021;127(13):2238–50. [DOI] [PubMed] [Google Scholar]
- 3.Bray F, Colombet M, Mery L, Piñeros M, Znaor A, Zanetti R, et al. Cancer Incidence in Five Continents, Vol. XI (electronic version). Lyon: International Agency for Research on Cancer; 2017. [Google Scholar]
- 4.Campbell PT, Newton CC, Kitahara CM, Patel AV, Hartge P, Koshiol J, et al. Body Size Indicators and Risk of Gallbladder Cancer: Pooled Analysis of Individual-Level Data from 19 Prospective Cohort Studies. Cancer Epidemiol Biomarkers Prev. 2017;26(4):597–606. [DOI] [PMC free article] [PubMed] [Google Scholar]
- 5.Liu H, Zhang Y, Ai M, Wang J, Jin B, Teng Z, et al. Body Mass Index Can Increase the Risk of Gallbladder Cancer: A Meta-Analysis of 14 Cohort Studies. Med Sci Monit Basic Res. 2016;22:146–55. [DOI] [PMC free article] [PubMed] [Google Scholar]
- 6.Li ZM, Wu ZX, Han B, Mao YQ, Chen HL, Han SF, et al. The association between BMI and gallbladder cancer risk: a meta-analysis. Oncotarget. 2016;7(28):43669–79. [DOI] [PMC free article] [PubMed] [Google Scholar]
- 7.Li L, Gan Y, Li W, Wu C, Lu Z. Overweight, obesity and the risk of gallbladder and extrahepatic bile duct cancers: A meta-analysis of observational studies. Obesity (Silver Spring). 2016;24(8):1786–802. [DOI] [PubMed] [Google Scholar]
- 8.Tan W, Gao M, Liu N, Zhang G, Xu T, Cui W. Body Mass Index and Risk of Gallbladder Cancer: Systematic Review and Meta-Analysis of Observational Studies. Nutrients. 2015;7(10):8321–34. [DOI] [PMC free article] [PubMed] [Google Scholar]
- 9.Ahrens W, Timmer A, Vyberg M, Fletcher T, Guenel P, Merler E, et al. Risk factors for extrahepatic biliary tract carcinoma in men: medical conditions and lifestyle: results from a European multicentre case-control study. Eur J Gastroenterol Hepatol. 2007;19(8):623–30. [DOI] [PubMed] [Google Scholar]
- 10.Hsing AW, Gao YT, Han TQ, Rashid A, Sakoda LC, Wang BS, et al. Gallstones and the risk of biliary tract cancer: a population-based study in China. Br J Cancer. 2007;97(11):1577–82. [DOI] [PMC free article] [PubMed] [Google Scholar]
- 11.Welzel TM, Mellemkjaer L, Gloria G, Sakoda LC, Hsing AW, El Ghormli L, et al. Risk factors for intrahepatic cholangiocarcinoma in a low-risk population: a nationwide case-control study. Int J Cancer. 2007;120(3):638–41. [DOI] [PubMed] [Google Scholar]
- 12.Di Ciaula A, Garruti G, Fruhbeck G, De Angelis M, de Bari O, Wang DQ, et al. The Role of Diet in the Pathogenesis of Cholesterol Gallstones. Curr Med Chem. 2019;26(19):3620–38. [DOI] [PMC free article] [PubMed] [Google Scholar]
- 13.Greenland S, Pearl J, Robins JM. Causal diagrams for epidemiologic research. Epidemiology. 1999;10(1):37–48. [PubMed] [Google Scholar]
- 14.Rolland B, Smith BR, Potter JD. Coordinating centers in cancer epidemiology research: the Asia Cohort Consortium coordinating center. Cancer Epidemiol Biomarkers Prev. 2011;20(10):2115–9. [DOI] [PMC free article] [PubMed] [Google Scholar]
- 15.Song M, Rolland B, Potter JD, Kang D. Asia Cohort Consortium: challenges for collaborative research. J Epidemiol. 2012;22(4):287–90. [DOI] [PMC free article] [PubMed] [Google Scholar]
- 16.Argos M, Kalra T, Rathouz PJ, Chen Y, Pierce B, Parvez F, et al. Arsenic exposure from drinking water, and all-cause and chronic-disease mortalities in Bangladesh (HEALS): a prospective cohort study. Lancet. 2010;376(9737):252–8. [DOI] [PMC free article] [PubMed] [Google Scholar]
- 17.Qiao YL, Dawsey SM, Kamangar F, Fan JH, Abnet CC, Sun XD, et al. Total and cancer mortality after supplementation with vitamins and minerals: follow-up of the Linxian General Population Nutrition Intervention Trial. J Natl Cancer Inst. 2009;101(7):507–18. [DOI] [PMC free article] [PubMed] [Google Scholar]
- 18.Ross RK, Yuan JM, Yu MC, Wogan GN, Qian GS, Tu JT, et al. Urinary aflatoxin biomarkers and risk of hepatocellular carcinoma. Lancet. 1992;339(8799):943–6. [DOI] [PubMed] [Google Scholar]
- 19.Shu XO, Li H, Yang G, Gao J, Cai H, Takata Y, et al. Cohort Profile: The Shanghai Men’s Health Study. Int J Epidemiol. 2015;44(3):810–8. [DOI] [PMC free article] [PubMed] [Google Scholar]
- 20.Zheng W, Chow WH, Yang G, Jin F, Rothman N, Blair A, et al. The Shanghai Women’s Health Study: rationale, study design, and baseline characteristics. Am J Epidemiol. 2005;162(11):1123–31. [DOI] [PubMed] [Google Scholar]
- 21.Pednekar MS, Gupta R, Gupta PC. Association of blood pressure and cardiovascular mortality in India: Mumbai cohort study. Am J Hypertens. 2009;22(10):1076–84. [DOI] [PubMed] [Google Scholar]
- 22.Pourshams A, Khademi H, Malekshah AF, Islami F, Nouraei M, Sadjadi AR, et al. Cohort Profile: The Golestan Cohort Study--a prospective study of oesophageal cancer in northern Iran. Int J Epidemiol. 2010;39(1):52–9. [DOI] [PMC free article] [PubMed] [Google Scholar]
- 23.Watanabe S, Tsugane S, Sobue T, Konishi M, Baba S. Study design and organization of the JPHC study. Japan Public Health Center-based Prospective Study on Cancer and Cardiovascular Diseases. J Epidemiol. 2001;11(6 Suppl):S3–7. [DOI] [PMC free article] [PubMed] [Google Scholar]
- 24.Tamakoshi A, Ozasa K, Fujino Y, Suzuki K, Sakata K, Mori M, et al. Cohort profile of the Japan Collaborative Cohort Study at final follow-up. J Epidemiol. 2013;23(3):227–32. [DOI] [PMC free article] [PubMed] [Google Scholar]
- 25.Fukao A, Tsubono Y, Komatsu S, Tsuji I, Minami Y, Hisamichi S, et al. A Cohort Study on the Relation of Lifestyle, Personality and Biologic Markers to Cancer in Miyagi, Japan : Study Design, Response Rate and Profiles of the Cohort Subjects. Journal of Epidemiology. 1995;5(3):153–7. [Google Scholar]
- 26.Tsuji I, Nishino Y, Ohkubo T, Kuwahara A, Ogawa K, Watanabe Y, et al. A prospective cohort study on National Health Insurance beneficiaries in Ohsaki, Miyagi Prefecture, Japan: study design, profiles of the subjects and medical cost during the first year. J Epidemiol. 1998;8(5):258–63. [DOI] [PubMed] [Google Scholar]
- 27.Ozasa K, Shimizu Y, Suyama A, Kasagi F, Soda M, Grant EJ, et al. Studies of the mortality of atomic bomb survivors, Report 14, 1950–2003: an overview of cancer and noncancer diseases. Radiat Res. 2012;177(3):229–43. [DOI] [PubMed] [Google Scholar]
- 28.Shimizu H. The basic report on Takayama study. Gifu, Japan: Department of Public Health, Gifu University School of Medicine. 1996. [Google Scholar]
- 29.Sado J, Kitamura T, Kitamura Y, Zha L, Liu R, Sobue T, et al. Rationale, design, and profile of the Three-Prefecture Cohort in Japan: A 15-year follow-up. J Epidemiol. 2017;27(4):193–9. [DOI] [PMC free article] [PubMed] [Google Scholar]
- 30.Yoo KY, Shin HR, Chang SH, Lee KS, Park SK, Kang D, et al. Korean Multi-center Cancer Cohort Study including a Biological Materials Bank (KMCC-I). Asian Pac J Cancer Prev. 2002;3(1):85–92. [PubMed] [Google Scholar]
- 31.Bae JM, Lee MS, Shin MH, Kim DH, Li ZM, Ahn YO. Cigarette smoking and risk of lung cancer in Korean men: the Seoul Male Cancer Cohort Study. J Korean Med Sci. 2007;22(3):508–12. [DOI] [PMC free article] [PubMed] [Google Scholar]
- 32.Kim J. Cancer screenee cohort study of the National Cancer Center in South Korea. Epidemiol Health. 2014;36:e2014013. [DOI] [PMC free article] [PubMed] [Google Scholar]
- 33.Kweon SS, Shin MH, Jeong SK, Nam HS, Lee YH, Park KS, et al. Cohort Profile: The Namwon Study and the Dong-gu Study. Int J Epidemiol. 2014;43(2):558–67. [DOI] [PubMed] [Google Scholar]
- 34.Yang HI, Lu SN, Liaw YF, You SL, Sun CA, Wang LY, et al. Hepatitis B e antigen and the risk of hepatocellular carcinoma. N Engl J Med. 2002;347(3):168–74. [DOI] [PubMed] [Google Scholar]
- 35.Chen HC, Schiffman M, Lin CY, Pan MH, You SL, Chuang LC, et al. Persistence of type-specific human papillomavirus infection and increased long-term risk of cervical cancer. J Natl Cancer Inst. 2011;103(18):1387–96. [DOI] [PMC free article] [PubMed] [Google Scholar]
- 36.Deurenberg P, Yap M, van Staveren WA. Body mass index and percent body fat: a meta analysis among different ethnic groups. International Journal of Obesity. 1998;22(12):1164–71. [DOI] [PubMed] [Google Scholar]
- 37.Consultation WHOE. Appropriate body-mass index for Asian populations and its implications for policy and intervention strategies. Lancet. 2004;363(9403):157–63. [DOI] [PubMed] [Google Scholar]
- 38.Therneau TM, Grambsch PM, Pankratz VS. Penalized Survival Models and Frailty. Journal of Computational and Graphical Statistics. 2003;12(1):156–75. [Google Scholar]
- 39.Gutierrez RG. Parametric Frailty and Shared Frailty Survival Models. The Stata Journal. 2002;2(1):22–44. [Google Scholar]
- 40.Discacciati A, Bellavia A, Lee JJ, Mazumdar M, Valeri L. Med4way: a Stata command to investigate mediating and interactive mechanisms using the four-way effect decomposition. Int J Epidemiol. 2018. [DOI] [PubMed] [Google Scholar]
- 41.VanderWeele TJ. A unification of mediation and interaction: a 4-way decomposition. Epidemiology. 2014;25(5):749–61. [DOI] [PMC free article] [PubMed] [Google Scholar]
- 42.Richiardi L, Bellocco R, Zugna D. Mediation analysis in epidemiology: methods, interpretation and bias. Int J Epidemiol. 2013;42(5):1511–9. [DOI] [PubMed] [Google Scholar]
- 43.Mabee TM, Meyer P, DenBesten L, Mason EE. The mechanism of increased gallstone formation in obese human subjects. Surgery. 1976;79(4):460–8. [PubMed] [Google Scholar]
- 44.Shabanzadeh DM, Sorensen LT, Jorgensen T. Determinants for gallstone formation - a new data cohort study and a systematic review with meta-analysis. Scand J Gastroenterol. 2016;51(10):1239–48. [DOI] [PubMed] [Google Scholar]
- 45.Espinoza JA, Bizama C, Garcia P, Ferreccio C, Javle M, Miquel JF, et al. The inflammatory inception of gallbladder cancer. Biochim Biophys Acta. 2016;1865(2):245–54. [DOI] [PMC free article] [PubMed] [Google Scholar]
- 46.Li Y, Zhang J, Ma H. Chronic inflammation and gallbladder cancer. Cancer Lett. 2014;345(2):242–8. [DOI] [PubMed] [Google Scholar]
- 47.Larsson SC, Spyrou N, Mantzoros CS. Body fatness associations with cancer: evidence from recent epidemiological studies and future directions. Metabolism. 2022;137:155326. [DOI] [PubMed] [Google Scholar]
- 48.Renehan AG, Zwahlen M, Minder C, O’Dwyer ST, Shalet SM, Egger M. Insulin-like growth factor (IGF)-I, IGF binding protein-3, and cancer risk: systematic review and meta-regression analysis. Lancet. 2004;363(9418):1346–53. [DOI] [PubMed] [Google Scholar]
- 49.Othman EM, Leyh A, Stopper H. Insulin mediated DNA damage in mammalian colon cells and human lymphocytes in vitro. Mutat Res. 2013;745–746: 34–9. [DOI] [PubMed] [Google Scholar]
- 50.Jackson SS, Van Dyke AL, Zhu B, Pfeiffer RM, Petrick JL, Adami HO, et al. Anthropometric Risk Factors for Cancers of the Biliary Tract in the Biliary Tract Cancers Pooling Project. Cancer Res. 2019;79(15):3973–82. [DOI] [PMC free article] [PubMed] [Google Scholar]
- 51.Schlesinger S, Aleksandrova K, Pischon T, Fedirko V, Jenab M, Trepo E, et al. Abdominal obesity, weight gain during adulthood and risk of liver and biliary tract cancer in a European cohort. Int J Cancer. 2013;132(3):645–57. [DOI] [PubMed] [Google Scholar]
- 52.Attili AF, Carulli N, Roda E, Barbara B, Capocaccia L, Menotti A, et al. Epidemiology of gallstone disease in Italy: prevalence data of the Multicenter Italian Study on Cholelithiasis (M.I.COL.). Am J Epidemiol. 1995;141(2):158–65. [DOI] [PubMed] [Google Scholar]
- 53.Schmidt M, Hausken T, Glambek I, Schleer C, Eide GE, Sondenaa K. A 24-year controlled follow-up of patients with silent gallstones showed no long-term risk of symptoms or adverse events leading to cholecystectomy. Scand J Gastroenterol. 2011;46(7–8):949–54. [DOI] [PubMed] [Google Scholar]
Associated Data
This section collects any data citations, data availability statements, or supplementary materials included in this article.
Supplementary Materials
Data Availability Statement
Investigators who are interested in using Asia Cohort Consortium data can submit an application for committee review and, upon reasonable request and with the approval of the Institutional Review Board, may be granted access. Further information is available from the corresponding author (https://www.asiacohort.org/).