

Summary
The lung contains multiple progenitor cell types, but how their responses are choreographed during injury repair and whether this changes with age is poorly understood. We report that histone H3 lysine 9 di-methylation (H3K9me2), mediated by the methyltransferase G9a, regulates the dynamics of distal lung epithelial progenitor cells, and this regulation deteriorates with age. In aged mouse lungs, H3K9me2 loss coincided with fewer alveolar type 2 (AT2) cell progenitors and reduced alveolar regeneration but increased frequency and activity of multipotent bronchioalveolar stem cells (BASCs) and bronchiolar progenitor club cells. H3K9me2 depletion in young mice decreased AT2 progenitor activity and impaired alveolar injury repair. Conversely, H3K9me2 depletion increased chromatin accessibility of bronchiolar cell genes, increased BASC frequency, and accelerated bronchiolar cell injury repair. These findings indicate that during aging, the epigenetic regulation that coordinates lung progenitor cells’ regenerative responses becomes dysregulated, aiding our understanding of age-related susceptibility to lung disease.
Keywords: Lung stem cell, Epigenetics, G9a, EHMT2, aging, alveolar, bronchiolar, regeneration
Graphical Abstract

eTOC Blurb
Rowbotham et al. report that changes in the frequency of epithelial progenitor cells in old lungs are downstream of reductions in the levels of the histone modification H3K9me2. Depleting H3K9me2 in young mice changes the regenerative dynamics of the distal lung to resemble those of old animals.
Introduction
The mammalian lung is a large, complex organ, and as the only non-barrier system continuously exposed to the outside environment, the lung must protect itself and recover from external insults. Failure to do so has severe consequences; individual respiratory diseases account for five of the most common causes of death worldwide leading to 4 million annual deaths1 whilst 1 billion people live with acute or chronic respiratory conditions2. As lung disease imposes an immense global health burden, much effort has been expended in attempts to understand how epithelial progenitors maintain and regenerate the lung. Multiple epithelial cell types have been described as progenitor cells in the major niches of the lung: the trachea, airways or bronchioles, and the distal alveolar epithelium. Progenitor cell types of these regions include basal cells3–5, club cells6, BASCs (BronchioAlveolar Stem Cells)7–9 and AT2 (Alveolar type 2) cells10, respectively, amongst many others as well as transitional cell types11–20. Some of these progenitors maintain well defined lineages; AT2 cells maintain the alveolar epithelium, sustaining the AT2 population and differentiating into AT1 cells10–12. Bronchiolar progenitors including BASCs maintain club cells, and can also contribute to the alveolar epithelium, especially following acute alveolar injury7–9
Whereas general observations suggest that regenerative capacity progressively decreases with age in most tissues,21,22 little is known about age-related regenerative differences across diverse populations of lung progenitors that control regenerative responses. Human lung function and regenerative capability declines during aging23,24, and aged lungs are the most vulnerable to respiratory diseases such as the chronic conditions COPD (Chronic Obstructive Pulmonary Disorder) and IPF (Idiopathic Pulmonary Fibrosis). In mouse models of alveolar injury, old mice have severe difficulty in recovering from damage and correctly regenerating25–27. This deficiency in regenerating the alveoli is a common feature between lung diseases with otherwise diverse pathologies. Interestingly, some of the transcriptomic changes observed in aged murine lung alveolar cell types are similar to transcriptional alterations observed in cells from IPF lungs28. Aside from gene expression changes, it is not known how specific aged lung progenitor cell populations are affected at the functional level, and how this translates to the specific disease vulnerabilities associated with age.
Alongside the exhaustion of progenitor cells, the accumulation of epigenetic changes is also a hallmark of aging29. At the macro level, several active chromatin modifications become more abundant in age whilst repressive chromatin modifications are reduced29, including the loss or disruption of repressive heterochromatin30,31. Compared to other cellular process altered in the aging lung such as proteostasis, senescence and mitochondrial function23, considerably less is known about epigenetic changes; other than reports of increased transcriptional noise which generally implicate a loss of epigenetic fidelity32. Epigenetic regulation is a key controller of stem and progenitor cell function, with epigenetic modifications determining stem and differentiated cell fates33. Previous studies have identified roles for specific epigenetic regulators in lung function, lung diseases and lung progenitors, including the polycomb repressor Bmi134, histone de-acetylases Hdac335 and Sin3a36 and DNA methyltransferase Dnmt137. It is clear from these studies that epigenetic regulators have essential roles in certain lung progenitors and at key developmental time points. However, it is not known how diverse lung progenitor populations are affected by broad changes to epigenetic modifications with age.
One epigenetic regulator that has been implicated in models of cancer and lung disease is the histone methyltransferase G9a. G9a (also known as EHMT2) is responsible for catalyzing the di-methylation of histone H3 at lysine 9 (H3K9me2)38, a transcriptionally repressive modification39. G9a has been proposed to regulate fibroblasts in lung fibrosis,40 and G9a has been described as an oncogene in lung cancer41,42. We have previously reported that depletion of H3K9me2, via G9a inhibition, strongly affects lung adenocarcinomas, altering their population dynamics to favor the expansion of aggressive, stem-like tumor propagating cells43. Whereas lysine 9 methylation (K9me) is understood to generally decline in aging tissues and progerias44,45, very little is known about the dynamics of these histone modifications in the lung.
Here we present evidence that G9a-mediated K9me2 can regulate lung cell fate and progenitor cell usage, which becomes dysregulated with age. In aged mouse lungs, global loss of H3K9me2 coincides with a reduction in the frequency of AT2 cells and an increase in BASC frequency and bronchiolar progenitor activity. Depletion of H3K9me2 in young mice genetically or through inhibition of G9a reduces the activity of AT2 progenitors and in contrast, increases the number and activity of distal lung bronchiolar progenitors. This accelerates repair of bronchiolar injury but impairs regeneration of the alveoli, which are phenotypes seen in aging lungs. These effects are mediated through enhanced chromatin accessibility of bronchiolar secretory (club) cell genes. These data point to H3K9me2 and G9a as a critical regulator of maintenance of the balance of lung progenitor cell regenerative responses and prevention of susceptibility to age-related lung diseases.
Results
Aged lung progenitor cells have altered frequency and activity
We used flow cytometry and histological analyses to investigate lung progenitor cell abundance in the lung across different ages. On the gross morphological level, the lungs of young (2 months) and old (24 months) mice were indistinguishable (Figure S1a), but analysis of specific cell types revealed significant differences. AT2 cells were significantly less frequent in the alveoli of old lungs than young (Figure 1a,b). Analysis of existing scRNA-seq datasets32 of young and old mouse lung cells showed no appreciable difference in the expression of Sftpc (Spc), Abca3 or Lyz2 between young and old AT2 cells, confirming that we were observing a genuine reduction in the frequency of these cells (Figure S1b). In contrast, BASCs, located at the bronchioalveolar duct junction, were significantly more frequent in old lungs than young (Figure 1c,d). We also used flow cytometry to confirm that progenitor composition is significantly altered in aged lungs. We found a reduction in the Epcam+ Sca-1- population which consists of AT2 cells, and an increase in the Sca-1+ population, containing BASCs with alveolar and bronchiolar potential, in old mice (Figure 1e, S1c). Further analysis of scRNA-seq data showed there was no appreciable difference in Sca-1 expression between young and old AT2 cells (Figure S1d,e). Overall, the distribution of major epithelial cell types expressing Sca-1 (Ly6a) is not altered with age (Figure S1e).
Figure 1. Lung progenitor populations are altered in frequency and activity in aged mice coincident with reduced H3K9me2.

(a) Representative images of the alveolar space of young and old mice, immunostained for the indicated proteins. Scale bar = 100 μm. (b) Quantification of the number of AT2 cells per imaged alveolar field from young and old mice, corrected for alveolar area. *=p<0.05, T-test, n=3. (c) Quantification of the number of BASCs per terminal bronchiole in young and old mice. *=p<0.05, Mann-Whitney U-test, n=6. (d) Representative images of terminal bronchioles from young and old mice, immunostained for the indicated proteins. White arrows indicated BASCs. Scale bar = 100 μm. (e) Quantification of the proportion of Sca-1− and Sca-1+ epithelial cells from young and old mice. *=p<0.05, U-test, n=11. (f) Quantification of the organoid forming efficiency of Sca-1− AT2 cells isolated from young and old mice. *=p<0.05, U-test, n=6. (g) Representative images of organoids generated from Sca-1- cells from young and old mice, immunostained for the indicated proteins. Scale bar = 100 μm. (h) Quantification of the organoid forming efficiency of Sca-1+ cells from young and old mice. *=p<0.05, T-test, n=3. (i) Representative images of young and old mouse lungs, immunostained for the indicated proteins. Scale bar=100 μm. (j) Quantification H3K9me2 levels by fluorescent antibody imaging in young and old mouse lungs. *=p<0.05, T-test, n=6.
We next asked if the changes in cell numbers in old mice were also associated with altered progenitor cell activity using our air-liquid interface organoid co-culture system46. In this system lung progenitors give rise to organoids resembling either the alveolar airspace (alveolar), the small airways (bronchiolar) or the bronchioalveolar duct junction (bronchioalveolar) (Figure S1f). To isolate the effects of age on epithelial progenitors, identical young stromal cells were used in the co-culture. Old Sca-1− epithelial cells had a significantly lower organoid forming efficiency, giving rise to fewer alveolar organoids than the equivalent number of young cells (Figure 1f, S1g), and those that formed were smaller (Figure 1g). However, the proportion of organoids with cells positive for Podoplanin (Pdpn), a marker of AT1 (Alveolar Type 1) cells, was not altered (Figure S1h), implying that the differentiation of AT2 into AT1 cells was not impaired. Old Sca-1+ epithelial cells, containing mixed bronchiolar-alveolar progenitors including multipotent BASCs, did not show a significant difference in overall organoid forming efficiency (Figure S1g,i). However, old Sca-1+ progenitors generated significantly fewer alveolar organoids than young Sca-1+ cells, whilst bronchioalveolar organoid forming efficiency was unchanged and bronchiolar organoid forming efficiency was significantly increased (Figure 1h). These results demonstrate that the pool of distal lung progenitors significantly changes with age, with fewer and less active alveolar progenitors and more abundant and more active bronchiolar progenitors in old mice.
Reduction of Histone H3 lysine 9 di-methylation in aged lungs is linked to reduced alveolar progenitor activity
We next sought to identify molecular changes associated with aging that might help to explain the alterations we found in aged lung progenitor cell activity. As changes in epigenetic regulation are a well-documented hallmark of aging and given the known roles of epigenetic regulators in lung progenitor cell activity, we probed young and old mouse lungs for gross changes in the amount of repressive chromatin modifications in epithelial cells. Whereas we did not see consistent changes in gross H3K27me3 or 5mC (Figure S1j,k), we did find that lysine 9 methylation, specifically H3K9me2, was significantly reduced in old lung epithelial cells compared to young. ANOVA analysis found that cell age was associated with a significant reduction in H3K9me2 (p=0.0194) whilst cell type (AT2 or Club) was not. Individual T-tests confirmed a more significant reduction in AT2 cells than club cells (Figure 1i,j). Overall H3 acetylation was not significantly changed (Figure S1l). These findings prompted us to further investigate the role of H3K9me2 in lung epithelial progenitor cell activity and age.
We tested if depleting H3K9me2 using a G9a/Glp inhibitor (hereafter G9ai) to disrupt methyltransferase activity in young progenitors could alter their activity as we observed in their old counterparts. We first isolated young Sca-1− progenitors for organoid culture and treated them with a G9ai (Figure 2a). H3K9me2 levels were significantly reduced in organoids treated with the G9ai compared to the vehicle control. (Figure S2a). After 14 days of growth, Sca-1− epithelial cells generated significantly fewer alveolar organoids with G9ai (Figure 2b,c), and those, as with organoids derived from old progenitors, were smaller and displayed less branching (Figure 2b, S2b). The proportion of organoids with the AT1 cell protein Podoplanin (Pdpn) was also not altered (Figure 2d). To determine if the effects on lung organoids were mediated through the activity of G9a in lung epithelial or stromal cells, we grew lung stromal cells +/- G9ai prior to epithelial cell co-culture (Figure 2e). The organoid forming efficiency was unchanged between cultures with G9ai and control stromal cells (Figure 2f). We previously reported that lung stromal cells support alveolar differentiation through a Thrombospondin1-BMP axis46. Relative expression of the stromal cell genes in this axis, Thbsp1, Bmp4, Hgf, as well as Tgfb which opposes alveolar differentiation, were not altered by G9ai (Figure S1c).
Figure 2. H3K9me2 depletion in young mice impairs alveolar progenitor activity.

(a) Schematic of in vitro G9ai organoid experiment. (b) Representative fluorescent Images of day 14 alveolar organoid cultures +/- G9ai. Scale bar =100 μm. (c) Quantification of organoid forming efficiencies from Sca-1− progenitors +/- G9ai. *=p<0.05, T-test, n=3. (d) Quantification of Pdpn+ organoid % relative to all alveolar organoids, n=4. (e) Schematic of stromal cell in vitro G9ai experiment. (f) Quantification of organoid forming efficiencies from Sca-1− progenitors co-cultured stromal cells pre-treated +/- G9ai, n=f. (g) Schematic of in vitro Adeno-Cre organoid experiment. (h) Representative images of SPC+ organoids derived from Adeno-Cre infected Sca-1− progenitors from G9awt/wt and G9afl/fl mice, stained for SPC. Scale bar = 100 μm. (i) Quantification of organoid forming efficiencies from Adeno-Cre infected Sca-1− progenitors from G9awt/wt and G9afl/fl mice. *=p<0.05, T-test, n=3. (j) Quantification of mean size of organoid derived from Adeno-Cre infected Sca-1− progenitors from G9awt/wt and G9afl/fl mice. *=p<0.05, T-test, n=3. (k) Representative images of organoids from Adeno-Cre infected Sca-1− progenitors from G9awt/wt and G9afl/fl mice, immunostained for the indicated proteins. (l) Quantification of Pdpn+ organoid % relative to all alveolar organoids generated from G9awt/wt and G9afl/fl Sca-1− progenitors, n=3.
We next confirmed the phenotypes observed were due to H3K9me2 loss using a genetic model of G9a deletion. Sca-1− progenitors were isolated from G9afl/fl YFPlsl and YFPlsl mice and incubated with Ad5CMV-Cre virus to drive recombination of the lox loci before plating in organoid culture (Figure 2g), as we have previously described47. After 14 days growth, we observed significantly fewer YFP+ alveolar organoids from the G9afl/fl progenitors (Figure 2h,i). Furthermore, G9afl/fl organoids were also significantly smaller than WT organoids (Figure 2j). Immunostaining of organoids confirmed that H3K9me2 was significantly depleted in YFP+ G9afl/fl organoids (Figure 2k, S2d). The proportion of Pdpn+ organoids was also not altered (Figure 2l) and we did not observe a decrease in relative Sftpc expression or expression of airway cell markers (Figure S2e,f). This confirms that depletion of H3K9me2 in young AT2 cells is sufficient to reduce their progenitor activity comparable to old AT2 progenitors, where repressive H3K9me2 modifications are significantly reduced.
Alveolar injury repair is impaired in H3K9me2 depleted young mice
As H3K9me2-depleted young AT2 cells had reduced progenitor activity in vitro, like old AT2 cells, we tested if H3K9me2 depleted lungs would have similar problems with injury repair in vivo. We depleted H3K9me2 in vivo by bi-daily injections of 5 mg/kg of G9a inhibitor UNC064248 and then subjected mice to bleomycin injury (Figure 3a). After two weeks of G9ai, we observed a significant reduction in H3K9me2 in the lung epithelia (Figure 3b,c) but no change in the frequency of AT2 cells (Figure S3a). Bleomycin induces damage through severe disruption of the alveolar architecture characterized by loss of AT2 cells, invasion/proliferation of immune, mesenchymal, and epithelial cells as well as fibrosis, leading to the elimination of the airspaces required for gas exchange, and distal airways may also be damaged. The damaged alveolar epithelium must be regenerated to restore functional alveoli. We analyzed the lungs at 21 days after bleomycin injury, when damage is maximal and repair of AT2 loss has begun, as well as at 28 days when repair has progressed. At 21 days there were large areas of occluded alveoli in both H3K9me2-depleted and control lungs which were not significantly different (Figure 3d,e). By day 28, whilst differences in gross H3K9me2 had receded (Figure S3b), much of the normal alveolar structure had been restored in control mice, but damaged areas persisted in G9ai mice, as observed in H&E sections (Figure 3e).
Figure 3. H3K9me2 depletion in young mice impairs alveolar injury repair and maintains aberrant bronchiolar cell expansion.

(a) Schematic of G9ai and Bleomycin injury experiment. (b) Representative images of alveolar airspaces of young mice following 14 days +/- G9ai, immunostained for the indicated proteins. Scale bar = 100 μm. (c) Quantification H3K9me2 levels by fluorescent antibody imaging in control and G9ai mouse lungs. *=p<0.05, Sidak’s multiple comparison test, n=3. (d) Representative H&E stained images of lungs from day 28 injured and uninjured G9ai and control mice. Scale bar=100 μm. (e) Quantification of the area of lung damage at the indicated timepoints following injury in control and G9ai mice. *=p<0.05, T-test (day 21 n=10, day 28 n=7). (f) Quantification of % of replicating AT2 cells in bleomycin damaged control and G9ai lungs. *=p<0.05, T-test, n=4. (g) Representative images of day 28 damaged lung regions in G9ai and control mice, immunostained for the indicated proteins. Arrows demark Spc+ Ccsp+ cells. Scale bar = 100 μm. (h) Quantification of the number of BASC and extra-bronchiolar Ccsp+ cells per injured area in control and G9ai mice on day 28 following bleomycin injury. *=p<0.05, U-test, n=5. (i) Representative Ccsp IHC and Hematoxylin co-staining of day 28 bleomycin induced lesions in control and G9ai mice. Arrow highlights bronchiolized lesion adjacent to terminal bronchioles. Scale bar = 500 μm (j) Quantification of cumulative bronchiolization in bleomycin injured control and G9ai mice. *= treatment effect (control or G9ai) p<0.05, 2-way ANOVA test, n=28.
We used several approaches to characterize the damage that persisted after bleomycin in mice with G9a inhibition. First, we used Mason-Trichrome staining and the Ashcroft scoring method which assesses fibrosis and inflammation, but there was no significant difference between control and H3K9me2-depleted lungs (Figure S3c–e). Next, we characterized epithelial cell status in the damaged areas. Interestingly, there was no difference in the overall abundance of AT2 cells (Figure S3f) but Ki67 staining revealed there were significantly fewer AT2 cells proliferating in G9ai lungs (Figure 3f), suggesting that the regenerative capacity of the alveolar lineage was limited. However, persistently damaged areas of H3K9me2-depleted lungs had significantly more BASC and club cells, but not Krt5+ cells, beyond the bronchioalveolar duct junction (Figure 3g,h S3g). We next considered if the expansion of club and BASC cells we observed might constitute alveolar bronchiolization, characterized by clusters of cuboidal epithelial cells in acinar or papillary formation in regions of alveolar injury, often expressing markers of bronchiolar cells such as CCSP and adjacent to nearby airways49. To determine the extent of bronchiolization, we analyzed sections with Mason-Goldner elastica stain and performed immunohistochemistry for the club cell protein CCSP. We graded each bronchiolized lesion following an established histological system assigning a numerical value to each lesion from 1 to 4 for grades I-IV (Figure S3,g,h). H3K9me2-depleted bleomycin damaged lungs had more bronchiolized lesions and higher grades than controls, and 2-way ANOVA analysis confirmed that H3K9me2 depletion was associated with significantly higher cumulative bronchiolization (p=0.0081) (Figure 3i,j). Collectively, these analyses suggested that as well as impairing AT2 cells independently of fibrosis, H3K9me2-depletion produced an aberrant bronchiolar cell phenotype in the damaged areas.
The bronchiolar progenitor population is expanded after in vivo H3K9me2 depletion
The presence of aberrantly expanded BASC and club cells in G9ai, bleomycin-damaged lungs prompted us to study the populations of bronchiolar progenitors in H3K9me2 depleted lungs more closely (Figure 4a). As with alveolar cells, two weeks of in vivo G9ai significantly reduced levels of H3K9me2 in bronchiolar epithelial cells (Figure 3c,4b). Similar to our observations with old lung epithelial cells, H3K9me2 reduction significantly increased the proportion of the BASC-containing Sca-1+ population (Figure 4c). We found that the organoid forming efficiencies for bronchiolar and bronchioalveolar organoids appeared higher for the H3K9me2-depleted Sca-1+ progenitors, but the difference was not statistically significant (Figure S4a,b). The Sca-1+ population is heterogenous, and we reasoned that with a more enriched population these differences may become more apparent.
Figure 4. In vivo H3K9me2 depletion enriches bronchiolar progenitors.
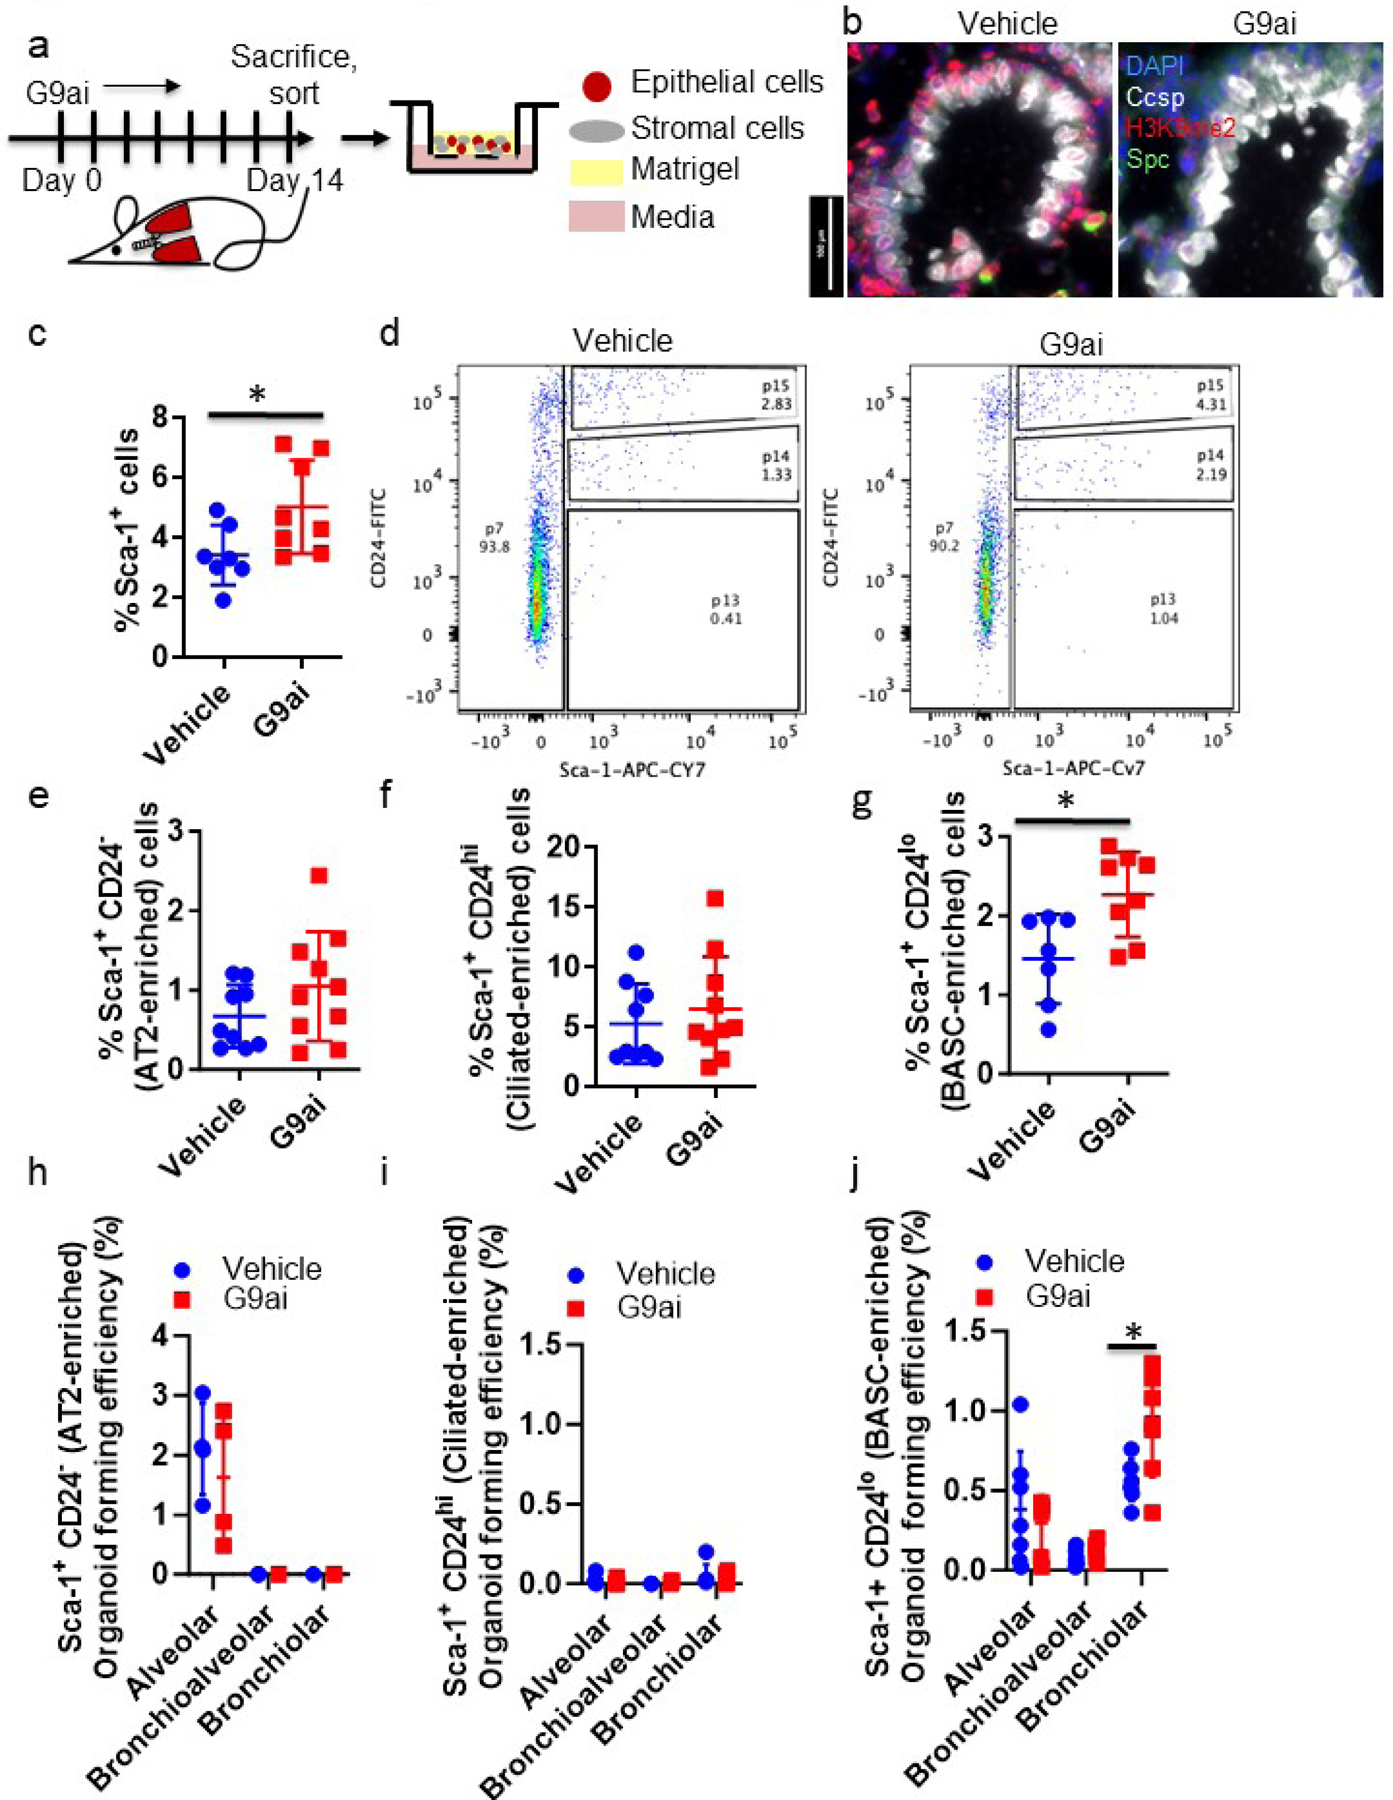
(a) Schematic of in vivo G9ai organoid experiment. (b) Representative images of terminal bronchioles of young mice following 14 days +/- G9ai, immunostained for the indicated proteins. Scale bar = 100 μm. (c) Quantification of Sca-1+ fraction of lung epithelial cells, gated for single, live CD31/CD45+, Epcam+ cells. *=p<0.05, T-test, n=8. (d) Representative FACS plots of G9ai and control isolated lungs, gated for single, live, CD31/CD45-, Epcam+ cells. (e-g) Quantification of the (e) Sca-1+ CD24− and (f) Sca-1+ CD24hi and (g) Sca-1+ CD24lo fractions of lung epithelial cells, gated for single, live CD31/CD45+, Epcam+ cells from G9ai and control mice. *=p<0.05, T-test, n=8 (h-j) Quantification of the generation efficiencies of major organoid types from the (h) Sca-1+ CD24− (n=4) (i) Sca-1+ CD24hi (n=6) and (j) Sca-1+ CD24lo epithelial cells from G9ai and control mice. *=p<0.05, Sidak’s multiple comparison test, n=7.
FACS analysis and organoid cultures of epithelial cell populations sorted with a refined strategy demonstrated that bronchiolar progenitors within the BASC-enriched Sca1+ population are significantly impacted by a reduction in H3K9me2 in young mice. We further separated epithelial cell populations by adding CD24 to our sorting strategy , similar to that in our previous studies34. Sorting with CD24 produced three distinct Sca-1+ populations: CD24hi, CD24lo and CD24− (Figure 4d, S4c). Among the 3 Sca1+ fractions, only the Sca-1+ CD24lo fraction was significantly increased in H3K9me2-depleted lungs compared to controls (Figure 4e–g, S4d). rtPCR of these populations for the lung epithelial cell markers Sftpc, Scgb1a1, and Foxj1 suggested that the Sca-1+ CD24− population contains AT2 cells, the Sca-1+ CD24lo population is enriched in bronchiolar club cells, and the Sca-1+ CD24hi population is enriched in ciliated cells (Figure S4e–g). No population had significant expression of Krt5 or P63, implying that basal cells were absent from these preparations (data not shown). The Sca-1+ CD24lo population was multipotent, as seen by their ability to produce the respective types of organoids (Figure S4h) and was significantly enriched in bronchiolar and bronchioalveolar progenitors compared to unfractionated Sca1+ cells. (Figure S4i). In contrast, the Sca-1+ CD24− and Sca-1+ CD24hi fractions were depleted of bronchiolar and bronchioalveolar progenitors; the Sca-1+ CD24− population only produced alveolar organoids and the Sca-1+ CD24hi population had no organoid forming ability (Figure 4h,i, S4j). H3K9me2-depleted Sca-1+ CD24lo progenitors generated significantly more bronchiolar organoids compared to controls (Figure 4j, S4j). Together, these findings showed that H3K9me2 depletion in young homeostatic mouse lungs significantly expanded the BASC-containing population and enhanced its bronchiolar progenitor cell function.
H3K9me2 depletion increased the chromatin accessibility of young bronchiolar progenitors
In order to understand the mechanism of how G9a and H3K9me2 control the activity of lung epithelial progenitors, we used ATAC-seq to determine the impact of active G9a on the accessibility of the chromatin landscape. ATAC-seq of isolated Sca-1− (enriched for alveolar progenitors), Sca-1+ CD24lo (enriched for bronchiolar progenitors) and Sca-1+ CD24hi (ciliated cells; non-progenitors) populations from control and H3K9me2-depleted mice revealed that several thousand loci significantly gained and lost accessibility with H3K9me2 depletion (Figure 5a, S5a). H3Kme2-depleted Sca-1+ CD24lo cells had significantly more unique open chromatin peaks compared to vehicle (Figure 5a), but interestingly H3K9me2-depleted Sca-1− cells had fewer (Figure S5a). Unique peak intensity (peak size) was greater in the H3K9me2-depleted Sca-1+ CD24lo cells when compared to vehicle, whereas there was no overall difference in the Sca-1− population (Figure 5b). These analyses suggest that H3K9me2-depletion preferentially opens chromatin within BASCs and bronchiolar progenitor populations, whilst the effects on chromatin in AT2 cells are bidirectional.
Figure 5. H3K9me2 depletion increases the chromatin accessibility of AT2 and Club cell genes in bronchiolar progenitors.

(a) Quantification of common and unique ATAC-seq chromatin peaks in vehicle and G9ai Sca-1+ CD24lo lung epithelial cells from 3 independent biological samples, p<0.05, χ2 test. (b) Table of chromatin peak signal enrichment of Sca-1− and Sca-1+ CD24lo cells from G9ai and vehicle lungs. (c) Density plots of vehicle (green) and G9ai (red) open chromatin signal associated with differentially expressed genes of AT2 and club cell clusters from scRNA-seq of lung epithelial cells. P<0.005, Wilcoxon ranked-sum test. (d) Representative chromatin tracks of vehicle and G9ai Sca-1+ CD24lo cells at highly specific club cell genes, with position of unique peaks from each cohort indicated. (e) Motif alignment between G9ai Sca-1+ CD24lo unique peak enriched motif #1 and Foxd2 consensus and motif #7 and Runx1 consensus. (f) Venn diagram showing overlap between differentially expressed genes of club cells from scRNA-seq from young and old mice32 and genes associated with unique ATAC-seq peaks in G9ai Sca-1+ CD24lo cells. (g) Violin plot comparing relative Scgb3a2 gene expression in club cells from scRNA-seq of young and old mouse lungs.
To test for direct links between chromatin regulation and lung epithelial phenotypes we observed with G9ai, we analyzed the chromatin accessibility of genes that were highly expressed in AT2 cells or in bronchiolar club cells. Using gene signatures which we derived from single cell sequencing of Sca-1− and Sca-1+ lung epithelial cells, we found significantly higher open chromatin signal enrichment amongst the club cell signature genes, and to a lesser extent the AT2 cell signature genes in the H3K9me2-depleted Sca-1+ CD24lo cells (Figure 5c) Greater accessibility at both club and AT2 cells genes could reflect that BASCs, which express both sets of genes are more enriched in the H3K9me2-depleted population. Furthermore, 41/101 genes in the club cell signature were associated with a G9ai-enriched peak versus 8/101 genes with a vehicle-enriched peak, a significant enrichment (p<0.0001, χ2 test) (Table S1). These included the secretoglobins Scgb1a1, Scgb3a2, Scgb3a1 which are amongst the most significantly upregulated club cell genes (Figure 5d). A smaller proportion of AT2 cell genes, 161/577 were associated with G9ai unique peaks and a comparable proportion, 54/577 with vehicle unique peaks (Table S2). We also analyzed the genes associated with unique peaks in the Sca-1− and Sca-1+ CD24lo populations by Gene Ontology analysis (Figure S5b,c). Although some terms were considered statistically significant between H3K9me2-depleted and control cells, typically only a small number of genes from these pathways were represented and did not appear promising candidates to mediate the differences in progenitors that we observed.
We next performed a motif enrichment analysis on each set of enriched peaks to determine if the binding sites of specific transcription factors (TFs) were represented in the differentially accessible chromatin upon H3K9me2 depletion. The highest enriched motif amongst the G9ai Sca-1+ CD24lo peaks was highly similar to the consensus binding sequence of the Forkhead transcription factor Foxd2 (Figure 5e). Interestingly, a further highly enriched motif corresponded to Runx1, a transcription factor with increased expression in club cells (Figure 5f, Table S1). Whereas the top enriched motif, RYAAAYA most closely resembled the Foxd2 motif, Fox family members have very similar consensus binding sequences, and another Fox TF family member, Foxq1, is significantly upregulated in club cells (Table S1.) There is also strong homology between this motif and the core Foxq1 consensus RTAAACA (Figure S5f), raising the possibility that G9a-H3k9me2 could also govern the chromatin accessibility of this club cell TF. Overall, the increased accessibility of club cell signature genes and enrichment of motifs of TFs highly expressed in club cells in the H3K9me2-depleted Sca-1+ CD24lo cells suggests that the chromatin state of the BASC-containing population may be relatively pre-disposed to the adoption of bronchiolar cell fates compared to controls.
We also compared the genes that had differentially accessible chromatin in young mice with G9ai with differentially expressed genes in scRNA-seq analysis of young and old mouse lung cells. Only a very small number of genes, (all of which were transcriptionally upregulated) were found to be significantly differentially expressed in club cells in old mice vs. young32, however, there was notable overlap (Figure 5f). Interestingly, Scgb3a2 was also significantly upregulated in old club cells compared to young, with almost every club cell expressing high levels (Figure 5g). Other shared accessible/upregulated genes include the membrane transporter Slc16a11, which is also amongst our core club cell signature (Table S1), and the pro-proliferative Rho GTPase Chn2 (Figure S5e,f), although these transcriptional differences are smaller. This further raises the possibility that some transcriptional changes in old bronchiolar club cells are mediated by depletion of H3K9me2.
H3K9me2-depleted and aged lungs have accelerated bronchiolar injury repair
ATACseq analysis suggested that chromatin and gene expression related to bronchiolar progenitors is enhanced with H3K9me2 depletion, leading us to test the impact of G9ai on bronchiolar injury repair in vivo. We subjected G9ai and control young mice to naphthalene injury, which selectively ablates club cells (Figure 6a). Maximum club cell loss occurred two days after injury and was indistinguishable between H3K9me2 depleted and control lungs (Figure 6b). Three days after injury, when repair of the airways is initiated, H3K9me2-depleted mice had regenerated significantly more club cells than controls, whereas club cells numbers are unchanged in the absence of injury (Figure 6b,c). This difference persisted a week following injury, when club cell numbers were almost at pre-injury levels in H3K9me2-depleted mice whereas regeneration was still incomplete in control mice (Figure 6c). As club cell numbers were restored more quickly with G9ai, we considered the possibility that more variant club cells with lower expression of Cyp2f2, the gene responsible for the toxic metabolism of naphthalene, survive with G9ai and therefore re-population appears more advanced. However, chromatin accessibility of the Cyp2f2 locus measured by ATAC-seq appears higher in G9ai bronchiolar progenitors (Figure S6a), arguing against this interpretation.
Figure 6. H3K9me2 depletion in young mice accelerates bronchiolar Injury repair.

(a) Schematic of G9ai and Naphthalene injury experiment. (b) Quantification of club cell loss and regeneration at the indicated timepoints in injured and uninjured control and G9ai mice. *=p<0.05, Sidak’s multiple comparison test, n=5. (c) Representative images of damaged terminal bronchioles in G9ai and control mice, immunostained for the indicated proteins. Scale bar = 100 μm (d) Quantification of the number of BASCs per terminal bronchiole in injured and uninjured control and G9ai mice at the indicated timepoints. *=p<0.05, Sidak’s multiple comparison test, n=5. (e) Representative images of terminal bronchioles in G9ai and control mice. Arrows demark Spc+ Ccsp+ BASCs. Scale bar = 100 μm. (f) Quantification of club cell loss and regeneration at the indicated timepoints in injured and uninjured young and old mice. *=p<0.05, Sidak’s multiple comparison test, n=4. (g) Representative images of damaged terminal bronchioles in young and old mice, immunostained for the indicated proteins. Scale bar = 100 μm.
As BASCs have been demonstrated to mediate a large proportion of the repair of naphthalene-damage at terminal bronchioles7–9, we wondered whether bronchiolar regeneration in the G9ai context is accelerated by changes in BASCs. We analyzed BASC numbers by quantifying Spc and Ccsp double positive cells at terminal bronchioles. We found that three days after injury, BASCs were expanded in both control and H3K9me2-depleted mice, with these numbers receding at day seven as repair progresses (Figure 5d). Interestingly, as we saw in old mice (Figure 1c,d), we found significantly more BASCs at terminal bronchioles in the uninjured G9ai mice vs controls (Figure 6d,e). Whilst BASCs were increased at G9ai terminal bronchioles, very few terminal bronchioles had BASCs adjacent to one another (Figure S6b), suggesting BASC proliferation was not responsible for differences. Very rare Ki67+ BASCs were detected in uninjured H3K9me2 depleted young mice (0.07 per terminal bronchiole), but not controls (Figure S6c). Although this difference was statistically significant (p=0.028, T-test), it did not seem sufficient in magnitude to explain the difference between control and H3K9me2 depleted lungs, suggesting that differentiation and cell fate changes also contribute. During injury BASCs were equally likely to be proliferative in control and H3K9me2 depleted lungs, suggesting that the presence of more BASCs prior to injury is responsible for the accelerated repair.
As we also observed an increase in BASCs when H3K9me2 is naturally reduced in aged mouse lung epithelia (Figure 1c,d), we asked if old mice too would respond differently to naphthalene injury. Old mice suffered more injury with the standard dose of naphthalene (200 mg/kg), with significantly fewer club cells surviving on day 2 (8% old vs 25% young, p<0.001). However, this difference narrowed on day 3 as regeneration started (23% old vs 33% young, p=0.02) and by day 7 the old mice had overtaken the young mice in club cell regeneration (56% vs 44%, p=0.002). As we had previously observed, uninjured old mice had significantly more BASCs per terminal bronchiole than young mice and during regeneration both cohorts had expanded BASC populations (Figure S6d). Although displaying slightly different injury dynamics, both old mice and H3K9me2-depleted young mice show an increased capacity for small airway regeneration after naphthalene injury compared to control, young mice. This further suggests that generation of bronchiolar cells from lung progenitors is restrained by H3K9me2, which when dysregulated by age or pharmaceutical intervention, may unexpectedly be beneficial following acute injury to the airways.
AT2 cell specific H3K9me2 depletion is sufficient to impair alveolar injury repair.
Our data suggested that loss of H3K9me2 impairs the ability of alveolar progenitors to respond to injury and enhances the regenerative capacity of bronchiolar progenitors. However, because our in vivo injury experiments use an inhibitor of G9a to deplete H3K9me2, we could not isolate the effects in specific cell types as we could with in vitro organoid assays. To address this, we crossed conditional G9afl/fl YFP and G9a-wildtype (G9awt/wt) YFP mice with Sftpc-CreERT2 and subjected tamoxifen treated mice to bleomycin injury (Figure 7a). Tamoxifen treatment significantly reduced G9a mRNA and H3K9me2 in YFP+ AT2 cells from Sftpc-CreERT2 G9afl/fl YFP mice (Figure 7b,c S7a,b), but did not change the frequency of AT2 cells after 14 days (Figure S7c). We analyzed lungs 28 days after bleomycin injury, the timepoint at which we observed significant differences in injury repair between control and G9ai treated mice. We found that G9afl/fl lungs were significantly more damaged than G9awt/wt lungs suggesting that depletion of H3K9me2 in AT2 cells was sufficient to impair alveolar injury repair (Figure 7d,e).
Figure 7. AT2 cell specific H3K9me2 depletion is sufficient to impair alveolar injury repair.

(a) Schematic of G9afl/fl Bleomycin injury experiment. (b) Representative images of day 28 alveolar airspaces of Spc:CreER G9awt/wt YFP and Spc:CreER G9afl/fl YFP mice 14 days after tamoxifen administration, immunostained for the indicated proteins. Arrows demark YFP+ AT2 cells. Scale bar = 100 μm. (c) Quantification H3K9me2 levels by fluorescent antibody imaging in Spc:CreER G9awt/wt YFP and Spc:CreER G9afl/fl YFP lungs. *=p<0.05, T-test, n=3. (d) Representative H&E stained images of day 28 lungs from bleomycin injured Spc:CreER G9awt/wt YFP and Spc:CreER G9afl/fl YFP mice 28 days after injury. Scale bar = 100 μm. (e) Quantification of the area of lung damage in bleomycin injured G9awt/wt and G9afl/fl mice 28 days after injury. *=p<0.05, T-test, n=10. (f) Representative images of day 28 bleomycin damaged lung regions from Spc:CreER G9awt/wt YFP and Spc:CreER G9afl/fl YFP mice 28 days after injury, immunostained for the indicated proteins. Representative images of bleomycin damaged and undamaged lung regions in in bleomycin injured Spc:CreER G9awt/wt YFP and Spc:CreER G9afl/fl YFP mice, immunostained for the indicated proteins. Arrows demark Spc+ cells. Scale bar = 100 μm. (g) Quantification of BASC and extra-bronchiolar Ccsp+ cells per injured area in Spc:CreER G9awt/wt YFP and Spc:CreER G9afl/fl YFP mice on day 28 following bleomycin injury. *=p<0.05, U-Test, n=7. (h) Quantification of % of SPC+ YFP+ AT2 cells over all SPC+ AT2 cells per field in Spc:CreER G9awt/wt YFP (n=3) and Spc:CreER G9afl/fl YFP (n=6) bleomycin damaged lungs 28 days following injury. *=p<0.05, T-test (i) Model of progenitor cell activity. In homeostasis, only subtle differences in the composition of the distal epithelia (more BASCs and fewer AT2 cells) are outwardly observed between young (upper left) and old (upper right) lungs. Following injury to the young, healthy lung epithelium, G9a-mediated H3K9me2 restrains the accessibility of bronchiolar cell fate genes, preventing excess activation of bronchiolar progenitors. This allows AT2 cells to efficiently self-renew and/or differentiate to AT1 cells to regenerate the alveoli with the trade-off of slower repair of bronchiolar injury (bottom left). In the aged, or artificially H3K9me2 depleted lung (bottom right), there are fewer AT2 cells and those remaining have less self-renewal ability. In this scenario, the more abundant BASCs can regenerate bronchiolar injury more efficiently but are less effective in compensating for the smaller number of active AT2 cells, leading to slower repair of alveolar injury and the persistence of bronchiolar-like cells in damaged alveoli.
We characterized the epithelial cells at the damaged loci, and we found that in G9awt/wt mice the residual damaged areas were populated by YFP+ AT2 cells with few airway cells. Damaged alveoli in G9afl/fl mice however showed the presence of Ccsp+ and Spc+ Ccsp+ (Figure 7f,g, S7d) cells. However, this was less than observed in G9ai-treated mice where H3K9me2 is also depleted in airway cells (Figure 3), unlike the Sftpc-CreERT2 G9afl/fl YFP mice (Figure S7e). In addition, SPC+ Ccsp− YFP− cells were observed in G9afl/fl bleomycin damaged regions, unlike in the alveoli of both G9afl/fl and G9awt/wt PBS-control mice or the undamaged lobes of bleomycin treated mice, where most AT2 cells are YFP+ (Figure 7f,h S7d,f). This implies an increased contribution from other progenitors to the regeneration of damaged alveoli when H3K9me2 is depleted from AT2 cells.
Discussion
Our study provides insight into how rapid and accurate tissue repair is managed in an organ with multiple alternative progenitor cells and how progenitor cell functions in the lung change with age. Most knowledge of lung regeneration has been derived from experiments in young adult mice, with some exceptions for the study of fibrosis25–27. Our data suggest that changes in epigenetic modifications that occur with age disrupt the regulation of progenitor cell usage in the adult lung, with one aspect being abrogation of AT2 progenitor cell activity. Lineage tracing experiments in young mice have established that AT2 cells, preferentially replenish AT2 and AT1 cells in homeostasis and after alveolar damage10–12, whilst BASCs regenerate both the airways and alveoli following injury8,9 and club cells and other bronchiolar progenitors regenerate airway epithelia. It is not yet clear precisely how H3K9me2 loss impairs alveolar progenitor function; the differences in chromatin accessibility in AT2 cells did not point strongly in any particular direction. The accumulation of senescent AT2 cells after bleomycin injury is predicted to limit repair and regeneration, although we did not detect any change in the chromatin accessibility of senescence genes in H3K9me2-depleted AT2 cells.50–52 G9a has been demonstrated to have a pro-fibrotic effect in lung injury through its regulation of lung fibroblasts,40 but in our in vitro studies, G9a inhibition of mesenchymal cells did not affect their ability to support alveolar organoids. We suggest that age-associated epigenetic changes impair AT2 self-renewal, leading to alveolar progenitor cell exhaustion, though other age-related factors such as altered proteostasis are also likely to contribute.
Our results advocate a model of lung progenitor regulation whereby in young, healthy lungs, G9a-mediated H3K9me2 limits the chromatin accessibility of bronchiolar cell genes, potentially restricting the number of bronchiolar progenitors by promoting their differentiation to AT2 cells, thus restraining BASCs from responding to damage when not needed. In the event of injury to the alveoli, this layer of epigenetic transcriptional control would prevent excess generation of airway-like cells, limiting their regenerative contribution to the areas surrounding the bronchioalveolar duct junction. This would allow the alveoli to be primarily regenerated by AT2 progenitors, the preferred population to maintain AT2 and AT1 cells in homeostasis. However, in aged lungs with the loss of H3K9me2-mediated transcriptional control, AT2 cells are less able to promptly respond to damage. Expanded BASCs with de-repressed club cell gene expression results in a slower regeneration of AT2 and AT1 cells and a longer persistence of airway-like cells in the alveoli (Figure 7i). On the flip side, enhanced bronchiolar progenitor activity enables the faster regeneration of differentiated club cells in the event of airway damage. Thus, BASCs may function as a reserve population in aging to maintain and regenerate the alveoli that is increasingly relied upon as AT2 progenitor functions decrease. It is enticing that our findings could therefore explain the observations that cells with airway features are present in the alveolar space of IPF lungs.53,54 Fitting this model, we observed bronchiolization in G9ai, bleomycin-treated lungs (Fig 3 g–j). Since bronchiolization is a facet of IPF lacking in the bleomycin injury model in young mice, G9ai may in fact improve some aspects of IPF modeling with bleomycin in mice.
The effects of aging on the lung are profound and multifaceted23, but the contribution of epigenetic changes to these phenotypes are understudied. The effects of H3K9me2/3 loss in the aging process in other contexts are thought to have been primarily due to breakdown of pericentric chromatin that can lead to chromosomal instability and de-repression of repeat sequences. Our data suggest the possibility that de-regulation of progenitor activity and regeneration dynamics are also phenotypes of age-related H3K9me2 loss. Progenitor or stem cell exhaustion is often thought of as an independent facet or hallmark of aging, but our data suggest that this effect is downstream of more fundamental cellular processes, including epigenetic changes. Widespread loss of K9me2/3 heterochromatin in progeria has been shown to presage substantial losses in stem cell function45, leading to suggestions that this is a unified mechanism of aging. Our data agree with this hypothesis that epigenetic changes are upstream of losses in stem cell function that appear with aging. Overall, our work supports further interrogation of G9a-mediated gene regulation to aid our understanding of lung progenitor activity and utilize it for new interventions for the many respiratory diseases in which lung repair and regeneration are compromised.
Limitations of the study
Whilst we have thoroughly demonstrated that H3K9me2 loss in lung progenitors alters their dynamic regulation, we have not fully determined the mechanism(s) by which this is mediated, especially in AT2 cells. Transcriptional and epigenomic comparisons by RNA-seq, ATAC-seq and ChIP-seq/CUT&RUN, as well as investigations into the differentially regulated genes in both young/old and H3K9me2-depleted/ control mice will be needed to resolve these questions. Similarly, further cell-specific deletion of G9a in Club cells and BASCs will be needed to distinguish the opposing roles played G9a in these populations compared to AT2 cells.
STAR Methods
Resource Availability
Lead Contact
Further information and requests for resources and reagents should be directed to the Lead Contact, Carla F. Kim Carla.kim@childrens.harvard.edu,
Materials Availability
Mouse Lines created in this study will be shared by the Lead Contact upon request.
Data and Code Availability
All NGS sequencing data in this manuscript will be available from NCBI Geo (GEO: GSE231366). This paper also analyzes existing, publicly available data. These accession numbers for the datasets are listed in the key resources table. This paper does not report original code. Any additional information required to reanalyze the data reported in this paper is available from the lead contact upon request. All other supporting data are available upon reasonable request of the Lead Contact.
KEY RESOURCES TABLE
| REAGENT or RESOURCE | SOURCE | IDENTIFIER |
|---|---|---|
| Antibodies | ||
| Rat monoclonal anti-CD45 APC [30-F11, BD] | Thermo Fisher Scientific | Cat# BDB559864; RRID:AB_398672 |
| Rat monoclonal anti-CD31 APC [MEC 13.3, BD] | Thermo Fisher Scientific | Cat# BDB551262; RRID:AB_398497 |
| Rat monoclonal anti-CD326 (Ep-CAM) PE/Cy7 [G8.8] | Biolegend | Cat# 118216; RRID:AB_1236471 |
| Rat monoclonal anti-Ly-6A/E (Sca1) APC/Cy7 [D7] | Thermo Fisher Scientific | Cat# 560654; RRID:AB_1727552 |
| Rat monoclonal anti-CD24 PE [M1/69, BD] | Thermo Fisher Scientific | (BD Biosciences Cat# 553261, RRID:AB_394740) |
| Rat monoclonal anti-CD24 FITC [M1/69, BD] | Thermo Fisher Scientific | (BD Biosciences Cat# 561079, RRID:AB_2034001) |
| Rabbit monoclonal anti-SP-C [EPR19839] | Abcam | Cat# ab211326 |
| Goat polyclonal anti-SPC (M-20) | Santa Cruz Biotechnology | Cat# sc-7706; RRID:AB_2185507 |
| Goat polyclonal anti-CC10 (T-18) | Santa Cruz Biotechnology | Cat# sc-9772, RRID:AB_2238819 |
| Mouse monoclonal anti-CC10 (B-6) | Santa Cruz Biotechnology | Cat# sc-390313, |
| Mouse monoclonal anti-acetylated tubulin | Sigma-Aldrich | (Sigma-Aldrich Cat# T7451, RRID:AB_609894) |
| Mouse monoclonal anti-Histone H3 (di methyl K9) | Abcam | (Abcam Cat# ab1220, RRID:AB_449854) |
| Rabbit polyclonal anti-Di-Methyl Histone H3 (Lys9) | Cell Signaling Technologies | (Cell Signaling Technology Cat# 9753, RRID:AB_659848) |
| Rabbit polyclonal antiHistone H3 Trimethyl (Lys27) | Cell Signaling Technologies | (Cell Signaling Technology Cat# 9733, RRID:AB_2616029) |
| Mouse monoclonal anti 5-Methylcytosine [33D3] | Epigentek | Cat# 33m3 |
| Mouse monoclonal anti-acetyl-Histone H3 | EMD-Millipore | (Millipore Cat# 06-599, RRID:AB_2115283) |
| Chicken polyclonal anti-GFP | Abcam | (Abcam Cat# ab13970, RRID:AB_300798) |
| Chicken polyclonal anti-Keratin-5 | Biolegend | Biolegend Cat#Poly9059 |
| Hamster monoclonal anti-Podoplanin | Abcam | (Abcam Cat# ab11936, RRID:AB_298718) |
| Rat monoclonal anti-Ki-67 | Thermo Fisher Scientific | (Thermo Fisher Scientific Cat# 14-5698-82, RRID:AB_10854564) |
| Donkey anti-rabbit Alexa Fluor 488 | Thermo Fisher Scientific | (Thermo Fisher Scientific Cat# A-21206, RRID:AB_2535792) |
| Donkey anti-goat Alexa Fluor 594 | Thermo Fisher Scientific | (Thermo Fisher Scientific Cat# A-11058, RRID:AB_2534105) |
| Donkey anti-goat Alexa Fluor 647 | Thermo Fisher Scientific | (Thermo Fisher Scientific Cat# A-21447, RRID:AB_2535864) |
| Donkey anti-mouse Alexa Fluor 594 | Thermo Fisher Scientific | (Thermo Fisher Scientific Cat# A-21203, RRID:AB_141633) |
| Goat anti-mouse Alexa Fluor 647 | Thermo Fisher Scientific | (Thermo Fisher Scientific Cat# A-21235, RRID:AB_2535804) |
| Goat anti-rat Alexa Fluor 647 | Thermo Fisher Scientific | (Thermo Fisher Scientific Cat# A-21247, RRID:AB_141778) |
| Goat anti-chicken Alexa Fluor 594 | Thermo Fisher Scientific | (Thermo Fisher Scientific Cat# A-11042, RRID:AB_2534099) |
| Goat anti-hamster Alexa Fluor 647 | Thermo Fisher Scientific | (Thermo Fisher Scientific Cat# A-21451, RRID:AB_2535868) |
| Bacterial and virus strains | ||
| Ad5CMVCre | UI Viral Vector Core | VVC-U of Iowa 5 |
| Ad5CMVempty | UI Viral Vector Core | VVC-U of Iowa 272 |
| Chemicals, peptides, and recombinant proteins | ||
| UNC 0638 | Tocris | Cat# 4343 |
| UNC 0642 | Tocris | Cat# 5132/10 |
| Bleomycin Sulfate | Sigma-Aldrich | Cat# B2434 |
| Naphthalene | Sigma-Aldrich | Cat# 84679-1G |
| Corn Oil | Sigma-Aldrich | Cat# C8267-500ML |
| Dispase | Corning | Cat# 354235 |
| Collagenase/Dispase | Roche | Cat# 10269638001 |
| Dnase | Sigma-Aldrich | Cat# D4527 |
| Insulin Transferrin Selenium (ITS) | Corning | Cat# 25-800-CR |
| Growth Factor Reduced Matrigel | Corning | Cat# 356231 |
| Critical commercial assays | ||
| TDE I - transposase for ATAC-seq | Illumina | Cat# 15027865 |
| NEBNext High-Fidelity 2X PCR Master Mix | New England Biolabs | Cat# M0541S |
| NEBnext Multiplex Oligos for Illumina (96 Unique Dual Index Primer Pairs) - 96 rxns | New England Biolabs | Cat# E6440S |
| Vectastain elite ABC mouse IgG | Vector Laboratories | Cat#PK-6102 |
| Deposited data | ||
| Single Cell RNA-seq data | Angelidis et al. 201932 | GEO: GSE124872 |
| ATAC-seq data | This study | GEO: GSE231366 |
| Experimental models: Organisms/strains | ||
| C57BL/6J | The Jackson Laboratory | Cat# 000664 |
| B6.Cg-Tg(CAG-DsRed∗MST)1Nagy/J (DsRed.T3) | The Jackson Laboratory | Cat# 6051 |
| B6.129X1-Gt(ROSA)26Sortm1(EYFP)Cos/J (YFP) | The Jackson Laboratory | Cat# 006148 |
| G9afl/fl | Anne Schaefer Laboratory, Mount Sinai University | N.A. |
| G9afl/fl YFP | This Study | N.A. |
| B6.129S-Sftpctm1(cre/ERT2)Blh/J (SPC-CreER) | The Jackson Laboratory | Cat# 028054 |
| SPC-CreER YFP | This Study | N.A. |
| SPC-CreER G9afl/fl YFP | This Study | N.A. |
| Software and algorithms | ||
| Image J | NIH | https://imagej.nih.gov/ij/ |
| GraphPad Prism | GraphPad Software | https://www.graphpad.com/scientific-software/prism/ |
| FlowJo |
Becton, Dickinson & Company |
https://www.flowjo.com/ |
| FASTQC | Andrews et al. 201057 | http://www.bioinformatics.babraham.ac.uk/projects/fastqc |
| Atropos | Didion et al. 201758 | https://github.com/jdidion/atropos |
| Bowtie2 | Langmead et al. 200959 | https://bowtie-bio.sourceforge.net/bowtie2/index.shtml#:~:text=Bowtie%202%20is%20an%20ultrafast,long%20(e.g.%20mammalian)%20genomes. |
| Deeptools | Ramirez et al. 201461 | https://deeptools.readthedocs.io/en/develop/ |
| Samtools | Li et al. 200962 | http://www.htslib.org/ |
| MACS2 | Zhang et al. 200863 | https://pypi.org/project/MACS2/ |
| ChIPQC | Carrol et al. 201464 | https://bioconductor.org/packages/release/bioc/html/ChIPQC.html |
| DiifBind | Stark et al. 201165 | https://bioconductor.org/packages/release/bioc/html/DiffBind.html |
| Bedtools | Qunilan et al. 201067 | https://bedtools.readthedocs.io/en/latest/ |
| ChIPseeker | Yu et al. 201568 | https://bioconductor.org/packages/release/bioc/html/ChIPseeker.html |
| GREAT | McLean et al. 201069 | http://great.stanford.edu/public/html/ |
| MEME | Bailey et al. 200970 | https://meme-suite.org/meme/ |
| Seurat | Rahul Satija Laboratory | https://satijalab.org/seurat/ |
| Other | ||
| ProLongGold Antifade Mountant with DAPI | Thermo Fisher Scientific | Cat# P36935 |
| DAPI | Sigma-Aldrich | Cat# D9542 |
| Transwell Tissue Culture plate | Corning | Cat# 3470 |
| Qubit dsDNA HS Assay Kit | Thermo Fisher Scientific | Cat# Q32851 |
| DMEM | Gibco | Cat# 11995-065 |
| DMEM/F12 | Gibco | Cat# 11330-057 |
| HEPES | Thermo Fisher Scientific | Cat# 15630-080 |
| Penicillin-Streptomycin | Gibco | Cat# 15140-122 |
| Histogel | Thermo Fisher Scientific | Cat# HG4000012 |
Experimental Model and Study Participant Details
Animal Models
Wild-type, Ds-Red.T3, YFP, G9afl/fl YFP, Spc-CreER YFP and Spc-CreER G9afl/fl YFP mice were maintained in virus-free conditions on the C57/Black 6 background. Original G9afl/fl mice were kindly donated by Ann Schaefer from Mount Sinai School of Medicine. G9afl/fl YFP and Spc-CreER G9afl/fl YFP lines were generated by crossing homozygous G9afl/fl and 18-month C57/Black 6 mice were acquired from Jackson laboratories and maintained in the BCH animal facility until 22–24 months of age for experimental use. Unless otherwise stated all other young mice were 6–12 weeks of age. With the exception of the Naphthalene administration, equal numbers of male and female mice were used in all experiments. As Naphthalene treatment has well-documented sex-differential sensitivity, only male mice were used.
Mice used for the experiments were housed and cared for in the Animal Resources at Children’s Hospital (ARCH). The ARCH facility space has 28,000 square feet, 6 suites, providing access to animals without requirement for exiting the building. All mice were housed in micro-isolator cages and sentinel mice were used for monitoring pathogens. All animal procedures were approved by the BCH Animal Care and Use Committee. All mouse experiments were approved by the AAALAC accredited BCH Animal Care and Use Committee and were performed in accordance with relevant institutional and national guidelines regulations.
Lung Stromal Cell Culture
Stromal cells were isolated largely as previously described46. Stromal cells were isolated from 2- to 4-week-old male and female mice by negative selection with anti-CD45-conjugated magnetic beads and positive selection with anti-CD31-conjugated magnetic beads. CD31-positive cells were then amplified in a gelatin-coated culture plate for 3–5 days followed by reselection with anti-CD31-conjugated magnetic beads. For stromal cell G9a inhibition, cells were cultured with 250 nm UNC0638 or vehicle control at 37°C and 5% CO2 for 14 days, with media replenished every 2 days.
Lung Organoid Culture
Mouse organoid Culture was performed largely as previously described46. Briefly, freshly sorted cells from either DsRed, YFP or G9afl/fl YFP mice were resuspended in 3D media (DMEM/F12 (Gibco), 10% FBS, penicillin/streptomycin, 1mM HEPES, and insulin/transferrin/selenium (Corning) at a concentration of 2,500 live cells per well (trypan blue negative). Neonatal stromal cells were resuspended in growth factor reduced Matrigel (Corning) at a concentration of 1x10⁶ cells/ml. Equal volumes of cells in 3D media and stromal cells in growth factor reduced Matrigel were mixed and pipetted into a Transwell (Corning). Plates were incubated for 20 min at 37°C and 5% CO2 until Matrigel solidified. Lastly, 3D media was added to the lower chamber and media was changed every other day. For in vitro G9a inhibition, organoid cultures were grown with 250 nM UNC0638 or vehicle control at 37°C and 5% CO2 for 14 days, with media replenished every 2 days.
Method Details
Lung epithelial cell isolation
Briefly, mice were anesthetized with avertin overdose. Lungs were perfused with cold PBS followed by intratracheal instillation of 2 mL dispase (Corning). Lungs were placed on ice, minced, and incubated in 0.0025% DNase (Sigma-Aldrich) and 100 mg/mL collagenase/dispase (Roche) in PBS for 45 min at 37°C. Cells were then sequentially filtered through 100- and 40-μm cell strainers (Falcon) and centrifuged at 1000 rpm for 5 min at 4°C. Cells were resuspended in red blood cell lysis buffer (0.15 M NH4Cl, 10mM KHCO3, 0.1 mM EDTA) for 90 s at room temperature, followed by addition of DMEM (Gibco) and FBS. Cells were centrifuged at 1000 rpm for 5 min at 4°C and then resuspended in PBS/10% FBS for further staining. The following antibodies were used: anti-CD31 APC, anti-CD45 APC, anti-Ly-6A/E (SCA1) APC/Cy7 (all Thermo Fisher Scientific), anti-CD326 (EpCAM) PE/Cy7 (Biolegend) (all 1:100). DAPI (Sigma-Aldrich) was used to eliminate dead cells. Single stain controls and fluorescence minus one (FMO) controls were included for each experiment. FACS was performed on a FACSAria II and analysis was done on FlowJo (BD).
AdCre infection
In vitro infection of lung epithelial cells was also performed as previously described47. Ad5CMVCre or Ad5Empty adenoviruses (University of Iowa Virology Core) were diluted to 1x10⁷ PFU/ml in MTEC+ media. Freshly sorted lung epithelial cells were resuspended in virus solution at 1000 cells/ml and incubated at for 1hr in 37 °C 5% CO2. Infected cells were washed 3x in PBS and then cultured in 3D organoid co-culture.
In vitro G9a inhibition
UNC0638 (Tocris) was reconstituted to 10 mM DMSO in stock and used at a final concentration of 250 nM in the appropriate culture media for organoid & stromal cell culture. Cells were grown in the presence of the drug for 14 days with fresh media and drug supplied every 48 hrs.
In vivo G9a inhibition
UNC0642 (Tocris) was reconstituted to 50 mg/ml in DMSO stock and diluted to 0.5 mg/ml in sterile filtered corn oil (Sigma) prior to use. For In vivo G9ai, mice were weighed and delivered 5 mg/kg UNC0642 in corn oil or vehicle control by intraperitoneal injection, bi-daily at the same time of day for 14 days prior to experimental intervention or collection of tissue.
Bleomycin Injury
Bleomycin (Sigma) was reconstituted at 20 mg/ml in sterile PBS. Mice of appropriate experimental background were anesthetized with avertin until mice were unresponsive to toe pinch. The mice were positioned on an intratracheal intubation stand and 1.5U/kg of bleomycin (Sigma-Aldrich) in total volume of 40 μl, or PBS control, was delivered intratracheally through a 22G catheter. Mice were removed to recover on heating pads until roused from anesthesia. Mice were monitored for morbidity and were euthanized at the experimental timepoints indicated in the figures. Lungs were inflated, fixed and processed for immunohistology.
Naphthalene Injury
Naphthalene (Sigma) was resuspended in sterile filtered corn oil at 27.5 mg/ml prior to use. Mice were weighed and 200 mg/kg Naphthalene or corn oil control was delivered via intraperitoneal injection. Mice were provided with water-diluted food pellets to aid recovery in days immediately after injury. Mice were monitored for morbidity and were euthanized at the experimental timepoints indicated in the figures. Lungs were inflated, fixed and processed for immunohistology.
Immunofluorescence and Immunohistology
Mouse lung tissues were perfused, inflated, and fixed with 10% neutral-buffered formalin overnight at room temperature. After rinsing with 70% ethanol, paraffin sections were used for histology and IF analysis. Organoid cultures were fixed with10% neutral-buffered formalin overnight at room temperature. After rinsing with 70% ethanol, the organoid culture containing Matrigel plug was immobilized with Histogel (Thermo Scientific) for paraffin embedding. Paraffin sections were used for histology and IF analysis. Sectioned lung tissues or organoid slides underwent deparaffinization by incubation with xylene and rehydration in 100%, 95%, and 70% ethanol successively. Slides were stained with hematoxylin and eosin (H&E), Mason Trichrome, Mason-Goldman Elastica stains, or processed for IF staining. For IF, antigen was retrieved by incubating the slides in citric acid buffer (pH 6) at 95°C for 20 min. Slides were washed with PBS/0.2% Triton X-(PBS-T) and blocked with 10% normal donkey serum for 1 h at room temperature. Primary antibodies were incubated overnight at 4°C at the indicated dilutions pro-SPC (Abcam, 1:500), CCSP (T-18 and B-6, Santa Cruz, 1:200), acetylated α-tubulin (Sigma, 1:1000), H3K9me2 (ab1220, Abcam, 1:200 and Millipore, 1:100), H3K27me3 (C36B11 Cell Signaling Technologies, 1:200), 5mC (33m3, Epigentek, 1:100), H3ac (06–599, EMD-Millipore, 1:200), YFP (ab13970, Abcam, 1:400), Keratin 5 (Poly9059, BioLegend 1:200), PDPN (ab11836, Abcam, 1:200), Ki-67 (14-5698-82, eBioscience, 1:200).Slides were incubated with Alexa Fluor-coupled secondary antibodies, donkey α-rabbit 488, donkey α-goat 594, donkey α-goat 647, donkey α-mouse 594, goat α-mouse 647, goat α-rat 647, goat α-chicken 594 (1:200, Invitrogen) for 1 hour at room temperature. Sections were mounted and counterstained with DAPI. For immunohistochemistry of CCSP, DAB staining kit (SK-4100, Vector labs) was used in combination with the CCSP antibody according to the manufacturers’ instructions.
H3K9me2 and other chromatin modification Immunofluorescence Quantification
AT2 cells and club cells were quantified for H3K9me2 levels in immunofluorescent mouse lung tissue using a semi-automated ImageJ pipeline. First, the cell type of interest was isolated by setting a minimum threshold for a cell-specific cytoplasmic stain (Spc for AT2 cells, Ccsp for club cells) and used to create a region of interest. For BASC cells, the region of interest was determined manually by the investigator. Second, DAPI+ nuclei from within this region of interest were selected with a minimum threshold, transformed into a binary format, watershed, and selected as a new region of interest. Finally, non-nuclear areas of the image were deleted, and mean H3K9me2 fluorescence intensity was measured in each nucleus using the built-in “Analyze Particles” function. Background correction was performed by subtracting the mean fluorescence intensity of airspaces between cellular structures.
Histological Scoring.
For determination of the % damage in bleomycin treated lungs, H&E-stained lung sections were analyzed. The area of the lungs histologically determined to have abnormal structure (Inflammation, fibrosis and occlusion of alveoli) was measured using Image J measure and label function. This was then divided by the measured total lung area multiplied by 100 to produce a percentage. Ashcoft scoring for Fibrosis scoring was performed as previously described55. Briefly, one paraffin section per mouse was stained with Masson’s Trichrome. Slides were de-identified and assessed by a researcher who was blinded to the groups. Forty-five images at 10x magnification were scored per mouse and the average score for each mouse was used to calculate the mean Ashcroft score for each group. Bronchiolization scoring was performed as previously described49. One paraffin section per mouse was Immunostained for CCSP. The entire section was analyzed for the presence of bronchiolization graded I-IV. Each locus of bronchiolization was attributed a numerical score based upon grade (1–4) and the cumulative score of bronchiolized lesions was calculated per mouse.
RT-QPCR
QPCR was carried out as previously described43. Cultured cells or tissues were harvested and dissociated according to their specific protocols. RNA was isolated using either the Absolutely RNA Microprep Kit or Nanoprep Kit (Agilent), depending on cell numbers. cDNA was made using the SuperScript III kit (Invitrogen) and analyzed using TaqMan Assays (Applied Biosystems) with a StepOnePlus™ Real-Time PCR System (Applied Biosystems) and software as per the manufacturer’s recommendations. Gapdh (4352339E) was used as an endogenous control for normalization.
ATAC-seq
ATAC-seq of lung epithelial populations was performed Following previously published methods56. Briefly, Sca-1−, Sca-1+ CD24lo and Sca-1+ CD24hi epithelial cells were isolated from the lungs of vehicle-treated or G9ai mice, and either 50,000 (Sca-1−) or 10,000 (Sca-1+ CD24lo and Sca-1+ CD24hi) cells were used for DNA Transposition and library generation. Quantified libraries were sequenced using an Illumina NextSeq 500 sequencer. Sequence quality was evaluated using FASTQC57. Reads were filtered and trimmed with Atropos58 if necessary. High quality reads were mapped to the mouse genome build (mm10) using Bowtie259. After removing reads from mitochondrial DNA, we included properly paired reads with high mapping quality (MAPQ score >10)60 for further analysis. The 'alignmentSieve' function of Deeptools 61 and 'sorť and 'index' functions of Samtools62 were used to isolate fragments in the Nucleosome Free Regions (NFR) while considering the 9 bp shift (+4 in positive and −5 in negative strand) to account for Tn5 transposase binding as a dimer. Peaks were called using de-duplicated, uniquely mapped reads with MACS263. Peaks with signal value >5 were retained. The final peak set quality was checked using the ChIPQC Bioconductor package64.
Differences in chromatin accessibility between groups were assessed using DiffBind 65. We did not observe significant batch effects due to sex or library preparation date during quality assessment. We used the default DESeq266 incorporated in the DiffBind package for differential peak analysis. The peaks were filtered at the significance level of FDR < 0.05 and |log2 fold change| > 1. We additionally generated sets of “unique” and “shared” peak regions in comparisons of G9ai vs. vehicle using Bedtools67. The unique regions were annotated to nearby genes with ChIPseeker68 and analyzed for over-representation of Gene Ontology terms using GREAT69. Motif enrichment of unique regions was performed using MEME tools 70.
Aging lung scRNA sequencing analysis
Single-cell UMAP projections and gene expression were generated using an existing aging murine lung scRNA sequencing dataset (Angelidis et al., 2019). Raw count data from GSE124872 were loaded into Rstudio (R3.6.3), then analyzed with Seurat (v3.2.3). Cells with >10% mitochondrial content and/or <500 unique genes were removed, followed by data normalization. Principle components were determined, Louvain clustering was performed, UMAP projections were generated, and data was visualized using built-in Seurat functions, ggplot2 (v3.3.2), and patchwork (v1.1.2). Four epithelial clusters were subset from other lung cells based on well-established marker expression (Epcam+ Pecam− Col1a2− Pdgfra−). Cell types were determined with cluster-specific markers identified by differential expression analysis among all epithelial cells using the Seurat function “FindMarkers”. The following cell types were identified by the associated markers; Alveolar type 2 (Sftpc, Lyz2, Abca3), Club (Scgb1a1, Cyp2f2, Scgb3a1), and Ciliated (Foxj1, Tuba1a).
Quantification and Statistical Analysis
All statistical tests were performed using the Graphpad Prism software. The tests used to determine statistical significance and the threshold for significance is quoted in the relevant figure legend. The n value for each experiment is indicated by the number of datapoints plotted on the figure. In the experiments, n represents and individual animal or in the case of organoids, cells derived from a single animal. For a statistical test that compare means (e.g. T-test), the plotted definition of center is the mean and error bars represent standard deviation. For statistical tests that compare medians (e.g. U-Test), the definition of center is the median and 95% confidence intervals are plotted. For histological analyses, the researcher was blinded to the experimental groups.
Supplementary Material
LIFE SCIENCE TABLE WITH EXAMPLES FOR AUTHOR REFERENCE
| REAGENT or RESOURCE | SOURCE | IDENTIFIER |
|---|---|---|
| Antibodies | ||
| Rabbit monoclonal anti-Snail | Cell Signaling Technology | Cat#3879S; RRID: AB_2255011 |
| Mouse monoclonal anti-Tubulin (clone DM1A) | Sigma-Aldrich | Cat#T9026; RRID: AB_477593 |
| Rabbit polyclonal anti-BMAL1 | This paper | N/A |
| Bacterial and virus strains | ||
| pAAV-hSyn-DIO-hM3D(Gq)-mCherry | Krashes et al.1 | Addgene AAV5; 44361-AAV5 |
| AAV5-EF1a-DIO-hChR2(H134R)-EYFP | Hope Center Viral Vectors Core | N/A |
| Cowpox virus Brighton Red | BEI Resources | NR-88 |
| Zika-SMGC-1, GENBANK: KX266255 | Isolated from patient (Wang et al.2) | N/A |
| Staphylococcus aureus | ATCC | ATCC 29213 |
| Streptococcus pyogenes: M1 serotype strain: strain SF370; M1 GAS | ATCC | ATCC 700294 |
| Biological samples | ||
| Healthy adult BA9 brain tissue | University of Maryland Brain & Tissue Bank; http://medschool.umaryland.edu/btbank/ | Cat#UMB1455 |
| Human hippocampal brain blocks | New York Brain Bank | http://nybb.hs.columbia.edu/ |
| Patient-derived xenografts (PDX) | Children's Oncology Group Cell Culture and Xenograft Repository | http://cogcell.org/ |
| Chemicals, peptides, and recombinant proteins | ||
| MK-2206 AKT inhibitor | Selleck Chemicals | S1078; CAS: 1032350-13-2 |
| SB-505124 | Sigma-Aldrich | S4696; CAS: 694433-59-5 (free base) |
| Picrotoxin | Sigma-Aldrich | P1675; CAS: 124-87-8 |
| Human TGF-β | R&D | 240-B; GenPept: P01137 |
| Activated S6K1 | Millipore | Cat#14-486 |
| GST-BMAL1 | Novus | Cat#H00000406-P01 |
| Critical commercial assays | ||
| EasyTag EXPRESS 35S Protein Labeling Kit | PerkinElmer | NEG772014MC |
| CaspaseGlo 3/7 | Promega | G8090 |
| TruSeq ChIP Sample Prep Kit | Illumina | IP-202-1012 |
| Deposited data | ||
| Raw and analyzed data | This paper | GEO: GSE63473 |
| B-RAF RBD (apo) structure | This paper | PDB: 5J17 |
| Human reference genome NCBI build 37, GRCh37 | Genome Reference Consortium | http://www.ncbi.nlm.nih.gov/projects/genome/assembly/grc/human/ |
| Nanog STILT inference | This paper; Mendeley Data | http://dx.doi.org/10.17632/wx6s4mj7s8.2 |
| Affinity-based mass spectrometry performed with 57 genes | This paper; Mendeley Data | Table S8; http://dx.doi.org/10.17632/5hvpvspw82.1 |
| Experimental models: Cell lines | ||
| Hamster: CHO cells | ATCC | CRL-11268 |
| D. melanogaster: Cell line S2: S2-DRSC | Laboratory of Norbert Perrimon | FlyBase: FBtc0000181 |
| Human: Passage 40 H9 ES cells | MSKCC stem cell core facility | N/A |
| Human: HUES 8 hESC line (NIH approval number NIHhESC-09-0021) | HSCI iPS Core | hES Cell Line: HUES-8 |
| Experimental models: Organisms/strains | ||
| C. elegans: Strain BC4011: srl-1(s2500) II; dpy-18(e364) III; unc-46(e177)rol-3(s1040) V. | Caenorhabditis Genetics Center | WB Strain: BC4011; WormBase: WBVar00241916 |
| D. melanogaster: RNAi of Sxl: y[1] sc[*] v[1]; P{TRiP.HMS00609}attP2 | Bloomington Drosophila Stock Center | BDSC:34393; FlyBase: FBtp0064874 |
| S. cerevisiae: Strain background: W303 | ATCC | ATTC: 208353 |
| Mouse: R6/2: B6CBA-Tg(HDexon1)62Gpb/3J | The Jackson Laboratory | JAX: 006494 |
| Mouse: OXTRfl/fl: B6.129(SJL)-Oxtrtm1.1Wsy/J | The Jackson Laboratory | RRID: IMSR_JAX:008471 |
| Zebrafish: Tg(Shha:GFP)t10: t10Tg | Neumann and Nuesslein-Volhard3 | ZFIN: ZDB-GENO-060207-1 |
| Arabidopsis: 35S::PIF4-YFP, BZR1-CFP | Wang et al.4 | N/A |
| Arabidopsis: JYB1021.2: pS24(AT5G58010)::cS24:GFP(-G):NOS #1 | NASC | NASC ID: N70450 |
| Oligonucleotides | ||
| siRNA targeting sequence: PIP5K I alpha #1: ACACAGUACUCAGUUGAUA | This paper | N/A |
| Primers for XX, see Table SX | This paper | N/A |
| Primer: GFP/YFP/CFP Forward: GCACGACTTCTTCAAGTCCGCCATGCC | This paper | N/A |
| Morpholino: MO-pax2a GGTCTGCTTTGCAGTGAATATCCAT | Gene Tools | ZFIN: ZDB-MRPHLNO-061106-5 |
| ACTB (hs01060665_g1) | Life Technologies | Cat#4331182 |
| RNA sequence: hnRNPA1_ligand: UAGGGACUUAGGGUUCUCUCUAGGGACUUAGGGUUCUCUCUAGGGA | This paper | N/A |
| Recombinant DNA | ||
| pLVX-Tight-Puro (TetOn) | Clonetech | Cat#632162 |
| Plasmid: GFP-Nito | This paper | N/A |
| cDNA GH111110 | Drosophila Genomics Resource Center | DGRC:5666; FlyBase:FBcl0130415 |
| AAV2/1-hsyn-GCaMP6- WPRE | Chen et al.5 | N/A |
| Mouse raptor: pLKO mouse shRNA 1 raptor | Thoreen et al.6 | Addgene Plasmid #21339 |
| Software and algorithms | ||
| ImageJ | Schneider et al.7 | https://imagej.nih.gov/ij/ |
| Bowtie2 | Langmead and Salzberg8 | http://bowtie-bio.sourceforge.net/bowtie2/index.shtml |
| Samtools | Li et al.9 | http://samtools.sourceforge.net/ |
| Weighted Maximal Information Component Analysis v0.9 | Rau et al.10 | https://github.com/ChristophRau/wMICA |
| ICS algorithm | This paper; Mendeley Data | http://dx.doi.org/10.17632/5hvpvspw82.1 |
| Other | ||
| Sequence data, analyses, and resources related to the ultra-deep sequencing of the AML31 tumor, relapse, and matched normal | This paper | http://aml31.genome.wustl.edu |
| Resource website for the AML31 publication | This paper | https://github.com/chrisamiller/aml31SuppSite |
PHYSICAL SCIENCE TABLE WITH EXAMPLES FOR AUTHOR REFERENCE
| REAGENT or RESOURCE | SOURCE | IDENTIFIER |
|---|---|---|
| Chemicals, peptides, and recombinant proteins | ||
| QD605 streptavidin conjugated quantum dot | Thermo Fisher Scientific | Cat#Q10101MP |
| Platinum black | Sigma-Aldrich | Cat#205915 |
| Sodium formate BioUltra, ≥99.0% (NT) | Sigma-Aldrich | Cat#71359 |
| Chloramphenicol | Sigma-Aldrich | Cat#C0378 |
| Carbon dioxide (13C, 99%) (<2% 18O) | Cambridge Isotope Laboratories | CLM-185-5 |
| Poly(vinylidene fluoride-co-hexafluoropropylene) | Sigma-Aldrich | 427179 |
| PTFE Hydrophilic Membrane Filters, 0.22 mm, 90 mm | Scientificfilters.com/Tisch Scientific | SF13842 |
| Critical commercial assays | ||
| Folic Acid (FA) ELISA kit | Alpha Diagnostic International | Cat# 0365-0B9 |
| TMT10plex Isobaric Label Reagent Set | Thermo Fisher | A37725 |
| Surface Plasmon Resonance CM5 kit | GE Healthcare | Cat#29104988 |
| NanoBRET Target Engagement K-5 kit | Promega | Cat#N2500 |
| Deposited data | ||
| B-RAF RBD (apo) structure | This paper | PDB: 5J17 |
| Structure of compound 5 | This paper; Cambridge Crystallographic Data Center | CCDC: 2016466 |
| Code for constraints-based modeling and analysis of autotrophic E. coli | This paper | https://gitlab.com/elad.noor/sloppy/tree/master/rubisco |
| Software and algorithms | ||
| Gaussian09 | Frish et al.1 | https://gaussian.com |
| Python version 2.7 | Python Software Foundation | https://www.python.org |
| ChemDraw Professional 18.0 | PerkinElmer | https://www.perkinelmer.com/category/chemdraw |
| Weighted Maximal Information Component Analysis v0.9 | Rau et al.2 | https://github.com/ChristophRau/wMICA |
| Other | ||
| DASGIP MX4/4 Gas Mixing Module for 4 Vessels with a Mass Flow Controller | Eppendorf | Cat#76DGMX44 |
| Agilent 1200 series HPLC | Agilent Technologies | https://www.agilent.com/en/products/liquid-chromatography |
| PHI Quantera II XPS | ULVAC-PHI, Inc. | https://www.ulvac-phi.com/en/products/xps/phi-quantera-ii/ |
Highlights.
Old lungs have fewer Alveolar Type II cells, more Bronchioalveolar Stem Cells (BASCs).
Epithelial cells in old lungs have significantly lower levels of H3K9me2.
H3K9me2 loss slows alveolar regeneration and enhances airway epithelial regeneration.
Loss of H3K9me2 increases airway epithelium gene accessibility and BASC frequency.
Acknowledgements
This work was supported by the IASLC Young Investigator Fellowship (S.P.R.), Damon Runyon Cancer Research Foundation postdoctoral fellowship (DRG:2368–19), Burroughs-Welcome Fund Postdoctoral Enrichment Program Award (1019903) (A.L.M.), F31 HL159919 (I.G.W.), R01 HL090136, R01 HL132266, R01 HL125821, U01 HL100402 RFA-HL-09-004, R35HL150876, U01 CA267827, LONGFONDS | Accelerate, project BREATH, the Thoracic Foundation, the Ellison Foundation, The Harvard Medical School Translational Seed Grant and the Harvard Stem Cell Institute (C.F.K.). We thank Ann Schaefer for providing the G9afl/fl mice. We thank D. Kotton, for advice and critical reading of the manuscript and B. Stripp, M. Königshoff and members of the Kim lab for feedback. We also thank R. Mathieu, M. Patinak and the BCH Flow Cytometry Core and the HMS Biopolymers Facility for technical assistance.
Footnotes
Publisher's Disclaimer: This is a PDF file of an unedited manuscript that has been accepted for publication. As a service to our customers we are providing this early version of the manuscript. The manuscript will undergo copyediting, typesetting, and review of the resulting proof before it is published in its final form. Please note that during the production process errors may be discovered which could affect the content, and all legal disclaimers that apply to the journal pertain.
Inclusion and Diversity
One or more of the authors of this paper self-identifies as a gender minority in their field of research. One or more of the authors identifies as a member of the LGBTQIA+ community. One or more of the authors of this paper self-identifies as living with a disability.
Declaration of Interests
C.F.K. had a sponsored research agreement with Celgene/BMS Corporation during part of the period of these studies, yet the work in that agreement did not overlap with this study. C.F.K. and S.P.R. have a patent related to this work. C.F.K. and A.L.M. are founders of Cellforma. All other authors declare no competing interests.
References
- 1.Wang H, Naghavi M, Allen C, Barber RM, Bhutta ZA, Carter A, Casey DC, Charlson FJ, Chen AZ, Coates MM, et al. (2016). Global, regional, and national life expectancy, all-cause mortality, and cause-specific mortality for 249 causes of death, 1980–2015: a systematic analysis for the Global Burden of Disease Study 2015. The Lancet 388, 1459–1544. 10.1016/S0140-6736(16)31012-1. [DOI] [PMC free article] [PubMed] [Google Scholar]
- 2.Mendis S, Armstrong T, Bettcher D, Branca F, Lauer J, Mace C, Poznyak V, Riley L, Silva VDCE, and Stevens G (2014). Global Status Report on noncommunicable diseases 2014. Geneva World Health Organization
- 3.Rock Jason R., Gao X, Xue Y, Randell Scott H., Kong Y-Y, and Hogan Brigid L.M. (2011). Notch-Dependent Differentiation of Adult Airway Basal Stem Cells. Cell Stem Cell 8, 639–648. 10.1016/j.stem.2011.04.003. [DOI] [PMC free article] [PubMed] [Google Scholar]
- 4.Rock JR, Onaitis MW, Rawlins EL, Lu Y, Clark CP, Xue Y, Randell SH, and Hogan BLM (2009). Basal cells as stem cells of the mouse trachea and human airway epithelium. Proceedings of the National Academy of Sciences 106, 12771–12775. 10.1073/pnas.0906850106. [DOI] [PMC free article] [PubMed] [Google Scholar]
- 5.Hong KU, Reynolds SD, Watkins S, Fuchs E, and Stripp BR (2004). Basal cells are a multipotent progenitor capable of renewing the bronchial epithelium. Am J Pathol 164, 577–588. 10.1016/s0002-9440(10)63147-1. [DOI] [PMC free article] [PubMed] [Google Scholar]
- 6.Rawlins EL, Okubo T, Xue Y, Brass DM, Auten RL, Hasegawa H, Wang F, and Hogan BL (2009). The role of Scgb1a1+ Clara cells in the long-term maintenance and repair of lung airway, but not alveolar, epithelium. Cell Stem Cell 4, 525–534. 10.1016/j.stem.2009.04.002. [DOI] [PMC free article] [PubMed] [Google Scholar]
- 7.Kim CFB, Jackson EL, Woolfenden AE, Lawrence S, Babar I, Vogel S, Crowley D, Bronson RT, and Jacks T (2005). Identification of Bronchioalveolar Stem Cells in Normal Lung and Lung Cancer. Cell 121, 823–835. [DOI] [PubMed] [Google Scholar]
- 8.Liu Q, Liu K, Cui G, Huang X, Yao S, Guo W, Qin Z, Li Y, Yang R, Pu W, et al. (2019). Lung regeneration by multipotent stem cells residing at the bronchioalveolar-duct junction. Nature Genetics 51, 728–738. 10.1038/s41588-019-0346-6. [DOI] [PubMed] [Google Scholar]
- 9.Salwig I, Spitznagel B, Vazquez-Armendariz AI, Khalooghi K, Guenther S, Herold S, Szibor M, and Braun T (2019). Bronchioalveolar stem cells are a main source for regeneration of distal lung epithelia in vivo. The EMBO Journal 38, e102099. 10.15252/embj.2019102099. [DOI] [PMC free article] [PubMed] [Google Scholar]
- 10.Barkauskas CE, Cronce MJ, Rackley CR, Bowie EJ, Keene DR, Stripp BR, Randell SH, Noble PW, and Hogan BLM (2013). Type 2 alveolar cells are stem cells in adult lung. J Clin Invest 123, 3025–3036. 10.1172/JCI68782. [DOI] [PMC free article] [PubMed] [Google Scholar]
- 11.Desai TJ, Brownfield DG, and Krasnow MA (2014). Alveolar progenitor and stem cells in lung development, renewal and cancer. Nature 507, 190–194. 10.1038/nature12930. [DOI] [PMC free article] [PubMed] [Google Scholar]
- 12.Zacharias WJ, Frank DB, Zepp JA, Morley MP, Alkhaleel FA, Kong J, Zhou S, Cantu E, and Morrisey EE (2018). Regeneration of the lung alveolus by an evolutionarily conserved epithelial progenitor. Nature 555, 251–255. 10.1038/nature25786. [DOI] [PMC free article] [PubMed] [Google Scholar]
- 13.Choi J, Park JE, Tsagkogeorga G, Yanagita M, Koo BK, Han N, and Lee JH (2020). Inflammatory Signals Induce AT2 Cell-Derived Damage-Associated Transient Progenitors that Mediate Alveolar Regeneration. Cell Stem Cell 27, 366–382.e367. 10.1016/j.stem.2020.06.020. [DOI] [PMC free article] [PubMed] [Google Scholar]
- 14.Guha A, Deshpande A, Jain A, Sebastiani P, and Cardoso WV (2017). Uroplakin 3a+ Cells Are a Distinctive Population of Epithelial Progenitors that Contribute to Airway Maintenance and Post-injury Repair. Cell Reports 19, 246–254. 10.1016/j.celrep.2017.03.051. [DOI] [PubMed] [Google Scholar]
- 15.Hong KU, Reynolds SD, Giangreco A, Hurley CM, and Stripp BR (2001). Clara cell secretory protein-expressing cells of the airway neuroepithelial body microenvironment include a label-retaining subset and are critical for epithelial renewal after progenitor cell depletion. Am J Respir Cell Mol Biol 24, 671–681. 10.1165/ajrcmb.24.6.4498. [DOI] [PubMed] [Google Scholar]
- 16.Kathiriya JJ, Brumwell AN, Jackson JR, Tang X, and Chapman HA (2020). Distinct Airway Epithelial Stem Cells Hide among Club Cells but Mobilize to Promote Alveolar Regeneration. Cell Stem Cell 26, 346–358.e344. 10.1016/j.stem.2019.12.014. [DOI] [PMC free article] [PubMed] [Google Scholar]
- 17.Kobayashi Y, Tata A, Konkimalla A, Katsura H, Lee RF, Ou J, Banovich NE, Kropski JA, and Tata PR (2020). Persistence of a regeneration-associated, transitional alveolar epithelial cell state in pulmonary fibrosis. Nature cell biology 22, 934–946. 10.1038/s41556-020-0542-8. [DOI] [PMC free article] [PubMed] [Google Scholar]
- 18.Ouadah Y, Rojas ER, Riordan DP, Capostagno S, Kuo CS, and Krasnow MA (2019). Rare Pulmonary Neuroendocrine Cells Are Stem Cells Regulated by Rb, p53, and Notch. Cell 179, 403–416.e423. 10.1016/j.cell.2019.09.010. [DOI] [PMC free article] [PubMed] [Google Scholar]
- 19.Vaughan AE, Brumwell AN, Xi Y, Gotts JE, Brownfield DG, Treutlein B, Tan K, Tan V, Liu FC, Looney MR, et al. (2015). Lineage-negative progenitors mobilize to regenerate lung epithelium after major injury. Nature 517, 621–625. 10.1038/nature14112. [DOI] [PMC free article] [PubMed] [Google Scholar]
- 20.Zuo W, Zhang T, Wu DZA, Guan SP, Liew A-A, Yamamoto Y, Wang X, Lim SJ, Vincent M, Lessard M, et al. (2015). p63(+)Krt5(+) distal airway stem cells are essential for lung regeneration. Nature 517, 616–620. 10.1038/nature13903. [DOI] [PMC free article] [PubMed] [Google Scholar]
- 21.Schultz MB, and Sinclair DA (2016). When stem cells grow old: phenotypes and mechanisms of stem cell aging. Development (Cambridge, England) 143, 3–14. 10.1242/dev.130633. [DOI] [PMC free article] [PubMed] [Google Scholar]
- 22.Wells JM, and Watt FM (2018). Diverse mechanisms for endogenous regeneration and repair in mammalian organs. Nature 557, 322–328. 10.1038/s41586-018-0073-7. [DOI] [PubMed] [Google Scholar]
- 23.Schneider JL, Rowe JH, Garcia-de-Alba C, Kim CF, Sharpe AH, and Haigis MC (2021). The aging lung: Physiology, disease, and immunity. Cell 184, 1990–2019. 10.1016/j.cell.2021.03.005. [DOI] [PMC free article] [PubMed] [Google Scholar]
- 24.Navarro S, and Driscoll B (2017). Regeneration of the Aging Lung: A Mini-Review. Gerontology 63, 270–280. 10.1159/000451081. [DOI] [PubMed] [Google Scholar]
- 25.Hecker L, Logsdon NJ, Kurundkar D, Kurundkar A, Bernard K, Hock T, Meldrum E, Sanders YY, and Thannickal VJ (2014). Reversal of persistent fibrosis in aging by targeting Nox4-Nrf2 redox imbalance. Science translational medicine 6, 231ra247. 10.1126/scitranslmed.3008182. [DOI] [PMC free article] [PubMed] [Google Scholar]
- 26.Huang WT, Akhter H, Jiang C, MacEwen M, Ding Q, Antony V, Thannickal VJ, and Liu RM (2015). Plasminogen activator inhibitor 1, fibroblast apoptosis resistance, and aging-related susceptibility to lung fibrosis. Experimental gerontology 61, 62–75. 10.1016/j.exger.2014.11.018. [DOI] [PMC free article] [PubMed] [Google Scholar]
- 27.Sueblinvong V, Neujahr DC, Mills ST, Roser-Page S, Ritzenthaler JD, Guidot D, Rojas M, and Roman J (2012). Predisposition for disrepair in the aged lung. The American journal of the medical sciences 344, 41–51. 10.1097/MAJ.0b013e318234c132. [DOI] [PMC free article] [PubMed] [Google Scholar]
- 28.Strunz M, Simon LM, Ansari M, Kathiriya JJ, Angelidis I, Mayr CH, Tsidiridis G, Lange M, Mattner LF, Yee M, et al. (2020). Alveolar regeneration through a Krt8+ transitional stem cell state that persists in human lung fibrosis. Nature communications 11, 3559. 10.1038/s41467-020-17358-3. [DOI] [PMC free article] [PubMed] [Google Scholar]
- 29.López-Otín C, Blasco MA, Partridge L, Serrano M, and Kroemer G (2013). The Hallmarks of Aging. Cell 153, 1194–1217. 10.1016/j.cell.2013.05.039. [DOI] [PMC free article] [PubMed] [Google Scholar]
- 30.Nardini C, Moreau J-F, Gensous N, Ravaioli F, Garagnani P, and Bacalini MG (2018). The epigenetics of inflammaging: The contribution of age-related heterochromatin loss and locus-specific remodelling and the modulation by environmental stimuli. Seminars in Immunology 40, 49–60. 10.1016/j.smim.2018.10.009. [DOI] [PubMed] [Google Scholar]
- 31.Tsurumi A, and Li WX (2012). Global heterochromatin loss: a unifying theory of aging? Epigenetics 7, 680–688. 10.4161/epi.20540. [DOI] [PMC free article] [PubMed] [Google Scholar]
- 32.Angelidis I, Simon LM, Fernandez IE, Strunz M, Mayr CH, Greiffo FR, Tsitsiridis G, Ansari M, Graf E, Strom T-M, et al. (2019). An atlas of the aging lung mapped by single cell transcriptomics and deep tissue proteomics. Nature communications 10, 963. 10.1038/s41467-019-08831-9. [DOI] [PMC free article] [PubMed] [Google Scholar]
- 33.Chen T, and Dent SY (2014). Chromatin modifiers and remodellers: regulators of cellular differentiation. Nat Rev Genet 15, 93–106. 10.1038/nrg3607. [DOI] [PMC free article] [PubMed] [Google Scholar]
- 34.Zacharek SJ, Fillmore CM, Lau AN, Gludish DW, Chou A, Ho JWK, Zamponi R, Gazit R, Bock C, Jäger N, et al. (2011). Lung stem cell self-renewal relies on Bmi1-dependent control of expression at imprinted loci. Cell stem cell 9, 272–281. 10.1016/j.stem.2011.07.007. [DOI] [PMC free article] [PubMed] [Google Scholar]
- 35.Wang Y, Frank DB, Morley MP, Zhou S, Wang X, Lu MM, Lazar MA, and Morrisey EE (2016). HDAC3-Dependent Epigenetic Pathway Controls Lung Alveolar Epithelial Cell Remodeling and Spreading via miR-17-92 and TGF-β Signaling Regulation. Dev Cell 36, 303–315. 10.1016/j.devcel.2015.12.031. [DOI] [PMC free article] [PubMed] [Google Scholar]
- 36.Yao C, Carraro G, Konda B, Guan X, Mizuno T, Chiba N, Kostelny M, Kurkciyan A, David G, McQualter JL, and Stripp BR (2017). Sin3a regulates epithelial progenitor cell fate during lung development. Development (Cambridge, England) 144, 2618–2628. 10.1242/dev.149708. [DOI] [PMC free article] [PubMed] [Google Scholar]
- 37.Liberti DC, Zepp JA, Bartoni CA, Liberti KH, Zhou S, Lu M, Morley MP, and Morrisey EE (2019). Dnmt1 is required for proximal-distal patterning of the lung endoderm and for restraining alveolar type 2 cell fate. Developmental Biology 454, 108–117. 10.1016/j.ydbio.2019.06.019. [DOI] [PMC free article] [PubMed] [Google Scholar]
- 38.Tachibana M, Sugimoto K, Nozaki M, Ueda J, Ohta T, Ohki M, Fukuda M, Takeda N, Niida H, Kato H, and Shinkai Y (2002). G9a histone methyltransferase plays a dominant role in euchromatic histone H3 lysine 9 methylation and is essential for early embryogenesis. Genes & Development 16, 1779–1791. 10.1101/gad.989402. [DOI] [PMC free article] [PubMed] [Google Scholar]
- 39.Tachibana M, Ueda J, Fukuda M, Takeda N, Ohta T, Iwanari H, Sakihama T, Kodama T, Hamakubo T, and Shinkai Y (2005). Histone methyltransferases G9a and GLP form heteromeric complexes and are both crucial for methylation of euchromatin at H3-K9. Genes Dev 19, 815–826. 10.1101/gad.1284005. [DOI] [PMC free article] [PubMed] [Google Scholar]
- 40.Ligresti G, Caporarello N, Meridew JA, Jones DL, Tan Q, Choi KM, Haak AJ, Aravamudhan A, Roden AC, Prakash YS, et al. (2019). CBX5/G9a/H3K9me-mediated gene repression is essential to fibroblast activation during lung fibrosis. JCI Insight 5. 10.1172/jci.insight.127111. [DOI] [PMC free article] [PubMed] [Google Scholar]
- 41.Chen M-W, Hua K-T, Kao H-J, Chi C-C, Wei L-H, Johansson G, Shiah S-G, Chen P-S, Jeng Y-M, Cheng T-Y, et al. (2010). H3K9 Histone Methyltransferase G9a Promotes Lung Cancer Invasion and Metastasis by Silencing the Cell Adhesion Molecule Ep-CAM. Cancer Research 70, 7830–7840. 10.1158/0008-5472.can-10-0833. [DOI] [PubMed] [Google Scholar]
- 42.Zhang K, Wang J, Yang L, Yuan YC, Tong TR, Wu J, Yun X, Bonner M, Pangeni R, Liu Z, et al. (2018). Targeting histone methyltransferase G9a inhibits growth and Wnt signaling pathway by epigenetically regulating HP1α and APC2 gene expression in non-small cell lung cancer. Mol Cancer 17, 153. 10.1186/s12943-0180896-8. [DOI] [PMC free article] [PubMed] [Google Scholar]
- 43.Rowbotham SP, Li F, Dost AFM, Louie SM, Marsh BP, Pessina P, Anbarasu CR, Brainson CF, Tuminello SJ, Lieberman A, et al. (2018). H3K9 methyltransferases and demethylases control lung tumor-propagating cells and lung cancer progression. Nature communications 9, 4559. 10.1038/s41467-018-07077-1. [DOI] [PMC free article] [PubMed] [Google Scholar]
- 44.Djeghloul D, Kuranda K, Kuzniak I, Barbieri D, Naguibneva I, Choisy C, Bories J-C, Dosquet C, Pla M, Vanneaux V, et al. (2016). Age-Associated Decrease of the Histone Methyltransferase SUV39H1 in HSC Perturbs Heterochromatin and B Lymphoid Differentiation. Stem Cell Reports 6, 970–984. 10.1016/j.stemcr.2016.05.007. [DOI] [PMC free article] [PubMed] [Google Scholar]
- 45.Zhang W, Li J, Suzuki K, Qu J, Wang P, Zhou J, Liu X, Ren R, Xu X, Ocampo A, et al. (2015). A Werner syndrome stem cell model unveils heterochromatin alterations as a driver of human aging. Science 348, 1160. 10.1126/science.aaa1356. [DOI] [PMC free article] [PubMed] [Google Scholar]
- 46.Lee J-H, Bhang DH, Beede A, Huang TL, Stripp BR, Bloch KD, Wagers AJ, Tseng Y-H, Ryeom S, and Kim CF (2014). Lung stem cell differentiation in mice directed by endothelial cells via a BMP4-NFATc1-Thrombospondin-1 axis. Cell 156, 440–455. 10.1016/j.cell.2013.12.039. [DOI] [PMC free article] [PubMed] [Google Scholar]
- 47.Dost AFM, Moye AL, Vedaie M, Tran LM, Fung E, Heinze D, Villacorta-Martin C, Huang J, Hekman R, Kwan JH, et al. (2020). Organoids Model Transcriptional Hallmarks of Oncogenic KRAS Activation in Lung Epithelial Progenitor Cells. Cell Stem Cell 27, 663–678.e668. 10.1016/j.stem.2020.07.022. [DOI] [PMC free article] [PubMed] [Google Scholar]
- 48.Liu F, Barsyte-Lovejoy D, Li F, Xiong Y, Korboukh V, Huang X-P, Allali-Hassani A, Janzen WP, Roth BL, Frye SV, et al. (2013). Discovery of an in Vivo Chemical Probe of the Lysine Methyltransferases G9a and GLP. Journal of Medicinal Chemistry 56, 8931–8942. 10.1021/jm401480r. [DOI] [PMC free article] [PubMed] [Google Scholar]
- 49.Betsuyaku T, Fukuda Y, Parks WC, Shipley JM, and Senior RM (2000). Gelatinase B is required for alveolar bronchiolization after intratracheal bleomycin. Am J Pathol 157, 525–535. 10.1016/s0002-9440(10)64563-4. [DOI] [PMC free article] [PubMed] [Google Scholar]
- 50.Parimon T, Yao C, Stripp BR, Noble PW, and Chen P (2020). Alveolar Epithelial Type II Cells as Drivers of Lung Fibrosis in Idiopathic Pulmonary Fibrosis. Int J Mol Sci 21, 2269. 10.3390/ijms21072269. [DOI] [PMC free article] [PubMed] [Google Scholar]
- 51.Xu Y, Mizuno T, Sridharan A, Du Y, Guo M, Tang J, Wikenheiser-Brokamp KA, Perl A-KT, Funari VA, Gokey JJ, et al. (2016). Single-cell RNA sequencing identifies diverse roles of epithelial cells in idiopathic pulmonary fibrosis. JCI insight 1, e90558–e90558. 10.1172/jci.insight.90558. [DOI] [PMC free article] [PubMed] [Google Scholar]
- 52.Selman M, and Pardo A (2020). The leading role of epithelial cells in the pathogenesis of idiopathic pulmonary fibrosis. Cell Signal 66, 109482. 10.1016/j.cellsig.2019.109482. [DOI] [PubMed] [Google Scholar]
- 53.Plantier L, Crestani B, Wert SE, Dehoux M, Zweytick B, Guenther A, and Whitsett JA (2011). Ectopic respiratory epithelial cell differentiation in bronchiolised distal airspaces in idiopathic pulmonary fibrosis. Thorax 66, 651–657. 10.1136/thx.2010.151555. [DOI] [PubMed] [Google Scholar]
- 54.Seibold MA, Smith RW, Urbanek C, Groshong SD, Cosgrove GP, Brown KK, Schwarz MI, Schwartz DA, and Reynolds SD (2013). The idiopathic pulmonary fibrosis honeycomb cyst contains a mucocilary pseudostratified epithelium. PLoS One 8, e58658–e58658. 10.1371/journal.pone.0058658. [DOI] [PMC free article] [PubMed] [Google Scholar]
- 55.Louie SM, Moye AL, Wong IG, Lu E, Shehaj A, Garcia-de-Alba C, Ararat E, Raby BA, Lu B, Paschini M, et al. (2022). Progenitor potential of lung epithelial organoid cells in a transplantation model. Cell Reports 39, 110662. 10.1016/j.celrep.2022.110662. [DOI] [PMC free article] [PubMed] [Google Scholar]
- 56.Corces MR, Trevino AE, Hamilton EG, Greenside PG, Sinnott-Armstrong NA, Vesuna S, Satpathy AT, Rubin AJ, Montine KS, Wu B, et al. (2017). An improved ATAC-seq protocol reduces background and enables interrogation of frozen tissues. Nature Methods 14, 959–962. 10.1038/nmeth.4396. [DOI] [PMC free article] [PubMed] [Google Scholar]
- 57.Andrews S (2010). FastQC: a quality control tool for high throughput sequence data http://www.bioinformatics.babraham.ac.uk/projects/fastqc.
- 58.Didion JP, Martin M, and Collins FS (2017). Atropos: specific, sensitive, and speedy trimming of sequencing reads. PeerJ 5, e3720. 10.7717/peerj.3720. [DOI] [PMC free article] [PubMed] [Google Scholar]
- 59.Langmead B, Trapnell C, Pop M, and Salzberg SL (2009). Ultrafast and memory-efficient alignment of short DNA sequences to the human genome. Genome biology 10, R25. 10.1186/gb-2009-10-3-r25. [DOI] [PMC free article] [PubMed] [Google Scholar]
- 60.Tarasov A, Vilella AJ, Cuppen E, Nijman IJ, and Prins P (2015). Sambamba: fast processing of NGS alignment formats. Bioinformatics 31, 2032–2034. 10.1093/bioinformatics/btv098. [DOI] [PMC free article] [PubMed] [Google Scholar]
- 61.Ramírez F, Dündar F, Diehl S, Grüning BA, and Manke T (2014). deepTools: a flexible platform for exploring deep-sequencing data. Nucleic acids research 42, W187–191. 10.1093/nar/gku365. [DOI] [PMC free article] [PubMed] [Google Scholar]
- 62.Li H, Handsaker B, Wysoker A, Fennell T, Ruan J, Homer N, Marth G, Abecasis G, and Durbin R (2009). The Sequence Alignment/Map format and SAMtools. Bioinformatics 25, 2078–2079. 10.1093/bioinformatics/btp352. [DOI] [PMC free article] [PubMed] [Google Scholar]
- 63.Zhang Y, Liu T, Meyer CA, Eeckhoute J, Johnson DS, Bernstein BE, Nusbaum C, Myers RM, Brown M, Li W, and Liu XS (2008). Model-based analysis of ChIP-Seq (MACS). Genome biology 9, R137. 10.1186/gb-2008-9-9-r137. [DOI] [PMC free article] [PubMed] [Google Scholar]
- 64.Carroll TS, Liang Z, Salama R, Stark R, and de Santiago I (2014). Impact of artifact removal on ChIP quality metrics in ChIP-seq and ChIP-exo data. Frontiers in Genetics 5. 10.3389/fgene.2014.00075. [DOI] [PMC free article] [PubMed] [Google Scholar]
- 65.Stark R, and Brown G (2011). DiffBind: differential binding analysis of ChIP-Seq peak data http://bioconductor.org/packages/release/bioc/vignettes/DiffBind/inst/doc/DiffBind.pdf.
- 66.Love MI, Huber W, and Anders S (2014). Moderated estimation of fold change and dispersion for RNA-seq data with DESeq2. Genome biology 15, 550. 10.1186/s13059-014-0550-8. [DOI] [PMC free article] [PubMed] [Google Scholar]
- 67.Quinlan AR, and Hall IM (2010). BEDTools: a flexible suite of utilities for comparing genomic features. Bioinformatics 26, 841–842. 10.1093/bioinformatics/btq033. [DOI] [PMC free article] [PubMed] [Google Scholar]
- 68.Yu G, Wang L-G, and He Q-Y (2015). ChIPseeker: an R/Bioconductor package for ChIP peak annotation, comparison and visualization. Bioinformatics 31, 2382–2383. 10.1093/bioinformatics/btv145. [DOI] [PubMed] [Google Scholar]
- 69.McLean CY, Bristor D, Hiller M, Clarke SL, Schaar BT, Lowe CB, Wenger AM, and Bejerano G (2010). GREAT improves functional interpretation of cis-regulatory regions. Nature Biotechnology 28, 495–501. 10.1038/nbt.1630. [DOI] [PMC free article] [PubMed] [Google Scholar]
- 70.Bailey TL, Boden M, Buske FA, Frith M, Grant CE, Clementi L, Ren J, Li WW, and Noble WS (2009). MEME Suite: tools for motif discovery and searching. Nucleic acids research 37, W202–W208. 10.1093/nar/gkp335. [DOI] [PMC free article] [PubMed] [Google Scholar]
Associated Data
This section collects any data citations, data availability statements, or supplementary materials included in this article.
Supplementary Materials
Data Availability Statement
All NGS sequencing data in this manuscript will be available from NCBI Geo (GEO: GSE231366). This paper also analyzes existing, publicly available data. These accession numbers for the datasets are listed in the key resources table. This paper does not report original code. Any additional information required to reanalyze the data reported in this paper is available from the lead contact upon request. All other supporting data are available upon reasonable request of the Lead Contact.
KEY RESOURCES TABLE
| REAGENT or RESOURCE | SOURCE | IDENTIFIER |
|---|---|---|
| Antibodies | ||
| Rat monoclonal anti-CD45 APC [30-F11, BD] | Thermo Fisher Scientific | Cat# BDB559864; RRID:AB_398672 |
| Rat monoclonal anti-CD31 APC [MEC 13.3, BD] | Thermo Fisher Scientific | Cat# BDB551262; RRID:AB_398497 |
| Rat monoclonal anti-CD326 (Ep-CAM) PE/Cy7 [G8.8] | Biolegend | Cat# 118216; RRID:AB_1236471 |
| Rat monoclonal anti-Ly-6A/E (Sca1) APC/Cy7 [D7] | Thermo Fisher Scientific | Cat# 560654; RRID:AB_1727552 |
| Rat monoclonal anti-CD24 PE [M1/69, BD] | Thermo Fisher Scientific | (BD Biosciences Cat# 553261, RRID:AB_394740) |
| Rat monoclonal anti-CD24 FITC [M1/69, BD] | Thermo Fisher Scientific | (BD Biosciences Cat# 561079, RRID:AB_2034001) |
| Rabbit monoclonal anti-SP-C [EPR19839] | Abcam | Cat# ab211326 |
| Goat polyclonal anti-SPC (M-20) | Santa Cruz Biotechnology | Cat# sc-7706; RRID:AB_2185507 |
| Goat polyclonal anti-CC10 (T-18) | Santa Cruz Biotechnology | Cat# sc-9772, RRID:AB_2238819 |
| Mouse monoclonal anti-CC10 (B-6) | Santa Cruz Biotechnology | Cat# sc-390313, |
| Mouse monoclonal anti-acetylated tubulin | Sigma-Aldrich | (Sigma-Aldrich Cat# T7451, RRID:AB_609894) |
| Mouse monoclonal anti-Histone H3 (di methyl K9) | Abcam | (Abcam Cat# ab1220, RRID:AB_449854) |
| Rabbit polyclonal anti-Di-Methyl Histone H3 (Lys9) | Cell Signaling Technologies | (Cell Signaling Technology Cat# 9753, RRID:AB_659848) |
| Rabbit polyclonal antiHistone H3 Trimethyl (Lys27) | Cell Signaling Technologies | (Cell Signaling Technology Cat# 9733, RRID:AB_2616029) |
| Mouse monoclonal anti 5-Methylcytosine [33D3] | Epigentek | Cat# 33m3 |
| Mouse monoclonal anti-acetyl-Histone H3 | EMD-Millipore | (Millipore Cat# 06-599, RRID:AB_2115283) |
| Chicken polyclonal anti-GFP | Abcam | (Abcam Cat# ab13970, RRID:AB_300798) |
| Chicken polyclonal anti-Keratin-5 | Biolegend | Biolegend Cat#Poly9059 |
| Hamster monoclonal anti-Podoplanin | Abcam | (Abcam Cat# ab11936, RRID:AB_298718) |
| Rat monoclonal anti-Ki-67 | Thermo Fisher Scientific | (Thermo Fisher Scientific Cat# 14-5698-82, RRID:AB_10854564) |
| Donkey anti-rabbit Alexa Fluor 488 | Thermo Fisher Scientific | (Thermo Fisher Scientific Cat# A-21206, RRID:AB_2535792) |
| Donkey anti-goat Alexa Fluor 594 | Thermo Fisher Scientific | (Thermo Fisher Scientific Cat# A-11058, RRID:AB_2534105) |
| Donkey anti-goat Alexa Fluor 647 | Thermo Fisher Scientific | (Thermo Fisher Scientific Cat# A-21447, RRID:AB_2535864) |
| Donkey anti-mouse Alexa Fluor 594 | Thermo Fisher Scientific | (Thermo Fisher Scientific Cat# A-21203, RRID:AB_141633) |
| Goat anti-mouse Alexa Fluor 647 | Thermo Fisher Scientific | (Thermo Fisher Scientific Cat# A-21235, RRID:AB_2535804) |
| Goat anti-rat Alexa Fluor 647 | Thermo Fisher Scientific | (Thermo Fisher Scientific Cat# A-21247, RRID:AB_141778) |
| Goat anti-chicken Alexa Fluor 594 | Thermo Fisher Scientific | (Thermo Fisher Scientific Cat# A-11042, RRID:AB_2534099) |
| Goat anti-hamster Alexa Fluor 647 | Thermo Fisher Scientific | (Thermo Fisher Scientific Cat# A-21451, RRID:AB_2535868) |
| Bacterial and virus strains | ||
| Ad5CMVCre | UI Viral Vector Core | VVC-U of Iowa 5 |
| Ad5CMVempty | UI Viral Vector Core | VVC-U of Iowa 272 |
| Chemicals, peptides, and recombinant proteins | ||
| UNC 0638 | Tocris | Cat# 4343 |
| UNC 0642 | Tocris | Cat# 5132/10 |
| Bleomycin Sulfate | Sigma-Aldrich | Cat# B2434 |
| Naphthalene | Sigma-Aldrich | Cat# 84679-1G |
| Corn Oil | Sigma-Aldrich | Cat# C8267-500ML |
| Dispase | Corning | Cat# 354235 |
| Collagenase/Dispase | Roche | Cat# 10269638001 |
| Dnase | Sigma-Aldrich | Cat# D4527 |
| Insulin Transferrin Selenium (ITS) | Corning | Cat# 25-800-CR |
| Growth Factor Reduced Matrigel | Corning | Cat# 356231 |
| Critical commercial assays | ||
| TDE I - transposase for ATAC-seq | Illumina | Cat# 15027865 |
| NEBNext High-Fidelity 2X PCR Master Mix | New England Biolabs | Cat# M0541S |
| NEBnext Multiplex Oligos for Illumina (96 Unique Dual Index Primer Pairs) - 96 rxns | New England Biolabs | Cat# E6440S |
| Vectastain elite ABC mouse IgG | Vector Laboratories | Cat#PK-6102 |
| Deposited data | ||
| Single Cell RNA-seq data | Angelidis et al. 201932 | GEO: GSE124872 |
| ATAC-seq data | This study | GEO: GSE231366 |
| Experimental models: Organisms/strains | ||
| C57BL/6J | The Jackson Laboratory | Cat# 000664 |
| B6.Cg-Tg(CAG-DsRed∗MST)1Nagy/J (DsRed.T3) | The Jackson Laboratory | Cat# 6051 |
| B6.129X1-Gt(ROSA)26Sortm1(EYFP)Cos/J (YFP) | The Jackson Laboratory | Cat# 006148 |
| G9afl/fl | Anne Schaefer Laboratory, Mount Sinai University | N.A. |
| G9afl/fl YFP | This Study | N.A. |
| B6.129S-Sftpctm1(cre/ERT2)Blh/J (SPC-CreER) | The Jackson Laboratory | Cat# 028054 |
| SPC-CreER YFP | This Study | N.A. |
| SPC-CreER G9afl/fl YFP | This Study | N.A. |
| Software and algorithms | ||
| Image J | NIH | https://imagej.nih.gov/ij/ |
| GraphPad Prism | GraphPad Software | https://www.graphpad.com/scientific-software/prism/ |
| FlowJo |
Becton, Dickinson & Company |
https://www.flowjo.com/ |
| FASTQC | Andrews et al. 201057 | http://www.bioinformatics.babraham.ac.uk/projects/fastqc |
| Atropos | Didion et al. 201758 | https://github.com/jdidion/atropos |
| Bowtie2 | Langmead et al. 200959 | https://bowtie-bio.sourceforge.net/bowtie2/index.shtml#:~:text=Bowtie%202%20is%20an%20ultrafast,long%20(e.g.%20mammalian)%20genomes. |
| Deeptools | Ramirez et al. 201461 | https://deeptools.readthedocs.io/en/develop/ |
| Samtools | Li et al. 200962 | http://www.htslib.org/ |
| MACS2 | Zhang et al. 200863 | https://pypi.org/project/MACS2/ |
| ChIPQC | Carrol et al. 201464 | https://bioconductor.org/packages/release/bioc/html/ChIPQC.html |
| DiifBind | Stark et al. 201165 | https://bioconductor.org/packages/release/bioc/html/DiffBind.html |
| Bedtools | Qunilan et al. 201067 | https://bedtools.readthedocs.io/en/latest/ |
| ChIPseeker | Yu et al. 201568 | https://bioconductor.org/packages/release/bioc/html/ChIPseeker.html |
| GREAT | McLean et al. 201069 | http://great.stanford.edu/public/html/ |
| MEME | Bailey et al. 200970 | https://meme-suite.org/meme/ |
| Seurat | Rahul Satija Laboratory | https://satijalab.org/seurat/ |
| Other | ||
| ProLongGold Antifade Mountant with DAPI | Thermo Fisher Scientific | Cat# P36935 |
| DAPI | Sigma-Aldrich | Cat# D9542 |
| Transwell Tissue Culture plate | Corning | Cat# 3470 |
| Qubit dsDNA HS Assay Kit | Thermo Fisher Scientific | Cat# Q32851 |
| DMEM | Gibco | Cat# 11995-065 |
| DMEM/F12 | Gibco | Cat# 11330-057 |
| HEPES | Thermo Fisher Scientific | Cat# 15630-080 |
| Penicillin-Streptomycin | Gibco | Cat# 15140-122 |
| Histogel | Thermo Fisher Scientific | Cat# HG4000012 |