

Abstract
Background
There are big differences in treatments and prognosis between diabetic kidney disease (DKD) and non‐diabetic renal disease (NDRD). However, DKD patients couldn't be diagnosed early due to lack of special biomarkers. Urine is an ideal non‐invasive sample for screening DKD biomarkers. This study aims to explore DKD special biomarkers by urinary proteomics.
Materials and Methods
According to the result of renal biopsy, 142 type 2 diabetes mellitus (T2DM) patients were divided into 2 groups: DKD (n = 83) and NDRD (n = 59). Ten patients were selected from each group to define urinary protein profiles by label‐free quantitative proteomics. The candidate proteins were further verifyied by parallel reaction monitoring (PRM) methods (n = 40). Proteins which perform the same trend both in PRM and proteomics were verified by enzyme‐linked immunosorbent assays (ELISA) with expanding the sample size (n = 82). The area under the receiver operating characteristic curve (AUC) was used to evaluate the accuracy of diagnostic biomarkers.
Results
We identified 417 peptides in urinary proteins showing significant difference between DKD and NDRD. PRM verification identified C7, SERPINA4, IGHG1, SEMG2, PGLS, GGT1, CDH2, CDH1 was consistent with the proteomic results and p < 0.05. Three potential biomarkers for DKD, C7, SERPINA4, and gGT1, were verified by ELISA. The combinatied SERPINA4/Ucr and gGT1/Ucr (AUC = 0.758, p = 0.001) displayed higher diagnostic efficiency than C7/Ucr (AUC = 0.632, p = 0.048), SERPINA4/Ucr (AUC = 0.661, p = 0.032), and gGT1/Ucr (AUC = 0.661, p = 0.029) respectively.
Conclusions
The combined index SERPINA4/Ucr and gGT1/Ucr can be considered as candidate biomarkers for diabetic nephropathy after adjusting by urine creatinine.
Keywords: biomarker, nephropathy, proteomics, urinary
Short abstract
This artical aims to explore specific biomarkers of diabetic kidney disease (DKD) and non‐diabetic renal disease (NDRD) by urinary proteomics at early stage. The combined index SERPINA4/Ucr and gGT1/Ucr can be considered as non‐invasive examination candidate biomarkers for diabetic nephropathy.
1. INTRODUCTION
Diabetic kidney disease (DKD) is one of the most common microvascular complications of diabetes mellitus (DM) in 20–40% diabetes patients with DKD 1 ; furthermore, DKD is currently the major cause of chronic kidney disease (CKD) and end‐stage disease (ESRD). 2 However, some DM patients suffer from non‐diabetic renal disease (NDRD) alone or even both DKD and NDRD. 3 , 4 More than 55% of Chinese DM patients were diagnosed with CKD combined with NDRD. 5 Type 2 diabetes patients (T2DM) without diabetic retinopathy (DR) yet suffer equal risks of obtaining both DKD and NDRD. 6 Even though DKD and NDRD present similar clinical manifestations, the treatment and prognosis are different completely. The DKD has poor prognosis with lower kidney survival rate and about 14 times incidence of ESRD than NDRD. 7 , 8 , 9 , 10
However, the differential diagnosis of diabetic mellitus (DM) with diabetic kidney disease (DKD) and non‐diabetic renal disease (NDRD) remains challenging. Renal biopsy remains the “gold standard,” but it has up to 13% complications such as infection and bleeding, and even 6–7% patients require blood transfusion or surgical intervention after renal biopsy 11 ; furthermore, the evaluation process of the pathological examination of renal biopsy can be biased by different people. 12 Meanwhile, kidney biopsy has strict indications and contraindications 13 and is not appropriate for all patients. Exploring a noninvasive procedure that can supplement or replace renal puncture is critical for clinic application. Micro‐albuminuria (MA) already plays a noninvasive biomarker in DKD diagnosis, but it still shows poor specificity and high false‐positive rate in clinical practice 14 , 15 , 16 , 17 ; Other clinical indicators, such as diabetes duration, diabetic retinopathy, and glycated hemoglobin, are valuable in diagnosing DKD, 18 however, there is a risk for missing diagnosis or misdiagnosis. Lin reported that NDRD in T2DM patients could not be ruled out in patients with DM duration >10 years with retinopathy. 19 Thus, accuracy of diagnosing DKD requires the identification of novel noninvasive, sensitive, and specific biomarkers.
In this study, proteomics was used to identify differential proteins in the urine between DKD and NDKD, and differential biomarkers were identified by ELISA.
2. MATERIALS AND METHODS
2.1. Subjects
142 T2DM patients were recruited in this study, patients' ages ranging from 18 and 70 years from Department of Nephrology of the First Affiliated Hospital of Kunming Medical University, the First People's Hospital of Yunnan Province and Yan'an Hospital in Kunming from December 1, 2021 to July 1, 2022. Inclusion criteria: ① patients with type 2 diabetes; ② patients with clear pathological diagnosis by kidney biopsy surgery; Exclusion criteria: ① patients with type 1 diabetes, gestational diabetes, or any other special types of diabetes; ② patients with malignant tumors or other apparent disorders; ③ patients presenting with stressful conditions such as infection, fever and surgery at 24 h; ④ patients suffering from urinary tract infections.
All participants were informed for inclusion (Approval No: 2021L54). Subjects were divided into two groups as pathological diagnosis: type 2 DM with DKD (DKD‐DM, n = 83) and type 2 DM with NDKD (NDRD‐DM, n = 59). The average age was 53.1 years old, with 88 males and 54 females. The clinical data with statistical differences is shown in Table 1.
TABLE 1.
Clinical data of subjects (n = 142).
| DKD‐DM (n = 88) | NDRD‐DM (n = 54) | p | |
|---|---|---|---|
| CKD stage ≥3 (n, %) | 51 (57.7%) | 17 (31.7%) | 0.013 |
| Duration of diabetes (year) | 8.5 (4.1, 14.0) | 5.0 (2.0, 10.0) | 0.022 |
| DR (n, %) | 17 (19.2%) | 1 (2.4%) | 0.03 |
| Hb (g/L) | 121.31 ± 25.77 | 134.88 ± 26.09 | 0.014 |
| Urea (mmol/L) | 7.63 (6.30, 11.08) | 6.20 (5.05, 9.30) | 0.041 |
| Cr (μmol/L) | 131.5 (96.3225.8) | 84.9 (64.5116.8) | 0.000 |
| HbA1c (%) | 8.21 (6.85, 10.32) | 7.01 (6.35, 8.42) | 0.021 |
| UTP (g/L) | 2.78 (1.76, 4.25) | 1.75 (0.36, 4.17) | 0.033 |
Abbreviations: CKD, Chronic kidney disease; Cr, Creatinine; DR, Diabetic retinopathy; Hb, Hemoglobin; HbA1c, Glycated hemoglobin; UTP, Urine total protein.
The study was developed and conducted in compliance with the ethical principles outlined in the Declaration of Helsinki, and this study protocol was reviewed and approved by the Ethics Committee of the First Affiliated Hospital of Kunming Medical University, approval number: 2021L54. All have obtained informed consent from the participants.
2.2. Urine collection
Fresh morning midstream urine (10 mL) was collected before renal biopsy operation and centrifuged at 1000 g for 20 min at 4°C and frozen at −70°C for using.
2.3. Label‐free quantitative proteomics
2.3.1. Protein extraction, quantification, and electrophoresis
Ten samples from each group were selected as potential proteomics candidates. 2.5 mL sample was concentrated to 2 mL by ultrafiltration, added equal volumes of methanol and 1/4 volume of chloroform, centrifuged at 12,000 g for 15 min, the supernatant was then discarded repeated twice, and 50 μL of lysis solution (containing 1% SDC) was added to re‐solubilize the samples. The BCA kit was used by Bradford method. Equal amounts of protein were taken from each sample according to protein concentration for SDS‐PAGE gel electrophoresis cutting strips and adding decolorization solution until decolorization was completed to detect the integrity of urine protein and to determine whether the sample was degraded. Combining the results of protein concentration measurement and SDS‐PAGE electrophoresis, 10 samples were chosen for proteomic analysis from each group.
2.3.2. LC–MS/MS
An equal amount of protein (80 μg) will be subjected to finish enzymatic digestion, and LC–MS/MS analysis was performed at the Jingjie PTM Biolab Co., Ltd (Hangzhou, Zhejiang, China).
2.4. Parallel reaction monitoring (PRM) verification
Twenty samples from each group were selected for validation using PRM matching analysis. Proteomics analysis was conducted and analyzed by Jingjie PTM Biolab Co., Ltd (Hangzhou, Zhejiang, China).
2.5. ELISA
Eighty two samples were used for validation C7 (53 with DKD, 29 with NDRD), 66 patients were used for validation SERPINA4 (43 with DKD, 23 with NDRD), 72 patients were used for validation gGT1 (49 with DKD, 23 with NDRD). Urinary protein candidates were quantitatively verified using ELISA. The target protein was measured using the human Complement component 7(C7), Kallistatin (SERPINA4), and γ‐Glutamyl Transferase 1 (gGT1) ELISA kit purchased from USCN Life Sciences InC., (Wuhan, China). All assays were performed following the manufacturer's instructions. Briefly, 100 μL/well of urine samples or standards was added to microtiter plates coated with the specific protein; then, the biotin‐conjugated antibodies specific to a protein candidate were added as secondary antibodies for detection. Optical density (OD) was measured by the enzyme‐labeled instrument (MultiSkan FC, Thermo Fisher Scientific K.K., Shanghai, China) with a 540‐nm wavelength, and the concentration of protein candidates in the samples was calculated based on the standard curve. Urine creatinine was used to correct the target protein quantification results and calculate the target protein/urine creatinine ratio in 10−3 mg/g to compare the two groups.
2.6. Statistical analysis
The spss20.0 software was applied for statistical analysis. Data are presented as the median with the interquartile range. Mann–Whitney U tests were used to compare median values of continuous variables between two groups and p values less than 0.05 (two‐sided) were considered significant. Differential protein abundance was tested by t‐test with p < 0.05 and differential ploidy up or down by 1.5‐fold as differential protein. The screened differential proteins were annotated by annotation information from UniProt using Gene Ontology (http://www.ebi.ac.uk/GOA/), enrichment analysis of differential protein metabolic pathways using the Kyoto Encyclopedia of Genes and Genomes (KEGG). Receiver operating characteristic (ROC) curve analysis was applied to assess the predictive accuracy, and the area under the curve (AUC) was used to assess the discriminatory ability of the differential proteins.
3. RESULTS
3.1. Screening differential proteins by label‐free quantitative proteomics
A total of 1,680,033 spectra and 1945 proteins were acquired. 187 proteins increased by more than 1.5‐fold, and 230 proteins decreased to less than 0.66‐fold in DKD‐DM patients (p ≤ 0.05). The volcano map and clustering heat map of the differential proteins are shown in Figure 1. Based on proteomic data, the following screening strategy was used to identify DKD diagnostic urine markers: first, searching for proteins having a two‐fold or higher difference between groups (Ratio > 2.0 or Ratio < 0.5, p < 0.05). Second, using the Altas database to search for differential proteins specifically expressed in the kidney. Third, reviewing the literature and researching proteins that have been correlated with the development of DM or DKD. Fourth, screening for differential proteins involved in important KEGG signaling pathways. 35 proteins screened are shown in Tables 2 and 3.
FIGURE 1.
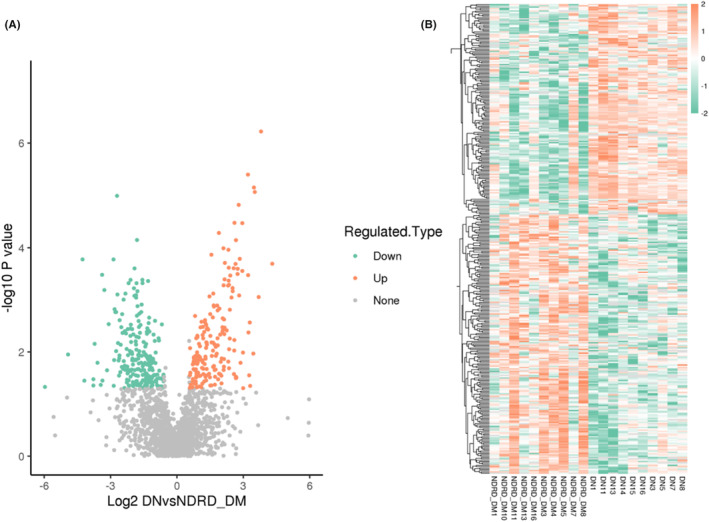
Volcano plots (A) and clustering heat map (B) of differential proteins.
TABLE 2.
Candidate markers for DKD.
| Protein accession | Gene name | DKD/NDR D‐DM ratio | DKD/NDRD‐D M p value | Regulated type |
|---|---|---|---|---|
| Q9UHR4 | BAIAP2L1 | 113.56 | 0.01 | Up |
| P05546 | SERPIND1 | 6.20 | 0.00 | Up |
| P01023 | A2M | 5.72 | 0.00 | Up |
| P29622 | SERPINA4 | 4.24 | 0.00 | Up |
| P27169 | PON1 | 4.16 | 0.00 | Up |
| P01024 | C3 | 3.92 | 0.00 | Up |
| Q9UGM5 | FETUB | 3.66 | 0.00 | Up |
| P80108 | GPLD1 | 3.59 | 0.00 | Up |
| Q02383 | SEMG2 | 3.37 | 0.02 | Up |
| P01034 | CST3 | 3.36 | 0.01 | Up |
| P18827 | SDC1 | 3.30 | 0.02 | Up |
| F6RFD5 | DSTN | 3.03 | 0.00 | Up |
| Q9Y561 | LRP12 | 3.00 | 0.01 | Up |
| P19021 | PAM | 2.70 | 0.03 | Up |
| P01782 | IGHV3‐9 | 2.49 | 0.00 | Up |
| B4E127 | TDG | 2.46 | 0.04 | Up |
| H7BYY1 | TPM1 | 2.33 | 0.00 | Up |
| A6NDG6 | PGP | 2.31 | 0.05 | Up |
| P09211 | GSTP1 | 2.08 | 0.01 | Up |
| A0A0B4J1V1 | IGHV3‐21 | 2.05 | 0.01 | Up |
| O95336 | PGLS | 0.30 | 0.01 | Down |
| P58546 | MTPN | 0.27 | 0.02 | Down |
| P02452 | COL1A1 | 0.25 | 0.01 | Down |
TABLE 3.
Signaling proteins.
| Protein accession | Gene name | KEGG KO no. | KEGG pathway | Fold enrichment |
|---|---|---|---|---|
| O14791 | APOL1 | K23585 | map05143 African trypanosomiasis | 2.53 |
| P08603 | CFH | K04004 | map04610 Complement and coagulation cascades | 3.06 |
| map05150 Staphylococcus aureus infection | 2.13 | |||
| P04003 | C4BPA | K04002 | map04610 Complement and coagulation cascades | 3.06 |
| map05133 Pertussis | 2.22 | |||
| P10643 | C7 | K03996 | map04610 Complement and coagulation cascades | 3.06 |
| map05020 Prion diseases | 2.04 | |||
| map05322 Systemic lupus erythematosus | 2.53 | |||
| P10909 | CLU | K17252 | map04610 Complement and coagulation cascades | 3.06 |
| A0A087WXI5 | CDH1 | K05689 | map04514 Cell adhesion molecules (CAMs) | 1.19 |
| map05216 Thyroid cancer | 2.25 | |||
| map05219 Bladder cancer | 1.57 | |||
| P19022 | CDH2 | K06736 | map04514 Cell adhesion molecules (CAMs) | 1.19 |
| Q99519 | NEU1 | K01186 | map00511 Other glycan degradation | 1.43 |
| map00600 Sphingolipid metabolism | 1.75 | |||
| map04142 Lysosome | 1.57 | |||
| P17900 | GM2A | K12383 | map04142 Lysosome | 1.57 |
| P19440 | GGT1 | K18592 | map00480 Glutathione metabolism | 1.31 |
| map00590 Arachidonic acid metabolism | 1.43 | |||
| P01008 | SERPINC1 | K03911 | map04610 Complement and coagulation cascades | 3.06 |
| P01857 | IGHG1 | K06856 | map04020 Calcium signaling pathway | 2.10 |
3.2. PRM verification
PRM verification of 35 proteins screened by proteomics, 15 proteins were exclude with low protein sequence coverage, low protein signal intensity, few specific peptides, a high percentage of M peptides, and severe peptide miss‐cutting. 20 proteins were verified by PRM validation. Results are shown in Table 4. Results for Glycosylphosphatidy‐linositol‐specific Phospholipase D1 (GPLD1), Paraoxonase‐1 (PON1), Clusterin (CLU), Apolipoprotein L1 (APOL1), Alpha2‐macroglobulin (A2M), Complement component 4 binding protein A (C4BPA) were inconsistent with the proteomics; Complement component 7(C7), Serpin family A member 4 (SERPINA4), Immunoglobulin γ‐1 heavy chain constant region (IGHG1), Semenogelin 2 (SEMG2), 6‐Phosphogluconolactonase(PGLS), Gamma‐glutamyl transferase 1 (GGT1), Cadherin‐2 (CDH2), Cadherin‐1(CDH1) were consistent with the proteomic results and p < 0.05, which may present potential diagnostic efficacy for DKD. C7 and SERPINA4 exhibited differential between DKD‐DM and NDRD‐DM (C7: Ratio = 4.44, p = 0.01; SERPINA4: Ratio = 2.46, p = 0.02), and the expression of their peptides was considerably higher in the DKD group than in the NDRD group in the secondary spectrum (shown in Figure 2a,b). gGT1 was one of the proteins which expression was downregulated, and samples from the DKD group had significantly lower expression levels than those from the NDRD DM (shown in Figure 2c).
TABLE 4.
Comparison of PRM results with proteomics results.
| Protein Accession | Gene name | Peptide | PRM | Proteomic | Consistency |
|---|---|---|---|---|---|
| DN/NDRD Ratio | DN/NDRD Ratio | ||||
| P10643 | C7* | AASGTQNNVLR | 4.44 | 5.42 | Yes |
| GGGAGFISGLSYLELDNPAGNK | |||||
| P80748 | IGLV3‐21 | FSGSNSGNTATLTISR | 2.54 | 1.74 | Yes |
| P29622 | SERPINA4* | FYYLIASETPGK | 2.46 | 4.24 | Yes |
| FFSAQTNR | |||||
| P05546 | SERPIND1 | SVNDLYIQK | 1.83 | 6.20 | Yes |
| TLEAQLTPR | |||||
| P01857 | IGHG1* | GPSVFPLAPSSK | 1.76 | 1.88 | Yes |
| EPQVYTLPPSR | |||||
| P08603 | CFH | SPDVINGSPISQK | 1.52 | 3.56 | Yes |
| SSIDIENGFISESQYTYALK | |||||
| Q02383 | SEMG2* | DIFTTQDELLVYNK | 1.42 | 3.37 | Yes |
| P01008 | SERPINC1 | FATTFYQHLADSK | 1.31 | 2.14 | Yes |
| VAEGTQVLELPFK | |||||
| P80108 | GPLD1 | IADVTSGLIGGEDGR | 0.80 | 3.59 | No |
| AQYVLISPEASSR | |||||
| P27169 | PON1 | VVAEGFDFANGINISPDGK | 0.77 | 4.16 | No |
| IFFYDSENPPASEVLR | |||||
| P10909 | CLU | VTTVASHTSDSDVPSGVTEVVVK | 0.73 | 2.07 | No |
| LFDSDPITVTVPVEVSR | |||||
| P17900 | GM2A | EVAGLWIK | 0.48 | 0.28 | Yes |
| SEFVVPDLELPSWLTTGNYR | |||||
| O95336 | PGLS* | ELPAAVAPAGPASLAR | 0.41 | 0.29 | Yes |
| LLTVPFEK | |||||
| Q99519 | NEU1 | IPLITATPR | 0.41 | 0.28 | Yes |
| GTLLAFAEAR | |||||
| O14791 | APOL1 | ANLQSVPHASASR | 0.38 | 6.25 | No |
| LNILNNNYK | |||||
| P01023 | A2M | IAQWQSFQLEGGLK | 0.38 | 5.72 | No |
| AAQVTIQSSGTFSSK | |||||
| P19440 | GGT1* | GGLSVAVPGEIR | 0.22 | 0.24 | Yes |
| FVDVTEVVR | |||||
| P04003 | C4BPA | EDVYVVGTVLR | 0.21 | 11.15 | No |
| LNNGEITQHR | |||||
| P19022 | CDH2* | GPFPQELVR | 0.13 | 0.29 | Yes |
| A0A087WXI5 | CDH1* | GQVPENEANVVITTLK | 0.12 | 0.27 | Yes |
| DTANWLEINPDTGAISTR |
Represents p‐value < 0.05.
FIGURE 2.

The secondary spectrum of PRM validated proteins. C7 specific peptides AASGTQNNVLR and GGGAGFISGLSYLELDNPAGNK (A), SERPINA4 specific peptides FFSAQTNR and FYYLIASETPGK (B), gGT1 specific peptide GGLSVAVPGEIR and FVDVTEVVR (C). The horizontal axis is the sample number, the vertical axis is the secondary spectrum b.y ion peak area, different colors represent different b.y ions and correspond to the top left corner of the graph, the column area represents the number of target peptides in the sample, it is considered that the results are credible if skyline caliper dot p value >0.8.
3.3. Potential protein markers verified by ELISA
Three protein candidates were selected for validation by ELISA. Results have shown that C7 (3.632 vs. 1.389 ng/mL) and SERPINA4 (689.216 vs. 412.440 ng/mL) were statistically upregulated in the DKD‐DM, whereas gGT1 (25.125 vs. 58.296 ng/mL) was statistically downregulated in the DKD‐DM, (p < 0.05) (shown in Figure 3a). After adjusting by urine creatinine (UCr), C7/UCr (4.390 × 10⁻³ vs. 2.225 × 10⁻³ mg/g, p = 0.048) and SERPINA4/UCr (826.282 × 10⁻³ vs. 587.694 × 10⁻³ mg/g, p = 0. 032), gGT1/UCr Ratio(40.156 × 10⁻³ vs. 50.979 × 10⁻³ mg/g, p = 0.028), there was still a statistically significant difference between two groups (shown in Figure 3b). ROC analysis identified C7/UCr (AUC = 0.632, p = 0.048), SERPINA4/UCr (AUC = 0.661, p = 0.032), and gGT1/UCr (AUC = 0.661, p = 0.029). The combination analysis of SERPINA4/UCr and gGT1/UCr (AUC = 0.758, p = 0.000) had a significant diagnosis value for DKD (shown in Figure 4).
FIGURE 3.

Comparison of the results of the 3 protein markers (A) and corrected for creatinine (B) in the DKD and NDRD groups. ** represents p < 0.01, * represents p < 0.05.
FIGURE 4.
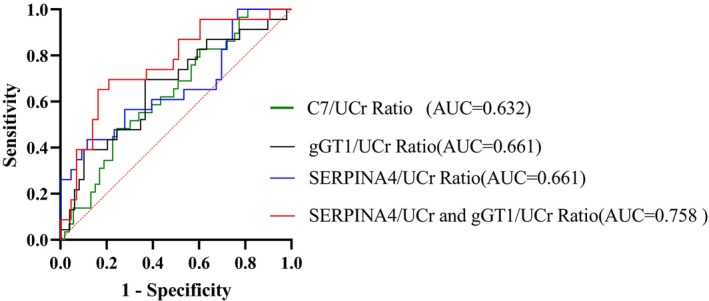
ROC curve analysis for the specificity and sensitivity of C7/UCr Ratio and ERPINA4/UCr Ratio, gGT1/UCr Ratio alone, and their combination in the diagnosis of DKD‐DM.
4. DISCUSSION
In this study, we identified three potential novel diagnostic markers, C7, SERPINA4 and gGT1, for DKD using urinary proteomics. Those proteins normalized by urinary creatinine had a significant diagnostic value for DKD, and combined SERPINA4/Ucr with gGT1/Ucr analyzed by ROC had improved diagnostic value than single biomarker.
C7 is a key component of the complement‐activated terminal pathway. The protein initiates the formation of the membrane attack complex (MAC) by binding to the C5b‐C6 subcomplex and inserts into the phospholipid bilayer shows as a membrane anchor. An increasing body of evidence have pointed the role of the complement system in the pathogenesis of DKD, 20 MAC deposition might contribute to renal injury in the hyperglycaemic mileu. 21 C7 expresses in endothelial cells as a trap for assembling MAC, thus MAC production increases C7 expression. 22 Sircar et al. 23 showed increased expression of C7 and its gene production in the early DKD, with C7 being released into the circulatory system, manifesting itself as high levels of C7 in the blood. Guo et al. 24 has found that C7 might represent a novel biomarker (AUC = 0.865) that is specifically expressed in mesangial (MES) cells in DKD that can be useful for diagnosis. In this study, C7 levels were higher in the DKD compared to the NDRD group based on proteomic screening and validation by ELISA (p < 0.05); therefore, C7 may serve as a molecular target for the diagnosis of DKD.
SERPINA4, also known as Kallistatin (KS), is an inhibitor of tissue kallikrein and also inhibits the Wnt signaling pathway. Kallistatin mainly expressed in liver and broadly expressed in other tissues, such as the eye, kidney, heart, and blood vessels. 25 Studies show that the KKS system plays interesting roles in DKD. On the one hand, kallistatin protects renal function althrong anti‐fibrotic, anti‐oxidation, and anti‐inflammatory activities at the cellular level. 26 , 27 However, overexpression of kallistatin may promote diabetes‐induced renal inflammation, oxidative stress, and fibrosis by inhibiting renal tissue kinase activity and interfering with the balance between KKS and RAS. 28 Furthermore, the beneficial effects of KKS in the kidney might be counteracted by its chronic hypoxia. Transient overexpression of kallistatin using ultrasound‐microbubble‐mediated gene transfer has recently been found to protect against DKD in db/db mice. 29 In contrast to this finding, a study by Yang et al. has showed that although kallistatin has anti‐fibrosis, anti‐oxidant, and ant‐inflammation activities at the cellular level, the kallistatin expression promotes diabetes‐induced renal inflammation, oxidative stress, and fibrosis by inhibiting renal tissue kinase activity and disturbing the balance between KKS and RAS, and that its beneficial effects in the kidney may be counteracted by its induction of chronic hypoxia. 30 Serum kallistatin levels were elevated in DKD patients and positively correlated with the albumin‐to‐creatinine ratio (ACR), which suggests that kallistatin might become a potential biomarker for DKD. In this study, DKD was associated with higher Kallistatin levels (p < 0.05) and the ROC curves also confirmed their diagnostic values. However, there is a lack of evidence on the mechanism of KSS system in non‐diabetic nephropathy.
Gamma‐glutamyl transpeptidase 1 (gGT1) is an N‐glycosylated membrane protein that catabolizes glutathione and other gamma‐glutamyl‐containing substrates and is a crucial enzyme in the gamma‐glutamyl cycle pathway. DKD is a complicated illness with several pathogenic molecular mechanisms, and studies have shown that tubule injury contributes in a primary way, rather than in a secondary manner, to the development in the early DKD. 31 , 32 , 33 GGT is mainly located at proximal tubule and Henle loop 34 and is a highly sensitive marker of renal tubular damage, 35 and increased urinary excretion reflects damage of the brush border membrane with loss of the microvillous structure. 36 , 37 Lee et al. demonstrated that serum GGT within the physiological range predicted microalbuminuria in individuals with hypertension or diabetes and was a potential predictor of microvascular and/or renal problems. De Carvalho et al 38 reported that urinary GGT and Alkaline phosphatase (ALP) values were three times higher in T2DM patients with nephropathy compared to controls, and there was a significant correlation with urinary albumin, with an AUC of 0.7696 (p = 0.001) for GGT and a sensitivity of 96.0% and specificity of 52.6% at a threshold value of 72 U/g creatinine. 39 There is a paucity of research on whether gGT1 differs between DKD and NDRD patients and its diagnostic value. In this study, gGT1 was the down‐regulated protein in the DKD group and remained statistically different by expression verification and creatinine‐corrected differences.
However, there are some limitations in this study. First, sample sizes were relatively small in this study. Different trends in PRM validation and proteomic changes of some proteins may be related to inconsistent CKD staging, so some potentially valuable proteins may be excluded. Second, markers screened in this study were not further investigated to reveal the mechanism of protein up‐ or down‐regulation. The pathological changes in DKD involve multiple pathological processes and discrepancies among results are likely influenced by heterogeneity of patient samples and methodological differences.
In conclusion, we have screened three proteins, C7, SERPINA4, and gGT1, as potential biomarkers for DKD through proteomics analysis and validation of differential protein expression by ELISA. The combined index SERPINA4/Ucr and gGT1/Ucr can be considered as candidate biomarkers for diabetic nephropathy after adjusting by urine creatinine. This study provided a basis for further research noninvasive diagnosis of DKD.
AUTHOR CONTRIBUTIONS
X. Huang, J. Liu, and X. Yang collected samples. J. Liu performed the ELISA validation experiments. X. Huang wrote the manuscript. H. Zhang analyzed the data. Z. Liu designed, supervised, and revised the manuscript.
FUNDING INFORMATION
This work was supported by the National Science Foundation of China Grants [Grant number 40121066].
This work was also supported by the Joint Program of Yunnan Provincial Scienceand Technology Department and Kunming Medical University [Grant numbers 201901C070035].
CONFLICT OF INTEREST STATEMENT
The authors declare that they have no known competing financial interests or personal relationships that could have appeared to influence the work reported in this paper.
Huang X, Zhang H, Liu J, Yang X, Liu Z. Screening candidate diagnostic biomarkers for diabetic kidney disease. J Clin Lab Anal. 2024;38:e25000. doi: 10.1002/jcla.25000
Xinying Huang and Hui Zhang contributed to the work equally and should be regarded as co‐first authors.
DATA AVAILABILITY STATEMENT
All data generated or analyzed during this study are included in this article and its supplementary material files. Further enquiries can be directed to the corresponding author.
REFERENCES
- 1. Feng Q, Li Y, Yang Y, Feng J. Urine metabolomics analysis in patients with normoalbuminuric diabetic kidney disease. Front Physiol. 2020;11:578799. [DOI] [PMC free article] [PubMed] [Google Scholar]
- 2. Lu Y, Liu D, Feng Q, Liu Z. Diabetic nephropathy: perspective on extracellular vesicles. Front Immunol. 2020;11:943. [DOI] [PMC free article] [PubMed] [Google Scholar]
- 3. Kuo IC, Lee JJ, Hwang DY, et al. Pyuria, urinary tract infection and renal outcome in patients with chronic kidney disease stage 3‐5. Sci Rep. 2020;10(1):19460. [DOI] [PMC free article] [PubMed] [Google Scholar]
- 4. Zhang W, Liu X, Dong Z, et al. New diagnostic model for the differentiation of diabetic nephropathy from non‐diabetic nephropathy in Chinese patients. Front Endocrinol. 2022;13:913021. [DOI] [PMC free article] [PubMed] [Google Scholar]
- 5. Liu D, Huang T, Chen N, et al. The modern spectrum of biopsy‐proven renal disease in Chinese diabetic patients‐a retrospective descriptive study. PeerJ. 2018;6:e4522. [DOI] [PMC free article] [PubMed] [Google Scholar]
- 6. Freeman NS, Canetta PA, Bomback AS. Glomerular diseases in patients with diabetes mellitus: an underappreciated epidemic. Kidney360. 2020;1(3):220‐222. [DOI] [PMC free article] [PubMed] [Google Scholar]
- 7. Byun JM, Lee CH, Lee SR, et al. Renal outcomes and clinical course of nondiabetic renal diseases in patients with type 2 diabetes. Korean J Intern Med. 2013;28(5):565‐572. [DOI] [PMC free article] [PubMed] [Google Scholar]
- 8. Fioretto P, Barzon I, Mauer M. Is diabetic nephropathy reversible? Diabetes Res Clin Pract. 2014;104(3):323‐328. [DOI] [PubMed] [Google Scholar]
- 9. Samsu N. Diabetic nephropathy: challenges in pathogenesis, diagnosis, and treatment. Biomed Res Int. 2021;2021:1497449. [DOI] [PMC free article] [PubMed] [Google Scholar]
- 10. Bermejo S, González E, López‐Revuelta K, et al. Risk factors for non‐diabetic renal disease in diabetic patients. Clin Kidney J. 2020;13(3):380‐388. [DOI] [PMC free article] [PubMed] [Google Scholar]
- 11. Lefaucheur C, Nochy D, Bariety J. Renal biopsy: procedures, contraindications, complications. Nephrol Therap. 2009;5(4):331‐339. [DOI] [PubMed] [Google Scholar]
- 12. Mischak H. Pro: urine proteomics as a liquid kidney biopsy: no more kidney punctures! Nephrol Dialysis Transplant. 2015;30(4):532‐537. [DOI] [PubMed] [Google Scholar]
- 13. Bandari J, Fuller TW, Turner Іі RM, D'Agostino LA. Renal biopsy for medical renal disease: indications and contraindications. Can J Urol. 2016;23(1):8121‐8126. [PubMed] [Google Scholar]
- 14. Ceccarelli Ceccarelli D, Paleari R, Solerte B, Mosca A. Re‐thinking diabetic nephropathy: microalbuminuria is just a piece of the diagnostic puzzle. Clin Chim Acta. 2022;524:146‐153. [DOI] [PubMed] [Google Scholar]
- 15. MacIsaac RJ, Ekinci EI, Jerums G. Progressive diabetic nephropathy. How useful is microalbuminuria?: contra. Kidney Int. 2014;86(1):50‐57. [DOI] [PubMed] [Google Scholar]
- 16. Thethi TK, Batuman V. Challenging the conventional wisdom on diabetic nephropathy: is microalbuminuria the earliest event? J Diabetes Complicat. 2019;33(3):191‐192. [DOI] [PubMed] [Google Scholar]
- 17. Koziolek M, Mueller GA, Dihazi GH, et al. Urine E‐cadherin: a marker for early detection of kidney injury in diabetic patients. J Clin Med. 2020;9(3):639. [DOI] [PMC free article] [PubMed] [Google Scholar]
- 18. Sharma M, Parry MA, Jeelani H, Mahanta PJ, Doley PK, Pegu G. Prevalence of nondiabetic renal disease in patients with type 2 diabetes mellitus with clinicopathological correlation: a study from a tertiary Care Center of Assam, India. Saudi J Kidney Dis Transplant. 2020;31(4):831‐839. [DOI] [PubMed] [Google Scholar]
- 19. Lin YL, Peng SJ, Ferng SH, Tzen CY, Yang CS. Clinical indicators which necessitate renal biopsy in type 2 diabetes mellitus patients with renal disease. Int J Clin Pract. 2009;63(8):1167‐1176. [DOI] [PubMed] [Google Scholar]
- 20. Flyvbjerg A. The role of the complement system in diabetic nephropathy. Nat Rev Nephrol. 2017;13(5):311‐318. [DOI] [PubMed] [Google Scholar]
- 21. Koopman JJE, van Essen MF, Rennke HG, de Vries APJ, van Kooten C. Deposition of the membrane attack complex in healthy and diseased human kidneys. Front Immunol. 2020;11:599974. [DOI] [PMC free article] [PubMed] [Google Scholar]
- 22. Fearn A, Sheerin NS. Complement activation in progressive renal disease. World J Nephrol. 2015;4(1):31‐40. [DOI] [PMC free article] [PubMed] [Google Scholar]
- 23. Sircar M, Rosales IA, Selig MK, et al. Complement 7 is up‐regulated in human early diabetic kidney disease. Am J Pathol. 2018;188(10):2147‐2154. [DOI] [PMC free article] [PubMed] [Google Scholar]
- 24. Guo H, Yan Z, Hu Y, Huang X, Pan C. Complement C7 is specifically expressed in mesangial cells and is a potential diagnostic biomarker for diabetic nephropathy and is regulated by miR‐494‐3p and miR‐574‐5p. Diab Metabol Synd Obes. 2021;14:3077‐3088. [DOI] [PMC free article] [PubMed] [Google Scholar]
- 25. Ma L, Wu J, Zheng Y, et al. Heparin blocks the inhibition of tissue kallikrein 1 by Kallistatin through electrostatic repulsion. Biomol Ther. 2020;10(6):828. [DOI] [PMC free article] [PubMed] [Google Scholar]
- 26. Tomita H, Sanford RB, Smithies O, Kakoki M. The kallikrein‐kinin system in diabetic nephropathy. Kidney Int. 2012;81(8):733‐744. [DOI] [PMC free article] [PubMed] [Google Scholar]
- 27. Lai KN, Leung JCK, Tang SCW. The renin‐angiotensin system. Contrib Nephrol. 2011;170:135‐144. [DOI] [PubMed] [Google Scholar]
- 28. Feng Q, Liu D, Lu Y, Liu Z. The interplay of renin‐angiotensin system and toll‐like receptor 4 in the inflammation of diabetic nephropathy. J Immunol Res. 2020;2020:6193407. [DOI] [PMC free article] [PubMed] [Google Scholar]
- 29. Yiu WH, Wong DW, Wu HJ, et al. Kallistatin protects against diabetic nephropathy in db/db mice by suppressing AGE‐RAGE‐induced oxidative stress. Kidney Int. 2016;89(2):386‐398. [DOI] [PubMed] [Google Scholar]
- 30. Yang Y, He X, Cheng R, et al. Diabetes‐induced upregulation of kallistatin levels exacerbates diabetic nephropathy via RAS activation. FASEB J. 2020;34(6):8428‐8441. [DOI] [PMC free article] [PubMed] [Google Scholar]
- 31. Satirapoj B, Nast CC, Adler SG. Novel insights into the relationship between glomerular pathology and progressive kidney disease. Adv Chronic Kidney Dis. 2012;19(2):93‐100. [DOI] [PubMed] [Google Scholar]
- 32. Magri CJ, Fava S. The role of tubular injury in diabetic nephropathy. Eur J Intern Med. 2009;20(6):551‐555. [DOI] [PubMed] [Google Scholar]
- 33. Satirapoj B. Tubulointerstitial biomarkers for diabetic nephropathy. J Diabetes Res. 2018;2018:2852398. [DOI] [PMC free article] [PubMed] [Google Scholar]
- 34. da Silva Melo DA, Saciura VC, Poloni JA, et al. Evaluation of renal enzymuria and cellular excretion as an marker of acute nephrotoxicity due to an overdose of paracetamol in Wistar rats. Clin Chim Acta. 2006;373(1–2):88‐91. [DOI] [PubMed] [Google Scholar]
- 35. Matheson A, Willcox MD, Flanagan J, Walsh BJ. Urinary biomarkers involved in type 2 diabetes: a review. Diabetes Metab Res Rev. 2010;26(3):150‐171. [DOI] [PubMed] [Google Scholar]
- 36. Westhuyzen J, Endre ZH, Reece G, Reith DM, Saltissi D, Morgan TJ. Measurement of tubular enzymuria facilitates early detection of acute renal impairment in the intensive care unit. Nephrol Dialysis Transplant. 2003;18(3):543‐551. [DOI] [PubMed] [Google Scholar]
- 37. Priolo C, Khabibullin D, Reznik E, et al. Impairment of gamma‐glutamyl transferase 1 activity in the metabolic pathogenesis of chromophobe renal cell carcinoma. Proc Natl Acad Sci U S A. 2018;115(27):E6274‐e82. [DOI] [PMC free article] [PubMed] [Google Scholar]
- 38. Lee DH, Jacobs DR Jr, Gross M, Steffes M. Serum gamma‐glutamyltransferase was differently associated with microalbuminuria by status of hypertension or diabetes: the coronary artery risk development in young adults (CARDIA) study. Clin Chem. 2005;51(7):1185‐1191. [DOI] [PubMed] [Google Scholar]
- 39. De Carvalho JA, Piva SJ, Hausen BS, et al. Assessment of urinary γ‐glutamyltransferase and alkaline phosphatase for diagnosis of diabetic nephropathy. Clin Chim Acta. 2011;412(15–16):1407‐1411. [DOI] [PubMed] [Google Scholar]
Associated Data
This section collects any data citations, data availability statements, or supplementary materials included in this article.
Data Availability Statement
All data generated or analyzed during this study are included in this article and its supplementary material files. Further enquiries can be directed to the corresponding author.