

Abstract
Background
Point‐of‐care tests (POCTs) may have a role in detecting undiagnosed cases of Celiac disease (CD). We assessed the diagnostic accuracy of a novel POCT, compared with the conventional serological methods, for simultaneous anti‐transglutaminase (tTG) IgA and anti‐deamidated gliadin (DGP) IgG antibody detection. Furthermore, we evaluated the effect of different biological matrices (whole blood and serum) on test performance.
Methods
Serum and whole blood from celiac or suspected celiac patients who underwent duodenal biopsy were assayed for the presence of anti‐tTG IgA and anti‐DGP IgG both with the reference standard methods (Thermo Fisher Scientific, Uppsala, Sweden) and with the POCT (PRIMA Lab SA, Balerna, Switzerland).
Results
266 sera (101 negative and 165 positive) and 60 whole blood samples (34 positive and 26 negative) were included in the study. POCT for anti‐DGP IgG showed a sensitivity of 84.3% and a specificity of 90.1%, with positive (PPV) and negative predictive values (NPV) of 91.07% and 82.73%. POCT for anti‐tTG IgA showed a sensitivity of 98.31% and a specificity of 98.02%, with a PPV and NPV of 98.31% and 98.02%. Test accuracies were 86.94% and 98.17%, respectively. The agreement of the results between the two different matrices showed a strong correlation rate: 95% for anti‐DGP IgG and 100% for anti‐tTG IgA.
Conclusion
The anti‐tTG IgA/anti‐DGP IgG‐based POCT showed good diagnostic accuracy with comparable sensitivities and specificities to reference standard methods in detecting CD in symptomatic patients and could be considered as a mass screening test before referring to conventional serology.
Keywords: anti‐deamidated gliadin antibodies, anti‐transglutaminase antibodies, case‐finding test, celiac disease, early diagnosis, lateral‐flow immunochromatography assays, point‐of‐care testing, screening test
Anti‐tTG IgA/anti‐DGP IgG‐based Point‐of‐care test (POCT) on the diagnosis of Celiac disease (CD).

1. INTRODUCTION
Celiac disease (CD) is a chronic small intestinal T‐cell‐mediated enteropathy triggered by the ingestion of gluten (the major protein component of wheat, rye and barley) in genetically predisposed individuals. 1 , 2 Although in the past, CD in Europe was considered to be only a rare pediatric disease, in the last decades, thanks to the development of specific diagnostic serologic tests, an increment of its global prevalence was observed, making it one of the most common permanent disorders affecting people of all ages worldwide. The real prevalence of this disease actually ranges from 0.5% to 2%, with an average of around 1% in the general population and remarkable differences between countries. 3 , 4 In Italy, two recent studies reported a significant increase in the prevalence of CD in school‐age children compared with the last 25–30 years with an overall prevalence of 1.58% and 1.65% respectively. 5 , 6 Clinical presentation of CD is highly variable: from classical symptoms (e.g., gastrointestinal symptoms characterized by abdominal pain, diarrhea, constipation, weight loss, failure to thrive, nausea or vomiting and cramping or distension) to extraintestinal symptoms (e.g., dermatitis herpetiformis, stunted growth, delayed puberty, amenorrhea, recurrent aphthous stomatitis, iron‐deficiency anemia, fracture with inadequate traumas, irritability, arthritis, and chronic fatigue) to asymptomatic cases. 1 , 7 Due to the heterogeneity of its clinical presentation and the high proportion of asymptomatic cases, a large proportion of CD affected subjects are not promptly diagnosed and they remain exposed to the risk of late complications such as osteoporosis or malignancies (e.g., intestinal tumors). For this reason, early diagnosis and treatment are recommended for these patients. The actual approach suggested by guidelines is a combination of sensitive and specific serological tests, such as anti‐tissue transglutaminase (tTG) and anti‐endomysial IgA antibodies or anti‐deamidated gliadin (DGP) and anti‐tTG IgG antibodies if a selective IgA deficiency is present in at‐risk individuals with symptoms or conditions that may be associated with CD. 8 , 9 , 10 , 11 This approach (case‐finding strategy), together with the higher awareness of the disease among physicians and general population that seems to have significantly contributed to the increase in the number of diagnosed cases of CD, still allows an estimate of at least 60–70% of cases (the so‐called submerged part of the celiac iceberg) escape diagnosis and treatment. 1 , 5 , 6 This could be due to several factors, including lack of knowledge of guidelines, missing traceability of asymptomatic cases and costs. In this situation, rapid point‐of‐care tests (POCTs) detecting CD antibodies easily, without specific equipment and with rapid results, may have a role in improving case detection of CD, especially in outpatient consultations where the availability of a rapid result could be important for the physician in referring patients for more extensive serological tests or for eventual duodenal biopsies.
In the last decade, several POCTs detecting mostly anti‐tTG IgA have been developed, but their role remains unclear in clinical practice either as a mass screening tool or, in a case‐finding strategy, as a first‐line instrument to be used in at‐risk individuals before the use of conventional serology. 12 , 13 , 14 , 15 , 16 , 17 Previous studies have shown variable sensitivity or specificity of these tests compared with the conventional serology, even if a recent systematic review and meta‐analysis reported a high pooled sensitivity and specificity of POCTs in diagnosing CD (94% and 94.4%, respectively). 18
The primary aim of this study was to assess the diagnostic accuracy of a novel anti‐tTG IgA/anti‐DGP IgG‐based POCT, compared with conventional serology (reference) methods in people with CD or suspected for CD.
The secondary aim was to evaluate the effect of different biological matrices (whole blood and serum) on test performance, in order to verify whether the test functionality remains unchanged.
2. MATERIALS AND METHODS
2.1. Design of the study and samples
The retrospective and partially prospective observational single‐center study was performed at the Immunology and Allergy Unit of Pordenone Hospital (Italy) from August 2022 to March 2023.
Altogether, 266 sera (mean age 12.1 years; range 1–49; M/F ratio 0.40) and 60 peripheral blood samples (mean age 7.4 years; range 1–32; M/F ratio 0.37) were collected from patients with CD or suspected CD. It assayed for the presence of serum anti‐tTG IgA and anti‐DGP IgG antibodies with the fluoroenzyme immunoassays EliA Celikey IgA and EliA Gliadin IgG (Thermo Fisher Diagnostic, Uppsala, Sweden), considered as reference methods. Part of the enrolled samples came from the hospital archive (retrospective part of the study) and part from the daily routine clinic (prospective part of the study). Positive samples came from CD patients who resulted positive for anti‐tTG IgA and/or anti‐DGP IgG with the reference methods and in which duodenal biopsies resulted compatible with CD (Marsh‐Oberhuber type >1).
Negative samples came from patients with symptoms of CD, but in whom CD has been excluded by negative serological tests and duodenal biopsy.
For the matrix effect study, only the 60 patients of the prospective part of the study, from whom samples were collected both in ethylendiamine tetracetyc acid (EDTA) and serum vials, were enrolled (Figure 1).
FIGURE 1.
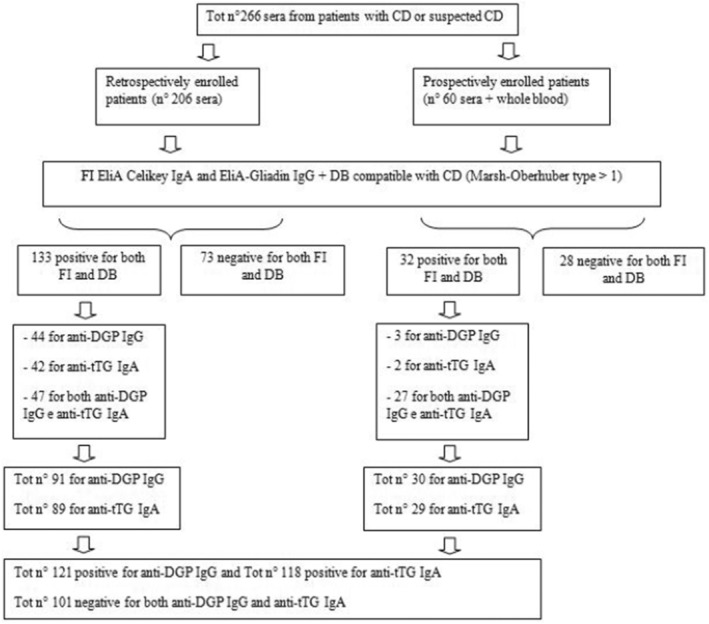
Design of the study and recruitment of patient samples. CD: Celiac disease; FI: fluoroenzyme immunoassays; DB: duodenal biopsy; anti‐DGP IgG: anti‐deamidated gliadin Immunoglobulin G; anti‐tTG IgA: anti‐tissue transglutaminase Immunoglobulin A.
2.2. Conventional serology (reference) assays
Anti‐tTG IgA and anti‐DGP IgG were analyzed using the fluoroenzyme immunoassays EliA Celikey IgA and EliA Gliadin IgG (Thermo Fisher Diagnostics; Uppsala, Sweden), respectively. Both assays were performed following the manufacturer's instructions on the fully automated instrument ImmunoCAP 250 (Thermo Fisher Diagnostics). The cutoff value for a positive test was ≥7 kU/L both for anti‐tTG IgA and anti‐DGP IgG.
2.3. Point‐of‐care test (POCT)
PRIMA® Celiac Disease Screening Test is a lateral‐flow immunochromatographic device manufactured by PRIMA Lab SA, CH‐6828 Balerna, Switzerland. It detects anti‐tTG IgA and anti‐DGP IgG antibodies on whole blood or serum through colloidal gold anti‐human antibodies as a signal detector. Thirty microliters of whole blood from EDTA vials or sample of 20 μL of serum were used in the present study. Samples were then applied to the test device, followed by addition of one drop of the diluent solution. The reading of the result is highlightable within 10 minutes. Positive results are due to the appearance of a single red band for anti‐DGP IgG and/or anti‐tTG IgA. Both are evaluated simultaneously by means of two separate test lines (T1 and T2, respectively). A third red control band (C line) ensured the correct functioning of the test (Figure 2). A positive result shows that anti‐tTG and/or anti‐DGP antibodies are present in the sample tested.
FIGURE 2.
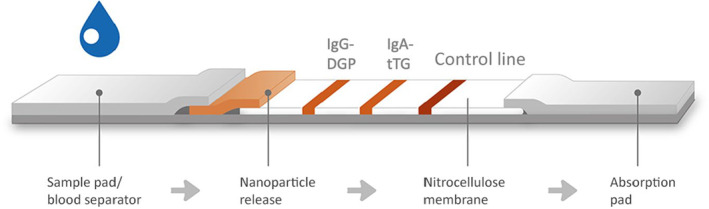
Schematic representation of test structure. From left to right the three test lines: the anti‐DGP IgG (T1 line), the anti‐tTG IgA (T2 line) and the control line (C line).
The cutoff values for a positive test were 5 U/mL for anti‐DGP IgG and 12 U/mL for anti‐tTG IgA. The cutoff of the rapid test was calculated, thanks to analytical studies performed internally by the manufacturer, using samples previously characterized with the same reference methods involved in the present study.
2.4. Interpretation of the POCT results
The reference methods and the POCT were analyzed in two different settings, and when performing the POCT, the results of the reference standard tests were unknown in order to avoid any influence on the test results. For the matrix effect study, whole blood and serum samples were tested at the same time on two parallel POCTs. Test results were read by two operators, with a third operator involved in case of discordance. Pictures of the results were taken for every sample tested in the present study and collected as raw data. Test results of the POCT had eight different outcomes for interpretation: three outcomes indicating different result combinations of positivity, one outcome indicating a negative test, and four outcomes indicating an invalid result (test to be repeated) (Figure 3).
FIGURE 3.
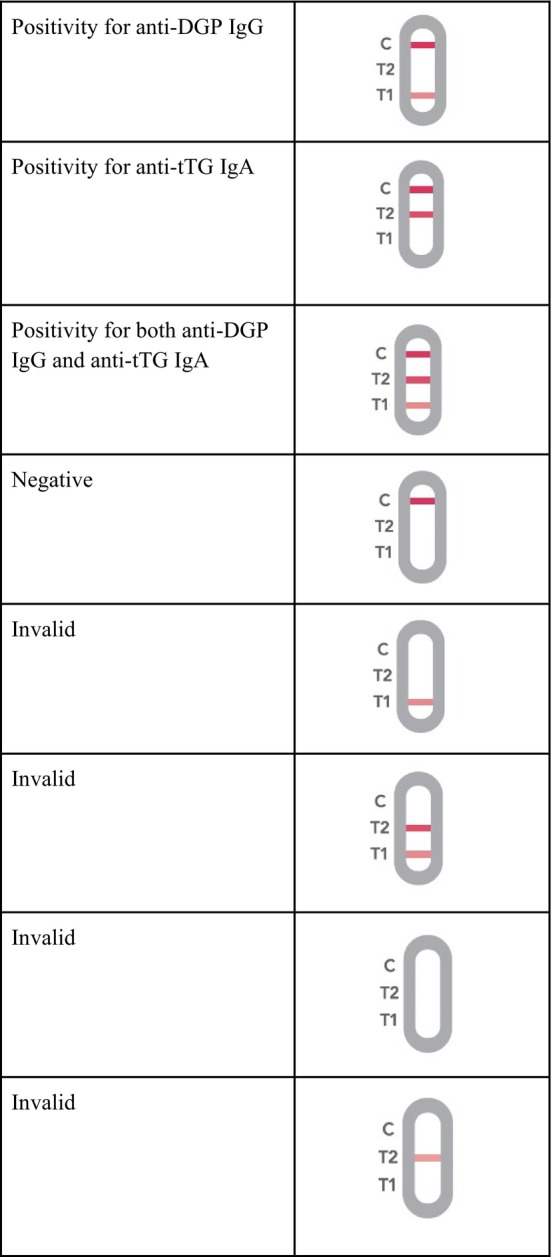
Schematic representation of the possible results obtained with the POCT for the simultaneous detection of anti‐DGP IgG and anti‐tTG IgA. Anti‐DGP IgG: anti‐deamidated gliadin Immunoglobulin G; anti‐tTG IgA: anti‐tissue transglutaminase Immunoglobulin A.
2.5. Corrective actions/deviations from the protocol
During the clinical performance study monitoring, some false‐positive results were observed with samples obtained from patients with a selective IgA deficiency.
Following further investigations on the matter, it was shown that false‐positive results were directly attributable to the low concentration of IgA present in the samples. These false‐positive results were detected, especially on the T1 test line and to a lesser extent on the T2 test line. A threshold of concentration that allows nullifying the visual positive signals observed was identified, starting from a concentration of 40 mg/dL of serum IgA. The need to better investigate this phenomenon made us make the final decision to exclude cases of IgA deficiency from the present study.
2.6. Statistical analysis
Two analysis population datasets were defined for this study: the global performance analysis dataset and the matrix effect study dataset. The first included all serum samples enrolled in the present study, with the aim of calculating the performance of the rapid test in terms of sensitivity, specificity, accuracy, positive (PPV), negative predictive values (NPV), and agreement with the reference methods. The second consisted of all prospective samples (whole blood and serum of the same patient) with the aim of evaluating the blood matrix as an alternative to serum for testing. Results are expressed in terms of agreement between the two matrices. All values are given with 95% confidence intervals (95% CI) and the agreement was calculated with Cohen's kappa coefficient, where 0 indicates no agreement and 1 indicates a perfect agreement.
Descriptive statistics include counts and percentages for categorical data, and medians and ranges for continuous parameters. Statistical analysis was performed using MedCALC statistical software, version 10.4.5 (Mariakerke, Belgium).
2.7. Ethical considerations
This study was approved by the Friuli Venezia Giulia Ethics Committee (Ethics Committee approval number CEUR‐2022‐Os‐100 Prot. N. 22497, 01/07/2022) and the Santa Maria degli Angeli Hospital Internal Research Nucleus, and an informed consent form was obtained by the participants involved in the study.
3. RESULTS
Samples from 266 subjects were recruited into the retrospective and the prospective cohort, between August 2022 and March 2023, consisting in a total of 101 negative samples and 165 positive samples. Both the reference methods and the rapid tests were performed for all samples. Among the 165 positive samples evaluated with the standard methods, 47 (28.5%) resulted positive only for anti‐DGP IgG; 44 (26.7%) only for anti‐tTG IgA; and 74 (44.8%) for both anti‐DGP IgG and anti‐tTG IgA.
From a total of 121 samples that resulted positive for anti‐DGP IgG with the standard methods, 102 resulted positive using the PRIMA® Celiac Disease Screening Test for anti‐DGP IgG and from a total of 101 negative samples with the standard methods, 91 were also negative with the POCT for anti‐DGP IgG, demonstrating a POCT sensitivity and specificity of 84.30% (95% CI: 76.77%–89.71%) and 90.10% (95% CI: 82.73%–94.53%), respectively.
The PPV and NPV of the POCT for anti‐DGP IgG resulted in 91.07% (95% CI: 84.34%–95.08%) and 82.73% (95% CI: 74.59%–88.65%), respectively, with a total test accuracy of 86.94% (95% CI: 81.87%–90.75%) (Table 1).
TABLE 1.
Diagnostic accuracy of the POCT for IgG‐DGP, and IgA‐tTG antibodies compared with reference standard methods (EliA DGP IgG and EliA Celikey IgA).
| POCT IgG‐DGP % (95% CI) | POCT IgA‐tTG % (95% CI) | |
|---|---|---|
| Sensitivity | 84.3 (76.8–89.7) | 98.3 (94–99.5) |
| Specificity | 90.1 (82.7–94.5) | 98.0 (93.1–99.5) |
| Positive predictive value (PPV) | 91.1 (84.3–95.1) | 98.3 (94.0–99.5) |
| Negative predictive value (NPV) | 82.7 (74.6–88.6) | 98.0 (93.1–99.5) |
| Accuracy | 86.9 (81.9–90.7) | 98.2 (95.4–99.3) |
Abbreviations: CI, confidence interval; IgA‐tTG, immunoglobulin A‐tissue transglutaminase; IgG‐DGP, immunoglobulin G‐deamidated gliadin; POCT, point‐of‐care test.
A substantial agreement (Cohen's kappa: 0.738; 95% CI: 0.650–0.827) was also observed between POCT and reference methods results.
Concerning the PRIMA® Celiac Disease Screening Test for anti‐tTG IgA, from a total of 118 positive samples with the standard methods, 116 resulted positive with the POCT for anti‐tTG IgA while from a total of 101 negative samples with the standard methods, 99 resulted also negative with the POCT for anti‐tTG IgA. The POCT for anti‐tTG IgA demonstrated a sensitivity and specificity of 98.31% (95% CI: 94.03%–99.53%) and 98.02% (95% CI: 93.07%–99.46%), respectively.
The PPV and NPV of the POCT for anti‐tTG IgA resulted in 98.31% (95% CI: 94.03%–99.53%) and 98.02% (95% CI: 93.07%–99.46%) respectively, with a test accuracy of 98.17% (95% CI: 95.40%–99.29%) (Table 1).
A perfect agreement (Cohen's kappa: 0.963; 95% CI: 0.928–0.999) was also observed between POCT and reference methods.
3.1. Matrix effect study
A total of 60 samples were prospectively enrolled, consisting of 34 positive samples (22 with values near the cutoff level) and 26 negative. The agreement of the results obtained using the two different matrices is summarized in Table 2. For anti‐DGP IgG, the agreement was 95% (95% CI: 86.30–98.29%) and Cohen's kappa was 0.900 (95% CI: 0.790–1.000), while for anti‐tTG IgA the agreement was 100% (95% CI: 93.9–100%) and Cohen's kappa 1.000 (95% CI: 1.000–1.000).
TABLE 2.
Agreement of the results obtained using the two different matrices (serum and whole blood).
| IgG‐DGP | IgA‐tTG | ||||||
|---|---|---|---|---|---|---|---|
| Serum | Serum | ||||||
| Positive | Negative | Total | Positive | Negative | Total | ||
| Whole blood | Whole blood | ||||||
| Positive | 28 | 3 | 31 | Positive | 29 | 0 | 29 |
| Negative | 0 | 29 | 29 | Negative | 0 | 31 | 31 |
| Total | 28 | 32 | 60 | Total | 29 | 31 | 60 |
| Overall agreement: 95.0%; 95% CI: 86.30%–98.29% | Overall agreement: 100.0%; 95% CI: 93.98%–100.00% | ||||||
Abbreviations: CI, confidence interval; IgA‐tTG, immunoglobulin A‐tissue transglutaminase; IgG‐DGP, immunoglobulin G‐deamidated gliadin.
4. DISCUSSION
In this study, the diagnostic accuracy of the simultaneous detection of anti‐tTG IgA and anti‐DGP IgG has been evaluated, and compared with the reference standard serological methods in patients with CD or suspected for CD. This is one of the few POCT that uses this particular combination of celiac antibodies detection rather than the single detection of anti‐tTG IgA/IgG or anti‐DGP IgA/IgG, such as most POCTs devices present on the market. 12 , 13 , 14 , 15 , 16 , 17 , 18 In our study, the fact that all study participants underwent a duodenal biopsy regardless of the tests allows us to rule out false‐negative cases of missed CD. The POCT for anti‐tTG IgA showed a very high sensitivity and specificity of 98.31% and 98.02% (with a PPV and NPV of 98.31% and 98.02%, respectively) and these results are better than those of other studies examining the same antibody class with lateral‐flow immunochromatographic technique. 12 , 18 Furthermore, a high diagnostic test accuracy of 98.17% with a perfect agreement (Cohen's kappa: 0.963) was shown compared with the reference standard methods. These results are to be considered very important because anti‐tTG IgA is actually the best first‐level diagnostic marker for celiac disease, 8 , 9 , 10 , 11 and here, it is almost comparable to the reference serological standard methods.
Our study also showed a good anti‐DGP IgG sensitivity and specificity of 84.30% and 90.10%, (with a PPV and NPV of 91.07% and 82.73%, respectively) with a high accuracy of 86.94% (95% CI: 81.87%–90.75%) and a substantial agreement (Kappa 0.738) compared to the reference standard methods. These results are in line or better than those of other studies examining the same antibody class with other lateral‐flow immunochromatografic tests. 14 , 16 , 19 Mašić et al. 15 in a recent study found a higher sensitivity and specificity using an anti‐DGP IgA/IgG‐based POCT for CD screening in a population of first‐grade elementary school children (95%–100% and 93.1%–95.7%, respectively). As already mentioned above, we found some false‐positive results with samples obtained from patients with a selective IgA deficiency. We have noticed that this situation occurs with an IgA threshold value ≤40 mg/dL that is compatible with a condition of partial IgA deficiency. This is certainly a limitation for this anti‐DGP IgG‐based POCT in patients presenting this condition, which is more frequent especially among children under 4 years of age. 20 Adults normally present IgA values ranging from 70 to 400 mg/dL with slight differences according to ethnicity 21 , 22 , 23 and, excluding children under 4 years of age, the incidence of a selective IgA deficiency (defined for IgA values <7 mg/dL) varies depending on the ethnic background: from 1:143 in the Arabian peninsula to around 1:14.840–18.500 in the Japanese population. 24 In celiac patients this condition is 10–15 times more frequent, 25 while it is difficult to establish the true incidence of a partial IgA deficiency in the general population. On the basis of these considerations, false‐positive results due to a partial or selective IgA deficiency would concern only the non‐celiac population; while in the case of celiac patients, this situation would not compromise the correlation between the test positivity and the presence of the CD. The issue of false‐positive reactions found with POCTs for CD was also seen in the study of Mašić et al., 15 which explained the results as a misinterpretation of the result in patients with “faint lines” in their test, similarly to what was previously reported in other studies 13 , 14 , 16 , 19 with a consequent impairment of the PPV. In our study, we finally decided to exclude cases of IgA deficiency to prevent it from affecting our test results. However, in the context of a mass screening test, positive results obtained with POCT should always be confirmed by a reference standard serological method, and in this regard, also considering the convenience and the very low cost of the test, it is more acceptable to have false‐positive results than false‐negative ones. According to the results of our study, the PRIMA® Celiac Disease Screening Test seems to be a useful tool for CD screening, not only in patients with high clinical suspicion for CD but, thanks to the convenience of a rapid and economic test, also in the general population in order to reduce the submerged part of the celiac iceberg that is still estimated to be approximately 60%. 5 , 6 Furthermore, due to the strong agreement found between the two matrices (blood and serum), this test could be used in an outpatient setting by collecting a sample of 30 μL of whole blood through a simple finger prick technique. This would allow an increase in patient acceptance of the POCT compared to the venipuncture, as already demonstrated by the study of Lau et al. 16
In conclusion, the anti‐tTG IgA/anti‐DGP IgG‐based POCT (PRIMA® Celiac Disease Screening Test) has shown comparable sensitivities and specificities to reference standard serological methods in detecting CD in symptomatic patients. Due to the advantage of convenience, the rapid result availability, the low costs and the good practical execution, PRIMA® Celiac Disease Screening Test could be used in the context of a mass screening test, rather than for a “case‐finding” strategy, in order to detect celiac patients before referring for conventional serology. However, the occurrence of possible false‐positive results in patients with selective or partial IgA deficiency may increase the number of unnecessary investigations.
AUTHOR CONTRIBUTIONS
Simone Camelliti, Marzia Cozzi, and Francesca Marinoni contributed to the rapid test development. Marzia Cozzi, Simone Camelliti, Danilo Villalta, Mirella Da Re, and Francesca Grizzo contributed to the clinical study design and coordination. Giuseppe Parrinello and Danilo Villalta contributed to the original draft preparation and writing. Danilo Villalta, Simone Camelliti, Marzia Cozzi, Francesca Marinoni, Mirella Da Re, and Francesca Grizzo contributed to the review and editing. Francesca Marinoni contributed to the design of rapid test and development supervision. Danilo Villalta contributed to the drafting and clinical study supervision.
FUNDING INFORMATION
This study was supported by PRIMA Lab SA, Via Antonio Monti 7, CH‐6828 Balerna, Switzerland.
CONFLICT OF INTEREST STATEMENT
SC, MC, and FM are employees of PRIMA Lab SA.
Parrinello G, Da Re M, Grizzo F, et al. Diagnostic accuracy of a novel point‐of‐care test for simultaneous detection of anti‐transglutaminase IgA and anti‐deamidated gliadin IgG antibodies. J Clin Lab Anal. 2024;38:e25003. doi: 10.1002/jcla.25003
DATA AVAILABILITY STATEMENT
The raw data supporting the conclusions of this article will be made available by the authors, without undue reservation.
REFERENCES
- 1. Catassi C, Verdu EF, Bai JC, Lionetti E. Coeliac disease. Lancet. 2022;399(10344):2413‐2426. [DOI] [PubMed] [Google Scholar]
- 2. Ludvigsson JF, Leffler DA, Bai JC, et al. The Oslo definitions for coeliac disease and related terms. Gut. 2013;62(1):43‐52. [DOI] [PMC free article] [PubMed] [Google Scholar]
- 3. Singh P, Arora A, Strand TA, et al. Global prevalence of celiac disease: systematic review and meta‐analysis. Clin Gastroenterol Hepatol. 2018;16(6):823‐836.e2. [DOI] [PubMed] [Google Scholar]
- 4. Catassi C, Gatti S, Lionetti E. World perspective and celiac disease epidemiology. Dig Dis. 2015;33(2):141‐146. doi: 10.1159/000369518 [DOI] [PubMed] [Google Scholar]
- 5. Gatti S, Lionetti E, Balanzoni L, et al. Increased prevalence of celiac disease in school‐age children in Italy. Clin Gastroenterol Hepatol. 2020;18(3):596‐603. [DOI] [PubMed] [Google Scholar]
- 6. Lionetti E, Pjetraj D, Gatti S, et al. Prevalence and detection rate of celiac disease in Italy: results of a SIGENP multicenter screening in school‐age children. Dig Liver Dis. 2023;55(5):608‐613. [DOI] [PubMed] [Google Scholar]
- 7. Lebwohl B, Sanders DS, Green PHR. Coeliac disease. Lancet. 2018;391(10115):70‐81. doi: 10.1016/S0140-6736(17)31796-8 [DOI] [PubMed] [Google Scholar]
- 8. Husby S, Koletzko S, Korponay‐Szabó IR, et al. European Society for Pediatric Gastroenterology, Hepatology, and Nutrition guidelines for the diagnosis of coeliac disease. J Pediatr Gastroenterol Nutr. 2012;54(1):136‐160. [DOI] [PubMed] [Google Scholar]
- 9. Rubio‐Tapia A, Hill ID, Kelly CP, Calderwood AH, Murray JA, American College of Gastroenterology . American College of Gastroenterology. ACG clinical guidelines: diagnosis and management of celiac disease. Am J Gastroenterol. 2013;108(5):656‐676. [DOI] [PMC free article] [PubMed] [Google Scholar]
- 10. Ludvigsson JF, Bai JC, Biagi F, et al. Diagnosis and management of adult coeliac disease: guidelines from the British Society of Gastroenterology. Gut. 2014;63(8):1210‐1228. [DOI] [PMC free article] [PubMed] [Google Scholar]
- 11. Husby S, Koletzko S, Korponay‐Szabó I, et al. European Society Paediatric Gastroenterology, Hepatology and Nutrition guidelines for diagnosing coeliac disease 2020. J Pediatr Gastroenterol Nutr. 2020;70(1):141‐156. [DOI] [PubMed] [Google Scholar]
- 12. Baraba Dekanić K, Butorac Ahel I, Ružman L, Dolinšek J, Dolinšek J, Palčevski G. Is there a role of using a rapid finger prick antibody test in screening for celiac disease in children? Gastroenterol Res Pract. 2019;2019:4504679. doi: 10.1155/2019/4504679 [DOI] [PMC free article] [PubMed] [Google Scholar]
- 13. Primavera G, Aiello A, Grosso C, et al. Point‐of‐care test screening versus case finding for paediatric coeliac disease: a pragmatic study in primary care. Acta Paediatr. 2021;110(1):337‐339. [DOI] [PubMed] [Google Scholar]
- 14. Grode L, Møller Jensen T, Parkner T, et al. Diagnostic accuracy of a point‐of‐care test for celiac disease antibody screening among infertile patients. Inflamm Intest Dis. 2019;4(3):123‐130. [DOI] [PMC free article] [PubMed] [Google Scholar]
- 15. Mašić M, Musil V, Petričević Vidović T, et al. Point‐of‐care screening for coeliac disease in schoolchildren reveals higher disease prevalence in Croatia. Healthcare (Basel). 2022;11(1):64. [DOI] [PMC free article] [PubMed] [Google Scholar]
- 16. Lau MS, Mooney PD, White WL, et al. Office‐based point of care testing (IgA/IgG‐deamidated gliadin peptide) for celiac disease. Am J Gastroenterol. 2018;113(8):1238‐1246. [DOI] [PubMed] [Google Scholar]
- 17. Meijer‐Boekel C, van den Akker ME, van Bodegom L, et al. Early diagnosis of coeliac disease in the preventive youth health care centres in The Netherlands: study protocol of a case finding study (GLUTENSCREEN). BMJ Paediatr Open. 2021;5(1):e001152. [DOI] [PMC free article] [PubMed] [Google Scholar]
- 18. Singh P, Arora A, Strand TA, et al. Diagnostic accuracy of point of care tests for diagnosing celiac disease: a systematic review and meta‐analysis. J Clin Gastroenterol. 2019;53(7):535‐542. [DOI] [PubMed] [Google Scholar]
- 19. Tangermann P, Branchi F, Itzlinger A, et al. Low sensitivity of Simtomax point of care test in detection of celiac disease in a prospective multicenter study. Clin Gastroenterol Hepatol. 2019;17(9):1780‐1787.e5. [DOI] [PubMed] [Google Scholar]
- 20. Bayram RO, Özdemir H, Emsen A, Türk Dağı H, Artaç H. Reference ranges for serum immunoglobulin (IgG, IgA, and IgM) and IgG subclass levels in healthy children. Turk J Med Sci. 2019;49(2):497‐505. [DOI] [PMC free article] [PubMed] [Google Scholar]
- 21. Khan SR, Chaker L, Ikram MA, Peeters RP, van Hagen PM, Dalm VASH. Determinants and reference ranges of serum immunoglobulins in middle‐aged and elderly individuals: a population‐based study. J Clin Immunol. 2021;41(8):1902‐1914. [DOI] [PMC free article] [PubMed] [Google Scholar]
- 22. Kardar GA, Shams SH, Pourpak Z, Moin M. Normal value of immunoglobulins IgA, IgG, and IgM in Iranian healthy adults, measured by nephelometry. J Immunoassay Immunochem. 2003;24(4):359‐367. [DOI] [PubMed] [Google Scholar]
- 23. Oyeyinka GO, Salimonu LS, Williams AI, et al. Range of normal serum immunoglobulin (IgG, IgA and IgM) values in Nigerians. Afr J Med Med Sci. 1984;13(3‐4):169‐176. [PubMed] [Google Scholar]
- 24. Yel L. Selective IgA deficiency. J Clin Immunol. 2010;30(1):10‐16. [DOI] [PMC free article] [PubMed] [Google Scholar]
- 25. Kumar V, Jarzabek‐Chorzelska M, Sulej J, Karnewska K, Farrell T, Jablonska S. Celiac disease and immunoglobulin a deficiency: how effective are the serological methods of diagnosis? Clin Diagn Lab Immunol. 2002;9(6):1295‐1300. [DOI] [PMC free article] [PubMed] [Google Scholar]
Associated Data
This section collects any data citations, data availability statements, or supplementary materials included in this article.
Data Availability Statement
The raw data supporting the conclusions of this article will be made available by the authors, without undue reservation.