Abstract
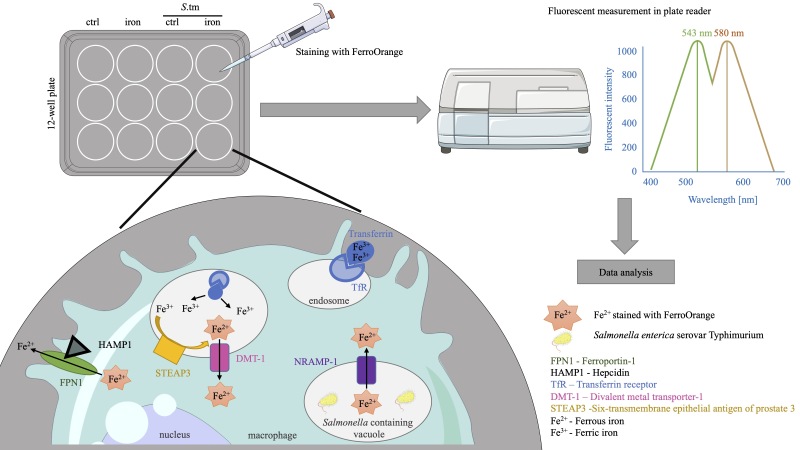
Macrophages are at the center of innate immunity and iron metabolism. In the case of an infection, macrophages adapt their cellular iron metabolism to deprive iron from invading bacteria to combat intracellular bacterial proliferation. A concise evaluation of the cellular iron content upon an infection with bacterial pathogens and diverse cellular stimuli is necessary to identify underlying mechanisms concerning iron homeostasis in macrophages. For the characterization of cellular iron levels during infection, we established an in vitro infection model where the murine macrophage cell line J774A.1 is infected with Salmonella enterica serovar Typhimurium (S.tm), the mouse counterpart to S. enterica serovar Typhi, under normal and iron-overload conditions using ferric chloride (FeCl3) treatment. To evaluate the effect of infection and iron stimulation on cellular iron levels, the macrophages are stained with FerroOrange. This fluorescent probe specifically detects Fe2+ ions and its fluorescence can be quantified photometrically in a plate reader. Importantly, FerroOrange fluorescence does not increase with chelated iron or other bivalent metal ions. In this protocol, we present a simple and reliable method to quantify cellular Fe2+ levels in cultured macrophages by applying a highly specific fluorescence probe (FerroOrange) in a TECAN Spark microplate reader. Compared to already established techniques, our protocol allows assessing cellular iron levels in innate immune cells without the use of radioactive iron isotopes or extensive sample preparation, exposing the cells to stress.
Key features
• Easy quantification of Fe2+ in cultured macrophages with a fluorescent probe.
• Analysis of iron in living cells without the need for fixation.
• Performed on a plate reader capable of 540 nm excitation and 585 nm emission by trained employees for handling biosafety level 2 bacteria.
Keywords: Salmonella Typhimurium, Macrophages, FerroOrange, Iron, Iron quantification, Fluorescence
Graphical overview
Background
Human typhoid fever, a severe and often life-threatening infectious disease, is caused by the facultative intracellular Gram-negative bacterium Salmonella enterica serovar Typhi, leading to major health loss globally (Stanaway et al., 2019). For murine infection models, the strain Salmonella enterica serovar Typhimurium ( Salmonella Typhimurium, S.tm), which causes a systemic disease in mice but a self-limiting gastroenteritis in humans, is frequently used.
In the case of a bacterial infection, invading pathogens are phagocytized by macrophages, the first line of innate immune defense (Weiss and Schaible, 2015). S.tm, however, thrives within macrophages. Despite its ability to invade various types of cells, virulence is dependent on intramacrophage proliferation (Fields et al., 1986; Leung and Finlay, 1991). One factor critically affecting the outcome of this host–pathogen interaction is the availability of nutrients, as intramacrophage S.tm depends on the acquisition of essential nutrients to sustain efficient proliferation. This includes amino acids or trace metals, like iron. On one hand, S.tm–driven metabolic reprogramming grants the pathogen access to intracellular nutrients (Liss et al., 2017). On the other hand, macrophages exploit this nutrient demand by withdrawing iron from the spatio-temporal localization of the pathogen in a process termed nutritional immunity (Nairz et al., 2007; Murdoch and Skaar, 2022). Appropriately, a state of systemic or cellular iron excess is associated with increased bacterial proliferation (Khan et al., 2007; Porto and De Sousa, 2007; Kao et al., 2016).
Macrophage cellular iron metabolism and its adaptation to an infection have been extensively studied. In the case of an infection with an intracellular pathogen like S.tm, regulation of the key iron metabolism proteins Ferroportin-1 (FPN1) and the Transferrin receptor-1 (TFR1) facilitates a decrease of cellular iron content and thus leads to an improved infection control of intracellular bacteria (Nairz et al., 2008; Fritsche et al., 2012; Wessling-Resnick, 2015; Abreu et al., 2020). Furthermore, transport of iron into the cytosolic lumen is accomplished by the divalent metal transporter-1 (DMT1) and by the natural resistance-associated macrophage protein-1 (NRAMP1 or SLC11A1), both of which have also been implicated in bacterial iron withdrawal (Forbes and Gros, 2003; Fritsche et al., 2012; Grander et al., 2022). DMT1 is responsible for the uptake of non-transferrin-bound iron (NTBI) from outside the macrophage and for transporting transferrin-bound iron (TBI) from the early endosome into the lumen of the phagocyte. NRAMP1 transports iron out of the late phagosome. As both are only capable of binding Fe2+, the function of the six-transmembrane epithelial antigen of prostate 3 (STEAP3) in the late endosome to reduce Fe3+ to Fe2+ is indispensable (Wang and Pantopoulos, 2011).
Another factor at play is the acute phase protein hepcidin (HAMP1), a liver-derived hormone regarded as the systematic master regulator of iron metabolism. During an infection, hepcidin targets the iron exporter FPN1, leading to its degradation and thus iron sequestration, causing hypoferremia (Nemeth et al., 2004). However, its role in an infection with intracellular pathogens is not yet completely understood (Chlosta et al., 2006; Lim et al., 2018).
During infection studies, cellular iron quantification is frequently relevant. Standard procedures like the usage of radioactive 59Fe isotopes are elaborate, expensive, and might be inapplicable in certain experimental settings. Iron quantification with the help of the quenchable probe Calcein-AM is easily available and often used but has several disadvantages. Acquiring fluorescence by flow cytometry needs extensive preparation of samples that exposes cells to mechanical stress; furthermore, as Calcein does not pass into the cellular membrane compartments (e.g., lysosomes), which are rich in labile iron (chelatable), total cellular iron is most likely drastically underestimated when this method is applied (Tenopoulou et al., 2007).
Herein, we report a simple and powerful tool to accurately determine alterations in cellular iron levels upon diverse stimuli, which can be employed for cultured immune cells, here exemplified in a murine macrophage infection with intracellular bacteria. As the cellular iron trafficking machinery primarily utilizes Fe2+, monitoring metabolically active intracellular ferrous iron levels is most insightful (Hentze et al., 2010; Moroishi et al., 2011; Cronin et al., 2019). We apply a fluorescent probe that specifically detects Fe2+, based on N-oxide chemistry (RhoNox-4; commercial name: FerroOrange) (Hirayama et al., 2020). By using this approach, cellular levels of the trace metal can be quantified in a plate reader without additionally exposing cells to stressors.
Materials and reagents
12-well plate (Falcon, catalog number: 353043)
Acridine orange/propidium iodide stain (Biocat, catalog number: F23001)
Agar-Agar Kobe I (Roth, catalog number: 5210.3)
Aqua bidest (Fresenius Kabi, catalog number: 16.231)
CASY Cup (OMNI Life Science, catalog number: 5651794)
CASY Ton buffer (OMNI Life Science, catalog number: 5651808)
Cell scraper (Sarstedt, catalog number: 83.3951)
CoolCellTM LX freezing container (Merck, catalog number: BCS-405G)
Cryo vial with silicone washer, 2 mL (Simport, catalog number: T311-3)
Dimethylsulfoxide (DMSO) (Roth, catalog number: A994.1)
Disposable cuvette (BRAND, catalog number: 759015)
Disposable pipettes, 5 mL, 10 mL, and 25 mL (Falcon, catalog number: 606180, 607180, and 357525, respectively)
Dulbecco’s modified Eagle’s medium (DMEM) (Pan BiotechTM, catalog number: P04-01500)
Eppendorf tubes, 0.5 mL (Eppendorf, catalog number: 0030121.023)
Erlenmeyer flask, 250 mL (Stoelzle Medical, catalog number: 21226368000)
Ferric chloride (FeCl3) (Sigma, catalog number: 236489)
FerroOrange (GERBU Biotechnik GmbH, catalog number: F374-10)
Fetal bovine serum (FBS) (Pan BiotechTM, catalog number: P30-3031)
Gentamicin (Gibco, catalog number: 15750-037), stock: 50 mg/mL
Glass beaker, 150 mL (Ruprechter, catalog number: 102113729)
Glycerol (Sigma, catalog number: G5516-100ML)
Iscove’s modified Dulbecco's medium (IMDM) (Pan BiotechTM, catalog number: P04-20150S3)
L-Glutamine (Lonza, catalog number: BE17-605E)
Luna cell counting slides (Biocat, catalog number: L201B1C3GB)
Lysogeny broth (LB) medium Lennox (Roth, catalog number: X964.2)
Penicillin/streptomycin (Capricorn Scientific, catalog number: PS-B)
Phosphate buffer saline (PBS) (Lonza, catalog number: 17-515 F)
Pipetman L Starter Kit, 2, 20, 200, and 1,000 μL pipettes (GILSON, catalog number: F167370)
Pipette tips, 10, 200, and 1,250 μL (STARLAB, catalog number: S1110-3700, S1120-3810, and S1112-1720, respectively)
Polypropylene tube, 50 mL (Falcon, catalog number: 352070)
Salmonella enterica serovar Typhimurium ATCC14028 (ATCC)
Sartorius Midi Plus pipetting controller (Sartorius, catalog number: 710931)
Tissue culture flask, 750 mL, straight neck (Falcon, catalog number: 353028)
LB medium (see Recipes)
LB medium with 30% glycerol (see Recipes)
Cell culture medium (see Recipes)
Cell culture medium for infection with S.tm (see Recipes)
Staining solution (see Recipes)
Iron (III) chloride solution (see Recipes)
Cell line
J774A.1 (ATCC TIB-67TM) is a macrophage cell line isolated in 1968 from a female BALB/c mouse with reticulum cell sarcoma.
Recipes
-
LB medium
200 mL aqua bidest
2 g LB medium powder
Autoclave (20 min at 121 °C and 10 min at 50 °C)
-
LB medium with 30% glycerol
Add 300 μL of glycerol to 700 μL of LB medium
-
Cell culture medium
500 mL of DMEM
50 mL of FBS
5 mL of L-Glutamine
5 mL of Penicillin/Streptomycin
-
Cell culture medium for infection with S.tm
500 mL of DMEM
5 mL of FBS
5 mL of L-Glutamine
-
Staining solution
5 mL of IMDM
1 μL of FerroOrange (1 mmol/L)
-
Iron (III) chloride solution
135 mg of FeCl3 50 mL of Aqua bidest
Equipment
Automated multimode microplate reader (TECAN Spark, catalog number: 1912001805)
Casy counting system CASY TT (OMNI Life Science, catalog number: TT2QA2571)
Centrifuge (Hettich Micro 200R and Rotanta 460R)
Freezer, -80 °C (Thermo Fisher Scientific, catalog number: 15788587)
CO2 incubator (Thermo Fisher Scientific, model: Heraeus® HERAcell®)
Laminar flow cabinet (EuroClone Sicherheitswerkbank Safe Mate Eco 1.2) (Politakis Laborgeräte, catalog number: EN 12 469)
Liquid nitrogen storage tank (CryoShop, catalog number: CS-79105601)
LUNA automated cell counter (Biocat, catalog number: L10001-LG)
Millivac-Maxi vacuum pump (Merck, catalog number: SD1P014M04)
Photometer (Eppendorf, catalog number: BioPhotometer D30)
Shaking incubator (VWR, catalog number: GFL 3031)
Software and datasets
GraphPad Prism 9.1 (GraphPad Software)
SparkControlTM (Spark Method Editor V.3, release date 2021 06 01) (TECAN Trading, Ltd.)
Procedure
-
Thawing of the J774A.1 macrophage cell culture aliquot
Note: Perform the next steps in a sterile laminar flow cabinet.
Preheat a water bath to 37 °C.
Preheat the cell culture medium (see Recipes).
Prepare a 50 mL polypropylene tube with 25 mL of preheated cell culture medium.
Take the J774A.1 cell culture aliquot from the liquid nitrogen storage and incubate the cells in the water bath until the aliquot is almost completely thawed.
Pipette the thawed cell culture aliquot into the previously prepared 50 mL polypropylene tube.
Centrifuge the cells at 300× g for 5 min.
Discard the supernatant in a 150 mL glass beaker.
Resuspend the cell pellet in 25 mL of cell culture medium (see Recipes).
Pipette the cells into a 750 mL tissue culture flask.
Place the cell culture flask into a cell incubator at 37 °C with 5% CO2 and 95% humidity as growth conditions.
-
Splitting of the J774A.1 cell culture
Note: Perform the next steps in a sterile laminar flow cabinet.
Remove the complete cell culture medium using a peristaltic pump.
Wash the cells with 10 mL of PBS.
Remove the PBS using a peristaltic pump.
Add 10 mL of cell culture medium .
Use a disposable cell scraper to scrape off the cells.
Prepare a new cell culture flask with 24 mL of cell culture medium.
Pipette 1 mL of the scraped off cells into the previously prepared cell culture flask.
Place the cell culture flask into a cell incubator at 37°C with 5% CO2 and 95% humidity as growth conditions.
Check the density of the cells every second day.
If the cells cover up to 90% of the cell culture flask’s surface, further split the cells into a new cell culture flask.
-
Freezing and storage of the J774A.1 cells
Note: Perform the next steps in a sterile laminar flow cabinet.
Perform steps as described in Section B1–5.
Pipette the scraped off cells into a 50 mL polypropylene tube.
Pipette 9 μL of the cell suspension into a 0.5 mL Eppendorf tube.
Mix 1 μL of the acridine orange/propidium iodide stain solution to the 9 μL cell suspension.
Pipette the 10 μL of the stained cells into a Luna cell counting slide.
Measure the cell number using the LUNA-FL fluorescent and brightfield automated cell counter.
Centrifuge cells at 300× g for 5 min.
Prepare the freezing mix (DMEM containing 10% FBS, 1% L-glutamine, and 1% penicillin/streptomycin + 8% DMSO).
Discard the supernatant into a 150 mL glass beaker.
Resuspend the cell pellet in FBS to a concentration of 1 × 10 7 cells/800 μL.
Mix 800 μL of the cells in FBS with 800 μL of freezing mix.
Aliquot 800 μL of this cell suspension into Cryo tubes.
Label the Cryo tubes with the cell type, the number of cell passages, and the date of storage.
Put the Cryo tubes into a Cool CellTM freezing container and leave it at -80 °C for two days.
Place the Cryo tubes on liquid nitrogen for long-term storage.
-
Seeding of the J774A.1 cells on 12-well plates
Note: Perform the next steps in a sterile laminar flow cabinet.
Remove the complete cell culture medium using a peristaltic pump.
Wash the cells twice with 10 mL of PBS.
Remove the PBS using a peristaltic pump.
-
Add 10 mL of DMEM containing 1% FBS and 1% L-glutamine.
Note: 1% FBS is used to reduce the amount of iron in the cell culture medium. This reduction of FBS is necessary to achieve the iron overload with the iron stimulus.
Use a disposable cell scraper to scrape off the cells.
Pipette 9 μL of the cell suspension into a 0.5 mL Eppendorf tube.
Mix 1 μL of the acridine orange/propidium iodide stain solution to the 9 μL cell suspension.
Pipette the 10 μL of stained cells into a Luna cell counting slide.
Measure the cell number using the LUNA-FL fluorescent and brightfield automated cell counter.
Seed 2.5 × 10⁵ cells in 1 mL of DMEM containing 1% FBS and 1% L-glutamine in a 12-well plate.
Incubate cells overnight in a cell incubator at 37°C with 5% CO 2 and 37°C and 95% humidity as growth conditions.
-
Treatment of the J774A.1 cell culture with iron
Note: Perform the next steps in a sterile laminar flow cabinet.
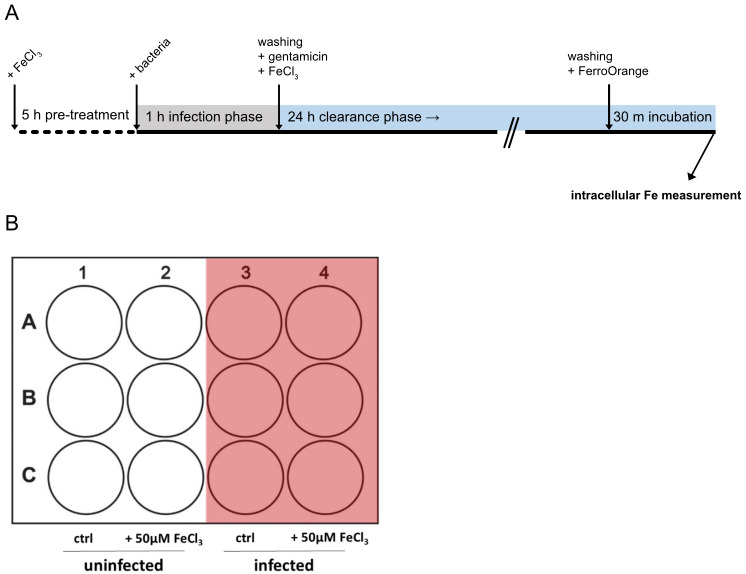
Treat the cells with 50 μM of FeCl3 [iron (III) chloride solution; see Recipes] or leave them untreated for 5 h (Figure 1).
Incubate cells for 5 h in a cell incubator at 37 °C with 5% CO 2 and 95% humidity as growth conditions.
-
Preparation of Salmonella typhimurium (S.tm) stock as described in Brigo et al. (2022)
Take an aliquot of Salmonella enterica serovar Typhimurium ATCC14028 from -20 °C storage.
-
Thaw the aliquot at room temperature.
Note: Perform the next steps in a sterile laminar flow cabinet.
Pipette 10 μL of S.tm into 10 mL of LB medium in a 250 mL Erlenmeyer flask and cover the top of the flask using a tin foil.
Incubate at 37 °C overnight in a shaking incubator at 200 rpm.
The following day, pipette 50 μL of the overnight culture into fresh 10 mL of LB medium in a 250 mL Erlenmeyer flask and cover the top with tin foil.
Dispose of the remaining overnight culture of S.tm in an appropriate designated biosafety level 2 waste and wash and sterilize the 250 mL Erlenmeyer flask.
Incubate the culture at 37 °C for 1–2 h at 200 rpm in a shaking incubator.
-
Measure OD600 to check if S.tm reached 0.5:
Calibrate a photometer by measuring the blank with 500 μL of LB medium in a disposable cuvette.
Pipette 500 μL of the S.tm culture in a new disposable cuvette and measure.
-
S.tm reaches the optimal logarithmic growth phase when OD600 is between 0.5 and 0.7.
Note: If the OD600 value is below 0.5, continue the incubation of the culture in the 250 mL Erlenmeyer flask as described above until the OD600 value of 0.5 is reached. Of note, S.tm density duplicates every 20 min. If the OD600 value is above 0.7, dilute the culture 1:1 with LB medium and incubate the culture in the 250 mL Erlenmeyer flask until reaching an OD600 value of 0.5.
Transfer the culture into a 50 mL polypropylene tube or continue with counting of S.tm (Section G); keep the bacteria on ice for counting using the Casy counting system and afterwards until infection of the cells.
Centrifuge the S.tm culture at 5000× g for 5 min at room temperature.
Remove the supernatant by using a peristaltic pump.
Resuspend the pellet in 1 mL of freshly prepared LB medium with 30% glycerol (see Recipes).
Prepare 50 μL aliquots in 0.5 mL Eppendorf tubes.
Store the aliquots at -20 °C.
-
Counting of viable S.tm using a Casy counting system as described in Brigo et al. (2022)
Note: The setting up procedure and the programs used for the Casy counting system have been described in (Pfeifhofer-Obermair et al., 2022; Brigo et al., 2022). Alternatively, another method of counting/quantifying bacteria may be used (i.e., manual counting via microscopy).
Use the 45 μm capillary.
Measure the background by placing a new Casy cup with fresh 10 mL of Casy Ton buffer under the measuring unit.
Select the program for the background measurement.
Measure the background. It should be below 30 counts and 1 μm size. Otherwise, wash the system.
Prepare a new Casy cup with 10 mL of Casy Ton buffer and add 5 μL of S.tm OD600 0.5.
Shake gently.
Place the sample under the measuring unit.
Select the program for measuring between 1 and 3 μm.
Measure.
-
Click Next to get the number of viable counts/mL = viable S.tm /mL.
Note: Viable counts from a freshly prepared S.tm culture with an OD600 of 0.5 are between 2.5 × 10 8 and 3 × 10⁸ viable counts/mL.
-
Infection of the J774A.1 macrophage cell line with S.tm on a 12-well plate
Note: Perform the next steps in a sterile laminar flow cabinet.
Infect the desired wells with a cell density of 2.5 × 10⁵ cells with S.tm using a multiplicity of infection (MOI) of 10; therefore, 10 times more S.tm than cells are added to each well.
-
Example for calculation of S.tm:
To gain a MOI of 10, multiply the cell number × 10: 2.5 × 105 × 10 = 2.5 × 10⁶ .
Divide the calculated cell number against the gained viable Salmonella count (e.g., 2.5 × 10⁸ ):
2.5 × 10⁶ viable counts/mL: 2.5 × 10 8 viable counts/mL = 0.01 mL = 10 μL
Add the calculated amount of S.tm directly into the desired cell culture wells containing cell culture medium for infection with S.tm.
Incubate the cells for 1 h in a cell culture incubator (37 °C, 5% CO2, 95% relative humidity).
-
Gentamicin neutralization assay and continued treatment of the J774A.1 cell culture with iron
Pre-warm the medium and PBS in a water bath at 37 °C to avoid additional stress to the cells.
Remove the medium containing non-phagocytosed S.tm using a cell culture peristaltic pump.
Wash the cells twice with 1 mL of PBS + 25 μg/mL gentamicin.
Add 1 mL of DMEM supplemented with 1% FBS, 1% L-glutamine and 25 μg/mL gentamicin.
Treat the cells again with 50 μM FeCl3 [Iron (III) chloride solution] or leave them untreated.
Incubate the cells for up to 24 h in a cell culture incubator (37 °C, 5% CO2, 95% relative humidity).
-
Staining of the J774A.1 cells with FerroOrange
Thaw an aliquot of FerroOrange.
Prepare staining solution (see Recipes).
Remove the cell culture media using a peristaltic pump.
Gently wash the cells twice with 1 mL of PBS.
Remove the PBS using a peristaltic pump.
Add 200 μL of the prepared staining solution into each cell culture well.
Incubate the cells for 30 min in a cell incubator at 37 °C with 5% CO2 and 95% humidity as growth conditions.
Place the 12-well plate into a preheated and pre-set 5% CO2 Spark plate reader.
-
Setup of the Spark plate reader
A captured image of the setup screen is displayed below (Figure 2).
Open the Spark plate reader method editor.
-
Select a 12-well plate.
Note: Select the correct model of a 12-well plate, depending on its commercial source, to avoid inaccurate measurements in “bottom read mode” and to avoid damaging the detector.
Select measurement Fluorescence Intensity.
Set the instrument temperature to 37 °C.
Set the CO2 flow to 5%.
Change the Mode to Bottom for fluorescence intensity bottom reading.
Change the Fluorophore Setting to other.
-
Set the fluorophore parameters to:
Monochromator 540 nm excitation; bandwidth 20 nm.
Monochromator 585 nm emission; bandwidth 20 nm.
Leave Flashes at 30.
Change the gain to manual and use 140.
-
Set the z-position to manual.
Note: The z-position can be calibrated right before the measurement and changed if needed.
-
Select multiple reads per well:
User defined.
Type: filled circles (4 × 4).
Border: 1450.
Save the setup.
Open Spark plate reader control.
Load the FerroOrange measurement setup.
Confirm that the temperature is at 37 °C and CO2 is at 5%.
Place the 12-well plate into the spark plate reader.
-
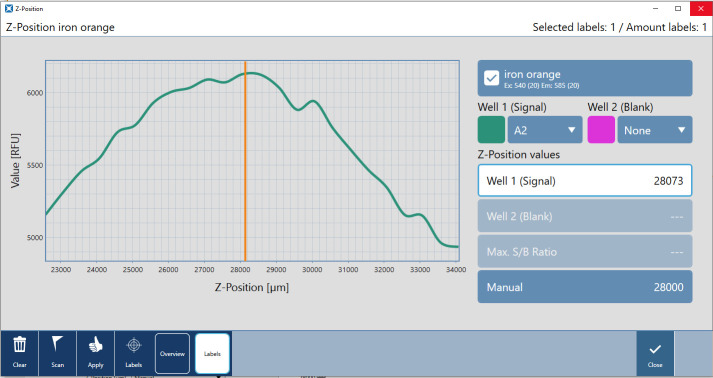
Calibrate the z-position in the machine (Figure 3):
Select z-position in the menu on the bottom left.
In the Scan sub-menu, select wells for signal detection.
Click the Scan button on the bottom left.
In the resulting graph, signal strength for different z-positions is visible.
Note: The z-position determines how far apart the measuring device is from the microplate's surface. You can change it by moving the plate up and down. When light bounces off the liquid on the sample, adjusting the Z-position helps to maximize signal-to-noise ratio.
Apply automatically suggested z-position to the entire plate or enter a manual value.
Click Start.
After the measurement is completed, an Excel file will open automatically.
Save this file and proceed to data analysis.
Figure 1. Timeline and 12-well plate layout of the experimental procedure described in this protocol.
A. Timeline of the experimental procedure depicting distinct experimental phases. B. 12-well plate layout depicting the arrangement of treatments and replicates used in this protocol.
Figure 2. Screenshot of Spark plate reader method editor setup.
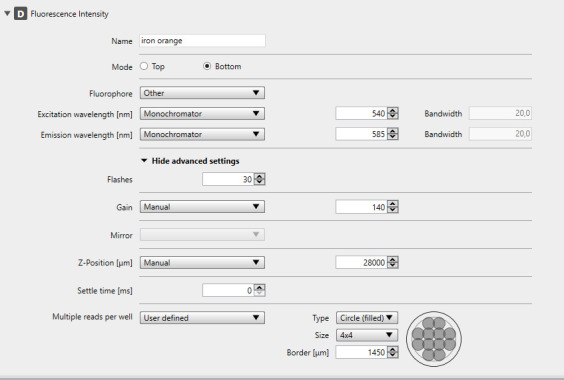
Figure 3. Screenshot of Spark plate reader calibrating the z-position.
In the z-position panel of the SparkControlTM software, the user is able to measure the signal strength (x-axis) over multiple z-positions (y-axis) to determine the optimal z-position for the assay.
Data analysis
Open the generated Excel file. The Excel file shows all the performed actions in the experimental setup.
Scroll down until the measured data shows up.
Each individual measurement of the 4 × 4 multiple reads per well is shown in the table. The position of each individual measurement is displayed in a map, also found in the Excel file (see Figure 4).
In the table, in the lines below the assay information (i.e., time and temperature), the mean and standard deviation of all individual measurements of one well are displayed (exemplary output Excel available under the Validation section below).
Open GraphPad Prism.
Select a column graph in GraphPad Prism.
Label the columns according to the groups.
Add the technical replicates of each group into each column.
Check the graph.
Label the y-axis as fluorescent intensity of FerroOrange.
-
Label the x-axis as 24 h stimulation.
Note: An example graph of the measured 24 h time point is shown in Figure 5.
Figure 4. Position of the multiple reads per well as found in the Excel table (left) and an illustration of multiple measurements in one well (right).
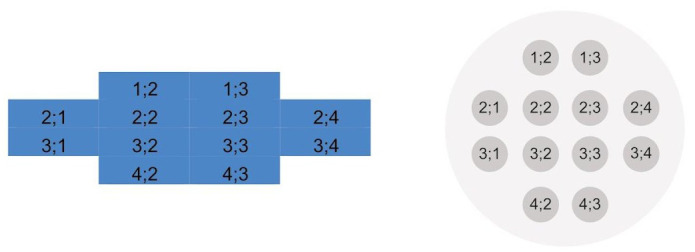
Reprinted from Brigo et al. (2023).
Figure 5. Fluorescent intensity of FerroOrange after 24 h of iron treatment with or without infection.
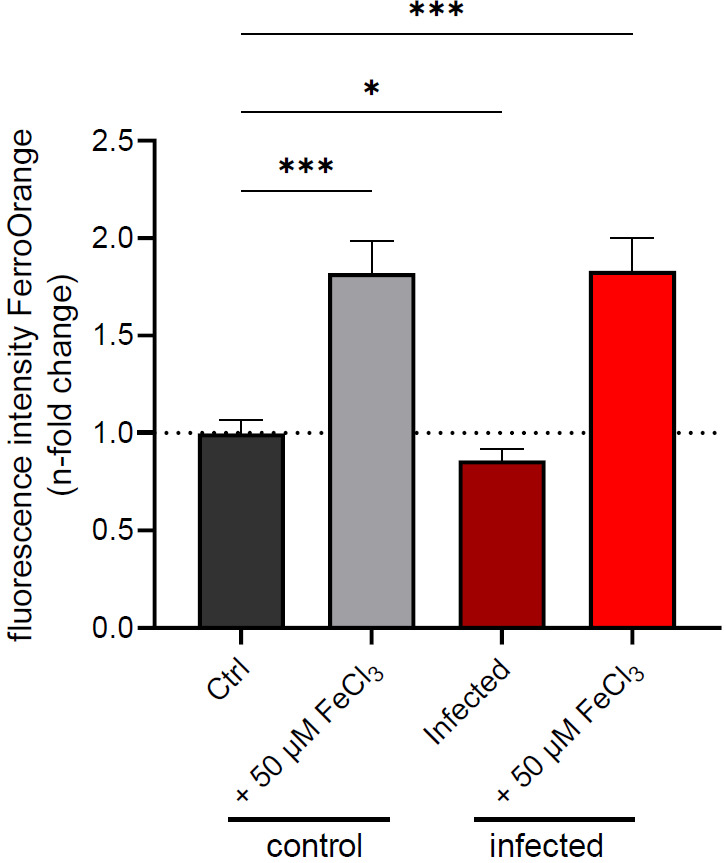
Data from three experiments, done in triplicates (n = 9), are shown as mean fluorescent intensity ± SD, normalized to uninfected control conditions (dashed line). * denotes p < 0.05 and *** denotes p < 0.001, as evaluated by one-way ANOVA.
General notes and troubleshooting
General notes
Here exemplified in an infection model of the macrophage cell line J774A.1, this protocol may be applied to other macrophage models like bone marrow–derived macrophages or the human THP-1 cell line.
As the manufacturer implies in the technical information sheet (DOJINDO, product code F374), FerroOrange fluorescence intensity may be observed and quantified using a confocal fluorescence microscope (Cy3-channel) or flow cytometer (Weber et al., 2020). To the best of our knowledge, the FerroOrange dye is not fixable.
Troubleshooting
Potential problems include low signal, implausible measurements, or inappropriate variance between replicates or individual experiments. To counteract this, assay details should be verified: cells should be seeded uniformly in the well. Although this protocol suggests multiple measurements per well, a homogeneous distribution of cells will allow most consistent measurements. The correct z-position of the 12-well plate is vital for optimal signal-to-noise ratio. This calibrated z-position may need to be changed if 12-well plates from other manufacturers are used. As FerroOrange is time and light sensitive, accurate results may only be obtained with fresh staining aliquots thawed and used immediately. At last, as FerroOrange may leak out of cells, the medium should not be changed before the measurement.
Validation of protocol
This protocol was adapted and modified after Grubwieser et al. (2023).
For this protocol, we used a 12-well plate layout as illustrated in Figure 1. This enabled simultaneous measurement of three technical replicates (wells) for each experimental condition. Furthermore, the experiment was repeated independently three times, to increase the robustness of findings (Figure 5). An exemplary output Excel file of one experiment is shown in Figure 6 .
Figure 6. Exemplary output Excel file of one experiment.
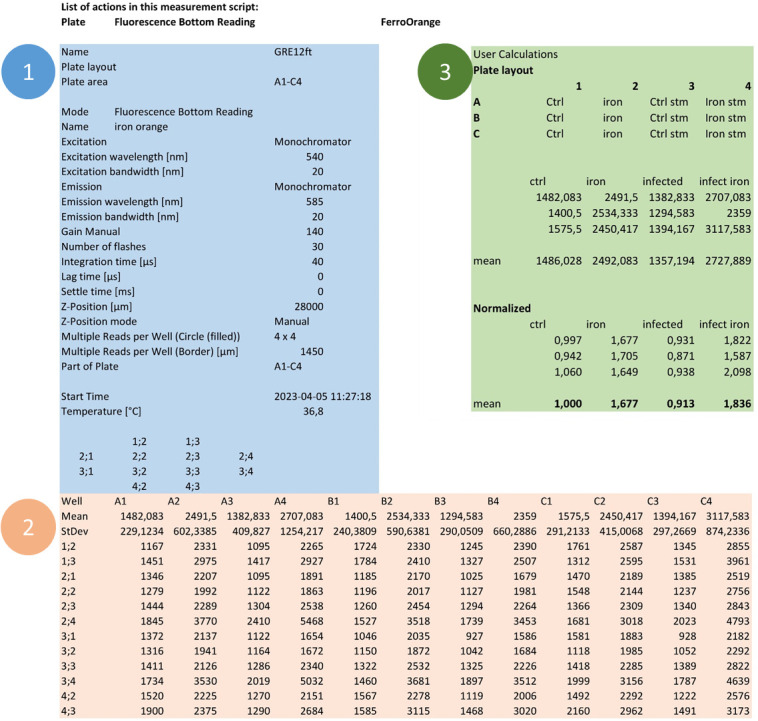
In the output Excel file, details of the performed measurement are listed (panel 1, blue). Beneath, the result table shows data from multiple measurements (panel 2, orange). The experimental conditions and user calculations are depicted in panel 3 (green).
Acknowledgments
G.W. is supported by grants from the Christian Doppler Society and the Austrian research Funds (FWF doctoral program W1253 HOROS; and FWF, DOC 82 doc.fund). P.G. and I.T. were supported by the Austrian Science Fund (FWF, DOC 82 doc.fund). N.B. was supported by FWF doctoral program - W1253 HOROS. M.N. was funded by the Austrian Science Fund (FWF, P33062). This protocol has been used in Grubwieser et al., 2023.
Competing interests
The authors declare no conflicts of interest.
Citation
Readers should cite both the Bio-protocol article and the original research article where this protocol was used.
Q&A
Post your question about this protocol in Q&A and get help from the authors of the protocol and some of its users.
References
- 1.Abreu R., Essler L., Giri P. and Quinn F. (2020). Interferon-gamma promotes iron export in human macrophages to limit intracellular bacterial replication. PLoS One 15(12): e0240949 [DOI] [PMC free article] [PubMed] [Google Scholar]
- 2.Brigo N., Grubwieser P., Theurl I., Nairz M., Weiss G. and Pfeifhofer-Obermair C. (2023). Continuous Measurement of Reactive Oxygen Species Formation in Bacteria-infected Bone Marrow–derived Macrophages Using a Fluorescence Plate Reader. Bio Protoc 13(3): e4604. [DOI] [PMC free article] [PubMed] [Google Scholar]
- 3.Brigo N., Pfeifhofer-Obermair C., Demetz E., Tymoszuk P. and Weiss G. (2022). Flow Cytometric Characterization of Macrophages Infected in vitro with Salmonella enterica Serovar Typhimurium Expressing Red Fluorescent Protein. Bio Protoc 12(11): e4440 . [DOI] [PMC free article] [PubMed] [Google Scholar]
- 4.Chlosta S., Fishman D. S., Harrington L., Johnson E. E., Knutson M. D., Wessling-Resnick M. and Cherayil B. J. (2006). The Iron Efflux Protein Ferroportin Regulates the Intracellular Growth of Salmonella enterica . Infect. Immun. 74(5): 3065-3067. [DOI] [PMC free article] [PubMed] [Google Scholar]
- 5.Cronin S. J. F., Woolf C. J., Weiss G. and Penninger J. M. (2019). The Role of Iron Regulation in Immunometabolism and Immune-Related Disease. Front. Mol. Biosci. 6: e00116. [DOI] [PMC free article] [PubMed] [Google Scholar]
- 6.Fields P. I., Swanson R. V., Haidaris C. G. and Heffron F. (1986). Mutants of Salmonella typhimurium that cannot survive within the macrophage are avirulent . Proc. Natl. Acad. Sci. U.S.A. 83(14 ): 5189-5193. [DOI] [PMC free article] [PubMed] [Google Scholar]
- 7.Forbes J. R. and Gros P. (2003). Iron, manganese, and cobalt transport by Nramp1(Slc11a1) and Nramp2(Slc11a2) expressed at the plasma membrane . Blood 102(5): 1884 -1892. [DOI] [PubMed] [Google Scholar]
- 8.Fritsche G., Nairz M., Libby S. J., Fang F. C. and Weiss G. (2012). Slc11a1(Nramp1) impairs growth of Salmonella enterica serovar typhimurium in macrophages via stimulation of lipocalin-2 expression. J. Leukocyte Biol . 92(2): 353-359. [DOI] [PMC free article] [PubMed] [Google Scholar]
- 9.Grander M., Hoffmann A., Seifert M., Demetz E., Grubwieser P., Pfeifhofer-Obermair C., Haschka D. and Weiss G. (2022). DMT1 Protects Macrophages from Salmonella Infection by Controlling Cellular Iron Turnover and Lipocalin 2 Expression. Int. J. Mol. Sci. 23(12): 6789. [DOI] [PMC free article] [PubMed] [Google Scholar]
- 10.Grubwieser P., Hilbe R., Gehrer C. M., Grander M., Brigo N., Hoffmann A., Seifert M., Berger S., Theurl I., Nairz M., et al. .(2023). Klebsiella pneumoniae manipulates human macrophages to acquire iron. Front. Microbiol. 14: e1223113. [DOI] [PMC free article] [PubMed] [Google Scholar]
- 11.Hentze M. W., Muckenthaler M. U., Galy B. and Camaschella C. (2010). Two to Tango: Regulation of Mammalian Iron Metabolism. Cell 142(1 ): 24-38. [DOI] [PubMed] [Google Scholar]
- 12.Hirayama T., Niwa M., Hirosawa S. and Nagasawa H. (2020). High-Throughput Screening for the Discovery of Iron Homeostasis Modulators Using an Extremely Sensitive Fluorescent Probe . ACS Sens. 5(9): 2950 -2958. [DOI] [PubMed] [Google Scholar]
- 13.Kao J. K., Wang S. C., Ho L. W., Huang S. W., Chang S. H., Yang R. C., Ke Y. Y., Wu C. Y., Wang J. Y., Shieh J. J., et al. .(2016). Chronic Iron Overload Results in Impaired Bacterial Killing of THP-1 Derived Macrophage through the Inhibition of Lysosomal Acidification. PLoS One 11 (5): e0156713. [DOI] [PMC free article] [PubMed] [Google Scholar]
- 14.Khan F. A., Fisher M. A. and Khakoo R. A. (2007). Association of hemochromatosis with infectious diseases: expanding spectrum. Int. J. Infect. Dis. 11(6): 482- 487. [DOI] [PubMed] [Google Scholar]
- 15.Leung K. Y. and Finlay B. B. (1991). Intracellular replication is essential for the virulence of Salmonella typhimurium. Proc. Natl. Acad. Sci. U.S.A. 88(24): 11470-11474. [DOI] [PMC free article] [PubMed] [Google Scholar]
- 16.Lim D., Kim K. S., Jeong J. H., Marques O., kim H. J., Song M., Lee T. H., Kim J. I., Choi H. S., Min J. J., et al. .(2018). The hepcidin-ferroportin axis controls the iron content of Salmonella-containing vacuoles in macrophages. Nat. Commun. 9(1): e1038/s41467–018–04446–8 . [DOI] [PMC free article] [PubMed] [Google Scholar]
- 17.Liss V., Swart A. L., Kehl A., Hermanns N., Zhang Y., Chikkaballi D., Böhles N., Deiwick J. and Hensel M. (2017). Salmonella enterica Remodels the Host Cell Endosomal System for Efficient Intravacuolar Nutrition . Cell Host& Microbe 21(3): 390-402. [DOI] [PubMed] [Google Scholar]
- 18.Moroishi T., Nishiyama M., Takeda Y., Iwai K. and Nakayama K. I. (2011). The FBXL5-IRP2 Axis Is Integral to Control of Iron Metabolism In Vivo. Cell Metab. 14(3): 339-351. [DOI] [PubMed] [Google Scholar]
- 19.Murdoch C. C. and Skaar E. P. (2022). Nutritional immunity: the battle for nutrient metals at the host–pathogen interface. Nat. Rev. Microbiol. 20(11): 657 -670. [DOI] [PMC free article] [PubMed] [Google Scholar]
- 20.Nairz M., Fritsche G., Brunner P., Talasz H., Hantke K. and Weiss G. (2008). Interferon‐γ limits the availability of iron for intramacrophage Salmonella typhimurium . Eur. J. Immunol. 38(7): 1923-1936. [DOI] [PubMed] [Google Scholar]
- 21.Nairz M., Theurl I., Ludwiczek S., Theurl M., Mair S. M., Fritsche G. and Weiss G. (2007). The co-ordinated regulation of iron homeostasis in murine macrophages limits the availability of iron for intracellular Salmonella typhimurium. Cell. Microbiol. 9(9): 2126- 2140. [DOI] [PubMed] [Google Scholar]
- 22.Nemeth E., Tuttle M. S., Powelson J., Vaughn M. B., Donovan A., Ward D. M., Ganz T. and Kaplan J. (2004). Hepcidin Regulates Cellular Iron Efflux by Binding to Ferroportin and Inducing Its Internalization. Science 306(5704): 2090- 2093. [DOI] [PubMed] [Google Scholar]
- 23.Pfeifhofer C., Brigo N., Tymoszuk P. and Weiss G. (2022). A Mouse Infection Model with a Wildtype Salmonella enterica Serovar Typhimurium Strain for the Analysis of Inflammatory Innate Immune Cells. Bio Protoc 12(7): e4378. [DOI] [PMC free article] [PubMed] [Google Scholar]
- 24.Porto G. and De Sousa M. (2007). Iron overload and immunity. World J. Gastroenterol. 13(35): 4707. [DOI] [PMC free article] [PubMed] [Google Scholar]
- 25.Stanaway J. D., Reiner R. C., Blacker B. F., Goldberg E. M., Khalil I. A., Troeger C. E., Andrews J. R., Bhutta Z. A., Crump J. A., Im J., et al. .(2019). The global burden of typhoid and paratyphoid fevers: a systematic analysis for the Global Burden of Disease Study 2017. Lancet Infect Dis. 19(4): 369-381. [DOI] [PMC free article] [PubMed] [Google Scholar]
- 26.Tenopoulou M., Kurz T., Doulias P. T., Galaris D. and Brunk U. T. (2007). Does the calcein-AM method assay the total cellular‘labile iron pool’ or only a fraction of it? Biochem. J. 403(2): 261- 266. [DOI] [PMC free article] [PubMed] [Google Scholar]
- 27.Wang J. and Pantopoulos K. (2011). Regulation of cellular iron metabolism . Biochem. J. 434(3): 365-381. [DOI] [PMC free article] [PubMed] [Google Scholar]
- 28.Weber R. A., Yen F. S., Nicholson S. P., Alwaseem H., Bayraktar E. C., Alam M., Timson R. C., La K., Abu-Remaileh M., Molina H., et al. .(2020). Maintaining Iron Homeostasis Is the Key Role of Lysosomal Acidity for Cell Proliferation. Mol. Cell 77(3): 645–655..e7. [DOI] [PMC free article] [PubMed] [Google Scholar]
- 29.Weiss G. and Schaible U. E. (2015). Macrophage defense mechanisms against intracellular bacteria. Immunol. Rev. 264(1): 182-203. [DOI] [PMC free article] [PubMed] [Google Scholar]
- 30.Wessling-Resnick M. (2015). Nramp1 and Other Transporters Involved in Metal Withholding during Infection. J. Biol. Chem . 290(31): 18984-18990 . [DOI] [PMC free article] [PubMed] [Google Scholar]


