

Abstract
We investigated the relationship between bacterioplankton production (BP), respiration (BR), and community composition measured by terminal restriction fragment length polymorphism in the southern North Sea over a seasonal cycle. Major changes in bacterioplankton richness were apparent from April to December. While cell-specific BP decreased highly significantly with increasing bacterioplankton richness, cell-specific BR was found to be variable along the richness gradient, suggesting that bacterioplankton respiration is rather independent from shifts in the bacterial community composition. As a consequence, the bacterial growth efficiency [BGE = BP/(BP + BR)] was negatively related to bacterioplankton richness, explaining ∼43% of the variation in BGE. Our results indicate that despite the observed shifts in the community composition, the main function of the bacterioplankton, the remineralization of dissolved organic carbon to CO2, is rather stable.
Marine dissolved organic carbon (DOC) is, besides soil humus, the largest organic carbon reservoir in the Earth's biosphere. The fate of this DOC pool is mainly determined by the activity of heterotrophic bacteria, which act as a link or sink of DOC for higher trophic levels of the food web. Thus, the production of biomass and the remineralization of DOC to CO2 are the two key processes in the transformation of DOC by heterotrophic bacteria (15, 43). The relationship between these two processes determines the bacterial growth yield. In natural systems, bacterioplankton growth yields range from <5 to >60% (12, 13). This large variation in bacterial growth yield in natural bacterial communities is mainly caused by variations in substrate availability and is mediated, to a lesser extent, by temperature, although Rivkin and Legendre (43) suggested a direct relationship between temperature and the bacterial growth yield. This relationship only holds for a large temperature range and is not applicable to individual systems such as the North Sea, where seasonal temperature fluctuations are in the range of only 10 to 15°C (41, 44).
The extent to which variations in bacterial growth yield, and particularly in respiration, are related to shifts in the bacterioplankton community composition has not been studied in detail yet. Thus, the link between the phylogenetic composition of the bacterioplankton community and its major function in carbon cycling, i.e., the remineralization of DOC, is unclear, although shifts in the bacterioplankton community composition on a seasonal scale have been reported and related to the occurrence of specific phytoplankton blooms (1). Consequently, microbial communities may respond to changing environmental conditions with physiological adaptation or by shifts in the community composition (2, 11, 37, 54).
Naeem and Li (35) and Morin and McGrady-Steed (34) presented evidence that species loss changes important aspects of ecosystem functioning. In mesocosm experiments, increased biodiversity decreased the variation in the measured CO2 flux (30). However, experiments linking biodiversity with ecosystem functioning are usually performed with the aim to maximize experimental control and therefore are likely to miss the spatial and temporal heterogeneity in natural environments (reference 5 and references therein).
For this study, we tested the hypothesis that bacterial production and respiration are largely independent of the bacterioplankton community composition. For this purpose, we conducted six cruises in the southern North Sea, covering a full seasonal cycle. We measured bacterial production (BP), bacterial respiration (BR), and the bacterial community composition by terminal restriction fragment length polymorphism (T-RFLP) and compared the patterns of bacterioplankton richness with these bacterial activity measurements.
MATERIALS AND METHODS
Study site.
Six cruises were conducted with the RV Pelagia between July 2000 and June 2001 in the southern North Sea (Fig. 1), occupying a total of 106 stations. For this study, only the core stations between 52°N and 54°N and between 2°E and 5°E were considered (74 stations). Water samples were obtained from a 5-m depth with 10-liter NOEX bottles mounted on a conductivity-temperature-depth rosette sampler. During most of the cruises, the shallow water column (maximum depth of 35 m) was well mixed, and stratification of the water column was only observed during the cruises in the summer months (June to September). Thus, the data presented below are representative of the entire water column during most of the year and of the upper mixed layer during the summer months.
FIG. 1.

Map of study area. Dots indicate the individual stations occupied during the six cruises. The months of sampling are indicated with different symbols.
Bacterial abundance.
Five-milliliter samples were fixed with 37% formaldehyde (4% final concentration), stained with 4′,6′-diamidino-2-phenylindole (DAPI), and subsequently placed immediately onto 0.2-μm-pore-size black polycarbonate filters (Millipore). The filters were mounted on glass slides, covered with coverslips, and stored at −20°C in the dark until analysis. The bacterial abundance was determined by epifluorescence microscopy (39) within a week after each cruise.
Bacterial production.
Bacterial production in the 0.8-μm-pore-size filtered seawater was measured by [14C]leucine incorporation (specific activity, 0.295 Ci mmol−1; final concentration, 10 nmol liter−1). Two samples and one blank were incubated in the dark. The blank was fixed immediately with concentrated formaldehyde (final concentration, 4% [vol/vol]) 10 min prior to adding the tracer. After incubation of the samples and the blank at the in situ temperature for 60 min, the samples were fixed with formaldehyde (4% final concentration), filtered with 0.45-μm nitrocellulose filters (25-mm diameter; Millipore HA), and rinsed twice with 5 ml ice-cold 5% trichloroacetic acid (Sigma Chemicals) for 5 min. The filters were dissolved in 1 ml ethyl acetate, and after 10 min, 8 ml of scintillation cocktail (Insta-Gel Plus; Canberra Packard) was added. The radioactivity incorporated into bacterial cells was counted in a liquid scintillation counter (model 1212; LKB Wallac). The amount of leucine incorporated into the bacterial biomass was converted to carbon production by using the empirical conversion factor 0.07 × 10¹⁸ cells mol−1 Leu (42) and assuming a C content of Bacteria of 20 fg C cell−1 (25). Applying this conversion factor resulted in bacterial production estimates similar to the theoretical factor of 1.55 kg C mol−1 Leu, assuming there was no isotope dilution (48; data not shown). In the text below, the abbreviation BP is used for bacterioplankton production measured in filtered (0.8 μm) seawater.
Bacterial respiration.
The filtrate (filtered through a 0.8-μm filter) was carefully transferred to calibrated borosilicate glass BOD bottles with a nominal volume of 120 ml by a sipper system to avoid the introduction of air bubbles. For determinations of the initial O2 concentration (T0), samples were fixed immediately with Winkler reagents and incubated together with the live samples in a water bath in the dark at the in situ temperature (±1°C) for 12 to 24 h, after which the incubations were terminated (T1). Triplicate bottles were used for determinations of the initial and final O2 concentrations. All glassware was washed with 10% HCl and thoroughly rinsed with Milli-Q water prior to use. The oxygen concentrations in the T0 and T1 sample bottles were measured spectrophotometrically in one run (36, 45), essentially according to the standard protocol for the determination of oxygen by Winkler titration (7). The amount of total iodine was determined at a wavelength of 456 nm. Measurements were done at 20°C on a Hitachi U-1100 spectrophotometer using a 1-cm flowthrough cuvette. To increase the sensitivity of the absorbance readings, we connected a four-digit voltmeter (Metex M4650) to the spectrophotometer. Calibration was performed by standard additions of iodate to distilled water, resulting in an empirical coefficient of 0.54455 nM cm−1 (G. Kraay, personal communication). The samples were withdrawn from the BOD bottles with a Teflon tube and a peristaltic pump (Gilson Minipuls) and directly fed to the flowthrough cuvette of the spectrophotometer. The end of the tube was placed near the bottom of the bottles to avoid a possible loss of volatile iodine. The spectrophotometer was zeroed against Milli-Q water. The coefficient of variation of the oxygen determinations was <0.5%.
T-RFLP sampling and analysis.
A total of 19 liters of seawater was filtered through 0.8-μm-pore-size filters (Isopore ATTP, 142-mm diameter; Millipore), using a stainless steel filter holder and an air pressure pump, to exclude most of the nonbacterioplankton particles from the analysis. The bacterioplankton fraction (<0.8 μm) was concentrated to a final volume of 400 to 550 ml by tangential-flow filtration with a 0.22-μm-pore-size filter cassette (Pellicon PTGVPPC05; Millipore). Subsequently, the bacterial concentrate was filtered onto 0.22-μm-pore-size filters (Isopore GVWP, 100-mm diameter; Millipore) and the filters were frozen in liquid nitrogen and subsequently stored at −80°C until further processing in the lab. The filtration units were thoroughly rinsed with sample water prior to use and soaked in 1 N HCl between samplings.
Extraction of the nucleic acids from the filters was performed as previously described. Briefly, four freeze-thaw cycles (−196°C to 37°C) and a subsequent treatment with lysozyme (Sigma) and proteinase K (Fluka) in 1% sodium dodecyl sulfate were conducted. The liquid phase was extracted with a mixture of phenol, chloroform, and isoamyl alcohol and the nucleic acids were precipitated with ethanol overnight at −20°C (52). The resulting pellet was redissolved in 100 μl ultrapure water (Sigma). The nucleic acids in 50 μl of this solution were further purified by use of a QIAEX II gel extraction kit (QIAGEN) as recommended by the manufacturer for DNA fragments larger than 10 kbp. The nucleic acids were recovered in a final volume of 20 μl of elution buffer (QIAGEN) and used for subsequent PCR amplification. The integrity of the DNA was checked by agarose gel electrophoresis.
PCR conditions and chemicals were applied as described by Moeseneder et al. (33). Briefly, 1 to 2 μl of the cleaned nucleic acid extract was used as a template in a 50-μl PCR mixture. The Bacteria-specific primer 27F and the universal primer 1492R (24) were used to amplify a ca. 1,480-bp fragment of the bacterial 16S rRNA gene. The forward primer was fluorescently 5′ end labeled with the phosphoramidite fluorochrome 5-carboxy-fluorescein, and the reverse primer was labeled with 6-carboxy-4′,5′-dichloro-2′,7′-dimethoxyfluorescein (both from Interactiva, Germany). After PCR amplification, excess fluorescently labeled primers were removed by ethanol precipitation and subsequent gel purification in a 1% agarose gel using 6-carboxytetramethylrhodamine loading dye (Perkin Elmer-Applied Biosystems). The PCR fragments were recovered from the gel with a QIAquick gel extraction kit (QIAGEN) in a final volume of 20 μl of elution buffer (QIAGEN). The concentrations of the PCR fragments were estimated with a 1% agarose gel containing a standard (Smart-Ladder; Eurogentec).
Restriction digestion of 50 ng of the purified PCR fragments was performed with 20 U of the restriction enzyme HhaI together with the recommended buffer (both from Amersham Pharmacia) in a total volume of 100 μl. Restriction was performed at 37°C for 12 h to ensure complete digestion. The DNA fragments from the restriction digests were recovered in a final volume of 2 μl ultrapure water (Sigma) by linear polyacrylamide precipitation (32). T-RFLP analysis was performed on an automated capillary sequencer (ABI Prism 310; Perkin Elmer-Applied Biosystems) as previously described (33).
Statistical analyses.
The T-RFLP patterns were analyzed by recording the number of peaks (presence versus absence). Due to the variability in the discriminative power of the forward and the reverse primers, subsequent analysis was performed on the combined data set from both primers, serving as a relative measure of bacterial community richness (32).
The similarities of the T-RFLP patterns between the different stations were assessed with the Bray-Curtis similarity index, which is similar to Sorenson's similarity index when applied to presence/absence data (8). The resulting similarity matrix was assessed by nonparametric multidimensional scaling (MDS), which is a powerful tool for assessing community profiles obtained by molecular fingerprinting techniques (26, 46, 53). For MDS analysis, the recommendations of Clarke and Warwick (8) were followed. With MDS, the complexity of a given similarity matrix is reduced by plotting the data two-dimensionally. The more similar the samples are, the closer they appear in the plot. The stress factor is an indication of the goodness of fit of the raw versus plotted data, with values of <0.1 representing a good ordination of the similarity matrix with little risk of misinterpretation. Higher stress factors were checked by cluster analysis.
Dendrograms of the obtained T-RFLP patterns were constructed by using either the Bray-Curtis similarity matrix or the bootstrapped Jaccard or Simple Match similarity matrix calculated from the same data set. Clusters were constructed with the unweighted-pair group method using average linkages. MDS calculations were done with the software package Primer 5 from Primer-E, and other statistical analyses were done with the software package Statistica from Statsoft.
DOC measurement.
Samples for DOC measurements were filtered through rinsed 0.2-μm polycarbonate filters and sealed in combusted (450°C for 4 h) glass ampoules after the addition of 50 μl of 40% phosphoric acid. Subsequently, the samples were stored frozen at −20°C. DOC concentrations were determined by the high-temperature combustion method using a Shimadzu TOC-5000 analyzer (4). Standards were prepared with potassium hydrogen phthalate (Nacalai Tesque, Inc., Kyoto, Japan). Ultrapure Milli-Q blanks were run before and after the sample analysis. The blank value was, on average, 16.3 ± 6.8 μM, and the mean of triplicate injections was calculated for each sample. The average analytical precision of the instrument was <3%.
Chl a measurement.
One-liter samples were gently filtered through 47-mm Whatman GF/F filters and stored at −60°C until analysis within 4 weeks. Chlorophyll a (Chl a) was extracted in 10 ml of 90% acetone at −40°C in the dark for 48 h. Subsequently, the filters were sonicated on ice for 1 min (Branson model 3200) and centrifuged to remove particles. The Chl a concentration in the supernatant was determined fluorometrically with a Hitachi F-2000 fluorometer (21).
RESULTS
Bacterial abundance and production in 0.8-μm-filtered and unfiltered seawater fractions.
The total bacterial abundance (BA) and bacterial production (BP) were significantly correlated with the respective 0.8-μm-filtered fraction (Spearman rank correlation; r = 0.69 for BA and r = 0.84 for BP; P < 0.01; n = 74 for both) (data not shown). Filtration through 0.8-μm filters reduced the BA and BP ∼40% ± 20% compared to unfiltered seawater samples.
Seasonal dynamics in physicochemical parameters.
Low salinity values were recorded in April but varied only within a rather narrow range during the rest of the year. The temperature changed significantly between months (least significant difference test; P < 0.05), with the lowest temperatures in spring and winter and an average maximum temperature in September. Monthly averages for DOC concentrations showed no clear pattern and varied around an annual average of 137 ± 69 mmol C m−3. Chl a concentrations peaked in April and September and were low during the other months (Table 1).
TABLE 1.
Monthly means and SD for selected physicochemical and biological parameters of the southern North Sea
| Month | Salinity (practical salinity units)
|
T (°C)
|
DOC (mmol C m−3)
|
Chl a (mg m−3)
|
BA (cells [106 ml−1])
|
BPb (mmol C m−3 day−1)
|
BRb (mmol C m−3 day−1)
|
BGE (%)
|
No. of stations | ||||||||
|---|---|---|---|---|---|---|---|---|---|---|---|---|---|---|---|---|---|
| Mean | SD | Mean | SD | Mean | SD | Mean | SD | Mean | SD | Mean | SD | Mean | SD | Mean | SD | ||
| April | 32.3 | 1.1 | 9.7 | 0.3 | 98.4 | 22.9 | 6.6 | 1.8 | 1.0 | 0.4 | 1.75 | 0.71 | 2.4 | 0.9 | 42 | 5 | 6 |
| June | 34.0 | 0.2 | 12.2 | 0.3 | 173.8 | 76.2 | 1.7 | 0.8 | 1.0 | 0.7 | 0.53 | 0.17 | 1.6 | 1.1 | 25 | 12 | 13 |
| July | 34.7 | 0.3 | 14.9 | 0.2 | 96.0 | 22.7 | 1.3 | 0.8 | 1.2 | 0.7 | 0.44 | 0.15 | 1.7 | 0.9 | 24 | 13 | 15 |
| September | 34.3 | 0.2 | 17.0 | 0.3 | 129.1 | 73.7 | 2.2 | 1.2 | 1.2 | 0.4 | 0.22 | 0.18 | 1.6 | 1.0 | 15 | 13 | 13 |
| October | 34.5 | 0.3 | 13.6 | 0.9 | 137.7 | 40.9 | 1.3 | 0.4 | 0.8 | 0.3 | 0.13 | 0.08 | 0.7 | 0.5 | 18 | 10 | 19 |
| December | 34.7 | 0.4 | 10.6 | 0.7 | 186.8 | 116.0 | 0.8 | 0.2 | 0.6 | 0.1 | 0.03 | 0.02 | 0.8 | 0.7 | 5 | 2 | 8 |
| Alla | 34.2 | 0.8 | 13.6 | 2.3 | 137.3 | 69.2 | 1.7 | 1.5 | 1.0 | 0.5 | 0.40 | 0.49 | 1.4 | 1.0 | 21 | 14 | 74 |
Grand average over the seasonal cycle, calculated from the raw data.
Units are mmol C m−3 day−3.
Seasonal dynamics in microbiological parameters.
The mean BA was ∼1.0 × 10⁶ ± 0.5 × 10⁶ ml−1. BP decreased significantly from the late spring towards the winter (least significant difference test; P < 0.0001). The highest BP level was measured in April, with 1.7 mmol C m−3 day−1, while in December, BP was only 0.03 mmol C m−3 day−1. BR was variable over the seasonal cycle, with an average of 1.4 ± 1.0 mmol C m−3 day−1. Bacterial growth efficiencies (BGEs) ranged from 42% in April to 5% in December, with an overall average of ∼21% ± 14% (Table 1). Monthly averages in BGEs were variable but decreased significantly overall from spring to winter (analysis of variance [ANOVA]; P < 0.05).
Spatial versus seasonal heterogeneity in the richness of the bacterial community.
As indicated by the dendrogram based on the Bray-Curtis similarity index (Fig. 2), bacterial communities were more closely related within individual months than between different months. An MDS plot highlights the seasonal heterogeneity of the bacterial community, but spatial dissimilarities are also visible (Fig. 3). Major changes in the bacterioplankton community composition from April to June were apparent, while between July and December these changes were much smaller (Fig. 3).
FIG. 2.
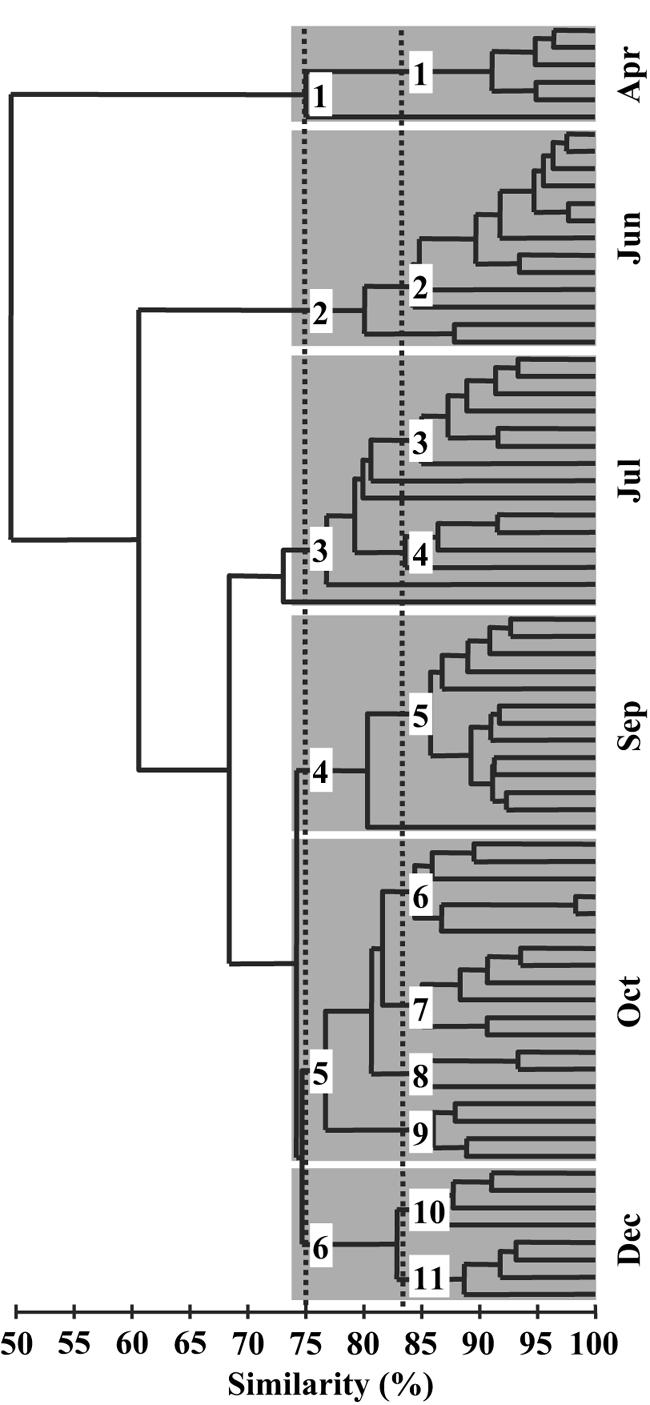
Cluster analysis of T-RFLP patterns from an annual cycle in the southern North Sea by the unweighted-pair group method using average linkages. The distance matrix was calculated by using the Bray-Curtis similarity index. The main groups are shaded and correspond to the months of sampling, and the branches represent stations. Subgroups are indicated with dotted lines for relative similarities of 75 and 83%. Numbers next to the lines denote the groups used for the analysis depicted in Fig. 7.
FIG. 3.
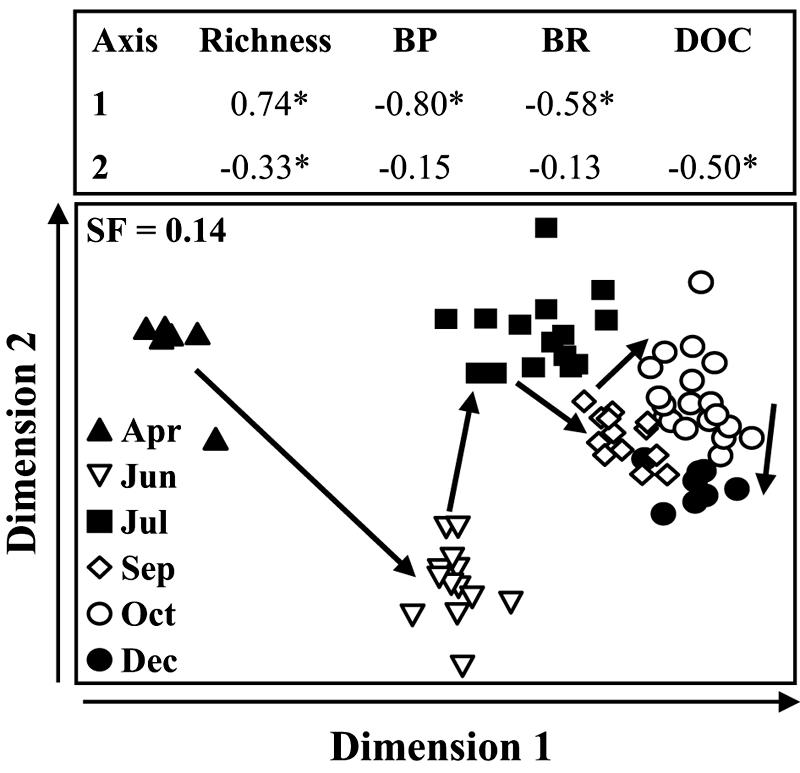
Two-dimensional MDS plot of T-RFLP patterns of the bacterioplankton community of the southern North Sea. The configuration found by MDS was based on a Bray-Curtis similarity matrix for the bacterial richness between the stations. The months are indicated by different symbols. The arrows inside the panel indicate the seasonal sequence from spring to winter. The arrows on dimensions 1 and 2 indicate the directions in which scores increase. Spearman rank correlations were calculated between the scores of the dimension found for the different stations and bacterial richness, bacterial production (BP), bacterial respiration (BR), chlorophyll a (Chl a), dissolved organic carbon (DOC), and temperature (T). SF, stress factor; *, P < 0.01.
Relationship between environmental variables and bacterial richness, BP, and BR.
A nonparametric analysis of potentially important environmental variables indicated only a few significant correlations (Table 2). Salinity was correlated with BP or BR only when the data for April were included in the data set. The DOC and temperature showed no substantial relationship with either bacterial richness, BP, or BR.
TABLE 2.
Spearman rank correlations of biological and selected physicochemical parameters
| Parameter | Spearman rank correlation valuea
|
||
|---|---|---|---|
| Richness | BP | BR | |
| Salinity | 0.32 | −0.40* | −0.32* |
| T | 0.19 | −0.07 | 0.08 |
| DOC | 0.14 | −0.30 | −0.21 |
| Chl a | −0.21 | 0.36* | 0.37* |
All parameters were log transformed before analysis, except for T. Total n = 74. , P < 0.01.
Increasing bacterial richness explained the decreasing BP (r2 = 0.50; P < 0.0001; n = 71) better than it explained the changes in BR (r2 = 0.21; P < 0.0001; n = 72) (data not shown). Cell-specific BP decreased exponentially with increasing bacterioplankton richness (Fig. 4a). At about the average richness calculated for the total data set (∼52 operational taxonomic units), cell-specific BP leveled off (Fig. 4a). The decline in cell-specific BR was less pronounced and more variable (Fig. 4b).
FIG. 4.

Relationship between bacterioplankton richness and cell-specific bacterial production (BP; fmol C cell−1 day−1) (a) or cell-specific respiration (BR; fmol C cell−1 day−1) (b). Exponential decreases are illustrated by a power regression model fit to the raw data.
Relationship of bacterial richness and BGE.
In the summer, the estimated community richness was lower than that in the fall and winter. The monthly averaged bacterioplankton richness increased significantly from spring to winter, from 15 to ∼80 operational taxonomic units (one-way ANOVA; r2 = 0.68; P < 0.0001), while BGE significantly decreased from April to December, from ∼42% in the spring to 5% in the winter (one-way ANOVA; r2 = 0.45; P < 0.0001) (Fig. 5a). As a consequence, BGE was negatively related to bacterioplankton richness, which explained ∼43% of the variation in BGE (Fig. 5b).
FIG. 5.

Dynamics of bacterial growth efficiency (BGE) and richness during the seasonal cycle in the southern North Sea. (a) Monthly averages of BGE and bacterioplankton richness measured by T-RFLP. Error bars indicate standard deviations of the means (n = 8 to 19). (b) Relationship between BGE and bacterioplankton richness, with months indicated by different symbols.
DISCUSSION
The selective amplification of T-RFLP templates due to a potential PCR bias could lead to differences between the measured and the actual in situ community composition (49, 51). Furthermore, it is known that even specific primers for the profiling of bacterioplankton amplify 16S rRNA genes of chloroplasts (40). Thus, we primarily examined the 0.8-μm-filtered fraction of the bacterioplankton community. A variable fraction of the total bacterial community was lost during the filtration step. Because the southern North Sea is shallow (mean depth, 30 m), it seems likely that the resuspension of sediment particles with associated bacteria contributed to the variability of the total versus free-living bacteria. However, the correlation between BP measured in unfiltered seawater and that measured in 0.8-μm-filtered seawater was high, and therefore we consider our data to be representative of the free-living bacterioplankton community.
Evidence that biodiversity can influence rates of ecosystem processes has come from experimental studies (20, 27, 30, 35). Usually, the opposing view that the ecosystem function affects species diversity is reported. However, relationships between diversity and productivity are, in fact, two-dimensional projections of a three-dimensional relationship among factors, e.g., site productivity, metabolic rates, and species diversity (18, 47). Thus, conclusions based on effects of changes in bacterial richness on ecosystem properties seem appropriate.
There is much debate about the relationship of species diversity to productivity (27, 47). Chl a is commonly used as a simple indicator of phytoplankton productivity, and some studies have interpreted changes in the bacterial community composition as a consequence of gradients in Chl a concentrations (23, 38). However, analyzing the patterns of α- and β-proteobacteria and Bacteroidetes richness individually, Horner-Devine et al. (22) found that the richness within the individual groups changed differently along a Chl a gradient but that the overall bacterial richness showed no trend. Also, in our study, only a weak correlation was found between Chl a and bacterioplankton richness (Table 2). Due to the effects of statistical averaging, diverse communities may appear more stable than they actually are, as pointed out by Doak (14) and Tilman (50). This effect might mask productivity versus richness patterns in whole-community analyses.
With seawater cultures, Covert and Moran (10) and Carlson et al. (6) found that shifts in the bacterial community were related to the quality of the DOC. In the southern North Sea, DOC concentrations showed no clear seasonality (Table 1) and, consequently, no substantial correlation with bacterial richness (Table 2). However, a negative correlation in the MDS plot was apparent (Fig. 3). Bulk DOC measurements are usually not a good indicator of the direct availability of a substrate to bacteria since the DOC pool consists of >80% semilabile to refractory compounds (3). Nevertheless, the weak gradient detected suggests that changes in the DOC concentration and/or composition play a role in structuring the composition of bacterial communities in the southern North Sea. This was also evident in a previous study performed at a coastal site in the North Sea for which the wax and wane of a phytoplankton bloom were monitored (1).
Generally, low BP is measured in the winter. In the early summer, BP and BR are high (41) but community richness is low in the southern North Sea (Fig. 5a). From published reports, Mittelbach et al. (31) deduced that both hump-shaped and positive relationships of species diversity to productivity are common in nature. In many studies, however, primary production is compared to the diversity of animals, i.e., complex feedback interactions between productivity and diversity are to be expected. Thus, direct productivity estimates of the studied organisms should be used (19). The bacterial carbon demand (BCD), calculated as the sum of BP and BR, reveals the carbon flux mediated by the bacterial community. We found a broad negative relationship between bacterial richness and the BCD (Fig. 6). This would argue for a highly active bacterial assemblage in spring with few community members and for reduced productivity with increasing bacterial richness.
FIG. 6.

Relationship between bacterioplankton richness and bacterial carbon demand (BCD; mmol C m−3 day−1).
The question arises as to whether the combined physicochemical effects constrain BP or whether changes in bacterial richness control BP. Reinthaler and Herndl (41) found a link between primary production and BP and a direct relationship between bacterial growth efficiency and the availability of labile DOC. However, in chemostats kept under constant environmental conditions, Fernández et al. (17) found that functional performance was constant for 2 years, albeit with considerable changes in the bacterial community composition driven by the interactions among the different members of the community. Although we have no direct evidence that bacterioplankton richness influences BP, the negative relationship between cell-specific BP and bacterial richness is apparent (Fig. 4a).
Generally, stability-diversity hypotheses argue that with increasing diversity or species richness, community responses tend to become more stable (16, 29). We assessed the stability-diversity relationship for North Sea bacterioplankton, using bacterioplankton richness and activity, by constructing a dendrogram based on the similarity matrix and then intersecting the resulting tree at relative similarities of 75 and 83% (Fig. 2) in a way that allowed calculations of averages and standard deviations. The tendency of variance to increase with the mean is a major source of bias in variability estimates (9). McArdle et al. (28) argued that the standard deviation of log-transformed raw data [standard deviation (SD) of log(Xi)] is less sensitive to highly skewed distributions, as is often the case for aggregate community properties, than the coefficient of variation.
When the standard deviations of log-transformed cell-specific BP obtained from the individual months were plotted against the respective averages of bacterioplankton richness, a significant increase in variability with increasing richness became apparent (r2 = 0.70; P < 0.002) (Fig. 7a). This suggests that increasing richness leads to an increased instability of cell-specific BP. However, the variability of cell-specific BR barely increased along the richness gradient (Fig. 7b). This is in contrast to the results of McGrady-Steed et al. (30), who measured the CO2 flux in mesocosms supplied with increasing species richness of a manipulated aquatic microbial assemblage. They found that with increasing biodiversity, ecosystem respiration becomes more predictable, i.e., the standard deviation for replicates with similar species richness decreased with increasing richness. Our data on natural bacterioplankton assemblages, however, suggest that bacterioplankton respiration is rather independent of shifts in bacterioplankton community richness. Thus, the main function of heterotrophic bacterioplankton, i.e., the remineralization of DOC to CO2, is rather stable over the seasonal cycle.
FIG. 7.

Relationship between standard deviations (SD) of log-transformed raw data [SD of log(Xi)] and averages of bacterioplankton richness calculated for the subgroups with >83% relative similarity, as indicated in the dendrogram in Fig. 2. The graphs show the relationship between richness and the SD of log BP/cell (a) or the SD of log BR/cell (b).
Acknowledgments
We thank the captain and crew of the RV Pelagia for their support at sea. Martien Baars and Corina Brussaard are gratefully acknowledged as chief scientists during the cruises. We also thank Govert van Noort, Anna Noordeloos, and Santiago Gonzalez for help with data analysis.
This work was supported by the Dutch Science Foundation (NWO-ALW) project 811.33.002 and the European Commission through the COMET and AIRWIN projects to G.J.H. This work was done in partial fulfillment of the requirements for a Ph.D. degree from the University of Groningen by T.R.
REFERENCES
- 1.Arrieta, J. M., and G. J. Herndl. 2002. Changes in bacterial β-glucosidase diversity during a coastal phytoplankton bloom. Limnol. Oceanogr. 47:594-599. [Google Scholar]
- 2.Arrieta, J. M., M. G. Weinbauer, C. Lute, and G. J. Herndl. 2004. Response of bacterioplankton to iron fertilization in the Southern Ocean. Limnol. Oceanogr. 49:799-808. [Google Scholar]
- 3.Benner, R., J. D. Pakulski, M. Mccarthy, J. I. Hedges, and P. G. Hatcher. 1992. Bulk chemical characteristics of dissolved organic-matter in the ocean. Science 255:1561-1564. [DOI] [PubMed] [Google Scholar]
- 4.Benner, R., and M. Strom. 1993. A critical evaluation of the analytical blank associated with DOC measurements by high-temperature catalytic oxidation. Mar. Chem. 41:153-160. [Google Scholar]
- 5.Cardinale, B. J., A. R. Ives, and P. Inchausti. 2004. Effects of species diversity on the primary productivity of ecosystems: extending our spatial and temporal scales of inference. Oikos 103:437-450. [Google Scholar]
- 6.Carlson, C. A., S. J. Giovannoni, D. A. Hansell, S. J. Goldberg, R. Parsons, and K. Vergin. 2004. Interactions among dissolved organic carbon, microbial processes, and community structure in the mesopelagic zone of the northwestern Sargasso Sea. Limnol. Oceanogr. 49:1073-1083. [Google Scholar]
- 7.Carritt, D. E., and J. H. Carpenter. 1966. Comparison and evaluation of currently employed modifications of Winkler method for determining dissolved oxygen in seawater—a NASCO report. J. Mar. Res. 24:287-318. [Google Scholar]
- 8.Clarke, K. R., and R. M. Warwick. 2001. Change in marine communities: an approach to statistical analysis and interpretation. PRIMER-E, Plymouth, United Kingdom.
- 9.Cottingham, K. L., B. L. Brown, and J. T. Lennon. 2001. Biodiversity may regulate the temporal variability of ecological systems. Ecol. Lett. 4:72-85. [Google Scholar]
- 10.Covert, J. S., and M. A. Moran. 2001. Molecular characterization of estuarine bacterial communities that use high- and low-molecular weight fractions of dissolved organic carbon. Aquat. Microb. Ecol. 25:127-139. [Google Scholar]
- 11.Crump, B. C., G. W. Kling, M. Bahr, and J. E. Hobbie. 2003. Bacterioplankton community shifts in an Arctic lake correlate with seasonal changes in organic matter source. Appl. Environ. Microbiol. 69:2253-2268. [DOI] [PMC free article] [PubMed] [Google Scholar]
- 12.Del Giorgio, P. A., and J. J. Cole. 2000. Bacterial energetics and growth efficiency, p. 289-325. In D. L. Kirchman (ed.), Microbial ecology of the oceans. Wiley-Liss, New York, N.Y.
- 13.Del Giorgio, P. A., J. J. Cole, and A. Cimberis. 1997. Respiration rates of bacteria exceed phytoplankton in unproductive aquatic systems. Nature 385:148-151. [Google Scholar]
- 14.Doak, D. F., D. Bigger, E. K. Harding, M. A. Marvier, R. E. O'Malley, and D. Thomson. 1998. The statistical inevitability of stability-diversity relationships in community ecology. Am. Nat. 151:264-276. [DOI] [PubMed] [Google Scholar]
- 15.Ducklow, H. W., and C. A. Carlson. 1992. Oceanic bacterial production. Adv. Microb. Ecol. 12:113-181. [Google Scholar]
- 16.Elton, C. S. 1958. Ecology of invasions by animals and plants. John Wiley & Sons, New York, N.Y.
- 17.Fernández, A., S. Huang, S. Seston, J. Xing, R. Hickey, C. Criddle, and J. Tiedje. 1999. How stable is stable? Function versus community composition. Appl. Environ. Microbiol. 65:3697-3704. [DOI] [PMC free article] [PubMed] [Google Scholar]
- 18.Gessner, M. O., P. Inchausti, L. Persson, D. G. Raffaelli, and P. S. Giller. 2004. Biodiversity effects on ecosystem functioning insights from aquatic systems. Oikos 104:419-422. [Google Scholar]
- 19.Groner, E., and A. Novoplansky. 2003. Reconsidering diversity-productivity relationships: directness of productivity estimates matters. Ecol. Lett. 6:695-699. [Google Scholar]
- 20.Hector, A., B. Schmid, C. Beierkuhnlein, and M. C. Caldeira. 1999. Plant diversity and productivity experiments in European grasslands. Science 286:1123-1127. [DOI] [PubMed] [Google Scholar]
- 21.Holm-Hansen, O., C. L. Lorenzen, R. W. Holmes, and J. D. H. Strickland. 1965. Fluorometric determination of chlorophyll. J. Cons. Int. Expl. Mer. 30:3-15. [Google Scholar]
- 22.Horner-Devine, M. C., M. A. Leibold, V. H. Smith, and B. J. M. Bohannan. 2003. Bacterial diversity patterns along a gradient of primary productivity. Ecol. Lett. 6:613-622. [Google Scholar]
- 23.Kerkhof, L. J., M. A. Voytek, R. M. Sherrell, D. Millie, and O. Schofield. 1999. Variability in bacterial community structure during upwelling in the coastal ocean. Hydrobiologia 401:139-148. [Google Scholar]
- 24.Lane, D. J. 1991. 16S/23S rRNA sequencing, p. 115-176. In E. Stackebrandt and M. Goodfellow (ed.), Nucleic acid techniques in bacterial systematics. John Wiley & Sons, New York, N.Y.
- 25.Lee, S., and J. A. Fuhrman. 1987. Relationships between biovolume and biomass of naturally derived marine bacterioplankton. Appl. Environ. Microbiol. 53:1298-1303. [DOI] [PMC free article] [PubMed] [Google Scholar]
- 26.Lindström, E. S. 2001. Investigating influential factors on bacterioplankton community composition: results from a field study of five mesotrophic lakes. Microb. Ecol. 42:598-605. [DOI] [PubMed] [Google Scholar]
- 27.Loreau, M., S. Naeem, P. Inchausti, J. Bengtsson, J. P. Grime, A. Hector, D. U. Hooper, M. A. Huston, D. Raffaelli, B. Schmid, D. Tilman, and D. A. Wardle. 2001. Biodiversity and ecosystem functioning: current knowledge and future challenges. Science 294:804-808. [DOI] [PubMed] [Google Scholar]
- 28.McArdle, B. H., K. J. Gaston, and J. H. Lawton. 1990. Variation in the size of animal populations: patterns, problems and artefacts. J. Anim. Ecol. 59:439-454. [Google Scholar]
- 29.McCann, K. S. 2000. The diversity-stability debate. Nature 405:228-233. [DOI] [PubMed] [Google Scholar]
- 30.McGrady-Steed, J., P. M. Harris, and P. J. Morin. 1997. Biodiversity regulates ecosystem predictability. Nature 390:162-165. [Google Scholar]
- 31.Mittelbach, G. G., C. F. Steiner, S. M. Scheiner, K. L. Gross, H. L. Reynolds, R. B. Waide, M. R. Willig, S. I. Dodson, and L. Gough. 2001. What is the observed relationship between species richness and productivity? Ecology 82:2381-2396. [Google Scholar]
- 32.Moeseneder, M. M., C. Winter, J. M. Arrieta, and G. J. Herndl. 2001. Terminal-restriction fragment length polymorphism (T-RFLP) screening of a marine archaeal clone library to determine the different phylotypes. J. Microbiol. Methods 44:159-172. [DOI] [PubMed] [Google Scholar]
- 33.Moeseneder, M. M., C. Winter, and G. J. Herndl. 2001. Horizontal and vertical complexity of attached and free-living bacteria of the eastern Mediterranean sea, determined by 16S rDNA and 16S rRNA fingerprints. Limnol. Oceanogr. 46:95-107. [Google Scholar]
- 34.Morin, P. J., and J. McGrady-Steed. 2004. Biodiversity and ecosystem functioning in aquatic microbial systems: a new analysis of temporal variation and species richness-predictability relations. Oikos 104:458-466. [Google Scholar]
- 35.Naeem, S., and S. B. Li. 1997. Biodiversity enhances ecosystem reliability. Nature 390:507-509. [Google Scholar]
- 36.Pai, S.-C., G.-C. Gong, and K.-K. Liu. 1993. Determination of dissolved oxygen in seawater by direct spectrophotometry of total iodine. Mar. Chem. 41:343-351. [Google Scholar]
- 37.Pinhassi, J., and Å. Hagström. 2000. Seasonal succession in marine bacterioplankton. Aquat. Microb. Ecol. 21:245-256. [Google Scholar]
- 38.Pinhassi, J., M. M. Sala, H. Havskum, F. Peters, O. Guadayol, A. Malits, and C. Marrase. 2004. Changes in bacterioplankton composition under different phytoplankton regimens. Appl. Environ. Microbiol. 70:6753-6766. [DOI] [PMC free article] [PubMed] [Google Scholar]
- 39.Porter, K. G., and Y. S. Feig. 1980. The use of DAPI for identifying and counting aquatic microflora. Limnol. Oceanogr. 25:943-948. [Google Scholar]
- 40.Rappe, M. S., M. T. Suzuki, K. L. Vergin, and S. J. Giovannoni. 1998. Phylogenetic diversity of ultraplankton plastid small-subunit rRNA genes recovered in environmental nucleic acid samples from the Pacific and Atlantic coasts of the United States. Appl. Environ. Microbiol. 64:294-303. [DOI] [PMC free article] [PubMed] [Google Scholar]
- 41.Reinthaler, T., and G. J. Herndl. Seasonal dynamics of bacterial growth efficiencies in relation to phytoplankton in the southern North Sea. Aquat. Microb. Ecol., in press.
- 42.Riemann, B., R. T. Bell, and N. O. G. Jørgensen. 1990. Incorporation of thymidine, adenine and leucine into natural bacterial assemblages. Mar. Ecol. Prog. Ser. 65:87-94. [Google Scholar]
- 43.Rivkin, R. B., and L. Legendre. 2001. Biogenic carbon cycling in the upper ocean: effects of microbial respiration. Science 291:2398-2400. [DOI] [PubMed] [Google Scholar]
- 44.Robinson, C., C. E. Widdicombe, M. V. Zubkov, G. A. Tarran, A. E. J. Miller, and A. P. Rees. 2002. Plankton community respiration during a coccolithophore bloom. Deep-Sea Res. II 49:2929-2950. [Google Scholar]
- 45.Roland, F., N. F. Caraco, J. J. Cole, and P. A. Del Giorgio. 1999. Rapid and precise determination of dissolved oxygen by spectrophotometry: evaluation of interference from color and turbidity. Limnol. Oceanogr. 44:1148-1154. [Google Scholar]
- 46.Schäfer, H., L. Bernard, C. Courties, P. Lebaron, P. Servais, R. Pukall, E. Stackebrandt, M. Troussellier, T. Guindulain, J. Vives-Rego, and G. Muyzer. 2001. Microbial community dynamics in Mediterranean nutrient-enriched seawater mesocosms: changes in the genetic diversity of bacterial populations. FEMS Microbiol. Ecol. 34:243-253. [DOI] [PubMed] [Google Scholar]
- 47.Schmid, B. 2002. The species richness-productivity controversy. Trends Ecol. Evol. 17:113-114. [Google Scholar]
- 48.Simon, M., and F. Azam. 1989. Protein content and protein synthesis rates of planktonic marine bacteria. Mar. Ecol. Prog. Ser. 51:201-213. [Google Scholar]
- 49.Suzuki, M. T., and S. J. Giovannoni. 1996. Bias caused by template annealing in the amplification of mixtures of 16S rRNA genes by PCR. Appl. Environ. Microbiol. 62:625-630. [DOI] [PMC free article] [PubMed] [Google Scholar]
- 50.Tilman, D. 1999. The ecological consequences of changes in biodiversity: a search for general principles. Ecology 80:1455-1474. [Google Scholar]
- 51.von Wintzingerode, F., U. B. Gobel, and E. Stackebrandt. 1997. Determination of microbial diversity in environmental samples: pitfalls of PCR-based rRNA analysis. FEMS Microbiol. Rev. 21:213-229. [DOI] [PubMed] [Google Scholar]
- 52.Winter, C., M. M. Moeseneder, and G. J. Herndl. 2001. Impact of UV radiation on bacterioplankton community composition. Appl. Environ. Microbiol. 67:665-672. [DOI] [PMC free article] [PubMed] [Google Scholar]
- 53.Yannarell, A. C., and E. W. Triplett. 2004. Within- and between-lake variability in the composition of bacterioplankton communities: investigations using multiple spatial scales. Appl. Environ. Microbiol. 70:214-223. [DOI] [PMC free article] [PubMed] [Google Scholar]
- 54.Yu, Z., and W. W. Mohn. 2001. Bacterial diversity and community structure in an aerated lagoon revealed by ribosomal intergenic spacer analyses and 16S ribosomal DNA sequencing. Appl. Environ. Microbiol. 67:1565-1574. [DOI] [PMC free article] [PubMed] [Google Scholar]