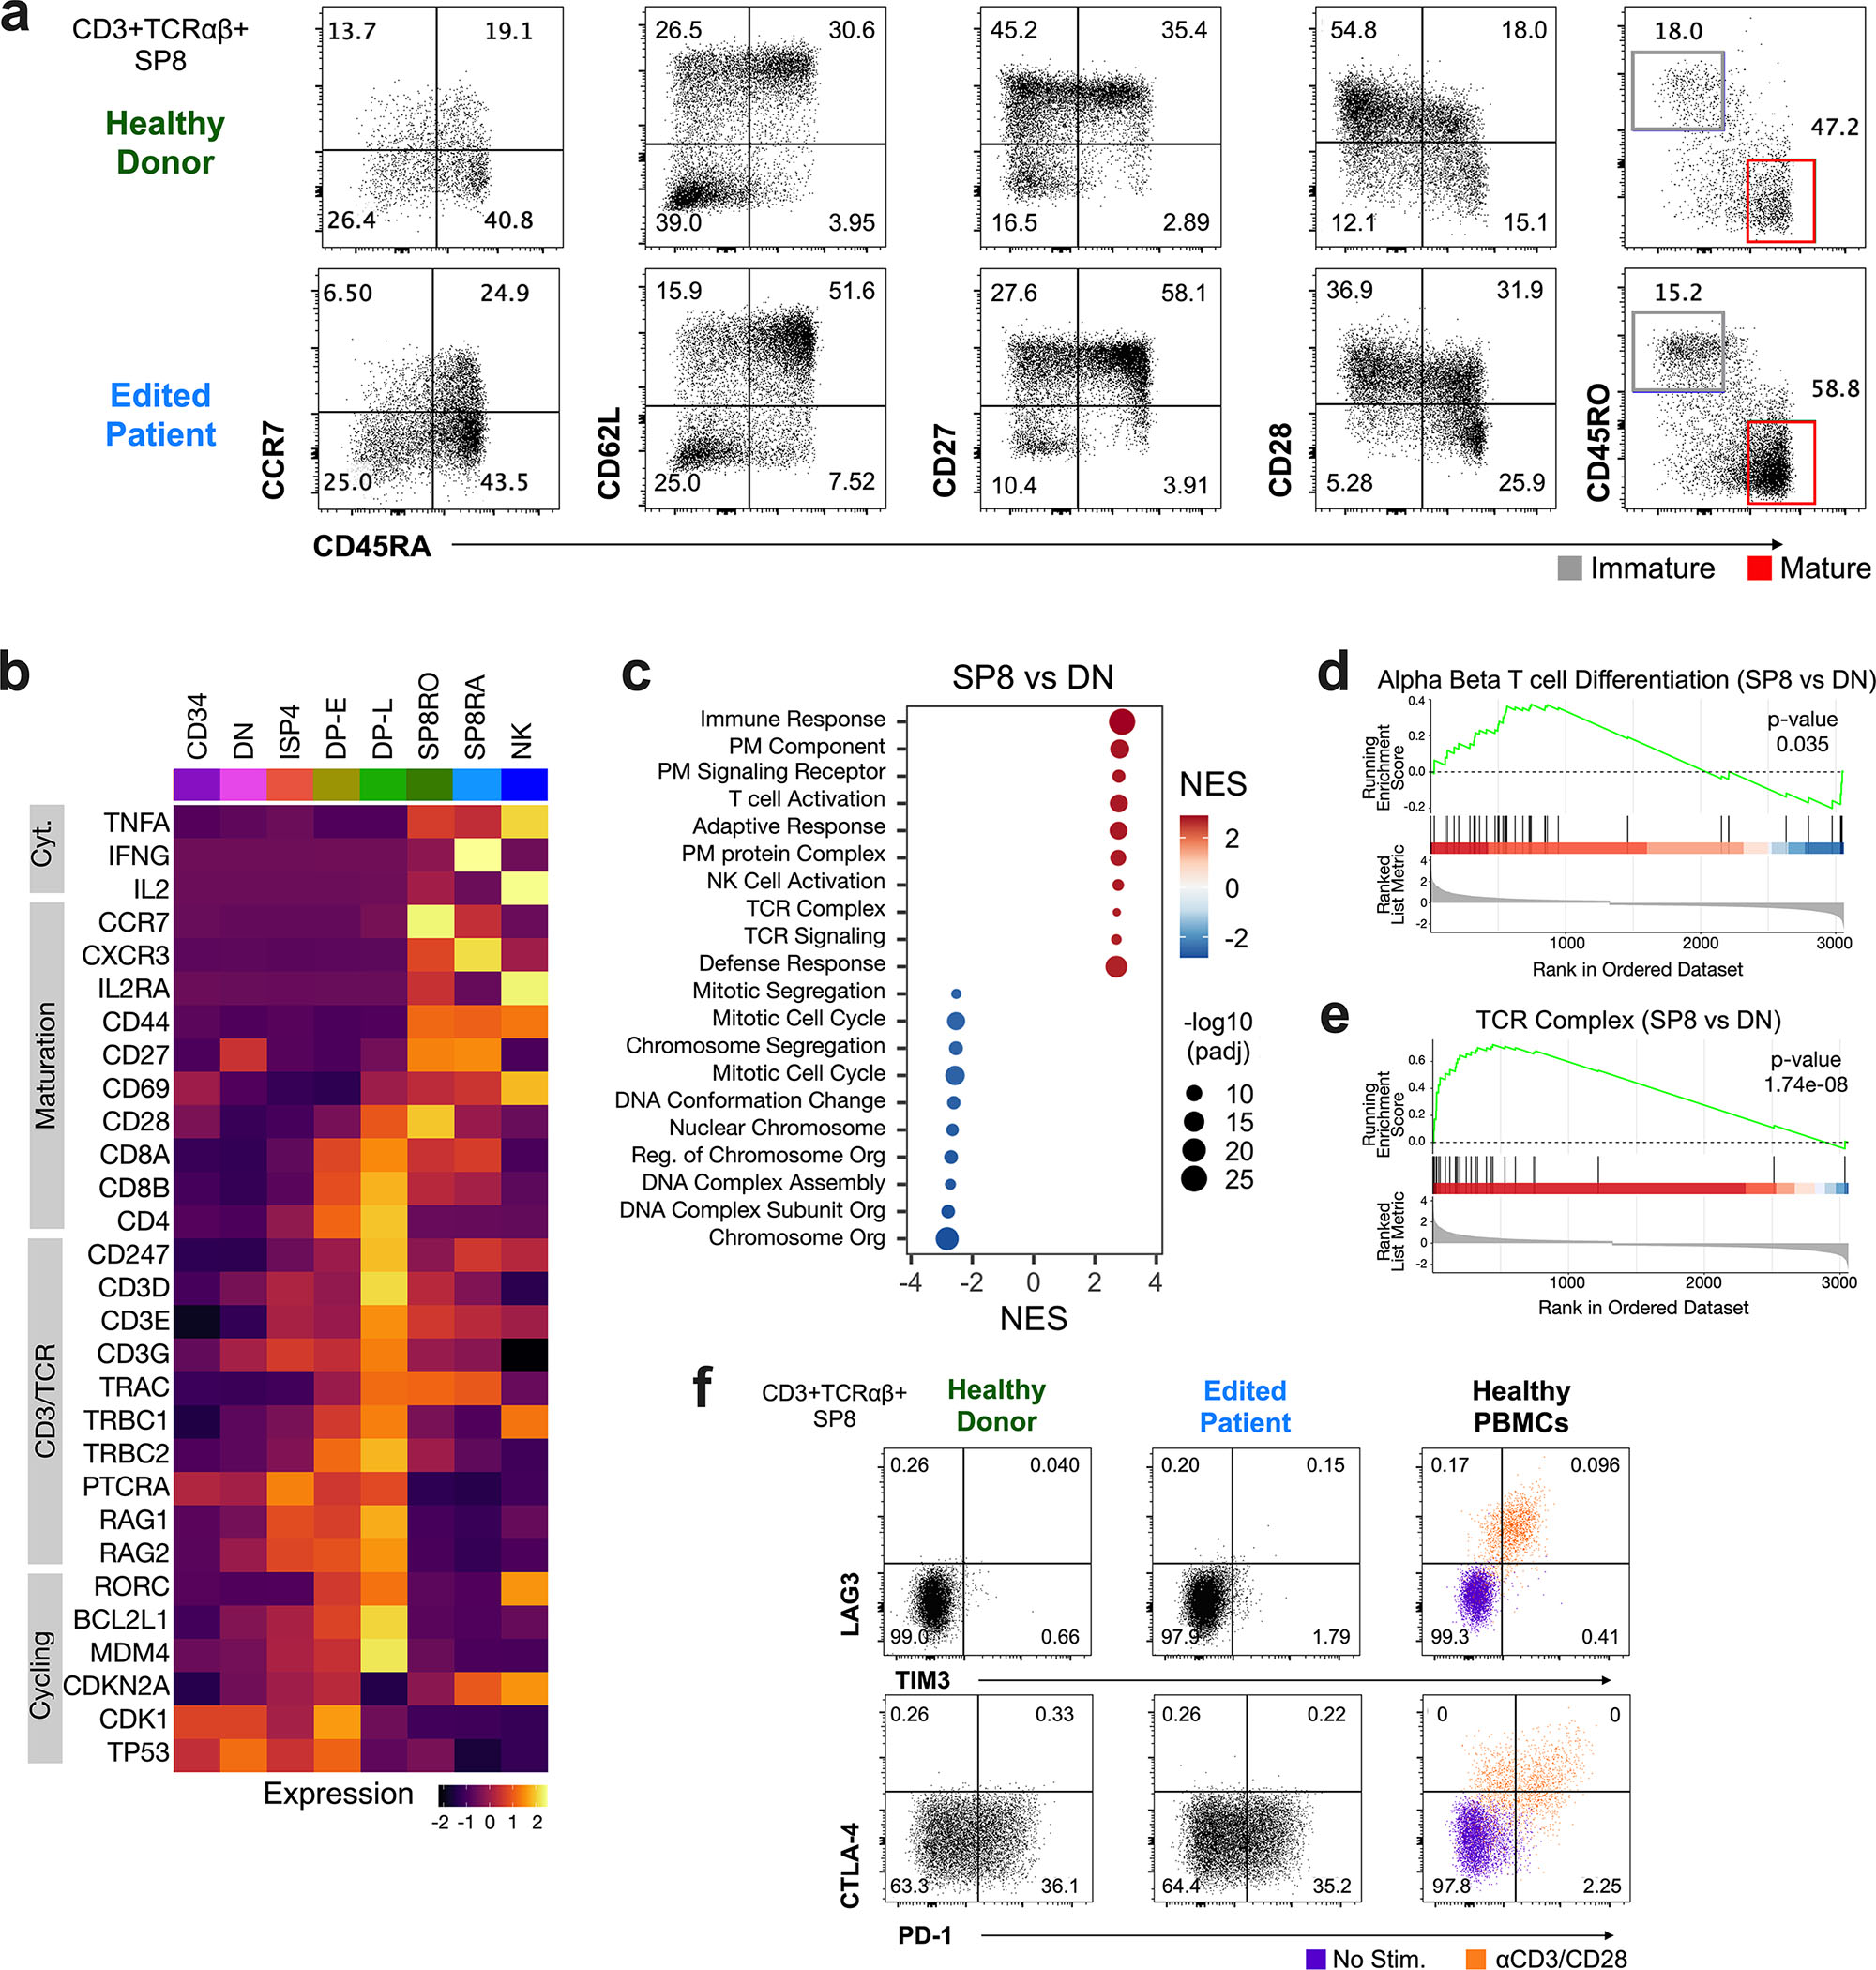
Figure 6. Edited CD3δ SCID ATO-derived T cells Express Features of Maturation without Evidence of Exhaustion.

a) Representative flow cytometry profiles depicting maturation markers (CCR7, CD62L, CD27, CD28, CD45RO, and CD45RA) in cells gated on SP8 T cells - CD3+TCRαβ+CD8α+CD8β+, in week 12 ATOs (n=9, from four independent experiments). b) RNA expression of selected genes (y-axis) across clusters in edited patient ATOs by CITE-seq; Cyt., cytokine. c) Gene Set Enrichment Analysis (GSEA) of differentially expressed genes from GOBP (Gene Ontology Biological Process) and GOCC (Gene Ontology Cellular Compartment) between SP8 T and DN cells from edited ATOs. Dot size represents adjusted p-value (padj; two-sided permutation test). NES, normalized enrichment score; PM, plasma membrane. GSEA plots of representative gene sets d) alpha beta T cell differentiation (p=0.035), and e) TCR complex (p=1.74E-8) in SP8 vs DN T cells from edited ATOs. f) Representative flow cytometry profiles of exhaustion markers in SP8 T cells directly from week 15 HD (n=9) and edited patient ATOs (n=9), and compared to PBMCs (n=3); PBMC were stimulated with (orange) and without (purple) anti-CD3/28 beads and IL2 for 24 hours.
