

Abstract
Spinal muscular atrophy (SMA) is a genetic neuromuscular disorder caused by the reduction of survival of motor neuron (SMN) protein levels. Although three SMN-augmentation therapies are clinically approved that significantly slow down disease progression, they are unfortunately not cures. Thus, complementary SMN-independent therapies that can target key SMA pathologies and that can support the clinically approved SMN-dependent drugs are the forefront of therapeutic development. We have previously demonstrated that prednisolone, a synthetic glucocorticoid (GC) improved muscle health and survival in severe Smn−/−;SMN2 and intermediate Smn2B/− SMA mice. However, long-term administration of prednisolone can promote myopathy. We thus wanted to identify genes and pathways targeted by prednisolone in skeletal muscle to discover clinically approved drugs that are predicted to emulate prednisolone’s activities. Using an RNA-sequencing, bioinformatics, and drug repositioning pipeline on skeletal muscle from symptomatic prednisolone-treated and untreated Smn−/−; SMN2 SMA and Smn+/−; SMN2 healthy mice, we identified molecular targets linked to prednisolone’s ameliorative effects and a list of 580 drug candidates with similar predicted activities. Two of these candidates, metformin and oxandrolone, were further investigated in SMA cellular and animal models, which highlighted that these compounds do not have the same ameliorative effects on SMA phenotypes as prednisolone; however, a number of other important drug targets remain. Overall, our work further supports the usefulness of prednisolone’s potential as a second-generation therapy for SMA, identifies a list of potential SMA drug treatments and highlights improvements for future transcriptomic-based drug repositioning studies in SMA.
Keywords: spinal muscular atrophy, skeletal muscle, transcriptomics, drug repurposing, animal models
Introduction
Spinal muscular atrophy (SMA) is a heterogenous autosomal recessive neuromuscular disorder (NMD) characterized by motor neuron degeneration alongside progressive muscle atrophy and weakness [1]. Being the leading monogenic cause of infant mortality [2], around 96% of SMA cases are mapped to homozygous loss-of-function and deletion mutations in the survival of motor neuron 1 (SMN1) gene [3, 4], which ubiquitously expresses SMN, a protein that current and ongoing research has linked to diverse housekeeping and tissue-specific cellular functions [5–7]. Although complete SMN loss is embryonic lethal in most organisms [8], humans can overcome the complete loss of the SMN1 gene due to incomplete rescue by the homologous SMN2 gene [9, 10]. In essence, the presence of a single nucleotide mutation in SMN2 promotes exon 7 alternative splicing that limits full length SMN (FL-SMN) expression in this gene to 10% [11]. Consequently, the limited FL-SMN expression makes SMN2 gene copy number an important disease modifier, impacting SMA type and severity [12].
In recent years, novel SMN restorative SMA treatments have emerged that either increase FL-SMN2 expression by an anti-sense oligonucleotide (ASO) (Nusinersen marketed as (Spinraza®)) [13, 14] or a small molecule (Evrysdi®) [15, 16] or promote exogenous FL-SMN1 expression by an adeno-associated virus 9 (AAV-9) delivery system (Zolgensma®) [17, 18]. Despite the significant increased life expectancy and improved quality of life associated with these therapies [14, 16, 18, 19], they are not cures and their efficacy is dependent upon early intervention [20].
Thus, additional SMN-independent therapies that target affected tissues such as muscle are needed to further enhance and support the benefits of SMN-dependent treatments [21]. Indeed, pre-clinical studies and primary patient data have reported innate muscular defects in SMA, which include myogenesis [22], regeneration [23], contraction [24, 25], regulation [25], growth [26], and metabolism [27], highlighting skeletal muscle as a primary therapeutic target. Although two novel skeletal muscle-specific SMA therapies, Apitegromab™ [28] (ClinicalTrials.gov ID: NCT03921528) and Reldesemtiv™ [29] (ClinicalTrials.gov ID: NCT02644668), are showing progress in clinical trials, the high expenses involved in novel drug research and development (R&D) [30] alongside the costs of the three clinically approved SMN-dependent therapies may lead to elevated prices for combinatorial treatments [31], thus further widening the accessibility gap for SMA patients.
A useful alternative for ensuring accessibility of SMN-independent treatments for all SMA patients would be the identification of cost-effective generic drugs via drug repositioning, a strategy aimed at finding new therapeutic activities for existing pharmacological compounds [32]. One such example is prednisolone, a synthetic glucocorticoid (GC) administered to relieve muscle inflammation in Duchenne muscular dystrophy (DMD) patients [33, 34]. Interestingly, evidence also emerged that short-term prednisolone treatment additionally conferred ergogenic muscle benefits in DMD patients [35, 36], which was also validated in the mdx mouse model of DMD [37, 38].
Although GCs are not used for the treatment of SMA patients, prednisolone is administered for a short period (~30 days, 1 mg/kg) to alleviate the immunological adverse effects of Zolgensma® [18]. However, given prednisolone’s potential muscle benefits, we have previously investigated and demonstrated that prednisolone treatment (5 mg/kg, every other day) in severe Smn−/−;SMN2 and intermediate Smn2B/− SMA mice improved survival, weight and neuromuscular phenotype [27]. Although the study was aimed at investigating prednisolone’s activity on the GC-Krüppel-Like-Factor-15 (KLF15) pathway in SMA skeletal muscle, synergistic muscle improvement was also observed in prednisolone-treated Smn−/−;SMN2 SMA mice overexpressing Klf15 specifically in skeletal muscle [27], suggesting that prednisolone may act on SMA skeletal muscle via numerous effectors and pathways.
Despite the benefits observed, our study did not evaluate prednisolone’s long-term effects [18, 27]. Given that chronic GC usage increases myopathy [35, 39], it is unclear whether long-term prednisolone treatments would be similarly detrimental in SMA muscle. Furthermore, the rapid onset and progression of disease in SMA mouse models (1–3 weeks on average) [9, 40, 41] does not allow sufficient comparison of intermittent vs chronic studies.
Thus, in this study, we used a transcriptomics and drug repositioning pipeline based on our previously published experimental paradigm [42] to uncover the genes and pathways restored by prednisolone in skeletal muscle of SMA mice and identify existing non-GC drugs predicted to have similar activities (Fig. 1). Our study uncovered that prednisolone restored pathways linked to growth, metabolism, and regulation in SMA skeletal muscle and identified 20 leading commercially available non-GC drugs predicted to emulate its action. Based on oral bioavailability and evidence of safety treatment in children, we selected and validated metformin and oxandrolone in SMA cellular and animal models (Fig. 1). Although, both metformin and oxandrolone improved neuromuscular activity in the Caenorhabditis elegans (C. elegans) model for severe SMA, we found that higher metformin doses reduced survival in the Smn2B/− SMA mouse model. On the other hand, oxandrolone treatment partially improved survival in Smn2B/− SMA mice, albeit not to the same extent as prednisolone [27].
Figure 1.

Graphical representation of the study aimed at using a transcriptomics-based drug repositioning strategy to predict and validate drug candidates that emulate prednisolone’s activity in SMA skeletal muscle. (1) 5 mg/kg prednisolone was administered was administered to Smn−/−;SMN2 SMA mice and Smn+/−;SMN2 healthy control animals every other day from post-natal day (P) 0 to P7. (2) Total RNA was extracted from the triceps of prednisolone- and untreated SMA mice and Smn+/−;SMN2 healthy control animals and underwent library preparation for next generation sequencing against Mus musculus mm10 genome using Illumina NextSeq 550. (3) The RNA-sequencing (RNA-Seq) reads initially underwent QC analysis via FASTQC prior to a transcriptomics pipeline of mm10 M. musculus genome alignment (HISAT2), read count quantification (FeatureCounts) and differential gene expression analysis (DESeq2) to generate differentially expressed genes.(4) The differential gene expression patterns between prednisolone-treated vs untreated Smn−/−;SMN2 SMA triceps was used to identify significant pathways targeted by prednisolone (iPathwayGuide). Both differentially expressed genes and significant pathways were used to predict clinically approved drug candidates from online databases (iPathwayGuide, KEGG drugs and drug gene interaction database (DGIdb)) that emulate prednisolone’s activity in skeletal muscle of SMA mice. (5) The activity and safety of predicted drug candidates of interest and their target genes were then assessed in both in vivo (Smn2B/− SMA mice and Caenorhabditis elegans smn-1 (ok355)) and in vitro (C2C12 muscle-like cells) models. This figure was generated in BioRender.
Nevertheless, our study computationally uncovered new mechanisms behind prednisolone’s beneficial activity in SMA muscle, identified numerous potential SMA muscle-specific therapeutic candidates and highlighted the importance of transcriptomic-based drug repositioning for SMN-independent drug discovery.
Results
Prednisolone restores the expression of a large subset of genes involved in canonical skeletal muscle pathways in SMA mice
As described in an earlier study, we have previously demonstrated that treating SMA mice with prednisolone significantly improved several disease phenotypes, including survival, weight, and muscle health [27]. To have a more in depth understanding of the impact of prednisolone on SMA skeletal muscle at a molecular level, we performed bulk RNA-sequencing (RNA-Seq) on skeletal muscle of untreated and prednisolone-treated Smn−/−;SMN2 SMA and Smn+/−;SMN2 healthy mice. Specifically, we administered prednisolone (5 mg/kg, gavage, every 2 days) starting from post-natal day (P) 0 until P7 to Smn−/−;SMN2 SMA and Smn+/−;SMN2 healthy mice [27]. Triceps were harvested from P7 prednisolone-treated and untreated mice for RNA-Seq via Illumina NextSeq550 and a HISAT2-FeatureCounts-DESeq2 pipeline against a Mus Musculus mm10 genome for parameters of “condition” and “treatment” (Fig. S1).
Initially, our principal component analysis (PCA) revealed distinct clusters of untreated Smn−/−;SMN2 SMA and untreated Smn+/−;SMN2 healthy littermates, with prednisolone-treated Smn−/−;SMN2 SMA mice falling between the aforementioned groups (Fig. 2a). Importantly, we found that prednisolone treatment restored the expression of 1361 genes in Smn−/−;SMN2 SMA mice to levels similarly observed in untreated Smn+/−;SMN2 healthy mice (Fig. 2b; Tables S1–S3).
Figure 2.

Prednisolone treatment normalizes a subset of genes in severe Smn−/−;SMN2 SMA mice to healthy levels observed in untreated Smn+/−;SMN2 mice. Smn−/−;SMN2 SMA and Smn+/−;SMN2 healthy mice received prednisolone treatment (5 mg/kg gavage every 2 days) from P0. The triceps was harvested from P7 untreated and prednisolone-treated Smn−/−;SMN2 SMA and Smn+/−;SMN2 healthy mice for RNA isolation and library preparation for RNA-sequencing. Differential gene expression analysis was performed by DESeq2 v2.11.40.2 with study design set to “condition and “treatment”. (a) Principal component analysis based on transcriptomic profiles between P7 untreated Smn+/−;SMN2 (n = 3), prednisolone-treated Smn−/−;SMN2 (n = 2) and untreated Smn−/−;SMN2 (n = 3) mice. (b) Heatmap of the transcriptomic expression profiles (Log2FC > 0.6; FDR < 0.05) between P7 untreated Smn+/−;SMN2 (n = 3, left), untreated Smn−/−;SMN2 (n = 3, centre) and prednisolone-treated Smn−/−;SMN2 (n = 3, right) mice.
Next, we determined the biological pathways associated with differentially expressed genes (DEGs) in prednisolone-treated Smn−/−;SMN2 SMA mice compared to untreated Smn−/−;SMN2 SMA mice. Using iPathwayGuide, we identified that 3056 significant DEGs (Log2 fold change (Log2 FC) > 0.6, false discovery rate (FDR) < 0.05) (Table S2) were targeted by prednisolone in the skeletal muscle of Smn−/−;SMN2 SMA mice when compared to untreated Smn−/−;SMN2 SMA mice and associated with 28 significant KEGG pathways (P < 0.05) (Table 1). Interestingly, these prednisolone-targeted pathways are closely associated with important skeletal muscle processes such as metabolism, atrophy and regulatory function, alongside previous associations with SMA-related pathways such as FoxO signalling [43], p53 signalling [44], AMPK signalling [45], mitophagy [46], circadian rhythm [47], PPAR signalling [48] and autophagy [49] (Table 1). An additional gene ontology (GO) analysis also revealed similar skeletal muscle biological processes associated with the DEGs in prednisolone-treated Smn−/−;SMN2 SMA mice such as myotube differentiation, fatty acid oxidation, protein ubiquitination, sarcomere regulation, gluconeogenesis, and circadian rhythm (Table 2; Tables S4–S6).
Table 1.
KEGG pathways targeted in the skeletal muscle of symptomatic prednisolone-treated Smn−/−;SMN2 SMA mice compared with untreated Smn−/−;SMN2 SMA mice.
| KEGG ID | Pathway name | #Genes (DE/All) | P value |
|---|---|---|---|
| 04066 | HIF-1 signalling pathway | 30/91 | 0.001 |
| 05214 | Glioma | 25/71 | 0.002 |
| 04213 | Longevity regulating pathway—multiple species | 24/57 | 0.003 |
| 04068 | FoxO signalling pathway | 41/116 | 0.003 |
| 04713 | Circadian entrainment | 23/73 | 0.004 |
| 04211 | Longevity regulating pathway | 30/83 | 0.004 |
| 04115 | p53 signalling pathway | 25/67 | 0.006 |
| 00040 | Pentose and glucuronate interconversionsa | 8/15 | 0.007 |
| 05010 | Alzheimer disease | 19/158 | 0.008 |
| 04152 | AMPK signalling pathway | 37/110 | 0.008 |
| 04080 | Neuroactive ligand-receptor interaction | 23/118 | 0.011 |
| 05418 | Fluid shear stress and atherosclerosis | 38/125 | 0.013 |
| 05223 | Non-small cell lung cancer | 22/64 | 0.014 |
| 05034 | Alcoholism | 25/104 | 0.014 |
| 04744 | Phototransduction | 4/9 | 0.015 |
| 05215 | Prostate cancera | 28/88 | 0.016 |
| 04137 | Mitophagy—animal | 22/61 | 0.018 |
| 04659 | Th17 cell differentiation | 18/72 | 0.024 |
| 03030 | DNA replicationa | 13/35 | 0.026 |
| 05031 | Amphetamine addiction | 13/49 | 0.028 |
| 05200 | Pathways in cancera | 110/434 | 0.031 |
| 04710 | Circadian rhythm | 12/29 | 0.033 |
| 01210 | 2-Oxocarboxylic acid metabolisma | 7/16 | 0.039 |
| 04140 | Autophagy—animal | 36/123 | 0.041 |
| 04372 | Apelin signalling pathway | 34/121 | 0.045 |
| 05226 | Gastric cancer | 36/123 | 0.048 |
| 00515 | Mannose type O-glycan biosynthesisa | 8/20 | 0.048 |
| 03320 | PPAR signalling pathway | 20/56 | 0.048 |
aOver-representation only.
Table 2.
Top gene ontology biological process pathways targeted in the skeletal muscle of symptomatic prednisolone-treated Smn−/−;SMN2 SMA mice compared with untreated Smn−/−;SMN2 SMA mice.
| GO ID | GO Name | #Genes (DE/All) | P value (Weight) |
|---|---|---|---|
| GO:0000055 | ribosomal large subunit export from nucleus | 8/8 | 0.0000054 |
| GO:0010830 | regulation of myotube differentiation | 25/53 | 0.000088 |
| GO:0034504 | protein localization to nucleus | 81/247 | 0.00011 |
| GO:0046320 | regulation of fatty acid oxidation | 17/32 | 0.00028 |
| GO:0048662 | negative regulation of smooth muscle cell proliferation | 20/44 | 0.00045 |
| GO:0031062 | positive regulation of histone methylation | 17/35 | 0.00046 |
| GO:0046854 | phosphatidylinositol phosphorylation | 17/36 | 0.0007 |
| GO:0016239 | positive regulation of macroautophagy | 26/64 | 0.00113 |
| GO:0000083 | regulation of transcription involved in G1/S transition of mitotic cell cycle | 8/12 | 0.00113 |
| GO:0042594 | response to starvation | 49/148 | 0.00114 |
| GO:0031398 | positive regulation of protein ubiquitination | 36/101 | 0.00115 |
| GO:0090073 | positive regulation of protein homodimerization activity | 7/10 | 0.00157 |
| GO:0048671 | negative regulation of collateral sprouting | 6/8 | 0.00208 |
| GO:0007050 | cell cycle arrest | 40/121 | 0.00319 |
| GO:1990830 | cellular response to leukaemia inhibitory factor | 37/110 | 0.00321 |
| GO:1901215 | negative regulation of neuron death | 60/198 | 0.00378 |
| GO:0007623 | circadian rhythm | 50/160 | 0.00378 |
| GO:0061635 | regulation of protein complex stability | 6/9 | 0.00508 |
| GO:0033137 | negative regulation of peptidyl-serine phosphorylation | 12/26 | 0.00533 |
| GO:0032088 | negative regulation of NF-kappaB transcription factor activity | 22/59 | 0.00537 |
| GO:0006094 | gluconeogenesis | 23/63 | 0.00604 |
| GO:0001937 | negative regulation of endothelial cell proliferation | 15/36 | 0.00629 |
| GO:0010715 | regulation of extracellular matrix disassembly | 7/12 | 0.00681 |
| GO:0030240 | skeletal muscle thin filament assembly | 7/12 | 0.00681 |
| GO:0035358 | regulation of peroxisome proliferator activated receptor signalling pathway | 7/12 | 0.00681 |
Combined, our transcriptomics and pathway analyses suggest that prednisolone treatment attenuated muscle pathologies in SMA mice [27] by targeting key muscle metabolism, atrophy and regulatory pathways.
Drug repositioning algorithms identify novel pharmacological compounds predicted to emulate prednisolone’s activity in skeletal muscle of SMA mice
As mentioned above, while prednisolone treatment significantly improves muscle health and overall disease progression in SMA mice, chronic use of prednisolone can negatively impact skeletal muscle [35, 39]. As such, we used the DEGs and associated KEGG pathways identified in prednisolone-treated Smn−/−;SMN2 SMA mice to discover alternative drugs predicted to mimic prednisolone’s molecular effects in SMA skeletal muscle. Initially, we utilized the in-built integration of KEGG drugs database in iPathwayGuide [50] and the DGIdb v3.0 [51] database to initially reveal a total of 580 compounds (Tables S7–S10). To filter down our list, we focused on the drug compounds 1) that targeted > 5 prednisolone-targeted pathways or linked to upstream regulators, 2) were clinically approved and 3) were not associated with promotion of muscle-wasting (e.g. primary anti-cancer drugs [52]), leaving a total of 20 potential candidates (Tables 3–4).
Table 3.
Top 10 clinically approved drugs identified by KEGG database based on prednisolone-targeted KEGG pathways in symptomatic prednisolone-treated Smn−/−;SMN2 SMA mice.
| Pathways Targeted | KEGG ID | Compound | Bioavailability | Gene Targets |
|---|---|---|---|---|
| 10 | D03297 | Mecasermin (genetical recombination) (JAN) | Subcutaneous | Igf1r |
| 10 | D04870 | Mecasermin rinfabate (USAN/INN) | Intravenous | Igf1r |
| 9 | D09680 | Teprotumumab (USAN/INN) | Intravenous | Igf1r |
| 8 | D04966 | Metformin (USAN/INN) | Oral | Prkag3 |
| 8 | D00944 | Metformin hydrochloride (JP16/USP) | Oral | Prkag3 |
| 7 | D01697 | Colforsin daropate hydrochloride (JAN) | Oral | Adcy1, Adcy6 Adcy7 |
| 6 | D01146 | Iguratimod (JAN/INN) | Oral | Nfkb1 |
| 5 | D07058 | Acamprosate (INN) | Oral | Grin1, Grin2a, Grin2b, Grin2c, Grin2d |
| 5 | D02754 | Acitretin (USP/INN); Soriatane (TN) | Oral | Rarb, Rxrb, Rxrg |
| 5 | D00085 | Insulin (JAN/USP) | Intravenous Subcutaneous | Insr |
Table 4.
Top 10 clinically approved drugs identified by DGIdb database based on prednisolone-targeted KEGG pathways in symptomatic prednisolone-treated Smn−/−;SMN2 SMA mice.
| Compound | Bioavailability | Gene Target |
|---|---|---|
| Testosterone | Busal Nasal Oral Topical Transdermal Subcutaneous |
Ar |
| Oxandrolone | Oral | Ar |
| Nandrolone phenpropionate | Oral | Ar |
| Progesterone | Oral Vaginal Intramuscular |
Ers1 |
| Tibolone | Oral | Ers1 |
| Cannabidiol | Oral Inhale |
Cnr1 |
| Insulin, neutral | Intravenous Intramuscular Subcutaneous |
Insr |
| Celecoxib | Oral | Pdpk1 |
| Tocilizumab | Intravenous Subcutaneous |
Il-6ra |
| Sarilumab | Subcutaneous | Il-6ra |
Interestingly, our combined in silico drug repositioning approach revealed a subset of candidates previously investigated in SMA such as celecoxib [53] (ClinicalTrials.gov ID: NCT02876094) and colforsin [54]. To further validate our bioinformatics strategy, we chose to continue our study with drugs not yet assessed for SMA, focusing on those previously used safely in young patients and orally bioavailable. With these criteria, we narrowed down our selection to metformin, a generic asymmetric dimethyl-biguanide type 2 diabetes mellitus (T2DM) drug [55] and oxandrolone, a synthetic anabolic steroid with a higher ratio of anabolic: androgynous effects for further study [56].
Thus, using a transcriptomics-based in silico drug repositioning platform, we were able to generate a list of clinically approved pharmacological compounds that are predicted to emulate prednisolone’s activity in skeletal muscle.
Molecular docking simulations support the predicted drug-target interactions identified by the transcriptomics pipeline
Having selected to move forward with metformin and oxandrolone based on a combined bioinformatics and drug repurposing strategy, we performed molecular docking simulations to confirm that our drugs of interest indeed interacted with their predicted molecular targets (Prkag3 for metformin and androgen receptor (AR) for oxandrolone). In the case of metformin, no crystallographic data was available for Prkag3 (AMPK-γ3). We thus studied the interactions of metformin with Prkag1 (AMPK-γ1) (Fig. 3a), as both encode the AMPK-γ subunit, share 64% sequence homology and can form an AMPK trimeric complex with the same AMPK α2 and β2 subunits in human and mouse skeletal muscle [57]. Nevertheless, both metformin and oxandrolone demonstrated strong binding affinity to their targets of interest with metformin binding at Prkag1 key residues such as Ala 204, Ala 226 and Asp316 (Fig. 3a) and oxandrolone anchoring to the AR active sites via hydrogen bonds with Asn 705, Arg 752 and Thr 877 (Fig. 3b). Furthermore, docking studies across our larger list of orally bioavailable drug candidates (Tables 3–4) show that most of the drug molecules were predicted to fit in their respective target active sites, aligning well with known co-crystallized ligands (Fig. S2, Table S11). Thus, these molecular docking simulations support further investigating the therapeutic potential of the drug candidates identified via a transcriptomics and drug repurposing approach.
Figure 3.

Molecular docking predicted binding of metformin and oxandrolone to their targets of interest. (a) Binding of the co-crystallized Prkag1 activator and the predicted alternative binding modes of metformin in Prkag1 active site. (b) Binding of the co-crystallized testosterone and the predicted binding of oxandrolone in the androgen receptor (AR) active site. Ligands are shown in colour ball-and-stick representation with molecular surface rendered, amino acid residues as sticks and binding interactions as colour dashed-lines.
Metformin’s primary predicted target gene Prkag3 is dysregulated in skeletal muscle of both severe Smn−/−;SMN2 and intermediate Smn2B/− SMA mice
As previously mentioned, metformin is an orally administered T2DM drug that we selected as one of the candidates to validate our bioinformatics-based drug repositioning approach. Importantly, metformin has over 60 years of clinical use with a well-known safety profile [55] and recorded administration in younger patients [58]. Furthermore, it has been previously repositioned and conferred ergogenic activities in muscular disorders such as DMD [59] and congenital muscular dystrophy type 1 A (CMDT1A) [60], highlighting its potential as a skeletal muscle therapy.
Our iPathwayGuide analysis predicted that metformin could emulate prednisolone’s targeting of the KEGG: 04068 FoxO signalling pathway (Fig. S3a). In particular, metformin was predicted to mimic prednisolone’s upregulation of Prkag3, which encodes for the AMPK-γ3 subunit of the predominant skeletal muscle AMPK-α2β2γ3 isoform complex [61] (Fig. S3). Furthermore, Prkag3 upregulation was predicted to coherently downregulate the expression of FoxO1, FoxO3 and Foxo4 isoforms, while upregulating FoxO6 (Fig. S2) supporting previous literature associating these FoxO isoforms with promotion of muscle atrophy [43, 62]. Importantly, the expression pattern of these genes in the prednisolone-treated Smn−/−;SMN2 SMA mice were normalized to healthy Smn+/−;SMN2 levels (Fig. S3c), supporting the usefulness of investigating metformin and these targets in SMA skeletal muscle.
We thus measured the mRNA expression levels of Prkag3 and FoxO isoforms in the triceps of both symptomatic P7 severe Smn−/−;SMN2 and P19 milder Smn2B/− SMA mice alongside their respective healthy controls. We indeed observed that Prkag3 levels were significantly downregulated in skeletal muscle of both SMA mouse models (Fig. 4a), supporting the bioinformatics data. However, none of the FoxO isoforms were significantly different between SMA mice and their healthy controls (Fig. 4b–e). Previous research also reported no significant upregulation of FoxO isoforms in P7 severe Smn−/−;SMN2 SMA mice via qPCR [43]. Although another study observed a significant upregulation of FoxO isoforms in the hindlimb muscles of Smn2B/− SMA mice [43], the wide variation observed in our experimental cohort could be due to differential vulnerabilities to denervation-induced muscle atrophy between hindlimb and triceps muscle [63] that could impact FoxO expression levels. However, the fact that our qPCR data did not reflect the bioinformatics predictions may also be due to variability in our experimental cohorts, the sequencing depth coverage not being sufficiently conservative and/or intrinsic differences between RNA-Seq and primer-based qPCR approaches [64].
Figure 4.
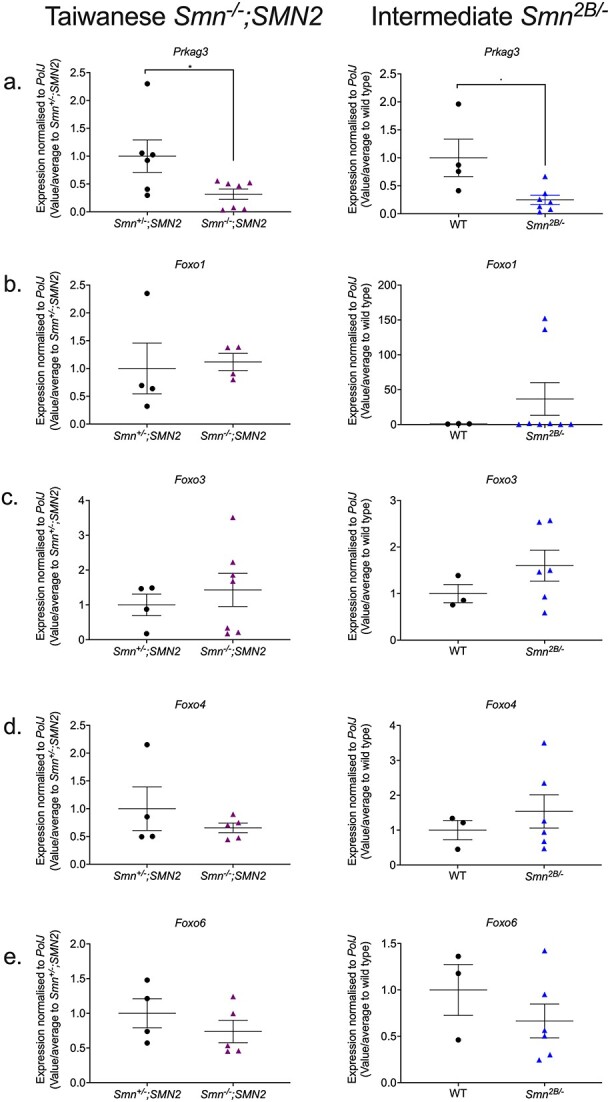
The metformin target gene, Prkag3, is significantly downregulated in the skeletal muscle of both symptomatic severe Smn−/−;SMN2 and milder Smn2B/− SMA mice. qPCR analysis of mRNA levels for predicted metformin target genes (a) Prkag3, (b) Foxo1, (c) Foxo3, (d) Foxo4 and (e). Foxo6 in the harvested triceps of symptomatic untreated P7 Taiwanese Smn−/−;SMN2 SMA mice and healthy Smn+/−;SMN2 controls (left panel) and symptomatic untreated P19 intermediate Smn2B/− SMA mice and wild type (C57BL/6J background) controls (right panel). Data are shown as scatter plot represent as mean ± SEM error bars; n = 4–7 animals per experimental group, unpaired t-test, *P < 0.05. Smn−/−;SMN2 Prkag3: P = 0.04; Smn−/−;SMN2 Foxo1: P = 0.82; Smn−/−;SMN2 Foxo3: P = 0.54; Smn−/−;SMN2 Foxo4: P = 0.37; Smn−/−;SMN2 Foxo6: P = 0.34; Smn2B/− Prkag3: P = 0.02; Smn2B/− Foxo1: P = 0.39; Smn2B/− Foxo3: P = 0.27; Smn2B/− Foxo4: P = 0.48; Smn2B/− Foxo6: P = 0.33.
Overall, our qPCR experiments revealed that the primary metformin target Prkag3 matched its bioinformatics prediction of being downregulated in both Smn−/−;SMN2 and Smn2B/− SMA mice, suggesting that this gene may be involved in both severe and milder SMA pathologies and an appropriate therapeutic molecular target in SMA muscle.
The predicted target genes for metformin are mostly Smn-independent in an SMA muscle cellular model
We next wanted to better understand if the aberrant expression of the metformin target genes was dependent on SMN expression and/or muscle atrophy. Thus, we firstly generated small interfering RNA (siRNA)-mediated Smn-depleted C2C12 myoblast-like cells, a useful and previously successful in vitro model [65]. We confirmed by qPCR that Smn mRNA levels were significantly reduced by up to 90% in C2C12 myoblasts and D8 C2C12 myotubes compared to scrambled siRNA and untreated controls (Fig. S4). We next investigated the effects of Smn knockdown on the expression of the predicted metformin target genes. In C2C12 myoblasts, we identified a significant upregulation of only the FoxO3 gene in Smn-depleted C2C12 myoblasts compared to controls (Fig. 5a), which reflects previous microarray analyses of specific FoxO isoforms upregulated in quadriceps femoralis muscle biopsies from Type 1 SMA patients [66]. However, in C2C12 myotubes we found that Smn knockdown (KD) had no effect on the expression of predicted metformin target genes (Fig. 5b), suggesting that for the most part, the expression of the predicted metformin genes is Smn-independent, thus representing ideal targets for SMN-independent therapies.
Figure 5.

Metformin target genes are pre-dominantly SMN-independent in an SMA muscle C2C12 cellular model. Smn siRNA knockdown was performed for (a) 48 h in C2C12 myoblasts and (b) every 48 h throughout differentiation in D8 C2C12 myotubes. mRNA expression of metformin target genes Prkag3, Foxo1, Foxo3, Foxo4 and Foxo6 was measured by qPCR and compared to non-transfected and scrambled siRNA transfected controls. D8 C2C12 myotubes were serum-starved for 24 h to induce canonical atrophy. mRNA expression of (c) atrogenes Atrogin-1 and MuRF-1 and (d) metformin target genes Prkag3, Foxo1, Foxo3, Foxo4 and Foxo6 was measured by qPCR and compared against non-starved myotubes. Serum-starved D8 C2C12 myotubes were treated with either physiological 30 μM metformin or supraphysiological 2 mM metformin for 24 h to evaluate mRNA expression via qPCR of (e) atrogenes Atrogin-1 and MuRF-1 and (f) metformin target genes Prkag3, Foxo1, Foxo3, Foxo4 and Foxo6 compared to serum-starved PBS vehicle treated control. Data are shown as scatter plot that represent mean ± SEM error bars; n = 4 samples per group across two independent experiments. Two-way ANOVA followed by uncorrected Fisher’s least significant difference (LSD). F = 3.543 (a); F = 2.332 (b); F = 4.9 (c); F = 3.493 (d); F = 0.057 (e); F = 0.235 (f); F = 0.401, *P < 0.05, **P < 0.01, ***P < 0.001.
We next investigated if the expression of the predicted metformin target genes is affected in vitro by muscle atrophy. However, one difficulty in mimicking SMA muscle atrophy in vitro is establishing denervation. Thus, based on evidence of shared pathway similarities from different pro-atrophy factors such as starvation and denervation [67], we used a validated method of 24-h serum-starvation in C2C12 myotubes to induce canonical atrophy, as confirmed by myotube loss and upregulation of pro-atrophic atrogin-1 levels (Fig. 5c). Next, we evaluated the expression of the predicted metformin target genes and observed a significant upregulation of FoxO3 and FoxO4 isoforms (Fig. 5d), reflecting their established roles in atrophy-dependent ubiquitin-proteasome pathways [43].
We then evaluated whether metformin could attenuate muscle atrophy in C2C12 myotubes. Based on initial gene-dose response experiments in both control C2C12 myoblasts and D8 myotubes, we treated our cells with physiological (60 μM) and supraphysiological (2 mM) metformin concentrations for 24 h (Fig. S5) [68]. The 30 μM physiological metformin concentration for 24 h did not attenuate muscle atrophy or impact the expression of the target genes in the serum starved C2C12 myotubes (Fig. 5e and f). However, for the supraphysiological 2 mM metformin concentration [68], we observed an upregulation of Atrogin-1 levels (Fig. 5e), suggesting an exacerbation of muscle atrophy. Further analysis of the predicted metformin target genes revealed no significant impact on their expression patterns either (Fig. 5f), suggesting that exacerbation of atrophy in C2C12 myotubes by supraphysiological metformin concentrations involves factors mostly outside of our predicted targets. However, it should be noted that metformin may have different effects in SMA muscle as there are still differences between distinct pro-atrophic factors [67].
Overall, our in vitro studies revealed that although most of our predicted metformin target genes are SMN-independent with some linked to muscle atrophy, they were mostly not linked to metformin’s influence on canonical atrophy in C2C12 myotubes.
Dose-dependent effect of metformin on disease progression and survival in Smn2B/− SMA mice
Next, we assessed metformin in the Smn2B/− SMA mouse model [69]. The rationale for conducting our in vivo pharmacological studies in the Smn2B/− SMA mice was based on their longer lifespan [69], responsiveness to SMN-independent therapies [42, 47], established metabolic and myopathy defects [43, 47, 69–72], and later symptomatic onset [69] making them a clinically relevant model for starting treatment regimens >P5 time-points [42, 47].
We initially administered a 200 mg/kg daily dose (diluted in 0.9% saline) starting from P5 until humane endpoint in Smn2B/− SMA mice and Smn2B/+ healthy control littermates, based on previous success in the muscle disorder CMDT1A, where metformin concentrations ranged from 100–250 mg/kg [60]. We observed no significant improvement in survival of Smn2B/− SMA mice treated with 200 mg/kg/day compared to untreated (Fig. 6a) and vehicle-treated animals (Fig. S6). We also found a significant reduction in the body weight of 200 mg/kg/day metformin-treated Smn2B/− SMA mice compared to untreated SMA animals, beginning 4 days after initial treatment at P9 (Fig. 6b). However, we did not observe any effects on weight in the 200 mg/kg/day metformin treated Smn2B/+ healthy control mice (Fig. S6b), indicating a disease specific effect of metformin. In terms of motor function, there was no significant difference in the righting reflex between untreated and 200 mg/kg/day metformin-treated Smn2B/− SMA mice (Fig. 6c) and Smn2B/+ healthy control animals (Fig. S7a–c).
Figure 6.

200 mg/kg/day metformin does not improve disease phenotype, while 400 mg/kg/day metformin reduces survival. All treated animals received a daily dose of metformin (either 200 or 400 mg/kg/day, diluted in 0.9% saline) by gavage starting at P5. (a) Survival curves of untreated (n = 13, 21 days median survival) and 200 mg/kg/day metformin-treated (n = 11, 21 days median survival) Smn2B/− SMA mice. Kaplan-Meier survival curve shown with log rank (Mantel-Cox) test, ns = not significant, P = 0.237. (b) Daily weights of untreated (n = 13) and 200 mg/kg/day metformin-treated (n = 11) Smn2B/− SMA mice. Data represented as mean ± SEM error bars; two-way ANOVA followed by a Sidak’s multiple comparison test, F = 402.1, df = 455, *P < 0.05, **P < 0.01, ***P < 0.001, ****P < 0.0001. (c) Daily righting reflex test for motor function activity up to a 30 s maximum time point in untreated (n = 13) and 200 mg/kg/day metformin-treated (n = 11) Smn2B/− SMA mice. Data are shown as bar chart with mean ± SEM error bars; unpaired T-test, ns = not significant, P = 0.833. (d) Survival curves of untreated (n = 13, 21 days median survival) and 400 mg/kg/day metformin-treated (n = 4, 16 days median survival) Smn2B/− SMA mice. Kaplan-Meier survival curve shown with log rank (Mantel-Cox) test, ****P < 0.0001. (e) Daily weights of untreated (n = 13) and 400 mg/kg/day metformin-treated (n = 9) Smn2B/− SMA mice. Data represented as mean ± SEM error bars; two-way ANOVA followed by a Sidak’s multiple comparison test, F = 184.9.1, df = 300. (f) Daily righting reflex test for motor function activity up to a 30 s maximum time point in untreated (n = 13) and 400 mg/kg/day metformin-treated (n = 9) Smn2B/− SMA mice. Data are shown as bar chart with mean ± SEM error bars; unpaired T-test, ns = not significant, P = 0.733.
Since our initial 200 mg/kg/day metformin dosage did not improve disease onset or disease progression in Smn2B/− SMA mice, we conducted pilot studies with a later treatment start point (P8) and a lower dose (100 mg/kg/day), which demonstrated similar effects to our initial dosing regimen (data not shown). We therefore tried a higher daily dosage of 400 mg/kg/day, starting at P5. Surprisingly, the higher 400 mg/kg/day dose significantly reduced survival in Smn2B/− SMA pups by 5 days (Fig. 6d), while having no significant impact on weight or righting reflex (Fig. 6e and f). Interestingly, 400 mg/kg/day metformin had no adverse effects in the healthy Smn2B/+ control littermates (Fig. S7d–f), suggesting that the adverse effects of the higher dose of metformin is disease specific.
Thus, our in vivo experiments demonstrated that metformin did not emulate prednisolone’s beneficial effects on SMA disease progression in SMA mice and is in fact not an ideal therapy candidate, due to dose- and disease-dependent adverse effects in SMA.
Higher 400 mg/kg/day metformin dosage is associated with hypoglycaemia in non-fasted Smn2B/− SMA mice
We next investigated the potential causes behind metformin’s adverse effects in SMA mice. With metformin being a glucose lowering agent for T2DM, we initially assessed blood glucose levels in P14 non-fasted, untreated, 200- and 400-mg/kg/day metformin treated Smn2B/− SMA and Smn2B/+ healthy mice 2 h after the final treatment. This time point was chosen to account for the reduced median survival in the higher dose SMA cohort. We observed that neither 200- or 400-mg/kg/day metformin treatments lowered blood glucose levels in Smn2B/+ healthy mice (Fig. 7a). However, we reported a significant reduction in blood glucose levels in 400 mg/kg/day metformin-treated Smn2B/− SMA mice compared to untreated SMA animals (Fig. 7a). Our results suggest that hypoglycaemic shock could have been one of the possible causes behind the premature death in the 400 mg/kg/day SMA cohort, further exacerbating the previously reported hypoglycaemia in SMA models [70] and patients [73, 74].
Figure 7.
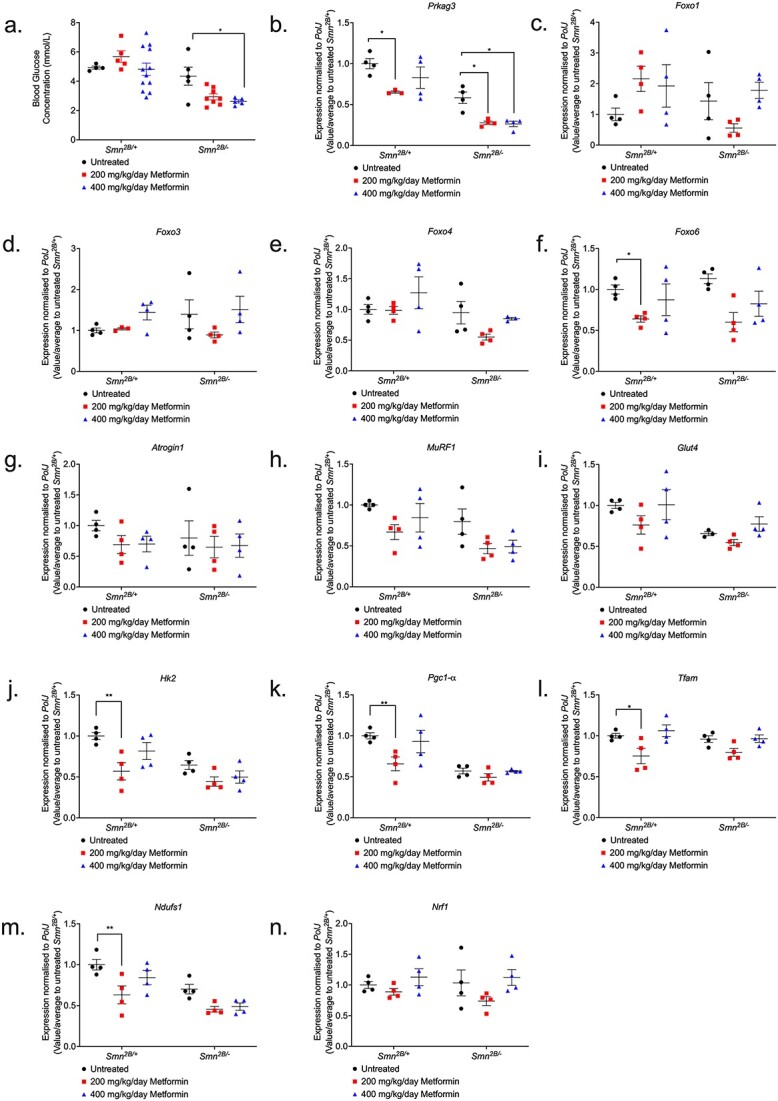
400 mg/kg/day metformin significantly lowers blood-glucose levels in Smn2B/− SMA mice, with no impact on markers of atrophy, glucose metabolism and mitochondrial regulation in skeletal muscle. (a) Blood-glucose concentrations (mmol/L) were measured 2 h after final treatment from untreated and 200 (red) or 400 mg/kg/day metformin-treated, non-fasted P14 Smn2B/+ healthy and Smn2B/− SMA mice. Data represented as bar chart with scatter graph represented as mean ± SEM error bars, n = 4 animals per group; two-way ANOVA with Tukey’s multiple comparisons test, F = 25.49, *P < 0.05. qPCR analysis of predicted metformin target genes (b) Prkag3, (c) Foxo1, (d) Foxo3, (e) Foxo4, (f) Foxo6; atrogenes (g) Atrogin-1, (h) MuRF1; and glucose uptake and metabolism genes (i) Glut4, (j) Hk2; and mitochondrial regulatory genes (k) Pgc1-α, (l) Tfam, (m) Ndufs1 and (n) Nrf1 in the TA muscle from untreated and 200 or 400 mg/kg/day metformin-treated, P14 Smn2B/+ healthy and Smn2B/− SMA mice. Data are shown as scatter graph represented as mean ± SEM error bars, n = 4 animals per group; two way ANOVA with Tukey’s multiple comparisons test, Prkag3 (F = 59.92), Foxo1 (F = 1.507), Foxo3 (F = 0.343), Foxo4 (F = 6.475), Foxo6 (F = 0.024), Atrogin-1 (F = 0.381), MuRF1 (F = 7.838), Glut4 (F = 9.9), Hk2 (F = 17.78), Pgc1-α (F = 29.84), Tfam (F = 0.423) Ndufs1 (F = 22.66), and Nrf1 (F = 0.164).
Metformin did impact the expression of the predicted target genes, but not muscle pathology markers in Smn2B/− SMA mice
We next evaluated the effect of metformin on the expression of the predicted target genes in TAs from P14 untreated, 200- and 400-mg/kg/day metformin-treated Smn2B/− SMA and Smn2B/+ healthy mice 2 h after final treatment. Contrary to the drug repositioning prediction that metformin could reverse Prkag3 downregulation in SMA muscle (Fig. S3), we instead discovered that both 200- and 400-mg/kg/day metformin doses exacerbated Prkag3 downregulation in Smn2B/− SMA muscle (Fig. 7b). Furthermore, although metformin had no impact on FoxO1, FoxO3 and FoxO4 isoforms in both Smn2B/+ healthy and Smn2B/− SMA muscle (Fig. 7c–e), for the 200 mg/kg/day Smn2B/− SMA cohort, metformin significantly reduced FoxO6 expression (Fig. 7f), which again contrasted our bioinformatics prediction that metformin would upregulate the expression of this isoform in SMA muscle. Thus, the drug-gene response for metformin-treated Smn2B/− SMA skeletal muscle reveals a contrasting pattern that does not match the bioinformatic predictions.
We next investigated metformin’s effects on the expression of dysregulated molecular markers associated with muscle atrophy (Atrogin-1 and MuRF-1) and glucose metabolism (Glut4 and Hk2) [75, 76]. We however observed that neither atrophy (Fig. 7g and h) or glucose metabolism markers (Fig. 7i and j) were affected by 200- and 400-mg/kg/day metformin treatments in the Smn2B/− SMA mice when compared to untreated animals.
We also investigated markers associated with mitochondrial biogenesis and function in muscle (Pgc1-α, Tfam, Ndufs1, and Nrf1), as previous research has established that these features are impaired in SMA skeletal muscle [46] and a common mechanism of action for metformin is mild inhibition of mitochondrial electron transport complex 1 (or NADH:ubiquinone oxidoreductase) [77]. We found that that neither the 200- or 400-mg/kg/day dose of metformin impacted the expression of mitochondrial genes in the skeletal muscle of Smn2B/− SMA mice (Fig. 7k–n), although we do observe a significant downregulation of Pgc1-α, Tfam, and Ndufs1 in the skeletal muscle of 200 mg/kg/day metformin-treated Smn2B/+ healthy counterparts (Fig. 7k–n).
Overall, our data highlights that metformin did not have a direct impact on the predicted target genes in skeletal muscle of SMA mice. Furthermore, the absence of direct impact on muscle atrophy, glucose metabolism, and mitochondrial function markers following metformin treatment in Smn2B/− SMA muscle, suggests that the adverse effects associated with the 400 mg/kg/day dosage may not have been linked to muscle-intrinsic effects.
A higher dose of metformin is associated with dysregulation of mitochondrial regulatory genes in the spinal cord of Smn2B/− SMA mice
We next investigated the effects of metformin on the spinal cord given that metformin is systemically distributed [78], has the ability to cross the blood-brain-barrier (BBB) [79] and can impact the mitochondria in the spinal cord [80]. We thus evaluated whether metformin altered the expression of mitochondrial markers (Pgc1-α, Tfam, Nrf1 and Ndufs1) in the spinal cord of P14 untreated, 200- and 400-mg/kg/day metformin treated Smn2B/− SMA mice compared to Smn2B/+ healthy mice, 2 h after final treatment.
For Pgc1-α, a master regulator of mitochondrial biogenesis and function, we observed that although both 200- and 400-mg/kg/day metformin concentrations significantly reduced its expression levels in Smn2B/+ healthy spinal cords (Fig. 8a), it was only the higher concentration that significantly reduced Pgc1-α expression in Smn2B/− SMA spinal cords (Fig. 8a). Similarly, 400 mg/kg/day metformin significantly reduced Ndufs1 levels in both Smn2B/+ healthy and Smn2B/− SMA spinal cords (Fig. 8b), suggesting that for these mitochondrial health markers, the higher metformin dose negatively affected their expression independent of disease status. On the other hand, although not affected by metformin in Smn2B/− SMA spinal cords, Nrf1 gene expression was significantly reduced by both metformin doses in the spinal cord of Smn2B/+ healthy mice (Fig. 8c), while Tfam was not affected by metformin in either cohort (Fig. 8d).
Figure 8.

400 mg/kg/day metformin dysregulates mitochondrial regulatory genes exclusively in spinal cord tissue from Smn2B/− SMA mice. qPCR analysis of mitochondrial regulatory genes (a) Pgc1-α, (b) Ndufs1, (c) Nrf1 and (d) Tfam in the spinal cord from untreated and 200 or 400 mg/kg/day metformin-treated, P14 Smn2B/+ healthy and Smn2B/− SMA mice. Data are shown as scatter graph represented as mean ± SEM error bars, n = 4 animals per group; two-way ANOVA with Tukey’s multiple comparisons test. (a) Pgc1-α (F = 1.526), (b) Ndufs1 (F = 1.135), (c) Nrf1 (F = 0.362) and (d) Tfam (F = 0.614), *P < 0.05, **P < 0.01.
Our results demonstrating that the higher dose of metformin (400 mg/kg/day) appears to specifically dysregulate certain mitochondrial genes in the spinal cord of Smn2B/− SMA mice is supported by recent evidence of tissue-dependent differences in conserved cellular processes between SMA motor neurons and skeletal muscle [49]. Thus, although further in-depth investigations would be needed, our results on mitochondrial health markers suggest that metformin’s adverse effects in SMA mice could be linked to the exacerbation of neuronal mitochondrial dysfunction.
Oxandrolone’s predicted target gene, Ddit4, is dysregulated in the skeletal muscle of severe Smn−/−;SMN2 SMA mice
Our second drug candidate that we selected to mimic prednisolone activities was oxandrolone, a synthetic orally bioavailable anabolic steroid that confers minimal androgynous effects [56]. Importantly for SMA, oxandrolone has been successful in the promotion of muscle growth for DMD [81] and mixed gender burn injury patients [82].
Oxandrolone was predicted to upregulate the Ar gene in SMA muscle (Fig. S8). The upregulation of Ar was predicted to directly upregulate downstream effectors Igfbp5 and myogenin (or MyoG) (Fig. S8), which both regulate muscle differentiation, regeneration and myofiber growth [83, 84]. Furthermore, Ar was predicted to indirectly upregulate Dok5, a signalling protein linked to insulin and IGF-1 activity [85] and Akap6, which is involved in the modulation of muscle differentiation and regeneration [86] (Fig. S8). In addition to these factors, we also decided to investigate Ddit4 as an oxandrolone target based on its direct relation with Ar [87] and being one of the top 20 downregulated DEG targets of prednisolone in Smn−/−;SMN2 SMA skeletal muscle (Table S2; Fig. S8).
Similar to our metformin strategy above, we initially wanted to evaluate the mRNA expression levels of these target genes in the triceps of both symptomatic P7 severe Smn−/−;SMN2 and P19 milder Smn2B/− SMA mice alongside their respective healthy controls. Overall, we identified no significant dysregulated expression of the target genes Ar, Akap6, Igfbp5, Dok5 and MyoG in both severe Smn−/−;SMN2 and milder Smn2B/− SMA mice (Fig. 9a–e). However, for Ddit4, we did identify a significant upregulation only in Smn−/−;SMN2 SMA mice (Fig. 9f), supporting both our bioinformatics data for this gene and its known pro-atrophic role [87], indicating that it may play an important role in SMA muscle pathologies. In summary, the majority of the predicted oxandrolone target genes did not significantly reflect their bioinformatic predictions.
Figure 9.
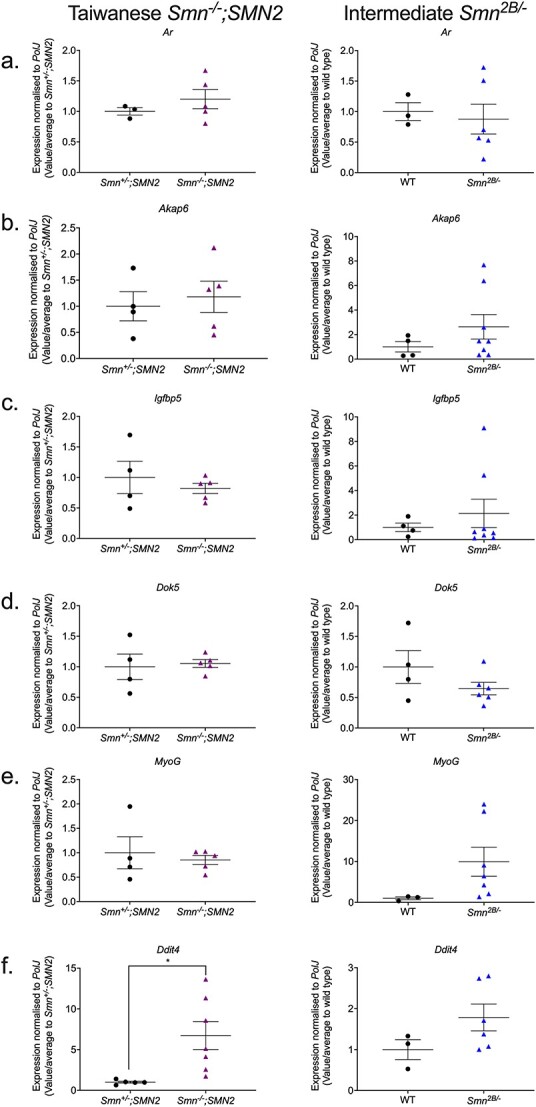
The oxandrolone target gene, Ddit4, is significantly upregulated in the skeletal muscle of severe Smn−/−;SMN2 SMA mice. qPCR analysis of mRNA levels for predicted oxandrolone target genes (a) Ar, (b) Akap6, (c) Igfbp5, (d) Dok5, (e) MyoG and (f) Ddit4 in the harvested triceps of untreated P7 Taiwanese Smn−/−;SMN2 SMA mice and healthy Smn+/−;SMN2 controls (left panel) and symptomatic untreated P19 milder Smn2B/− SMA mice and wild type (C57BL/6J background) controls (right panel). Data are shown as scatter plot that represents mean ± SEM error bars; n = 4–7 animals per experimental group, unpaired t-test, *P < 0.05. Smn−/−;SMN2 Ar: P = 0.38; Smn−/−;SMN2 Akap6: P = 0.68; Smn−/−;SMN2 Igfbp5: P = 0.49; Smn−/−;SMN2 Dok5: P = 0.79; Smn−/−;SMN2 MyoG: P = 0.64; Smn−/−;SMN2 Ddit4: P = 0.02; Smn2B/− Ar: P = 0. 75; Smn2B/− Akap6: P = 0. 29; Smn2B/− Igfbp5: P = 0.52; Smn2B/− Dok5: P = 0.19; Smn2B/− MyoG: P = 0.15, Smn2B/− Ddit4: P = 0.16.
In vitro oxandrolone treatment prevents canonical atrophy in C2C12 myotubes independently of the predicted Smn-independent targets
Similar to our metformin in vitro studies, we wanted to evaluate whether reduced SMN levels or atrophy influenced the expression of the predicted oxandrolone target genes in SMA skeletal muscle. Although none of the target genes were affected in the Smn-depleted C2C12 myoblasts (Fig. 10a), we found that Smn KD triggered a significant upregulation of Dok5 only in C2C12 myotubes (Fig. 10b), suggesting that the expression of this gene may be Smn-dependent. Nevertheless, the expression of the majority of the predicted oxandrolone target genes was Smn-independent.
Figure 10.

Oxandrolone target genes are pre-dominantly SMN-independent in SMA muscle C2C12 cellular model. Smn siRNA knockdown (red) was performed for (a) 48 h in C2C12 myoblasts and (b) every 48 h throughout differentiation in D8 C2C12 myotubes. mRNA expression of oxandrolone target genes Ar, Akap6, Igfbp5, Dok5, MyoG and Ddit4 was measured by qPCR and compared to non-transfected and scrambled siRNA transfected controls. D5 C2C12 myotubes were serum-starved for 24 h to induce canonical atrophy. mRNA expression of (c) atrogenes Atrogin-1 and MuRF-1 and (d) oxandrolone target genes Ar, Akap6, Igfbp5, Dok5, MyoG and Ddit4 was measured by qPCR and compared to non-starved myotubes. Serum-starved D5 C2C12 myotubes were treated with1 μM oxandrolone for 24 h to evaluate mRNA expression via qPCR of (e) atrogenes Atrogin-1 and MuRF-1 and (f) oxandrolone target genes Ar, Akap6, Igfbp5, Dok5, MyoG and Ddit4 compared to serum-starved absolute ethanol vehicle treated control. Data are shown as scatter graphs that represent mean ± SEM error bars; n = 4 samples per group across two independent experiments. Two-way ANOVA followed by uncorrected Fisher’s least significant difference (LSD). (a) F = 5.45; (b) F = 6.87; (c) F = 1.1; (d) F = 2.03; (e) F = 0.72; (f) F = 0.36, *P < 0.05, **P < 0.01, ***P < 0.001, ****P < 0.0001.
We next wanted to evaluate the ability of oxandrolone to attenuate canonical atrophy in serum-deprived C2C12 myotubes [88]. However, in this case we performed the treatments in D5 C2C12 myotubes instead of D8, as although oxandrolone was non-toxic (Fig. S9), it elicited a greater androgen Ar response at the earlier differentiation stage (Fig. S10). Following confirmation of muscle atrophy in D5 C2C12 myotubes via significant Atrogin-1 and MuRF1 upregulation (Fig. 10c), we observed that the expression of the predicted oxandrolone target genes Akap6, Igfbp5, MyoG and Ddit4 was significantly downregulated in serum-deprived D5 C2C12 myotubes (Fig. 10d).
Interestingly, we found that 24-h treatment with 1 μM oxandrolone attenuated canonical muscle atrophy in these serum-starved D5 C2C12 myotubes as shown by significant downregulation of Atrogin-1 (Fig. 10e). However, we observed that Igfbp5, MyoG and Ddit4 were further downregulated by the 1 μM oxandrolone treatment (Fig. 10f), suggesting that oxandrolone’s effects on atrophy are linked to effectors independent of the predicted target genes.
Overall, our in vitro studies have shown that although the expression of the predicted oxandrolone target genes is Smn-independent, they are not involved in oxandrolone’s ameliorative effects on canonical atrophy in C2C12 myotubes.
Oxandrolone treatment improves survival in Smn2B/− SMA mice
We next assessed the impact of oxandrolone in SMA mice. We initially tested preliminary treatment regimens of 1–8 mg/kg/day starting from P5 or P8 in Smn2B/− SMA and Smn2B/+ healthy mice (data not shown), based on previous studies in models of spinal cord injury (SCI) [89] and burn injury [90]. We also stopped oxandrolone treatments at P21 as previous research has shown that shorter oxandrolone treatments are more effective [89]. These pilot studies allowed us to identify the optimal dosing regimen of 4 mg/kg/day oxandrolone treatment from P8 to P21, which significantly improved the median survival of Smn2B/− SMA mice (Fig. 11a).
Figure 11.

4 mg/kg/day oxandrolone treatment partially improves survival in Smn2B/− SMA mice. All treated animals received a daily dose of oxandrolone (4 mg/kg/day, suspended in 0.5% CMC) by gavage starting at P8. (a) Survival curves of untreated (n = 15, 21 days median survival) and 4 mg/kg/day oxandrolone-treated (n = 12, 24 days median survival) Smn2B/− SMA mice. Kaplan-Meier survival curve shown with log rank (Mantel-Cox) test, ***P = 0.0006. (b) Daily weights of untreated (n = 15) and 4 mg/kg/day oxandrolone-treated (n = 12) Smn2B/− SMA mice. Data represented as mean ± SEM error bars; two-way ANOVA followed by a Sidak’s multiple comparison test, F = 610.8, df = 519, *P < 0.05, **P < 0.01, ***P < 0.001, ****P < 0.0001. (c) Daily righting reflex test for motor function activity up to a 30 s maximum time point in untreated (n = 15) and 4 mg/kg/day oxandrolone-treated (n = 12) Smn2B/− SMA mice. Data are shown as bar chart with mean ± SEM error bars; unpaired t-test, ns = not significant, P = 0.775. qPCR analysis of mRNA levels for atrogenes (d) Atrogin-1 and (e) MuRF1 and predicted target genes (f) Ar, (g) Akap6, (h) Igfbp5, (i) Dok5, (j) MyoG, and (k) Ddit4 in the triceps muscle from untreated and 4 mg/kg/day oxandrolone-treated, P19 Smn2B/+ healthy and Smn2B/− SMA mice. Data are shown as bar chart with scatter graph represented as mean ± SEM error bars, n = 4 animals per group; two way ANOVA with Tukey’s multiple comparisons test, Atrogin-1 (F = 0.1914), MuRF1 (F = 1.214), Ar (F = 0.003), Akap6 (F = 2.40), Igfbp5 (F = 0.06), Dok5 (F = 1.72), MyoG (F = 0.29) and Ddit4 (F = 0.64), *P < 0.05, **P < 0.01.
However, we found that the body weight of 4 mg/kg/day oxandrolone-treated Smn2B/− SMA mice was significantly lower compared to their untreated counterparts (Fig. 11b), which is most likely due to the intrinsic smaller sizes of the randomly assigned litters, as demonstrated by the difference in weight starting 4 days prior to initial treatment (Fig. 11b). In terms of motor function, we observed no significant difference in righting reflex between untreated and oxandrolone-treated SMA animals (Fig. 11c). Furthermore, we identified no impact of vehicle treatment on survival, weight, and righting reflex in Smn2B/− SMA mice (Fig. S11).
In the Smn2B/+ healthy mice, although 4 mg/kg/day oxandrolone had no effect on survival or motor function in treated animals (Fig. S12a and b), we did observe a significant decrease in bodyweight starting from P9, one day after initial treatment (Fig. S12c), suggesting that oxandrolone may have impacted growth.
Nevertheless, our results demonstrated that although 4 mg/kg/day oxandrolone treatment improved survival in Smn2B/− SMA mice, its effect on survival was still minor compared to prednisolone [27], suggesting that oxandrolone is not a suitable substitute as an SMA skeletal muscle therapy.
Oxandrolone did not impact the expression of the predicted target genes or muscle pathology markers
The improved 3-day survival in 4 mg/kg/day oxandrolone-treated Smn2B/− SMA mice led us to evaluate whether this beneficial impact was related to targeting muscle pathologies. Thus, we evaluated oxandrolone’s effects on the expression of dysregulated molecular markers associated with the SMA hallmark pathology of muscle atrophy (Atrogin-1 and MuRF-1) in the triceps from P19 late symptomatic, untreated and 4 mg/kg/day oxandrolone-treated Smn2B/− SMA and Smn2B/+ healthy mice, 2 h after final treatment. We observed no significant reduction in elevated Atrogin-1 or MuRF-1 gene expression levels by oxandrolone in the Smn2B/− SMA cohort (Fig. 11d and e), suggesting that oxandrolone did not attenuate muscle atrophy.
We next evaluated the effect of oxandrolone on the expression of the predicted target genes in the same P19 untreated and 4 mg/kg/day oxandrolone-treated Smn2B/− SMA and Smn2B/+ healthy mice. We found that oxandrolone did not significantly impact the predicated target genes in the triceps from the Smn2B/− SMA mice (Fig. 11f–k). However, we did observe that 4 mg/kg/day oxandrolone treatment significantly upregulated Dok5 expression in the Smn2B/+ healthy mice (Fig. 11i). Nevertheless, the pattern observed suggests that oxandrolone did not impact any of the predicted genes in the muscle from Smn2B/− SMA mice.
Overall, our data shows that oxandrolone did not have an efficient effect on the predicted target genes. Furthermore, its inability to ameliorate muscle atrophy marker dysregulation in SMA skeletal muscle, suggests that improved survival in the Smn2B/− SMA mice by oxandrolone may be independent of targeting skeletal muscle pathologies.
Both metformin and oxandrolone drug candidates attenuate neuromuscular phenotypes in the C. Elegans severe SMA model
We next wanted to investigate our drug candidates in a separate SMA model to assess whether they could attenuate neuromuscular dysfunctions in a distinct species. For this purpose, we used the C. elegans smn-1(ok355) invertebrate model [91], based on shared conservation of the SMN protein with vertebrate species [92] and the well described phenotypic defects of larval lethality (reduced survival) and impaired neuromuscular function in pharyngeal pumping for feeding and locomotion [91, 93]. For metformin, administration at higher doses of 50 mM partially ameliorated multiple phenotypes only in C. elegans smn-1(ok355), including pharyngeal pumping defects and the locomotory defect of number of reversals (Fig. 12a and b), however, only the lower dose of 1 mM metformin significantly ameliorated paralysis times (Fig. 12c). On the other hand, oxandrolone across 1–50 μM doses significantly ameliorated pharyngeal pumping defects only (Fig. 12d), with no significant effect on locomotory defects of reversal and paralysis times (Fig. 12e and f), suggesting an improvement in muscular activity in the pharynx region. Overall, given SMN conservation across species, oxandrolone could improve neuromuscular defects across vertebrate and invertebrate models of SMA.
Figure 12.
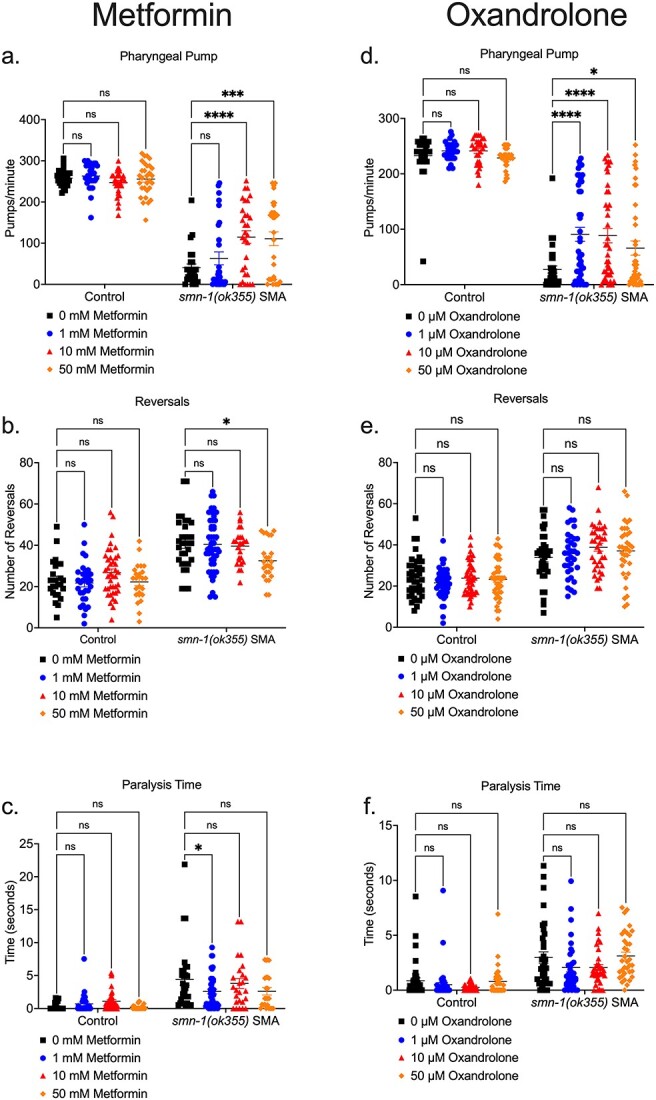
Metformin and oxandrolone partially ameliorates neuromuscular defects in the severe SMA C. Elegans model. Day 3 C. Elegans smn-1(ok355) SMA homozygotes and smn-1(ok355)I/hT2 control heterozygotes were maintained at 20°C on nematode growth medium (NGM) plates seeded with Escherichia coli OP50 bacteria. In metformin conditions, the NGM contained metformin concentrations of 0, 1, 10 and 50 mM respectively. (a) Pharyngeal pumping rates (pumps/minute) defined as grinder movement in any axis at 175 frames/10 s. Locomotion assays were filmed at 15 frames/sec and quantified for 5 min for (b) reversals and (c) paralysis times in the C. Elegans groups. In oxandrolone conditions, the NGM contained oxandrolone concentrations of 0, 1, 10 and 50 μM respectively. (d) Pharyngeal pumping rates (pumps/minute) defined as grinder movement in any axis at 175 frames/10 s. Locomotion assays were filmed at 15 frames/sec and were quantified for 5 min for (e) reversals and (f) paralysis times in the C. Elegans groups. Data are shown as scatter plot that represents mean ± SEM error bars; n > 25 animals per experimental group across three independent trials; two-way ANOVA with Tukey’s multiple comparisons test, (a) F = 459.2, (b) F = 108.6, (c) F = 52.59, (d) F = 501.8, (e) F = 121.1, (f). F = 57.06, ns = not significant *P < 0.05, **p < 0.01, ***P < 0.001.
Discussion
The goal of this study was to use a transcriptomics-based drug repositioning strategy to identify clinically approved drug candidates that could emulate prednisolone’s beneficial effects in SMA skeletal muscle and life expectancy [27], without the risks associated with long-term GC exposure [39].
Our major finding was the observation that prednisolone treatment restored specific gene sets associated with key pathological SMA pathways such as FoxO signalling [43], p53 signalling [44], AMPK signalling [45], mitophagy [46], circadian rhythm [47], PPAR signalling [48], and autophagy [49] in Smn−/−;SMN2 SMA skeletal muscle. Although these pathway results highlight prednisolone’s efficacy in improving skeletal muscle health, it should be noted that our transcriptomic data cannot distinguish whether these restorations are targeted directly by prednisolone or a consequence of improved muscle health. Nevertheless, our transcriptomic data complemented the prior phenotypic data of prednisolone’s potential as a second-generation SMA therapy [27].
Despite a multitude of promising compounds identified that could be investigated in future studies, one of the findings of our study was that neither of our chosen orally bioavailable drug candidates, metformin and oxandrolone, reproduced prednisolone’s previously reported effect on muscle growth and survival in SMA mice [27]. For metformin, we observed that both 200- and 400-mg/kg/day doses counterintuitively exacerbated Prkag3 downregulation in Smn2B/− SMA muscle instead of the predicted upregulation, which could have negative consequences since Prkag3−/− null mice presented metabolic and mitochondrial dysregulation [94, 95] similar to those reported in SMA patients [46, 74] and models [70, 71]. More surprising was the reduced survival of Smn2B/− SMA mice treated with 400 mg/kg/day metformin, which we potentially linked to possible hypoglycaemic shock and/or dysregulation of neuronal mitochondrial components. On the other hand, although various metformin doses ameliorated neuromuscular dysfunction in our SMA C. elegans model, the negative effects observed in Smn2B/− SMA mice could be to due vertebrate vs invertebrate systems. Curiously, previous research into AMPK agonism via 500 mg/kg AICAR treatment in the SmnΔ7 SMA mice contrasts our metformin data, as they showed improved skeletal muscle health and no exacerbations in neuronal dysfunction [45]. One explanation for metformin and AICAR’s conflicting results in SMA mice could be related to differential pharmacological activities. Indeed, AICAR is an AMP analog with a low BBB penetrability [96] that directly binds to the γ-AMPK isoform [97, 98], while metformin can rapidly penetrate the BBB [79] and has been associated with direct and indirect AMPK activation [78], an example of the latter involving mitochondrial respiratory complex 1 inhibition [77]. With emerging evidence of naturally low mitochondrial respiratory complex 1 activity in SMA motor neurons [99] and SMA pathway profiles being tissue-dependent [49], one theory could be that the 400 mg/kg/day metformin dose exacerbated mitochondrial respiratory complex 1 inhibition in SMA motor neurons. However, future studies would be needed to verify this proposed model. Nonetheless, our findings could be important for clinical drug safety, as with reported co-morbidities of diabetes in certain SMA patients [100, 101], our pre-clinical data suggests lower metformin doses or non-biguanide drugs may be important to manage diabetes and not risk primary pathologies in SMA patients.
For oxandrolone, our mouse data showed that 4 mg/kg/day treatment from P8 partially improved survival in Smn2B/− SMA mice, although not to the same extent observed with prednisolone [27]. In addition, we identified that the lower dose of 1 μM oxandrolone in vitro attenuated canonical atrophy in C2C12 myotubes, while in vivo oxandrolone attenuated neuromuscular dysfunction in severe SMA C. elegans model, suggesting that in both our SMA vertebrate and invertebrate species oxandrolone may be a beneficial SMN-independent treatment option.
An additional factor that could contribute to the different pharmacological response in observed in our mouse and C. elegans models is sex-specific differences. Indeed, emerging clinical evidence collected from 3838 SMA patients across 18 countries shows that severe neuromuscular pathologies are more frequent in SMA types 2 and 3b male patients compared to females [102]. Furthermore, both metformin and oxandrolone have demonstrated sex-specific effects on muscle pathology. Indeed, metformin treatment significantly improved skeletal muscle function only in the female mouse model for CMDT1A [60]. On the other hand, studies with Ar knock out (KO) rodent models have demonstrated that Ar absence does not have the same impact on female muscle size compared to males [103]. In addition, it is suggested that intramuscular Ar content may have a stronger influence on hypertrophy than peripheral androgen levels [104], suggesting that oxandrolone may be more beneficial in males. Thus, future studies need to take into consideration the sex of the SMA models when evaluating drug efficacy.
Despite our study’s limitations, it highlighted refinements for future in silico SMA drug repositioning studies. Compared to a previous study that successfully identified and validated harmine’s therapeutic potential in SMA muscle [42], ours did not include proteomics. The absence of proteomics can be a caveat for drug studies as transcript levels alone do not proportionally reflect drug-protein interactions, abundance and translational modifications [105, 106]. However, a limitation of both transcriptomics and proteomics approaches is that they cannot bridge drug-pathway interactions with disease phenotypes, as demonstrated by a recent proteomics analysis of Spinraza®-treated Type 2 and 3 SMA patients that could not correlate protein profiles with functional improvements [107]. Thus, implementation of metabolomics may be beneficial for linking pathway perturbations with metabolites associated with disease and stages of muscle atrophy [108]. To the best of our knowledge, this three-pronged multi-omics approach has not previously been used in SMA drug repositioning, however it has been successful in the identification of 200 biomarker candidates for SMA [109]. Importantly, and as demonstrated in our previous work [42], the power of multi-omics lies in the ability of further defining the molecular and signalling changes that occur in cells and tissues following treatment, which can allow for the refinement of therapeutics targets and repurposed drugs as well as for the investigation of potential mechanisms behind responsive and non-responsive cohorts.
Another consideration is systemic effects of the drugs as seen with the enhanced lethality of the 400 mg/kg/day metformin’s dose in Smn2B/− SMA mice being linked to hypoglycaemia and mitochondrial dysfunction in neuronal tissue. Indeed, adverse systemic risks were also found with a previous multi-omics drug repositioning study for SMA muscle that identified the development of tremors in harmine-treated Smn2B/− SMA mice [42]. With tissue-dependent differences in conserved pathways in SMA [49], future omics studies could integrate data from both neuronal and skeletal muscle to minimize systemic adverse risks.
Even with these refinements, future drug repositioning studies for SMA skeletal muscle pathology may need to consider replacing bulk RNA-Seq. Skeletal muscle fibres are comprised of a myriad of different muscle fibre and cell types, alongside non-muscular interconnecting tissues such as neurons, tendons, adipose, immune cells and capillaries [110, 111], which altogether does not truly represent the transcriptomic profiles for distinct skeletal muscle cells. Indeed, our significant KEGG pathway results included those associated exclusively with neuronal, immune, and capillary cells such as glioma, atherosclerosis and Th17 cell differentiation. With alterations in fibre type composition [72, 112] and satellite cell dysregulation evidenced in SMA muscle [23], an emerging alternative to predict drug candidates that target dysregulated SMA pathways in these muscle types would be single-cell (scRNA-Seq) and/or single nuclear RNA-Seq (snRNA-Seq) [111], which have already been useful tools in other muscular disorders such as DMD [113, 114]. In addition, snRNA-Seq could have further benefits to narrow in on muscle regions such as nuclei located near the NMJ, since myonuclei display spatial and temporal expression pattern heterogeneity in multi-nucleated myofibers [111].
Although the drug candidates metformin and oxandrolone did not emulate prednisolone’s beneficial effects in SMA to the extent previously reported, our transcriptomics-drug repositioning approach did better define prednisolone’s activity in SMA muscle and provided a list of potential candidates for future pre-clinical SMA drug repositioning studies. Furthermore, our study highlights important refinements for future SMA drug repositioning studies.
Materials and Methods
Animal procedures
Experiments with the severe (Taiwanese) Smn−/−;SMN2 (FVB/N background, FVB.Cg-Smn1tm1HungTg(SMN2)2Hung/J) SMA mice [40] and Smn+/−;SMN2 healthy control littermates were carried out in the University of Oxford Biomedical Sciences Unit (BSU), in accordance with the UK Home Office authorisation (Animals Scientific Procedures Act (1986), UK Home Office Project Licence PDFEDC6F0).
The Smn2B/− SMA mouse model [69] was generated by breeding Smn2B/2B mice (generously provided by Dr Rashmi Kothary (University of Ottawa), Dr Lyndsay Murray (University of Edinburgh) and Professor Matthew Wood (University of Oxford) before being sent to Charles River for rederivation) with Smn+/− mice (B6.Cg-Smn1/J, stock #007963, Jackson Labs). All live procedures on wild type (WT) (C57BL/6 background), Smn2B/− SMA and Smn2B/+ healthy littermates were performed in the Keele University BSU, in accordance with the UK Home Office authorisation (Animals Scientific Procedures Act (1986), UK Home Office Project Licence P99AB3B95).
For all behavioural experiments, body weights and righting reflex [115] (up to 30 s) were assessed daily from birth until animals reached their humane endpoint, defined in our UK Home Office Project Licence (P99AB3B95) as the time at which the animal displays hindlimb paralysis, immobility, inability to right (greater than 30 s), 4 consecutive days of weight loss and/or up to 20% body weight loss.
As previously described [27], prednisolone (5 mg tablet, Almus) (5 mg/kg dissolved in water) was administered every second day by gavage from post-natal day (P)0 to P7 in Smn−/−;SMN2 SMA and Smn+/−;SMN2 healthy mice and from P0 to P20 in Smn2B/− SMA and Smn2B/+ healthy mice. Metformin hydrochloride (#PHR1084, Sigma-Aldrich) was dissolved in 0.9% saline physiological solution (tablet dissolved in sterile water) (#07982, Sigma) and administered daily (200 or 400 mg/kg) by gavage from P5 to humane endpoint in Smn2B/− SMA, Smn2B/+ healthy and WT mice. Oxandrolone (#SML0437, Sigma-Aldrich) was prepared in 0.5% carboxymethylcellulose (CMC) solution (powder dissolved in 0.9% saline solution) (#C5678, SLS) by sonication at 37 kHz for 3 min and administered (4 mg/kg) daily by gavage from P8 to P21 in Smn2B/− SMA, Smn2B/+ healthy and WT mice.
Blood-glucose measurement
Blood was collected from non-fasted Smn2B/− SMA and Smn2B/+ healthy mice and glucose levels were immediately measured (mmol/l) via True Metrix® GO Self-Monitoring Blood Glucose Meter (Trividia Health™) and True Metrix® Test Strips (Trividia Health™).
RNA-sequencing (RNA-Seq)
Total RNA was extracted from triceps of symptomatic P7 untreated and prednisolone-treated Taiwanese Smn−/−;SMN2 SMA and Smn+/−;SMN2 healthy mice (Table S12). The triceps were immediately placed in RNALater (#AM7030, ThermoFisher) following dissection and stored at −20°C under further analysis. For mRNA isolation, 500 ng of total RNA was used as input for the NEBNext® Poly(A) mRNA Magnetic Isolation Module’ (#E7490L, New England Biolabs (NEB)) in accordance with the manufacturer’s standard instruction. Library preparation was carried out using the NEBNext® Ultra Directional RNA Library Prep Kit for Illumina (#E7420L, NEB). Barcoded libraries from each experimental sample were combined in equimolar concentrations of 1.5 pM prior to sequencing at 75 bp × 1 (single-end) read metric on a NextSeq 550 (Illumina) system.
Differential gene expression analysis
For the RNA-Seq data from the triceps of P7 untreated and prednisolone-treated Taiwanese Smn−/−;SMN2 SMA and Smn+/−; SMN2 healthy mice (Table S12), differential gene expression (DGE) analysis was performed in Galaxy (usegalaxy.org) [116]. After initial quality control assessments via FastQC v0.72 + galaxy1 [117], we trimmed reads based on SLIDINGWINDOW of 4 bp at average quality read of 32 in Trimmomatic v0.36.5 [118] and trimmed the first 12 abnormal bases in Trim sequences v1.0.2 [119]. After quality control confirmation with FastQC v0.72 + galaxy1 [117] the processed 63 bp single-reads were aligned to an in-built UCSC Mus musculus mm10 genome via HISAT2 v2.1.0 [116, 120] under a reverse (or antisense) strand setting. Count quantification of aligned single-reads to mapped coding genes was performed by FeatureCounts v1.6.3 + galaxy2 [116, 121] using an in-built Entrez Mus musculus mm10 gene transfer file (GTF) with known gene identifier set at -exon level. Mapping and count quantification was visualized through MultiQC v1.6 [122]. For DGE analysis of our raw transcript counts, we used DESeq2 v2.11.40.2 [123] under the design formula of “Condition” (SMA vs Healthy) and “Treatment” (Untreated vs Prednisolone) after removal of 1 outlier (prednisolone-treated Smn−/−;SMN2 sample N0603). We set differentially expressed gene (DEG) significance at log2 fold change (FC) > 0.6 and false discovery rate (FDR) < 0.05. The Entrez Gene IDs were translated to official Mus musculus gene symbols by AnnotatemyID v3.7.0 [116]. The normalized count files generated by DESeq2 of prednisolone-treated Taiwanese Smn−/−;SMN2 SMA mice vs untreated Smn−/−;SMN2 SMA and Smn+/−;SMN2 healthy mice were generated into heatmaps by Heatmap2 v2.2.1 + galaxy1 [116] under -data log2 transformed and scaled by -row scale genes.
Pathway analysis and drug repositioning
Pathway analysis of the prednisolone-treated vs untreated Taiwanese Smn−/−;SMN2 SMA mice was performed with iPathwayGuide [50] (Advaita) with default criteria of log2FC > 0.6 and FDR < 0.05 for DEGs. The impact analysis performed by iPathwayGuide incorporated our DEGs expression (log2FC) and its topological position in the KEGG pathway database [124] to calculate significantly impacted pathways P < 0.05 (KEGG v1910 Release 90.0+/05–29, May 19, GODb v1910 2019-Apr 26). Furthermore, overrepresentation analysis [125] (ORA) with elimination pruning [126] was performed for gene ontology (GO) pathways [127] and predicted upstream regulators (STRING v11.0, Jan 19th, 2019). Drug candidate identification was performed through an in-built KEGG drugs database [124] aligned to KEGG pathways in iPathwayGuide and by drug-gene interactions for upstream regulators in the Drug Gene Interaction Database [51] (DGIdb) v3.0.
Molecular docking
Ligands were modelled and optimized using LigPrep (2021-4, Schrödinger LLC, New York, NY) and MacroModel (2021-4, Schrödinger LLC, New York, NY) according to the OPLS4 (2021-4, Schrödinger LLC, New York, NY) forcefield parameters [128]. Protein structures were downloaded from the RCSB databank [129] and prepared using the Protein Preparation Wizard (2021-4, Schrödinger LLC, New York, NY) [130], where redundant molecules are removed, hydrogen and missing heavy atoms were added, bond orders were assigned, water orientations were sampled, ionization and tautomeric states of certain residues are set. Restrained force field minimization was applied by converging heavy atoms to 3.0 Å and receptor grids were generated for the active sites. Molecular docking was performed using Glide (2021-4, Schrödinger LLC, New York, NY) at extra precision mode at 100 runs per each ligand-receptor complex [131].
Methodology was validated by a redocking of the co-crystallized ligand for each protein structure.
C2C12 cell culture
The immortalized murine C2C12 myoblast-like cell line [132] (#CRL-1772, ATCC, USA) was maintained in growth media comprised of high glucose (4.5 g/l) and L-glutamine (0.6 g/l) Dulbecco’s Modified Eagle’s Media (DMEM) (#BE12-741F, Lonza), 10% foetal bovine serum (FBS) (#10438026, Gibco), and 1% penicillin-streptomycin (10 000 U/ml) (#15140122, Gibco). C2C12 myoblasts were differentiated into myotubes in a differentiation media comprised of high glucose (4.5 g/l) and L-glutamine (0.6 g/l) DMEM (#BE12-741F, Lonza), 2% horse serum (HS) (#26050070, Gibco), 1% penicillin-streptomycin (10 000 U/ml) (#15140122, Gibco), and 0.1% insulin (1 μg/ml) (#I6634, Sigma) for 2–8 days with media replacement every 48 h. All cultured cells were incubated in humid 37°C and 5% CO2 conditions (Heracell 150i CO2 incubator, ThermoScientific).
In vitro drug treatment
Proliferating C2C12 myoblasts were seeded in 6-well plates (×4 wells per group). In vitro drug treatments began at 50%–60% confluence for C2C12 myoblasts and D7 stage for C2C12 myotubes. For metformin groups, they were treated with metformin hydrochloride (#PHR1084, Sigma-Aldrich) dissolved in phosphate buffered saline (PBS), pH 7.4 (#10010023, ThermoFisher) at concentrations of 0.3, 0.6, 1 and 2 mM for 24 h against a PBS control (0.1% v/v). For oxandrolone groups, they were treated with oxandrolone (#SML0437, Sigma-Aldrich) dissolved in ethanol absolute > 99.8% (#20821.296, VWR) at concentrations of 1, 10 and 100 μM for 24 h against an ethanol absolute > 99.8% vehicle control (0.1% v/v).
Lactate dehydrogenase (LDH) assay
Drug cytotoxicity was measured by the lactate dehydrogenase (LDH)-Glo™ Cytotoxicity Assay Kit (#J2380, Promega) following manufacturer’s instructions. Luminescence was measured at 400 nm using the GloMax® Explorer Multimode Microplate Reader (#GM3500, Promega).
Bromodeoxyuridine (BrDU) cell proliferation assay
Cell proliferation was measured by the Bromodeoxyuridine (BrDU) Cell Proliferation Assay Kit (#QIA58, Sigma-Aldrich) following manufacturer’s instructions. Absorbance was measured at 450–540 nm using the GloMax® Explorer Multimode Microplate Reader (#GM3500, Promega).
Small interfering RNA-mediated Smn knockdown in C2C12 cells
A 10 μM Smn small interfering RNA (siRNA) (Duplex name: mm.RiSmn1.13.1) (Integrated DNA Technologies (IDT)) was used to knock down Smn levels against a 10 μM scrambled siRNA (scrambled DsiRNA, #51-01-19-08) (IDT) negative control. The Smn and scrambled siRNAs were aliquoted separately into an siRNA-lipofectamine complex containing Lipofectamine® RNAiMAX Reagent (#13778075, Invitrogen) and Opti-MEM (#31985062, Gibco) following manufacturer’s instructions. C2C12 myoblasts were transfected for 48 h with Smn depletion, while C2C12 myotubes were freshly transfected at differentiation (D) stages D0, D3 and D6 for 48 h with Smn depletion confirmed via quantitative polymerase chain reaction (qPCR) (Table S13).
Serum starvation-induced canonical muscle atrophy in differentiated C2C12 myotubes
Differentiated C2C12 myotubes were incubated in serum-free glucose (4.5 g/l) and L-glutamine (0.6 g/l) DMEM (#BE12-741F, Lonza) with 1% Penicillin-Streptomycin (10 000 U/ml) (#15140122, Gibco) for 24 h. Atrophy was confirmed by upregulation of atrogenes Atrogin-1 and MuRF1 via qPCR (Table S13) and morphology via microscopy (Motic AE31E).
RNA extraction and quantitative polymerase chain reaction (qPCR)
RNA extraction for C2C12 cells was performed with the ISOLATE II RNA Mini Kit (#BIO-52073, Meridian BIOSCIENCE) as per manufacturer’s instructions. Skeletal muscle (triceps and Tibialis anterior (TA)) and spinal cord tissue samples underwent homogenization with 7 mm stainless steel beads (#69990, Qiagen) in a Tissue Lyser LT (#85600, Qiagen) set at 60 oscillations/second for 2 min followed by microcentrifugation at > 10 000 RCF (MSE Sanyo Hawk 15/05) for 1 min. RNA extractions from harvested skeletal muscle was performed with the RNeasy Fibrous Tissue Kit (#74704, Qiagen) and all other harvested tissues with ISOLATE II RNA Mini Kit (#BIO-52073, Meridian BIOSCIENCE) as per manufacturer’s instructions. RNA concentrations (ng/μl) were measured with the NanoDrop 1000 spectrophotometer (ThermoScientific) before reverse transcription was performed using the qPCRBIO cDNA Synthesis Kit (#PB30.11-10, PCR Biosystems) as per manufacturer’s instructions.
The cDNA was then diluted by 1:5 in nuclease-free water (#10526945, ThermoFisher). qPCR was performed using 2× PCRBIO Sygreen Blue Mix Hi-ROX (#PB20.16-20, PCR Biosystems), nuclease-free water (#10526945, ThermoFisher) and 10 μM forward and reverse primers obtained from IDT (Table S13). The qPCR reactions were performed in the StepOnePlus™ Real-Time PCR System (ThermoScientific) with the following programme: initial denaturation (95°C for 2 min), 40 cycles of 95°C for 5 s and 60°C for 30 s and ending with melt curve stage (95°C for 15 s, 60°C for 1 min and 95°C for 15 s). Relative gene expression was quantified using the Pfaffl method [133] and referenced against the validated RNA polymerase II polypeptide J (PolJ) housekeeping gene [27, 134] (Table S13). Primer efficiency was calculated using LinRegPCR V11.0 [135].
C. elegans drug treatments
The C. elegans (C. elegans) SMA strains used in this study was LM99 smn-1(ok355)I/hT2(I;III), which was segregated into homozygotes smn-1(ok355), lethal homozygotes hT2/hT2 and control heterozygotes smn-1(ok355)I/hT2 [91]. These animals were maintained at 20°C on Nematode Growth Medium (NGM) plates seeded with Escherichia coli OP50 bacteria [136]. C. elegans were treated by mixing metformin hydrochloride (#PHR1084, Sigma-Aldrich) dissolved in water at concentrations of 0, 1, 10 and 50 mM and oxandrolone (#SML0437, Sigma-Aldrich) dissolved in DMSO at concentrations of 0, 1, 10 and 50 μM with NGM agar solution.
C. elegans neuromuscular assays
Neuromuscular assays were performed on day 3 animals raised on plates containing the pertinent solvent or drug. The pharyngeal pumping assay was performed as previously described [93]. Briefly, animals were filmed with a 150× objective using a AxioCam ICc5 camera at 175 frames/10 s on a Discovery.V8 SteREO microscope. Pumps were manually counted using the Zen Pro software v2.3. A pumping event was defined as a grinder movement in any axis. For locomotion assays animals were filmed with a 63× objective using a AxioCam ICc5 camara at 15 frames/sec on a Discovery.V8 SteREO microscope. Reversals, and paralysis time for 5 min (±SEM) were quantified using WormLab 1.1 software (MBF Bioscience). Final data represents three independent trials (n ≥ 25 animals in total per genotype).
Statistical analyses
Statistical analyses were carried out using the most up to date GraphPad PRISM software. Prior to any analyses, outliers were identified via Grubb’s test (GraphPad) and subsequently removed. Appropriate statistical tests include unpaired t-test, one-way analysis of variance (ANOVA), and two-way ANOVA. Each post-hoc analyses used is noted in the respective figure legend. Kaplan-Meier survival curves were analysed with a log-rank test. Statistical significance was considered at P < 0.05, described in graphs as *P < 0.05, **P < 0.01, ***P < 0.001 and ****P < 0.0001.
Supplementary Material
Contributor Information
Joseph M Hoolachan, School of Medicine, David Weatherall Building, Keele University, Staffordshire, ST5 5BG, United Kingdom.
Eve McCallion, School of Medicine, David Weatherall Building, Keele University, Staffordshire, ST5 5BG, United Kingdom.
Emma R Sutton, School of Medicine, David Weatherall Building, Keele University, Staffordshire, ST5 5BG, United Kingdom.
Özge Çetin, School of Medicine, David Weatherall Building, Keele University, Staffordshire, ST5 5BG, United Kingdom.
Paloma Pacheco-Torres, School of Life and Medical Sciences, University of Hertfordshire, Hatfield, Hertfordshire, AL910 9AB, United Kingdom.
Maria Dimitriadi, School of Life and Medical Sciences, University of Hertfordshire, Hatfield, Hertfordshire, AL910 9AB, United Kingdom.
Suat Sari, Department of Pharmaceutical Chemistry, Hacettepe University, Ankara, 06100, Turkey; School of Chemical and Physical Sciences, Lennard-Jones Building, Keele University, Staffordshire, ST5 5BG, United Kingdom.
Gavin J Miller, School of Chemical and Physical Sciences, Lennard-Jones Building, Keele University, Staffordshire, ST5 5BG, United Kingdom; Centre for Glycoscience, Keele University, Staffordshire, ST5 5BG, United Kingdom.
Magnus Okoh, School of Medicine, David Weatherall Building, Keele University, Staffordshire, ST5 5BG, United Kingdom.
Lisa M Walter, SMATHERIA gGmbH – Non-Profit Biomedical Research Institute, Feodor-Lynen-Straße 31, 30625, Hannover, Germany; Centre of Systems Neuroscience (ZSN), Hannover Medical School, Bünteweg 2, 30559, Hannover, Germany.
Peter Claus, SMATHERIA gGmbH – Non-Profit Biomedical Research Institute, Feodor-Lynen-Straße 31, 30625, Hannover, Germany; Centre of Systems Neuroscience (ZSN), Hannover Medical School, Bünteweg 2, 30559, Hannover, Germany.
Matthew J A Wood, Department of Paediatrics, University of Oxford, Level 2, Children's Hospital, John Radcliffe, Headington Oxford, OX3 9DU, United Kingdom.
Daniel P Tonge, School of Life Sciences, Huxley Building, Keele University, Staffordshire ST5 5BG, United Kingdom.
Melissa Bowerman, School of Medicine, David Weatherall Building, Keele University, Staffordshire, ST5 5BG, United Kingdom; Wolfson Centre for Inherited Neuromuscular Disease, RJAH Orthopaedic Hospital, Oswestry, SY10 7AG, United Kingdom.
Author contributions
Conceptualization: J.M.H., M.B.; Methodology: J.M.H., P.P.T., M.D., S.S., L.M.W, P.C., D.P.T. & M.B.; Formal Analysis: J.M.H., P.P.T., M.D., S.S., D.P.T. & M.B.; Investigation: J.M.H., E.M., E.R.S., O.C., P.P.T., M.D., S.S., M.O., L.M.W., P.C., & M.B.; Software: J.M.H., S.S. & D.P.T.; Visualization: J.M.H. & S.S.; Resources: M.D., P.C., S.D., M.J.A.W., D.P.T. & M.B.; Writing—Original Draft: J.M.H. & M.B.; Writing—Review & Editing: J.M.H., E.M., E.R.S., O.C., P.P.T., M.D., S.S., G.J.M., M.O., L.M.W., P.C., S.D., M.J.A.W., D.P.T., & M.B.; Supervision: G.J.M., D.P.T. & M.B.; Project Administration: M.B.; Funding Acquisition: M.B.
Conflicts of interest
None to declare.
Funding
We would like to thank the personnel at the Biomedical Sciences Unit at both Keele University and University of Oxford. Many thanks go to members of the Combined Inherited Neuromuscular Disorders meetings for helpful discussions. For the RNA-Sequencing we are grateful for the aid and resources of Research Core Unit Transcriptomics at Hannover Medical School. C. elegans strains were provided by the C. elegans consortium (CGC), which is funded by NIH Office of Research Infrastructure Programs (P40 OD010440). Research in the M.D. lab has been funded by the Wellcome Trust and Royal Society. A special thanks goes out to Advaita for their technical support of iPathwayGuide and to CureSMA, SMA Europe and the Biochemical Society, UK for providing podium presentation opportunities for preliminary data of this project. J.M.H. was funded by a Ph.D. studentship from the Keele University of School of Medicine. E.M. is supported by an Academy of Medical Sciences grant (SBF006/1162). E.R.S. was funded by a MDUK Ph.D. studentship (18GRO-PS48-0114). O.C. is supported by a Ph.D. studentship from the Republic of Türkiye Ministry of National Education. S.S. was funded by the Scientific and Technological Research Council of Türkiye TÜBITAK 2219 Program (Grant no: 1059B192200422). M.B. was funded by SMA Angels Charity. P.C. is supported by the Deutsche Muskelstiftung and the European Union’s Horizon 2020 research and innovation programme under the Marie Sklodowska-Curie grant agreement No 956185.
Data availability
The datasets presented in this study can be found in the following online repository: NCBI BioProject, accession ID: PRJNA972323.
References
- 1. Kolb SJ, Kissel JT. Spinal muscular atrophy. Neurol Clin 2015;33:831–46. [DOI] [PMC free article] [PubMed] [Google Scholar]
- 2. Wojcik MH, Schwartz TS, Thiele KE. et al. Infant mortality: the contribution of genetic disorders. J Perinatol 2019;39:1611–9. [DOI] [PMC free article] [PubMed] [Google Scholar]
- 3. Lefebvre S, Bürglen L, Reboullet S. et al. Identification and characterization of a spinal muscular atrophy-determining gene. Cell 1995;80:155–65. [DOI] [PubMed] [Google Scholar]
- 4. Rodrigues NR, Owen N, Talbot K. et al. Deletions in the survival motor neuron gene on 5q13 in autosomal recessive spinal muscular atrophy. Hum Mol Genet 1995;4:631–4. [DOI] [PubMed] [Google Scholar]
- 5. Coovert DD, Le TT, McAndrew PE. et al. The survival motor neuron protein in spinal muscular atrophy. Hum Mol Genet 1997;6:1205–14. [DOI] [PubMed] [Google Scholar]
- 6. Groen EJN, Perenthaler E, Courtney NL. et al. Temporal and tissue-specific variability of SMN protein levels in mouse models of spinal muscular atrophy. Hum Mol Genet 2018;27:2851–62. [DOI] [PMC free article] [PubMed] [Google Scholar]
- 7. Singh RN, Howell MD, Ottesen EW. et al. Diverse role of survival motor neuron protein. Biochim Biophys Acta 2017;1860:299–315. [DOI] [PMC free article] [PubMed] [Google Scholar]
- 8. Schrank B, Götz R, Gunnersen JM. et al. Inactivation of the survival motor neuron gene, a candidate gene for human spinal muscular atrophy, leads to massive cell death in early mouse embryos. Proc Natl Acad Sci 1997;94:9920–5. [DOI] [PMC free article] [PubMed] [Google Scholar]
- 9. Monani UR, Sendtner M, Coovert DD. et al. The human centromeric survival motor neuron gene (SMN2) rescues embryonic lethality in Smn(−/−) mice and results in a mouse with spinal muscular atrophy. Hum Mol Genet 2000;9:333–9. [DOI] [PubMed] [Google Scholar]
- 10. Rochette CF, Gilbert N, Simard LR. SMN gene duplication and the emergence of the SMN2 gene occurred in distinct hominids: SMN2 is unique to homo sapiens. Hum Genet 2001;108:255–66. [DOI] [PubMed] [Google Scholar]
- 11. Lorson CL, Hahnen E, Androphy EJ. et al. A single nucleotide in the SMN gene regulates splicing and is responsible for spinal muscular atrophy. Proc Natl Acad Sci U S A 1999;96:6307–11. [DOI] [PMC free article] [PubMed] [Google Scholar]
- 12. Lefebvre S, Burlet P, Liu Q. et al. Correlation between severity and SMN protein level in spinal muscular atrophy. Nat Genet 1997;16:265–9. [DOI] [PubMed] [Google Scholar]
- 13. Hua Y, Vickers TA, Okunola HL. et al. Antisense masking of an hnRNP A1/A2 Intronic splicing silencer corrects SMN2 splicing in transgenic mice. Am J Hum Genet 2008;82:834–48. [DOI] [PMC free article] [PubMed] [Google Scholar]
- 14. Finkel RS, Mercuri E, Darras BT. et al. Nusinersen versus sham control in infantile-onset spinal muscular atrophy. N Engl J Med 2017;377:1723–32. [DOI] [PubMed] [Google Scholar]
- 15. Poirier A, Weetall M, Heinig K. et al. Risdiplam distributes and increases SMN protein in both the central nervous system and peripheral organs. Pharmacol Res Perspect 2018;6:e00447. [DOI] [PMC free article] [PubMed] [Google Scholar]
- 16. Servais L, Baranello G, Masson R. et al. FIREFISH part 2: efficacy and safety of risdiplam (RG7916) in infants with type 1 spinal muscular atrophy (SMA) (1302). Neurology 2020;94. [Google Scholar]
- 17. Al-Zaidy SA, Kolb SJ, Lowes L. et al. AVXS-101 (Onasemnogene Abeparvovec) for SMA1: comparative study with a prospective natural history cohort. J Neuromuscul Dis 2019;6:307–17. [DOI] [PubMed] [Google Scholar]
- 18. Mendell JR, Al-Zaidy S, Shell R. et al. Single-dose gene-replacement therapy for spinal muscular atrophy. N Engl J Med 2017;377:1713–22. [DOI] [PubMed] [Google Scholar]
- 19. Mercuri E, Darras BT, Chiriboga CA. et al. Nusinersen versus sham control in later-onset spinal muscular atrophy. N Engl J Med 2018;378:625–35. [DOI] [PubMed] [Google Scholar]
- 20. Dangouloff T, Servais L. Clinical evidence supporting early treatment of patients with spinal muscular atrophy: current perspectives. Ther Clin Risk Manag 2019;Volume 15:1153–61. [DOI] [PMC free article] [PubMed] [Google Scholar]
- 21. Bowerman M, Becker CG, Yáñez-Muñoz RJ. et al. Therapeutic strategies for spinal muscular atrophy: SMN and beyond. Dis Model Mech 2017;10:943–54. [DOI] [PMC free article] [PubMed] [Google Scholar]
- 22. Martínez-Hernández R, Bernal S, Alias L. et al. Abnormalities in early markers of muscle involvement support a delay in myogenesis in spinal muscular atrophy. J Neuropathol Exp Neurol 2014;73:559–67. [DOI] [PubMed] [Google Scholar]
- 23. Hayhurst M, Wagner AK, Cerletti M. et al. A cell-autonomous defect in skeletal muscle satellite cells expressing low levels of survival of motor neuron protein. Dev Biol 2012;368:323–34. [DOI] [PMC free article] [PubMed] [Google Scholar]
- 24. Boyer JG, Murray LM, Scott K. et al. Early onset muscle weakness and disruption of muscle proteins in mouse models of spinal muscular atrophy. Skelet Muscle 2013;3:24. [DOI] [PMC free article] [PubMed] [Google Scholar]
- 25. Stevens L, Bastide B, Maurage CA. et al. Childhood spinal muscular atrophy induces alterations in contractile and regulatory protein isoform expressions. Neuropathol Appl Neurobiol 2008;34:659–70. [DOI] [PubMed] [Google Scholar]
- 26. Martínez-Hernández R, Soler-Botija C, Also E. et al. The developmental pattern of myotubes in spinal muscular atrophy indicates prenatal delay of muscle maturation. J Neuropathol Exp Neurol 2009;68:474–81. [DOI] [PubMed] [Google Scholar]
- 27. Walter LM, Deguise M-O, Meijboom KE. et al. Interventions targeting glucocorticoid-Krüppel-like factor 15-branched-chain amino acid Signaling improve disease phenotypes in spinal muscular atrophy mice. EBioMedicine 2018;31:226–42. [DOI] [PMC free article] [PubMed] [Google Scholar]
- 28. Place A. A phase 2 study to evaluate the efficacy and safety of SRK-015 in patients with later-onset spinal muscular atrophy (TOPAZ): an introduction (4534). Neurology 2020;94. [Google Scholar]
- 29. Rudnicki SA, Andrews JA, Duong T. et al. Reldesemtiv in patients with spinal muscular atrophy: a phase 2 hypothesis-generating study. Neurotherapeutics 2021;18:1127–36. [DOI] [PMC free article] [PubMed] [Google Scholar]
- 30. Dickson M, Gagnon JP. The cost of new drug discovery and development. Discov Med 2004;4:172–9. [PubMed] [Google Scholar]
- 31. Dangouloff T, Botty C, Beaudart C. et al. Systematic literature review of the economic burden of spinal muscular atrophy and economic evaluations of treatments. Orphanet J Rare Dis 2021;16:47. [DOI] [PMC free article] [PubMed] [Google Scholar]
- 32. Talevi A, Bellera CL. Challenges and opportunities with drug repurposing: finding strategies to find alternative uses of therapeutics. Expert Opin Drug Discovery 2020;15:397–401. [DOI] [PubMed] [Google Scholar]
- 33. Cruz-Topete D, Cidlowski JA. One hormone, two actions: anti- and pro-inflammatory effects of glucocorticoids. Neuroimmunomodulation 2015;22:20–32. [DOI] [PMC free article] [PubMed] [Google Scholar]
- 34. Matthews E, Brassington R, Kuntzer T. et al. Corticosteroids for the treatment of Duchenne muscular dystrophy. Cochrane Database Syst Rev 2016;2016. [DOI] [PMC free article] [PubMed] [Google Scholar]
- 35. Ricotti V, Ridout DA, Scott E. et al. Long-term benefits and adverse effects of intermittent versus daily glucocorticoids in boys with Duchenne muscular dystrophy. J Neurol Neurosurg Psychiatry 2013;84:698–705. [DOI] [PubMed] [Google Scholar]
- 36. McMillan HJ. Intermittent glucocorticoid regimes for younger boys with duchenne muscular dystrophy: balancing efficacy with side effects. Muscle Nerve 2019;59:638–9. [DOI] [PubMed] [Google Scholar]
- 37. Morrison-Nozik A, Anand P, Zhu H. et al. Glucocorticoids enhance muscle endurance and ameliorate Duchenne muscular dystrophy through a defined metabolic program. Proc Natl Acad Sci 2015;112:E6780–9. [DOI] [PMC free article] [PubMed] [Google Scholar]
- 38. Bulfield G, Siller WG, Wight PA. et al. X chromosome-linked muscular dystrophy (mdx) in the mouse. Proc Natl Acad Sci U S A 1984;81:1189–92. [DOI] [PMC free article] [PubMed] [Google Scholar]
- 39. Oray M, Abu Samra K, Ebrahimiadib N. et al. Long-term side effects of glucocorticoids. Expert Opin Drug Saf 2016;15:457–65. [DOI] [PubMed] [Google Scholar]
- 40. Hsieh-Li HM, Chang JG, Jong YJ. et al. A mouse model for spinal muscular atrophy. Nat Genet 2000;24:66–70. [DOI] [PubMed] [Google Scholar]
- 41. Le TT, Pham LT, Butchbach MER. et al. SMNDelta7, the major product of the centromeric survival motor neuron (SMN2) gene, extends survival in mice with spinal muscular atrophy and associates with full-length SMN. Hum Mol Genet 2005;14:845–57. [DOI] [PubMed] [Google Scholar]
- 42. Meijboom KE, Volpato V, Monzón-Sandoval J. et al. Combining multiomics and drug perturbation profiles to identify muscle-specific treatments for spinal muscular atrophy. JCI Insight 2021;6:149446. [DOI] [PMC free article] [PubMed] [Google Scholar]
- 43. Deguise M-O, Boyer JG, McFall ER. et al. Differential induction of muscle atrophy pathways in two mouse models of spinal muscular atrophy. Sci Rep 2016;6:28846. [DOI] [PMC free article] [PubMed] [Google Scholar]
- 44. Simon CM, Dai Y, Van Alstyne M. et al. Converging mechanisms of p53 activation drive motor neuron degeneration in spinal muscular atrophy. Cell Rep 2017;21:3767–80. [DOI] [PMC free article] [PubMed] [Google Scholar]
- 45. Cerveró C, Montull N, Tarabal O. et al. Chronic treatment with the AMPK agonist AICAR prevents skeletal muscle pathology but fails to improve clinical outcome in a mouse model of severe spinal muscular atrophy. Neurotherapeutics 2016;13:198–216. [DOI] [PMC free article] [PubMed] [Google Scholar]
- 46. Ripolone M, Ronchi D, Violano R. et al. Impaired muscle mitochondrial biogenesis and myogenesis in spinal muscular atrophy. JAMA Neurol 2015;72:666–75. [DOI] [PMC free article] [PubMed] [Google Scholar]
- 47. Walter LM, Koch CE, Betts CA. et al. Light modulation ameliorates expression of circadian genes and disease progression in spinal muscular atrophy mice. Hum Mol Genet 2018;27:3582–97. [DOI] [PMC free article] [PubMed] [Google Scholar]
- 48. Ng SY, Mikhail A, Ljubicic V. Mechanisms of exercise-induced survival motor neuron expression in the skeletal muscle of spinal muscular atrophy-like mice. J Physiol 2019;597:4757–78. [DOI] [PMC free article] [PubMed] [Google Scholar]
- 49. Sansa A, Hidalgo I, Miralles MP. et al. Spinal muscular atrophy autophagy profile is tissue-dependent: differential regulation between muscle and motoneurons. Acta Neuropathol Commun 2021;9:122. [DOI] [PMC free article] [PubMed] [Google Scholar]
- 50. Ahsan S, Drăghici S. Identifying significantly impacted pathways and putative mechanisms with iPathwayGuide. Curr Protoc Bioinformatics 2017;57:7.15.1–30. [DOI] [PubMed] [Google Scholar]
- 51. Cotto KC, Wagner AH, Feng Y-Y. et al. DGIdb 3.0: a redesign and expansion of the drug–gene interaction database. Nucleic Acids Res 2018;46:D1068–73. [DOI] [PMC free article] [PubMed] [Google Scholar]
- 52. Pin F, Couch ME, Bonetto A. Preservation of muscle mass as a strategy to reduce the toxic effects of cancer chemotherapy on body composition. Curr Opin Support Palliat Care 2018;12:420–6. [DOI] [PMC free article] [PubMed] [Google Scholar]
- 53. Farooq F, Abadía-Molina F, MacKenzie D. et al. Celecoxib increases SMN and survival in a severe spinal muscular atrophy mouse model via p38 pathway activation. Hum Mol Genet 2013;22:3415–24. [DOI] [PubMed] [Google Scholar]
- 54. Mack SG, Cook DJ, Dhurjati P. et al. Systems biology investigation of cAMP modulation to increase SMN levels for the treatment of spinal muscular atrophy. PLoS One 2014;9:e115473. [DOI] [PMC free article] [PubMed] [Google Scholar]
- 55. Rojas LBA, Gomes MB. Metformin: an old but still the best treatment for type 2 diabetes. Diabetol Metab Syndr 2013;5:6. [DOI] [PMC free article] [PubMed] [Google Scholar]
- 56. Orr R, Fiatarone Singh M. The anabolic androgenic steroid oxandrolone in the treatment of wasting and catabolic disorders: review of efficacy and safety. Drugs 2004;64:725–50. [DOI] [PubMed] [Google Scholar]
- 57. Kjøbsted R, Hingst JR, Fentz J. et al. AMPK in skeletal muscle function and metabolism. FASEB J 2018;32:1741–77. [DOI] [PMC free article] [PubMed] [Google Scholar]
- 58. Soliman A, De Sanctis V, Alaaraj N. et al. The clinical application of metformin in children and adolescents: a short update. Acta Biomed 2020;91:e2020086. [DOI] [PMC free article] [PubMed] [Google Scholar]
- 59. Hafner P, Bonati U, Klein A. et al. Effect of combination l-Citrulline and metformin treatment on motor function in patients with Duchenne muscular dystrophy: a randomized clinical trial. JAMA Netw Open 2019;2:e1914171. [DOI] [PMC free article] [PubMed] [Google Scholar]
- 60. Fontes-Oliveira CC, Soares Oliveira BM, Körner Z. et al. Effects of metformin on congenital muscular dystrophy type 1A disease progression in mice: a gender impact study. Sci Rep 2018;8:16302. [DOI] [PMC free article] [PubMed] [Google Scholar]
- 61. Birk JB, Wojtaszewski JFP. Predominant α2/β2/γ3 AMPK activation during exercise in human skeletal muscle. J Physiol 2006;577:1021–32. [DOI] [PMC free article] [PubMed] [Google Scholar]
- 62. Zhang L, Zhang Y, Zhou M. et al. Role and mechanism underlying FoxO6 in skeletal muscle in vitro and in vivo. Int J Mol Med 2021;48:143. [DOI] [PubMed] [Google Scholar]
- 63. Woschitz V, Mei I, Hedlund E. et al. Mouse models of SMA show divergent patterns of neuronal vulnerability and resilience. Skelet Muscle 2022;12:22. [DOI] [PMC free article] [PubMed] [Google Scholar]
- 64. Everaert C, Luypaert M, Maag JLV. et al. Benchmarking of RNA-sequencing analysis workflows using whole-transcriptome RT-qPCR expression data. Sci Rep 2017;7:1559. [DOI] [PMC free article] [PubMed] [Google Scholar]
- 65. Shafey D, Côté PD, Kothary R. Hypomorphic Smn knockdown C2C12 myoblasts reveal intrinsic defects in myoblast fusion and myotube morphology. Exp Cell Res 2005;311:49–61. [DOI] [PubMed] [Google Scholar]
- 66. Millino C, Fanin M, Vettori A. et al. Different atrophy-hypertrophy transcription pathways in muscles affected by severe and mild spinal muscular atrophy. BMC Med 2009;7:14. [DOI] [PMC free article] [PubMed] [Google Scholar]
- 67. Calura E, Cagnin S, Raffaello A. et al. Meta-analysis of expression signatures of muscle atrophy: gene interaction networks in early and late stages. BMC Genomics 2008;9:630. [DOI] [PMC free article] [PubMed] [Google Scholar]
- 68. Rivera ME, Lyon ES, Vaughan RA. Effect of metformin on myotube BCAA catabolism. J Cell Biochem 2020;121:816–27. [DOI] [PubMed] [Google Scholar]
- 69. Bowerman M, Murray LM, Beauvais A. et al. A critical smn threshold in mice dictates onset of an intermediate spinal muscular atrophy phenotype associated with a distinct neuromuscular junction pathology. Neuromuscul Disord 2012;22:263–76. [DOI] [PubMed] [Google Scholar]
- 70. Bowerman M, Swoboda KJ, Michalski J-P. et al. Glucose metabolism and pancreatic defects in spinal muscular atrophy. Ann Neurol 2012;72:256–68. [DOI] [PMC free article] [PubMed] [Google Scholar]
- 71. Deguise M-O, Baranello G, Mastella C. et al. Abnormal fatty acid metabolism is a core component of spinal muscular atrophy. Ann Clin Transl Neurol 2019;6:1519–32. [DOI] [PMC free article] [PubMed] [Google Scholar]
- 72. Boyer JG, Deguise M-O, Murray LM. et al. Myogenic program dysregulation is contributory to disease pathogenesis in spinal muscular atrophy. Hum Mol Genet 2014;23:4249–59. [DOI] [PMC free article] [PubMed] [Google Scholar]
- 73. Bruce AK, Jacobsen E, Dossing H. et al. Hypoglycaemia in spinal muscular atrophy. Lancet 1995;346:609–10. [DOI] [PubMed] [Google Scholar]
- 74. Djordjevic SA, Milic-Rasic V, Brankovic V. et al. Glucose and lipid metabolism disorders in children and adolescents with spinal muscular atrophy types 2 and 3. Neuromuscul Disord 2021;31:291–9. [DOI] [PubMed] [Google Scholar]
- 75. Birnbaum MJ. Identification of a novel gene encoding an insulin-responsive glucose transporter protein. Cell 1989;57:305–15. [DOI] [PubMed] [Google Scholar]
- 76. DeWaal D, Nogueira V, Terry AR. et al. Hexokinase-2 depletion inhibits glycolysis and induces oxidative phosphorylation in hepatocellular carcinoma and sensitizes to metformin. Nat Commun 2018;9:446. [DOI] [PMC free article] [PubMed] [Google Scholar]
- 77. Owen MR, Doran E, Halestrap AP. Evidence that metformin exerts its anti-diabetic effects through inhibition of complex 1 of the mitochondrial respiratory chain. Biochem J 2000;348:607–14. [PMC free article] [PubMed] [Google Scholar]
- 78. Graham GG, Punt J, Arora M. et al. Clinical pharmacokinetics of metformin. Clin Pharmacokinet 2011;50:81–98. [DOI] [PubMed] [Google Scholar]
- 79. Łabuzek K, Suchy D, Gabryel B. et al. Quantification of metformin by the HPLC method in brain regions, cerebrospinal fluid and plasma of rats treated with lipopolysaccharide. Pharmacol Rep 2010;62:956–65. [DOI] [PubMed] [Google Scholar]
- 80. Singh J, Olle B, Suhail H. et al. Metformin-induced mitochondrial function and ABCD2 up-regulation in X-linked adrenoleukodystrophy involves AMP-activated protein kinase. J Neurochem 2016;138:86–100. [DOI] [PubMed] [Google Scholar]
- 81. Fenichel G, Pestronk A, Florence J. et al. A beneficial effect of oxandrolone in the treatment of Duchenne muscular dystrophy: a pilot study. Neurology 1997;48:1225–6. [DOI] [PubMed] [Google Scholar]
- 82. Hart DW, Wolf SE, Ramzy PI. et al. Anabolic effects of oxandrolone after severe burn. Ann Surg 2001;233:556–64. [DOI] [PMC free article] [PubMed] [Google Scholar]
- 83. Ren H, Yin P, Duan C. IGFBP-5 regulates muscle cell differentiation by binding to IGF-II and switching on the IGF-II auto-regulation loop. J Cell Biol 2008;182:979–91. [DOI] [PMC free article] [PubMed] [Google Scholar]
- 84. Ganassi M, Badodi S, Wanders K. et al. Myogenin is an essential regulator of adult myofibre growth and muscle stem cell homeostasis. elife 2020;9:e60445. [DOI] [PMC free article] [PubMed] [Google Scholar]
- 85. Cai D, Dhe-Paganon S, Melendez PA. et al. Two new substrates in insulin signaling, IRS5/DOK4 and IRS6/DOK5. J Biol Chem 2003;278:25323–30. [DOI] [PubMed] [Google Scholar]
- 86. Lee S-W, Won J-Y, Yang J. et al. AKAP6 inhibition impairs myoblast differentiation and muscle regeneration: positive loop between AKAP6 and myogenin. Sci Rep 2015;5:16523. [DOI] [PMC free article] [PubMed] [Google Scholar]
- 87. Wu Y, Zhao W, Zhao J. et al. REDD1 is a major target of testosterone action in preventing dexamethasone-induced muscle loss. Endocrinology 2010;151:1050–9. [DOI] [PMC free article] [PubMed] [Google Scholar]
- 88. Mirza KA, Pereira SL, Edens NK. et al. Attenuation of muscle wasting in murine C2C 12 myotubes by epigallocatechin-3-gallate. J Cachexia Sarcopenia Muscle 2014;5:339–45. [DOI] [PMC free article] [PubMed] [Google Scholar]
- 89. Zeman RJ, Bauman WA, Wen X. et al. Improved functional recovery with oxandrolone after spinal cord injury in rats. Neuroreport 2009;20:864–8. [DOI] [PubMed] [Google Scholar]
- 90. Ahmad A, Herndon DN, Szabo C. Oxandrolone protects against the development of multiorgan failure, modulates the systemic inflammatory response and promotes wound healing during burn injury. Burns 2019;45:671–81. [DOI] [PubMed] [Google Scholar]
- 91. Briese M, Esmaeili B, Fraboulet S. et al. Deletion of smn-1, the Caenorhabditis elegans ortholog of the spinal muscular atrophy gene, results in locomotor dysfunction and reduced lifespan. Hum Mol Genet 2009;18:97–104. [DOI] [PMC free article] [PubMed] [Google Scholar]
- 92. Bertrandy S, Burlet P, Clermont O. et al. The RNA-binding properties of SMN: deletion analysis of the zebrafish orthologue defines domains conserved in evolution. Hum Mol Genet 1999;8:775–82. [DOI] [PubMed] [Google Scholar]
- 93. Dimitriadi M, Derdowski A, Kalloo G. et al. Decreased function of survival motor neuron protein impairs endocytic pathways. Proc Natl Acad Sci U S A 2016;113:E4377–86. [DOI] [PMC free article] [PubMed] [Google Scholar]
- 94. Nilsson EC, Long YC, Martinsson S. et al. Opposite transcriptional regulation in skeletal muscle of AMP-activated protein kinase gamma3 R225Q transgenic versus knock-out mice. J Biol Chem 2006;281:7244–52. [DOI] [PubMed] [Google Scholar]
- 95. Barnes BR, Long YC, Steiler TL. et al. Changes in exercise-induced gene expression in 5’-AMP-activated protein kinase gamma3-null and gamma3 R225Q transgenic mice. Diabetes 2005;54:3484–9. [DOI] [PubMed] [Google Scholar]
- 96. Marangos PJ, Loftus T, Wiesner J. et al. Adenosinergic modulation of homocysteine-induced seizures in mice. Epilepsia 1990;31:239–46. [DOI] [PubMed] [Google Scholar]
- 97. Corton JM, Gillespie JG, Hawley SA. et al. 5-aminoimidazole-4-carboxamide ribonucleoside. A specific method for activating AMP-activated protein kinase in intact cells? Eur J Biochem 1995;229:558–65. [DOI] [PubMed] [Google Scholar]
- 98. Xiao B, Heath R, Saiu P. et al. Structural basis for AMP binding to mammalian AMP-activated protein kinase. Nature 2007;449:496–500. [DOI] [PubMed] [Google Scholar]
- 99. Thelen MP, Wirth B, Kye MJ. Mitochondrial defects in the respiratory complex I contribute to impaired translational initiation via ROS and energy homeostasis in SMA motor neurons. Acta Neuropathol Commun 2020;8:223. [DOI] [PMC free article] [PubMed] [Google Scholar]
- 100. Borkowska A, Jankowska A, Szlagatys-Sidorkiewicz A. et al. Coexistence of type 1 diabetes mellitus and spinal muscular atrophy in an 8-year-old girl: a case report. Acta Biochim Pol 2015;62:167–8. [DOI] [PubMed] [Google Scholar]
- 101. Hossain S, Chao J. MON-154 abnormal glucose homeostasis in spinal muscular atrophy (SMA) leading to a transient episode of diabetic ketoacidosis (DKA). J Endocr Soc 2019;3:MON-154. [Google Scholar]
- 102. Sun J, Harrington MA, Porter B. Sex difference in spinal muscular atrophy patients – are males more vulnerable? J Neuromuscul Dis 2023;10:847–67. [DOI] [PMC free article] [PubMed] [Google Scholar]
- 103. MacLean HE, Chiu WSM, Notini AJ. et al. Impaired skeletal muscle development and function in male, but not female, genomic androgen receptor knockout mice. FASEB. J 2008;22:2676–89. [DOI] [PubMed] [Google Scholar]
- 104. Morton RW, Sato K, Gallaugher MPB. et al. Muscle androgen receptor content but not systemic hormones is associated with resistance training-induced skeletal muscle hypertrophy in healthy, young men. Front Physiol 2018;9. [DOI] [PMC free article] [PubMed] [Google Scholar]
- 105. Liu Y, Beyer A, Aebersold R. On the dependency of cellular protein levels on mRNA abundance. Cell 2016;165:535–50. [DOI] [PubMed] [Google Scholar]
- 106. Knorre DG, Kudryashova NV, Godovikova TS. Chemical and functional aspects of posttranslational modification of proteins. Acta Nat 2009;1:29–51. [PMC free article] [PubMed] [Google Scholar]
- 107. Kessler T, Latzer P, Schmid D. et al. Cerebrospinal fluid proteomic profiling in nusinersen-treated patients with spinal muscular atrophy. J Neurochem 2020;153:650–61. [DOI] [PubMed] [Google Scholar]
- 108. Gardell SJ, Zhang X, Kapoor N. et al. Metabolomics analyses of muscle atrophy induced by hind limb unloading. Methods Mol Biol 2019;1996:297–309. [DOI] [PubMed] [Google Scholar]
- 109. Finkel RS, Crawford TO, Swoboda KJ. et al. Candidate proteins, metabolites and transcripts in the biomarkers for spinal muscular atrophy (BforSMA) clinical study. PLoS One 2012;7:e35462. [DOI] [PMC free article] [PubMed] [Google Scholar]
- 110. De Micheli AJ, Spector JA, Elemento O. et al. A reference single-cell transcriptomic atlas of human skeletal muscle tissue reveals bifurcated muscle stem cell populations. Skelet Muscle 2020;10:19. [DOI] [PMC free article] [PubMed] [Google Scholar]
- 111. Williams K, Yokomori K, Mortazavi A. Heterogeneous skeletal muscle cell and nucleus populations identified by single-cell and single-nucleus resolution transcriptome assays. Front Genet 2022;13. [DOI] [PMC free article] [PubMed] [Google Scholar]
- 112. Habets LE, Bartels B, Asselman F-L. et al. Magnetic resonance reveals mitochondrial dysfunction and muscle remodelling in spinal muscular atrophy. Brain 2022;145:1422–35. [DOI] [PMC free article] [PubMed] [Google Scholar]
- 113. Saleh KK, Xi H, Switzler C. et al. Single cell sequencing maps skeletal muscle cellular diversity as disease severity increases in dystrophic mouse models. iScience 2022;25:105415. [DOI] [PMC free article] [PubMed] [Google Scholar]
- 114. Chemello F, Wang Z, Li H. et al. Degenerative and regenerative pathways underlying Duchenne muscular dystrophy revealed by single-nucleus RNA sequencing. Proc Natl Acad Sci 2020;117:29691–701. [DOI] [PMC free article] [PubMed] [Google Scholar]
- 115. Nguyen AT, Armstrong EA, Yager JY. Neurodevelopmental reflex testing in neonatal rat pups. J Vis Exp 2017;122:55261. [DOI] [PMC free article] [PubMed] [Google Scholar]
- 116. Afgan E, Baker D, Batut B. et al. The galaxy platform for accessible, reproducible and collaborative biomedical analyses: 2018 update. Nucleic Acids Res 2018;46:W537–44. [DOI] [PMC free article] [PubMed] [Google Scholar]
- 117. Babraham Bioinformatics . FastQC A Quality Control tool for High Throughput Sequence Data. https://www.bioinformatics.babraham.ac.uk/projects/fastqc/ (accessed Apr 25, 2022).
- 118.Bolger AM, Lohse M, Usadel B. Trimmomatic: a flexible trimmer for Illumina sequence data, Bioinformatics 2014;30:2114–2120. [DOI] [PMC free article] [PubMed] [Google Scholar]
- 119. FASTX-Toolkit http://hannonlab.cshl.edu/fastx_toolkit/ (accessed Apr 25, 2022).
- 120. Kim D, Paggi JM, Park C. et al. Graph-based genome alignment and genotyping with HISAT2 and HISAT-genotype. Nat Biotechnol 2019;37:907–15. [DOI] [PMC free article] [PubMed] [Google Scholar]
- 121. Liao Y, Smyth GK, Shi W. featureCounts: an efficient general purpose program for assigning sequence reads to genomic features. Bioinformatics 2014;30:923–30. [DOI] [PubMed] [Google Scholar]
- 122. Ewels P, Magnusson M, Lundin S. et al. MultiQC: summarize analysis results for multiple tools and samples in a single report. Bioinformatics 2016;32:3047–8. [DOI] [PMC free article] [PubMed] [Google Scholar]
- 123. Love MI, Huber W, Anders S. Moderated estimation of fold change and dispersion for RNA-seq data with DESeq2. Genome Biol 2014;15:550. [DOI] [PMC free article] [PubMed] [Google Scholar]
- 124. Kanehisa M, Furumichi M, Tanabe M. et al. KEGG: new perspectives on genomes, pathways, diseases and drugs. Nucleic Acids Res 2017;45:D353–61. [DOI] [PMC free article] [PubMed] [Google Scholar]
- 125. Draghici S, Khatri P, Martins RP. et al. Global functional profiling of gene expression. Genomics 2003;81:98–104. [DOI] [PubMed] [Google Scholar]
- 126. Jantzen SG, Sutherland BJ, Minkley DR. et al. GO trimming: systematically reducing redundancy in large gene ontology datasets. BMC Res Notes 2011;4:267. [DOI] [PMC free article] [PubMed] [Google Scholar]
- 127. The Gene Ontology Consortium . The gene ontology resource: 20 years and still going strong. Nucleic Acids Res 2019;47:D330–8. [DOI] [PMC free article] [PubMed] [Google Scholar]
- 128. Lu C, Wu C, Ghoreishi D. et al. OPLS4: improving force field accuracy on challenging regimes of chemical space. J Chem Theory Comput 2021;17:4291–300. [DOI] [PubMed] [Google Scholar]
- 129. Berman HM, Westbrook J, Feng Z. et al. The protein data bank. Nucleic Acids Res 2000;28:235–42. [DOI] [PMC free article] [PubMed] [Google Scholar]
- 130. Sastry GM, Adzhigirey M, Day T. et al. Protein and ligand preparation: parameters, protocols, and influence on virtual screening enrichments. J Comput Aided Mol Des 2013;27:221–34. [DOI] [PubMed] [Google Scholar]
- 131. Friesner RA, Murphy RB, Repasky MP. et al. Extra precision glide: docking and scoring incorporating a model of hydrophobic enclosure for protein-ligand complexes. J Med Chem 2006;49:6177–96. [DOI] [PubMed] [Google Scholar]
- 132. Yaffe D, Saxel O. Serial passaging and differentiation of myogenic cells isolated from dystrophic mouse muscle. Nature 1977;270:725–7. [DOI] [PubMed] [Google Scholar]
- 133. Pfaffl MW. A new mathematical model for relative quantification in real-time RT-PCR. Nucleic Acids Res 2001;29:e45. [DOI] [PMC free article] [PubMed] [Google Scholar]
- 134. Radonić A, Thulke S, Mackay IM. et al. Guideline to reference gene selection for quantitative real-time PCR. Biochem Biophys Res Commun 2004;313:856–62. [DOI] [PubMed] [Google Scholar]
- 135. Untergasser A, Ruijter JM, Benes V. et al. Web-based LinRegPCR: application for the visualization and analysis of (RT)-qPCR amplification and melting data. BMC Bioinformatics 2021;22:398. [DOI] [PMC free article] [PubMed] [Google Scholar]
- 136. Brenner S. The genetics of Caenorhabditis elegans. Genetics 1974;77:71–94. [DOI] [PMC free article] [PubMed] [Google Scholar]
Associated Data
This section collects any data citations, data availability statements, or supplementary materials included in this article.
Supplementary Materials
Data Availability Statement
The datasets presented in this study can be found in the following online repository: NCBI BioProject, accession ID: PRJNA972323.