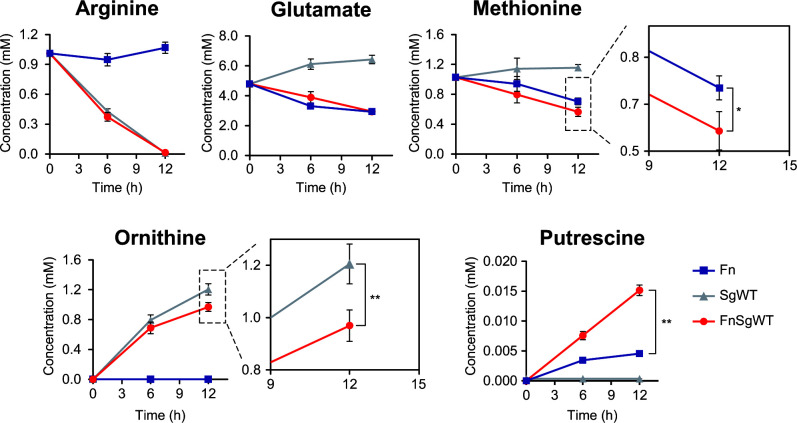
Fig 3.
Time course of changes in extracellular metabolites in culture fluids. Lines indicate F. nucleatum (blue) and S. gordonii WT (gray) monocultures and F. nucleatum and S. gordonii WT (red) coculture. Results are shown as the mean ± SD of three independent experiments. *P < 0.05, **P < 0.01 (one-way ANOVA, followed by Tukey–Kramer post-hoc test) for methionine and ornithine metabolism.

