

Abstract
Chitosan is a plasma membrane-perturbing compound consisting of linear chains of β-1,4-linked glucosamine residues, which at acidic pHs become positively charged. It is extensively used as an antimicrobial compound, yet its mode of action is still unresolved. Chitosan strongly affected the growth of the yeast Saccharomyces cerevisiae, the food spoilage yeast Zygosaccharomyces bailii, and two human-pathogenic yeasts, Candida albicans and Candida glabrata. Microarray analysis of yeast cells treated with sublethal concentrations of chitosan revealed induction of the environmental stress response and three more major transcriptional responses. The first was a rapid and stable Cin5p-mediated response. Cin5p/Yap4p is a transcription factor involved in various stress responses. Deletion of CIN5 led to increased chitosan sensitivity. The second was a Crz1p-mediated response, which is delayed compared to the Cin5p response. Crz1p is a transcription factor of the calcineurin pathway. Cells deleted for CRZ1 or treated with the calcineurin inhibitor FK506 became hypersensitive to chitosan, supporting the notion that the Crz1p-controlled response offers protection against chitosan. The third was a strong Rlm1p-mediated response which ran parallel in time with the Crz1p-regulated response. Rlm1p is a transcription factor of the cell wall integrity pathway, which is activated by cell wall stress. Importantly, chitosan-treated cells became more resistant to β-1,3-glucanase, which is a well-known response to cell wall stress. We propose that the transcriptional response to chitosan may be representative of other plasma membrane-perturbing compounds.
Chitosan, a linear β-1,4-d-glucosamine polymer, is a deacetylated derivative of chitin and is nontoxic and biodegradable. Chitosan inhibits growth of several filamentous fungi, spoilage yeasts, and bacteria but has no effect on mammalian cells (47, 48). The antifungal activity of chitosan depends on the degree of deacetylation and polymerization. Mildly hydrolyzed chitosan was shown to be more active in inhibiting fungal growth than native chitosan (47). Chitosan has a pKa of around 6.3. Thus, at lower pH values, the majority of the glucosamine residues in chitosan molecules are cationic, due to protonation of amino groups, which enables them to interact with anionic components of the cell surface.
One of the well-known defense strategies of mammalian, insect, and plant cells against pathogenic fungi and bacteria involves the production of cationic antimicrobial peptides (57). An extensively studied class of antimicrobial peptides is formed by the plant defensins. It has been shown that they interact with the anionic components of the fungal plasma membrane and that this is the basis of their antifungal activity (55, 56).
The Saccharomyces cerevisiae plasma membrane forms a lipid bilayer, whose external leaflet is enriched in phosphatidylcholine, ergosterol, and sphingolipids. Sphingolipids constitute the most abundant class of negatively charged components of the plasma membrane (12). In S. cerevisiae they possess an inositol phosphate moiety which is absent in animal sphingolipids (9). The most abundant yeast sphingolipid is M(IP)2C (mannosyl-diinositolphosphate-ceramide), containing two inositol phosphates with a mannose unit attached to one of the inositols (59). Interestingly, many fungal species such as S. cerevisiae, Neurospora crassa, Candida albicans, and Picharella pastoris have been found sensitive to cationic plant defensins in a sphingolipid-dependent manner (14, 54, 55, 57).
To protect themselves against various types of stress, including the presence of cationic antimicrobial peptides, fungi have developed a number of mechanisms that enable them to survive. S. cerevisiae is an excellent model organism to study stress responses among fungi. The ability of baker's yeast to adapt to and survive a large variety of environmental conditions depends on cooperation among the limited number of known pathways in mounting a response specific to a given kind of stress. The recently described environmental stress response is a common expression program of ≈900 genes whose transcription is altered upon shifting of cells to various stressful conditions (19). The environmental stress response comprises two groups of genes with distinct transcriptional patterns of up- and downregulation. The expression of many genes induced in the environmental stress response is largely mediated by the transcription factors Msn2p and Msn4p (18, 40). The downregulated cluster consists of genes encoding ribosomal proteins and genes involved in various aspects of RNA metabolism (18).
Though the environmental stress response program is initiated in response to many diverse conditions, the precise levels and timing of the gene expression may change, suggesting a very sensitive, condition-specific regulation of this program, involving the participation of other signaling pathways (18). An example of a condition-specific response is seen in the recent study of a number of cell wall deletion mutants, where the cell wall compensatory cluster was shown to involve three pathways: the aforementioned environmental stress response, the Ca2+/calcineurin-dependent pathway, and the cell wall integrity pathway (33). The Ca2+/calcineurin-dependent pathway is implicated in a variety of stresses, including cell wall perturbation, high extracellular levels of Ca2+ and Na+, increased temperature, and prolonged exposure to α-factor (63). This pathway operates via the Crz1p transcription factor and leads to induction of a number of genes involved in maintaining cell ion homeostasis.
The Ca2+/calcineurin-pathway was found to act together with the cell wall integrity pathway, which operates through the Rlm1p transcription factor (33). The cell wall integrity pathway is also activated upon treatment with cell wall-perturbing compounds such as Calcofluor White, Congo Red, and caspofungin (4, 17, 46). The activation of the cell wall integrity pathway leads to induction of genes involved in cell wall biogenesis and maintenance and in turn to cell wall remodeling (53). Two main enzymes involved in cell wall maintenance, Fks1, a β-1,3-glucan synthase, and Chs1, a chitin synthase, reside in the yeast plasma membrane. Interestingly, it has been shown that treatment with chlorpromazine, a compound causing plasma membrane stretching, can lead to activation of the cell wall integrity pathway (29), suggesting that stress targeted at the plasma membrane can be compensated for on the cell wall level.
In this study, S. cerevisiae was used as a model organism to investigate its response to sublethal concentrations of chitosan with global transcriptome analysis. The microarray data revealed upregulation of genes involved in the core stress response. In addition, three groups of genes sharing the Cin5, Crz1, and Rlm1 regulatory motifs were significantly induced. To validate the results obtained from the transcriptome analysis, additional experiments were performed. Deletion of CIN5 resulted in increased sensitivity to chitosan. Furthermore, deletion of CRZ1 or exposure of chitosan-treated cells to a low concentration of FK506, a known inhibitor of the Crz1p-mediated response, significantly aggravated the effect of chitosan, supporting the idea that the calcineurin pathway helps the cells to survive in the presence of chitosan. Chitosan treatment also resulted in increased resistance of cells to β-1,3-glucanase, which is characteristic of cell wall-stressed cells and indicative of activation of the cell wall integrity pathway. Thus, our data suggest that the cells try to cope with chitosan-induced plasma membrane stress by launching four major transcriptional pathways.
MATERIALS AND METHODS
Strains and culture conditions.
Saccharomyces cerevisiae strain X2180-1A (MATa SUC2 mal gal2 CUP1) was used for microarray experiments. Synthetic complete medium (SC: 0.67% yeast nitrogen base without amino acids, 0.5% Casamino Acids, 2% glucose), pH 5.5, was used to culture the X2180-1A strain. Cells were cultured overnight in YPD (1% yeast extract, 2% peptone, 2% dextrose) and inoculated in batch fermentors in SC medium to an optical density at 600 nm (OD600) of 0.2 (approximately 1.5 × 10⁶ cells/ml). The cultures were grown at 30°C, with an aeration rate of 0.5 liters/min and fast stirring (200 rpm). Chitosan was added after 3 h. Growth was measured by following the OD600. Cell viability was established by plating appropriate dilutions of the culture samples on YPD plates (1% yeast extract, 2% peptone, 2% dextrose, 2% agar). The number of colonies was counted after incubation at 30°C for 2 days. The cell number was determined by using a CASY cell counter according to the manufacturer's protocol.
Candida albicans strain SC5314 and Candida glabrata strain ATCC 9087.6 were grown in adjusted synthetic complete medium (SC) consisting of 0.67% yeast nitrogen base without amino acids, 1% Casamino Acids, 2% glucose, and additional amino acids (leucine, tyrosine, tryptophan, and adenine), pH 5.5, to an OD600 of 0.1, and then chitosan was added and growth was followed by OD600 measurement. A food isolate of Zygosaccharomyces bailii was cultured in SC medium (as described for S. cerevisiae).
Chitosan preparation and characterization.
Chitosan was obtained from Sigma (crab shells, minimum 85% deacetylated). It was fragmented by nitrous deamination. Chitosan was dissolved in 10% acetic acid and incubated with sodium nitrite at a concentration of 20 mg per g of chitosan at room temperature for 17 h. To stop the reaction, the pH of the preparation was adjusted to 5.5 with NaOH. The final concentration of chitosan was measured as glucosamine equivalents after hydrolysis in 6 M HCl for 17 h at 100°C (45). Different batches of chitosan varied slightly in their inhibitory effect.
Cell leakage assay.
The leakage of cellular components was analyzed by adapting the method of De Nobel et al. (10). Cells were grown to mid-log phase, harvested by centrifugation, and washed two times with 10 mM morpholineethanesulfonic acid (MES)-NaOH, pH 5.5. Next, the cells were incubated for 30 min at 30°C in 10 mM MES-NaOH, pH 5.5, in the presence of various concentrations of chitosan. The cells were pelleted at 14,000 rpm for 2 min, and the supernatant was collected and centrifuged again at 14,000 rpm for 2 min. Subsequently, the supernatant was filtered (Acrodisc LC 25 mm syringe filter with a 0.45-μm polyvinylidene difluoride membrane, Gelman Laboratory) and the absorbance was measured at a wavelength of 260 nm (UVmini 1240, UV-VIS spectrophotometer, Shimadzu). Cellular leakage was defined as A260 of the sample − A260 of the buffer (with the respective concentrations of chitosan).
Preparation of total RNA and labeled cRNA.
The cells were cultured in a batch fermentor for 3 h prior to addition of chitosan. Samples for RNA isolation were collected at appropriate time points, 0 (control), 15, 30, 60, 120, and 180 min after addition of chitosan. They were flash-frozen in liquid nitrogen and stored at −80°C. Total RNA was extracted by the method of Llinas (37). The concentration and quality of RNA were determined by measuring absorbance at 260, 280, and 230 nm on a Nanodrop spectrophotometer. The purity and integrity of the RNA samples were further validated with RNA LabChip on a 2100 Bioanalyzer from Agilent Technologies.
Total RNA was labeled according to the manufacturer's protocol (1); 20 μg of total RNA was used for first-strand cDNA synthesis. This was followed by synthesis of second-strand cDNA. cDNA was purified using the GeneChip Sample CleanUp Module from Qiagen. The cDNA was used for synthesis of biotin-labeled cRNA, which was performed with the ENZO BioArray HighYield RNA transcript labeling kit from Affymetrix. The synthesized cRNA was purified with the GeneChip Sample CleanUp Module from Qiagen. The concentration and quality of labeled cRNA were tested with a Nanodrop spectrophotometer. Subsequently, the cRNA fragmentation reaction was carried out according to the manufacturer's protocol. The degree of fragmentation was confirmed with RNA LabChip on a 2100 Bioanalyzer from Agilent Technologies. The samples were stored at −20°C prior to hybridization.
Hybridization and scanning of the DNA microarrays.
The biotin-labeled cRNA samples were hybridized to the Affymetrix GeneChip Yeast Genome S98 Array according to Affymetrix protocols (1). This chip contains 25-mer oligonucleotide probes for approximately 6,400 S. cerevisiae open reading frames. Each open reading frame is represented by approximately 16 probes, covering different parts of its sequence. Every probe is neighbored by a probe that is identical except for one nucleotide in the middle of its sequence. This probe is called the mismatch probe, as opposed to the perfect match probe. The arrays were scanned with the GeneArray Scanner System on standard settings at 3-μm resolution. The data were extracted from the scanned images with Microarray Suite 5.0.
Data processing.
The raw data were analyzed in dChip. DNA-Chip Analyzer (dChip) is a software package implementing model-based expression analysis of oligonucleotide arrays (35) and several high-level analysis procedures. The model-based approach allows probe-level analysis on multiple arrays. By pooling information across many arrays, it is possible to assess standard errors for the expression indexes. This procedure also allows automatic probe selection in the analysis stage to reduce errors due to cross-hybridizing probes and image contamination. Fifteen datasets from three time series experiments were analyzed with dChip. The normalization procedure was used to adjust the brightness of the arrays to a similar level. The background subtraction was performed prior to calculation of expression. The model based expression was calculated with the perfect match-only model. The perfect match-only model is unaffected by adverse effects of mismatch probes.
We used the following algorithm to calculate expression values for single probes:
 |
where θi is the model-based expression index of the target gene in array i, ϕj is the probe sensitivity index of probe j in a probe set, and ɛ is a generic symbol for random error (35). Log2 ratios were calculated, based on the obtained expression values, and used in further analysis with the T-Profiler algorithm.
T-Profiler analysis of DNA microarray data.
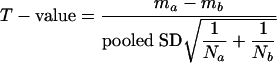
To assess the contribution of the expression of genes from specific gene classes to the total gene expression, we used a modification of the Quontology algorithm (4, 6), T-Profiler (5). This algorithm uses an unpaired t test, which gives a measure of significance to the difference between the mean of a specific class of genes and the mean of the remaining genes of the total gene expression profile with the formula:
 |
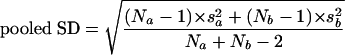 |
where ma is mean a, mb is mean b, Na is the number of genes a, Nb is the number of genes b, sa2 is variance a, Sb2 is variance b, and df=Na+Nb − 2.
To increase the robustness of the t test, we discarded the highest and lowest gene expression value of all gene classes. This method is comparable to the jackknife procedure and will discard single outliers, which might cause false positive or false negative results. An associated P value was calculated, which was Bonferroni corrected for multiple testing of many gene classes by multiplying it by the number of gene groups that are being tested in parallel (41). The t values with an assigned P value of <0.05 are considered significant.
Gene expression profiles were analyzed using two types of gene groups.
For gene groups with a common regulatory motif in the 600-bp upstream region, regulatory motifs were discovered with REDUCE by analysis of published transcript profiling data (6), obtained from the SCPD database (50), and obtained from Kellis and coworkers, who identified them by comparing four related yeast species (31). All regulatory motifs (in total 153) used for analysis and their characteristics can be found at www.T-Profiler.com. Note that T-Profiler does not take into account how often a particular motif occurs in a promoter region.
The gene ontology categories represent a second type of gene grouping. We tested in total 1,389 gene ontology gene groups related to function, process, or cellular localization (3, 20). In addition, the gene groups defined in the MIPS database were tested (39).
Testing effects of combined treatments of chitosan and FK506.
Overnight cultures of the Saccharomyces cerevisiae wild-type strain X2180-1a were diluted into 60 ml of SC and grown to an OD600 of 0.1 at 30°C. Either no drug, 2 μg of FK506 per ml, 25 μg of chitosan per ml, or a combination of both drugs were added. Cells were incubated at 30°C at 200 rpm. Growth was followed by OD600 measurements at 30-min intervals. The relative growth rates were calculated by linear regression from logarithmic plots of the OD600 data versus time.
β-1,3-Glucanase sensitivity.
Strain X2180-1a was inoculated into SC medium, pH 5.5. Cells were cultured at 30°C in flasks (200 rpm) at a culture-air ratio of 1:5. Chitosan was added after 3 h to a concentration of 50 or 100 μg/ml. The OD600 was measured every hour. After 1, 2, 3, or 4 h of chitosan treatment, a small volume of the culture was spun down (2 min at 3,500 rpm) and resuspended in 65 mM Tris-HCl, pH 7.4, to an OD600 of 1. β-Mercaptoethanol was added to a concentration of 40 mM. After 1 h of incubation at ambient temperature without agitation, 60 units of Quantazyme (Quantum Biotechnologies) was added per ml. After vigorous shaking, the OD600 was measured every 10 s for 30 min in a microtiterplate reader (Spectramax Plus384, Molecular Devices).
Chitosan susceptibility.
The susceptibility of the deletion mutants was tested by spotting serial dilutions of yeast cells onto SC agarose plates with or without chitosan. Agarose was used as a means to solidify the medium instead of agar because chitosan was less effective in agar plates, presumably because it bound to agar polysaccharides The yeast strains were grown overnight at 30°C in SC liquid medium, cells were diluted to an OD600 of 1, and 10-fold serial dilutions of each strain were spotted onto different plates and followed by incubation for 3 days at 30°C. The plates were photographed and included in the figures without further modifications.
RESULTS
Chitosan disrupts the plasma membrane of yeasts
Chitosan is known to disrupt the outer membrane of gram-negative bacteria (23). In addition, it has been shown that low-molecular-weight chitosan induces the formation of mass transfer channels in artificially created lipid bilayers, providing additional evidence for the disturbing effect of chitosan on cell membranes (62). To test whether chitosan disrupts the plasma membrane of the yeast Saccharomyces cerevisiae, we measured leakage of UV-absorbing compounds (at 260 nm), which represent the nucleotide and coenzyme pools (10, 64). Wild-type cells (X2180-1A) were grown to exponential phase and then exposed to various concentrations of chitosan in 10 mM MES-NaOH buffer at pH 5.5. Under these conditions, chitosan induced considerable leakage of cellular components at a concentration as low as 2.5 μg/ml (Fig. 1). Cell leakage reached a plateau at 10 to 15 μg/ml. These results indicate that chitosan perturbs the plasma membrane of S. cerevisiae.
FIG. 1.

Chitosan causes cellular leakage in S. cerevisiae. Cellular leakage was measured at 260 nm after treatment of cells in a buffer at pH 5.5 with the indicated concentrations of chitosan as described in Materials and Methods. The values displayed are means of three independent experiments with the standard error.
Chitosan affects growth rate and viability in a concentration-dependent manner.
When chitosan was tested in synthetic complete medium (SC) at pH 5.5 at three different concentrations (25, 50, and 100 μg/ml), we observed almost no effect on growth at 25 μg/ml, showing that under these conditions it was considerably less effective than in buffer alone. This is probably due to the higher ion concentrations in the growth medium (64). Chitosan at 50 μg/ml slightly inhibited growth, leading to a 10 to 15% reduction of relative growth rate (Fig. 2). However, viability measured as CFU was not significantly altered during the course of treatment (results not shown). At 100 μg/ml we observed a substantial loss of viability (results not shown). For further experiments, a concentration of 50 μg/ml was chosen.
FIG. 2.

Chitosan inhibits growth of Saccharomyces cerevisiae. Strain X2180-1A was grown in batch fermentors in SC medium, pH 5.5. The chitosan concentration used was 50 μg/ml. Chitosan was added 3 h after the start of culturing. The values displayed are means of three independent experiments with the standard error.
We also tested the growth of three other fungal species in the presence of chitosan. The human-pathogenic fungi C. albicans and C. glabrata both showed substantial reduction of growth upon exposure to this compound during exponential phase. The relative growth rate of C. albicans decreased by approximately 40% and 50% at 50 and 100 μg/ml chitosan, respectively. C. glabrata showed higher resistance to chitosan, yet at 100 and 200 μg/ml the reduction in relative growth rate was around 15% and 25%, respectively. Interestingly, the common food spoilage fungus Z. bailii showed complete growth inhibition at 50 μg of chitosan per ml (Table 1).
TABLE 1.
Chitosan inhibits the growth of various fungal speciesa
| Organism | Relative growth rate (h−1) at chitosan concn (μg/ml):
|
|||
|---|---|---|---|---|
| 0 | 50 | 100 | 200 | |
| S. cerevisiae | 0.54 | 0.20 | ND | ND |
| C. albicans | 0.58 | 0.33 | 0.29 | ND |
| C. glabrata | 0.65 | ND | 0.56 | 0.48 |
| Z. bailii | 0.29 | NG | ND | ND |
All species were grown to exponential phase (OD600 = 0.1), and then chitosan was added at the indicated concentrations. The relative growth rates were calculated from the time points following the addition of chitosan, for at least 3 h (Z. bailii) or up to 5 h (C. albicans and C. glabrata). The data are representative of at least two independent experiments. ND, not determined; NG, no growth.
Global expression changes in response to chitosan treatment in S. cerevisiae.
To characterize how S. cerevisiae responds and adapts to chitosan-induced stress, we studied the patterns of gene expression after 15, 30, 60, 120, and 180 min of exposure to chitosan compared to the zero time point. Six hundred seventy-one genes were differentially expressed (either induced or repressed at least 1.5-fold at one time point tested). After 15 min of treatment with chitosan, we found 46 genes that showed ≥1.5-fold upregulation (see the supplemental material at http://www.science.uva.nl/∼boorsma/zakrzewska/). Among these we found TPO2 and TPO3 to have the highest expression levels at 15 min. Interestingly, TPO2 and TPO3 code for polyamine transporters that are probably localized in the plasma membrane (2). Both of these proteins have been shown to be involved in transport of spermine (58), which, like chitosan, is a cationic molecule. There were 55 genes downregulated ≥1.5-fold after 15 min. In the following time points, we observed increasing numbers of both up- and downregulated genes. After 30 min the transcript levels of 97 genes were up and 118 genes were down. At the 60-min time point 97 genes showed increased and 73 showed decreased expression. Chitosan treatment of 120 min led to increased expression of 234 genes and decreased expression of 176 genes. The last time point in the series revealed 432 genes induced in expression and 239 genes reduced by at least 1.5-fold.
Functional classification of the expression changes induced in response to chitosan.
The transcriptome data were next grouped into categories according to the gene ontology nomenclature (1,389 groups) and analyzed with T-Profiler (see Materials and Methods). Within 15 min of chitosan treatment, we observed upregulation of gene groups belonging to the categories endoplasmic reticulum and integral to membrane (Table 2). Both of these categories remained upregulated throughout the time series. The integral to membrane group consists of genes coding for proteins having at least one transmembrane sequence. The endoplasmic reticulum category is enriched in genes involved in biosynthesis of plasma membrane components, consistent with the plasma membrane being the target of chitosan. After 30 min of treatment, the categories of cell wall (sensu Fungi) and cell wall organization and biogenesis showed significant induction, indicating that the cell wall response was mounted. In addition, the vacuole genes showed increased induction. We also observed substantial upregulation of the plasma membrane category at this time point.
TABLE 2.
Functional categories induced during chitosan stressa
| Functional category (no. of ORFs) |
t value at time (min):
|
||||
|---|---|---|---|---|---|
| 15 | 30 | 60 | 120 | 180 | |
| Endoplasmic reticulum (113) | 4.5 | 4.5 | 4.9 | 5.6 | 4.7 |
| Integral to membrane (79) | 4.0 | 5.5 | 6.4 | 5.2 | 4.7 |
| Cell wall (sensu Fungi) (69) | 3.1 | 5.5 | 7.3 | 7.5 | 5.3 |
| Cell wall organization and biogenesis (99) | 2.9 | 4.7 | 4.6 | 5.2 | 4.1 |
| Vacuole (sensu Fungi) (22) | 3.8 | 4.8 | 4.4 | 4.9 | 4.2 |
| Response to stress (57) | 3.7 | 3.5 | 2.1 | 4.2 | 5.0 |
| Plasma membrane (151) | 2.3 | 4.2 | 3.8 | 3.7 | 1.6 |
The number of ORFs in each category is shown in parentheses. All functional categories were tested (1,389). The selected categories have a number of ORFs of ≤1,000 and a t value of ≥4 in at least one of the time points tested. Significant t values are shown in hold. The other data are available in the supplemental material at http://www.science.uva.nl/∼boorsma/zakrzewska/.
At 60 min of chitosan stress, the cell wall and integral to membrane groups showed further increase, whereas other categories remained at a similar level of induction. The response to stress category became significantly upregulated at 120 min and was further increased at the last time point. No other major changes in expression were observed at 180 min. Among the 1,389 gene ontology categories tested, we found 18 categories to be significantly repressed at least at one time point (see the table in the supplemental data). Most of the downregulated categories were functionally related to rRNA processing, and ribosomes, suggesting that chitosan stress leads to a decrease in translational activity of the cells. A similar initial response has also been observed in the case of various other types of stress (19). Overall, T-Profiler analysis with gene ontology functional categories to define the gene groups supports the hypothesis that chitosan causes stress on the level of the plasma membrane and induces a cell wall compensatory mechanism. We also tested the functional categories as defined in MIPS (39). Similar results were obtained (data not shown), suggesting that our analysis has been comprehensive.
T-Profiler analysis of gene groups with common regulatory elements.
Using T-Profiler (see Materials and Methods), we identified several groups of genes sharing a specific motif (i.e., regulatory element binding site) in the 600 bp of their upstream region that showed significant alteration in transcriptional response to chitosan. We found a number of gene groups sharing a regulatory element that scored significantly at least at one of the time points tested (supplemental material). The seven most significant groups are discussed here. Five of these are positively correlated with expression levels, and two represent downregulated groups of genes.
Chitosan induces the environmental stress response.
Most of the commonly known stress conditions induce an expression program called environmental stress response. It refers to a specific pattern of transcription that involves a large number of genes (≈900) that are either up- or downregulated in response to various environmental changes. The induced genes are mainly under the control of the Msn2p and Msn4p transcription factors and contain one or more STRE elements in their promoter region. The repressed genes are involved in various aspects of RNA metabolism and ribosome biogenesis (19).
Transcriptional analysis of S. cerevisiae cells treated with a mild concentration of chitosan revealed the induction of the environmental stress response (Fig. 3A). T-Profiler analysis showed significant changes in transcriptional upregulation of genes containing the STRE binding motif. We also found, in agreement with earlier published data, that the genes involved in RNA processing and ribosome biogenesis are downregulated in response to chitosan. The behavior of these genes, containing the PAC (RNA polymerase A and C box) and rRPE (ribosomal RNA processing element) motifs (Fig. 3A), closely mimics the pattern of downregulation of genes upon different kinds of stress, including heat shock, sorbitol, and hydrogen peroxide treatment (18), strongly indicating the involvement of these motifs in the environmental stress response program. The first significant response to chitosan was observed after just 15 min of treatment. The data from the following time points showed stronger induction of environmental stress response, both up- and downregulation patterns occurring in parallel.
FIG. 3.

Transcriptional response of yeast cells to chitosan as analyzed by T-Profiler. The t values presented are calculated on the basis of three experiments. The groups of genes presented here contain the indicated binding sites in their upstream region. A. Genes regulated by the environmental stress response. Solid diamonds, Msn2 and Msn4 binding motif (AGGGG); solid squares, Msn2 and Msn4 binding motif (CCCCT); stars, PAC motif (CGATGAG); open triangles, rRPE motif (AAAATTT). B. Genes containing the Cin5p-binding motif (MTTAYRTAAK). C. Genes containing the Crz1p-binding motif (GAGGCT). D. Genes containing the Rlm1p-binding motif (TAWWWWTAGM). K, G or T; M, A or C; R, A or G; W, A or T; Y, C or T.
Chitosan induces three major specific transcriptional responses.
T-Profiler analysis of microarray data revealed three additional cis-regulatory motifs apart from the environmental stress response that were correlated positively with expression in chitosan-treated S. cerevisiae. The three identified motifs were the binding sites for the transcription factors Cin5p, Crz1p, and Rlm1p (Fig. 3B, 3C, and 3D, respectively). The Cin5p/Yap4p motif MTTAYRTAAK has been identified by REDUCE analysis of the Lee-binding data set (34) and confirmed by REDUCE analysis of microarray data (Boorsma, unpublished data). Interestingly, in a recent study of 203 DNA-binding transcriptional regulators (22), the reported binding site for Cin5p, TTACRTAA, shows large overlap with the Cin5p-binding site identified in this work. Cin5p is involved in multiple stress responses (16, 42, 43). When overexpressed, it increases tolerance to sodium and lithium (38).
Analysis based on FunSpec, which is a web tool that calculates the significant overlap of two sets of genes based on hypergeometric distribution (15), showed that genes containing a Cin5p binding motif are enriched in the gene ontology category of the plasma membrane, implying a role for Cin5p in the regulation of plasma membrane functions (data not shown). The Cin5p-mediated response to chitosan was significantly increased after 15 min of treatment and remained at a similar level throughout the course of the experiment (Fig. 3B).
The group of strongly upregulated genes (at least two-fold at 180 min of treatment) with a Cin5p-binding site contains five hypothetical open reading frames, YLR327C, YOR385W, YLR345W, YHR140W, and YMR090W (Table 3). Expression of DDR48, YRO2, NTH1, SAM2, and COX15 was also increased. DDR48 and NTH1 are known to be induced in response to various stress conditions (4, 65). The gene YRO2, which codes for a putative plasma membrane protein, shows strong similarity to HSP30/YRO1, encoding a plasma membrane protein involved in response to heat shock, ethanol stress, and entry into stationary phase (51). Hence, it seems to be involved in environmental stress response. Overall, the Cin5p-dependent response was mild but consistent throughout the experiment.
TABLE 3.
Saccharomyces cerevisiae genes induced by chitosan treatment: genes sharing the Cin5p binding site MTTAYRTAAK (119 ORFs)a
| ORF | Protein | Description | Log2 ratio at time (min):
|
||||
|---|---|---|---|---|---|---|---|
| 15 | 30 | 60 | 120 | 180 | |||
| YLR327C | Hypothetical ORF | 0.87 | 0.69 | 0.73 | 1.03 | 1.79 | |
| YMR173W | Ddr48 | DNA damage-responsive protein | 0.44 | 0.64 | 0.93 | 1.11 | 1.52 |
| YOR385W | Hypothetical ORF | 0.7 | 1.26 | 1.16 | 1.16 | 1.38 | |
| YLR345W | Hypothetical ORF | 0.56 | 0.56 | 0.51 | 0.83 | 1.17 | |
| YBR054W | Yro2 | Putative plasma membrane protein of unknown function, transcriptionally regulated by Haal p | 1.24 | 1.78 | 1.07 | 1.06 | 1.1 |
| YDR001C | Nth1 | Neutral trehalase, degrades trehalose; required for thermotolerance and may mediate resistance to other cellular stresses | 0.34 | 0.51 | 0.42 | 0.71 | 1.07 |
| YDR502C | Sam2 | Methionine biosynthesis regulation | 0.14 | 0.51 | 0.36 | 0.79 | 1.06 |
| YHR140W | Hypothetical ORF | 0.46 | 0.48 | 0.42 | 0.55 | 1.03 | |
| YMR090W | Hypothetical ORF | 0.38 | 0.26 | 0.28 | 0.68 | 0.99 | |
| YER141W | Cox15 | Protein required for hydroxylation of heme O to form heme A, which is an essential prosthetic group for cytochrome c oxidase | 0.47 | 0.64 | 0.55 | 0.74 | 1.01 |
The genes are grouped according to the regulatory elements present in their upstream regions. The values presented are log2 ratios of normalized signal intensities from pooled experiments. The genes presented here have log2 ratios equal to or above 1 at the 180-min time point.
Calcineurin-dependent pathway is involved in the response to chitosan.
The regulatory site (GAGGCT) binding Crz1p was identified by REDUCE analysis of transcriptome data from S. cerevisiae exposed to Ca2+ and Na+ (63). Crz1p is regulated by calcineurin, a Ca2+/calmodulin-dependent protein phosphatase. In S. cerevisiae, calcineurin is activated under certain environmental conditions, such as exposure to high levels of calcium or sodium, elevated temperature, or prolonged incubation with α-factor, and in cell wall mutants (33). Calcineurin controls Crz1p activity by regulating its subcellular localization. The Crz1p-mediated response was significantly induced in chitosan-treated S. cerevisiae cells at 60 min and 120 min and started to decrease at 180 min (Fig. 3C).
We found 16 genes to be induced by at least twofold at 180 min of chitosan treatment (Table 4). Nine of these were shown previously to be regulated by calcineurin/Crz1p (63). We detected six hypothetical open reading frames, YJR008W, YOL159C, YIL023C, YOR220W, YOR385W, and YBR005W. The last three have been identified previously as calcineurin-dependent genes regulated by Ca2+ and Na+ (63). In the group of highly upregulated genes, we found CMK2, coding for the calmodulin-dependent protein kinase involved in the calcineurin-mediated pathway, which is consistent with published data (63). The expression of three stress-related genes, GSY1, UBI4, and YGP1, was also induced. Two genes that localize in the S. cerevisiae membranes, TPO4 (encoding polyamine transport protein) and PMC1 (coding for vacuolar membrane Ca2+/ATPase), also showed increased expression upon chitosan treatment of the cells. Both have been identified as calcineurin dependent and regulated by Ca2+ (8, 63).
TABLE 4.
S. cerevisiae genes induced by chitosan: genes sharing the Crz1p binding site GAGGCT (252 ORFs)
| ORF | Protein | Description | Log2 ratio at time (min):
|
||||
|---|---|---|---|---|---|---|---|
| 15 | 30 | 60 | 120 | 180 | |||
| YLR136C | Tis11 | Zinc finger-containing homolog of mammalian TIS11 | 0.05 | 0.74 | 1.58 | 1.51 | 2.12 |
| YFR015C | Gsy1 | Glycogen synthase similar to Gsy2p, expression induced by glucose limitation, nitrogen starvation, enviromental stress, and stationary phase | 1.09 | 0.68 | 0.50 | 1.33 | 1.96 |
| YJR008W | Hypothetical ORF | 0.31 | 0.53 | 0.60 | 1.41 | 1.89 | |
| YOL016C | Cmk2 | Calmodulin-dependent protein kinase | 0.95 | 2.10 | 2.09 | 1.71 | 1.82 |
| YOR273C | Tpo4 | Polyamine transport protein | 0.20 | 0.43 | 0.49 | 1.09 | 1.65 |
| YLL039C | Ubi4 | UBI4 locus contains five to six tandem, in-frame copies of ubiquitin protein coding sequence, transcription is induced in response to several stress conditions | 0.22 | 0.23 | 0.57 | 1.10 | 1.59 |
| YOR220W | Hypothetical ORF | 0.49 | 1.16 | 1.27 | 1.14 | 1.51 | |
| YOR385W | Hypothetical ORF | 0.70 | 1.26 | 1.16 | 1.16 | 1.38 | |
| YNL160W | Ygp1 | May be involved in cellular adaptations prior to stationary phase | 0.89 | 1.18 | 0.93 | 1.04 | 1.19 |
| YDL234C | Gyp7 | GTPase-activating protein for yeast Rab family members, involved in vesicle-mediated protein trafficking | 0.37 | 0.58 | 0.70 | 0.80 | 1.17 |
| YOL159C | Hypothetical ORF | 0.34 | 0.39 | 0.64 | 1.06 | 1.13 | |
| YBR005W | Hypothetical ORF | 0.17 | 0.72 | 0.82 | 0.76 | 1.10 | |
| YJR010W | Met3 | ATP sulfurylase, catalyzes the primary step of intracellular sulfate activation, essential for assimilatory reduction of sulfate to sulfide, involved in methionine metabolism | 0.24 | 0.76 | 0.82 | 0.89 | 1.08 |
| YFL030W | Agx1 | Alanine:glyoxylate aminotransferase, catalyzes the synthesis of glycine from glyoxylate, one of three pathways for glycine biosynthesis in S. cerevisiae | 0.22 | 0.29 | 0.22 | 0.47 | 1.06 |
| YIL023C | Hypothetical ORF | 0.11 | 0.15 | 0.39 | 0.89 | 1.02 | |
| YGL006W | Pmc1 | May be involved in depleting cytosol of Ca2+ ions | 0.73 | 0.84 | 0.68 | 0.74 | 0.91 |
Among the other genes in this group, we found one gene with an unknown function, TIS11, and three genes involved in various cellular processes; GYP7, involved in vesicle-mediated protein trafficking; MET3, implicated in methionine metabolism; and AGX1, required for glycine biosynthesis. The first three genes of this group have also been found in the genomewide screen for calcineurin-regulated genes (63). The strength of the Crz1p-dependent response was similar to the the Cin5p-mediated induction of expression. However, we observed that the response developed more slowly and reached its maximum at a later time point, indicating that it is mounted later than Cin5p.
Calcineurin is a heterodimer comprised of a catalytic subunit, A, and a regulatory subunit, B. The function of calcineurin can be specifically inhibited by the immunosuppressant FK506. FK506 first binds to immunophilin FKBP12 and then as a complex inhibits calcineurin by binding to the interface between the A and B subunits (60). Transcriptome analysis of cells treated with FK506 revealed downregulation of genes whose transcription depends on the Crz1p regulatory protein (63). We thus tested the effect of simultaneous treatment of S. cerevisiae with chitosan and FK506 (Fig. 4). The exponentially growing cells were exposed to 2 μg of FK506 per ml and 25 μg of chitosan per ml. We monitored growth by measuring the OD600. We detected no significant growth rate reduction when FK506 was added to the control (relative growth rates were 0.58 ± 0.05 h−1 for the control and 0.57 ± 0.04 h−1 for the FK506-treated cells). Chitosan reduced the relative growth rate to 0.39 ± 0.02 h−1. Interestingly, when the drugs were combined, the relative growth rate was further reduced to 0.30 ± 0.02 h−1. This result suggests that the calcineurin-dependent response is necessary for adaptation of S. cerevisiae cells exposed to chitosan.
FIG. 4.

FK506 sensitizes S. cerevisiae cells to chitosan. Strain X2180-1A was grown in SC medium, pH 5.5, to an OD600 of ≈0.1. Next, FK506 and chitosan were added at concentrations of 2 μg/ml and 25 μg/ml, respectively. Growth was followed for 6.5 h by OD600 measurement. The experiment was performed three times. Values are shows for the control (open triangles), chitosan-treated (open squares), chitosan- and FK506-treated (open circles) cultures. Addition of FK506 only did not affect growth.
Cell wall integrity signaling pathway is induced in response to chitosan.
The cis-regulatory motif that binds to Rlm1p, TAWWWWTAGM, was identified by REDUCE analysis of transcriptome data from cells exposed to Calcofluor White and zymolyase (4). A highly similar sequence has been identified by Dodou and Treisman (13) and Jung and Levin (28). Rlm1p is a transcription factor involved in induction of the cell wall integrity signaling pathway. The Rlm1p-mediated response also developed more slowly than the Cin5p-mediated response (Fig. 3D). It reached its maximum at 60 min and was slightly decreased over the next 2 h.
Comparison of the chitosan transcriptional profile to recently published microarray data of transient cell wall damage caused by Congo Red, Zymolyase, and Calcofluor White (4, 17) and the recent transcriptional analysis of cell wall mutants (33) shows a large overlap in induction of expression of genes involved in cell wall organization and biogenesis as well as in signal transduction. In total, we detected 30 genes containing an Rlm1p binding site in the promoter region that increased expression by twofold or more at 180 min of chitosan treatment (Table 5).
TABLE 5.
S. cerevisiae genes induced by chitosan: genes sharing the Rlm1p binding site TAWWWWTAGM (351 ORFs)
| Group | ORF | Protein | Description | Log2 ratio at time (min):
|
||||
|---|---|---|---|---|---|---|---|---|
| 15 | 30 | 60 | 120 | 180 | ||||
| Cell wall maintenancea | ||||||||
| YKL163W | Pir3 | Cell wall protein containing tandem internal repeats | 0.13 | 0.59 | 1.59 | 2.52 | 3.05 | |
| YGR032W | Gsc2 | Catalytic subunit of 1,3 β-glucan synthase, has similarity to an alternate catalytic subunit, Fks1p (Gsclp) | 0.17 | 0.64 | 1.27 | 1.26 | 1.73 | |
| YLR194C | GPI-modified cell wall protein | 0.13 | 0.94 | 1.32 | 1.47 | 1.71 | ||
| YIR039C | Yps6 | GPI-anchored aspartic protease (yapsin 6) | 0.60 | 0.74 | 0.69 | 1.16 | 1.57 | |
| YKL096W | Cwp1 | GPI-modified cell wall protein | 0.28 | 0.46 | 0.79 | 1.23 | 1.35 | |
| YDR055W | Pst1 | GPI-modified cell wall protein | 0.30 | 0.55 | 0.76 | 1.05 | 1.32 | |
| YLR120C | Yps1 | GPI-anchored aspartic protease (yapsin 1) | 0.42 | 1.01 | 1.10 | 1.15 | 1.31 | |
| YLR121C | Yps3 | GPI-anchored aspartic protease (yapsin 3) | −0.22 | 0.27 | 0.74 | 0.89 | 1.20 | |
| YGL259W | Yps5 | GPI-anchored aspartic protease (yapsin 5) | 0.33 | 0.39 | 0.36 | 0.66 | 1.01 | |
| YKR061W | Ktr2 | Involved in N-linked glycosylation of cell wall mannoproteins | −0.29 | 0.02 | 0.5 | 0.81 | 1.06 | |
| Signal transduction | ||||||||
| YKL161C | M1p1 | Mpk1-like protein kinase; associates with Rlm1p | −0.09 | 0.64 | 1.38 | 1.83 | 1.98 | |
| YOL016C | Cmk2b | Calmodulin-dependent protein kinase | 0.95 | 2.1 | 2.09 | 1.71 | 1.82 | |
| YHR030C | Slt2 | MAP kinase of the cell wall integrity pathway | 0.38 | 0.89 | 1.08 | 1.22 | 1.43 | |
| General stress response | ||||||||
| YLL039C | Ubi4 | Protein involved in ubiquitination of proteins | 0.22 | 0.23 | 0.57 | 1.1 | 1.59 | |
| YDR533C | Hsp31 | Possible chaperone and cysteine protease with similarity to E. coli Hsp31 and S. cerevisiae Hsp32p, Hsp33p, and Sno4p; member of the DJ-1/ThiJ/PfpI superfamily, which includes human DJ-1, involved in Parkinson's disease | 0.10 | 0.24 | 0.42 | 0.86 | 1.37 | |
| YER062C | Hor2 | Involved in glycerol biosynthesis; induced in response to hyperosmotic stress and oxidative stress and during the diauxic transition | 0.62 | 0.75 | 0.60 | 0.82 | 1.22 | |
| YDR001C | Nth1 | Neutral trehalase, degrades trehalose; required for thermotolerance and may mediate resistance to other cellular stresses | 0.34 | 0.51 | 0.42 | 0.71 | 1.07 | |
| Other/unknown function | ||||||||
| YHR209W | Putative S-adenosylmethionine-dependent methyltransferase of the seven-beta-strand family | 0.48 | 0.82 | 1.64 | 2.25 | 2.84 | ||
| YGL255W | Zrt1 | High-affinity zinc transporter of the plasma membrane, responsible for the majority of zinc uptake | 0.18 | 0.20 | 0.53 | 0.69 | 2.65 | |
| YDR085C | Afr1 | Coordinates regulation of α-factor receptor signaling and induction of morphogenesis during conjugation | 0.50 | 0.62 | 0.91 | 1.35 | 1.77 | |
| YPL088W | Putative aryl alcohol dehydrogenase | 0.01 | 0.39 | 1.07 | 1.40 | 1.66 | ||
| YJL082W | Iml2 | Protein of unknown function | 0.36 | 0.73 | 0.83 | 1.21 | 1.32 | |
| YOL084W | Phm7 | Protein of unknown function, expression regulated by phosphate levels | 0.30 | 0.68 | 0.38 | 0.72 | 1.29 | |
| YIL107C | Pfk26 | 6-Phosphofructose-2-kinase | 0.42 | 0.47 | 0.46 | 0.84 | 1.25 | |
| YOL159C | Hypothetical ORF | 0.34 | 0.39 | 0.64 | 1.06 | 1.13 | ||
| YJL132W | Hypothetical ORF | 0.22 | 0.55 | 0.60 | 0.87 | 1.12 | ||
| YBR071W | Hypothetical ORF | 0.31 | 0.59 | 0.78 | 0.92 | 1.12 | ||
| YLR133W | Ckil | Choline kinase | 0.04 | 0.42 | 0.37 | 0.92 | 1.11 | |
| YMR315W | Hypothetical ORF | 0.27 | 0.44 | 0.66 | 0.94 | 1.10 | ||
| YIL108W | Hypothetical ORF | 0.18 | 0.32 | 0.40 | 0.73 | 1.00 | ||
SED1 and CRH1, which both encode GPI-modified cell wall proteins, are also upregulated (log2 ratios of 0.4 and 0.9 at 180 min, respectively).
Probably has an ineffective Rlm1p binding site (see text).
Of 16 genes identified as cell wall related (28), we found seven to be strongly induced, five slightly induced, two not changed, and two missing from the data set. SLT2, encoding a mitogen-activated protein kinase of the cell wall integrity pathway, and YKL161C/MLP1, coding for a putative mitogen-activated protein kinase that has been shown to interact with Rlm1p (61), were positively regulated by chitosan stress. Three strongly upregulated genes code for GPI (glycosylphosphatidylinositol-modified) cell wall proteins, CWP1, PST1, and a gene with unknown function, YLR194C. YLR194C was also upregulated in all five cell wall mutants investigated in a recent genomewide study (33). Taken together, these data strongly suggest a role for YLR194C in cell wall biogenesis and structure.
Other members of the GPI cell wall proteins family, SED1 and CRH1, showed a slight induction. The gene most strongly upregulated was PIR3, which encodes a structural constituent of the cell wall. Interestingly, two other members of the PIR (protein with internal repeats) cell wall proteins family (PIR1 and PIR2) were not induced, and CIS3/PIR4 was not present in the data set. The gene GSC2, coding for an alternative catalytic subunit of 1,3-β-glucan synthase, was highly upregulated in response to chitosan. The expression of GSC2 is increased upon activation of the cell wall integrity pathway (28). In addition, it has been shown to be induced during activation of the calcineurin-dependent pathway (63) and to be dually regulated by both pathways (66), indicating that it is subject to combinatorial control. The genes BGL2, FKS1, and CHS3 showed a slight increase of expression in chitosan-treated cells (supplemental data). The expression of KTR2, implicated in glycosylation of cell wall mannoproteins, was also induced.
In addition to genes known to be involved in cell wall biogenesis and structure, we discovered four members of the GPI-anchored aspartic protease family, YPS1, YPS3, YPS5, and YPS6. Although this family of genes codes for proteins residing in the plasma membrane, they might also have a function in cell wall maintenance. Interestingly, we also found CMK2 in the group of upregulated genes containing an Rlm1p-binding site. However, the Rlm1p-binding site in the promoter region of this gene localizes only 9 bp from the start codon, indicating that this gene is not controlled by Rlm1p. This is also consistent with the different time course of the expression levels of this gene compared to the other genes in Table 5.
In the Rlm1p-dependent set of responsive genes, we further identified three genes that are induced under different stress conditions, UBI4, NTH1, and HOR2 (4). The last is known to be involved in response to hyperosmotic and oxidative stress. Among the other genes in this category, YHR209W (coding for a putative S-adenosylmethionine-dependent methyltransferase of the seven-beta-strand family) (44) and the gene coding for the zinc transporter of the plasma membrane (ZRT1) were both highly upregulated (six- to sevenfold) in response to chitosan. In summary, the Rlm1p-mediated response was the strongest of the three specific positive responses identified in transcriptional profiles of chitosan-treated S. cerevisiae. However, it was delayed compared to the Cin5p response, suggesting that it is an indirect response.
β-1,3-Glucanase resistance increases upon chitosan treatment.
One of the known outcomes of the cell wall integrity pathway is cell wall remodeling, which can be measured with glucan-degrading enzymes. Induction of the cell wall integrity pathway in response to Calcofluor White and Zymolyase treatment leads to a significant increase of resistance to β-1,3-glucanase (4, 11). To confirm the role of the Rlm1p-regulated response in the chitosan response, we tested whether chitosan induces resistance to glucanase activity. Quantazyme resistance of wild-type cells exposed to chitosan for up to 4 h gradually increased, consistent with the notion that chitosan causes Rlm1p-mediated cell wall remodeling (results not shown). We further showed that treatment for 3 h with 50 and 100 μg of chitosan per ml caused significant increases in Quantazyme resistance, which depended on the chitosan concentration (Fig. 5).
FIG. 5.

Chitosan increases S. cerevisiae resistance to β-1,3-glucanase. Strain X2180-1A was grown for 3 h in SC medium, pH 5.5. Then, chitosan was added at a concentration of 50 or 100 μg/ml. After 3 h of chitosan treatment, the cells were harvested and treated with Quantazyme (see Materials and Methods). Directly after Quantazyme addition, cell lysis was measured every 10 s for 30 min at an OD600 and was expressed as a percentage of the starting OD600. The values are means of two independent experiments. The curves are for the control (lower curve) and chitosan-treated (middle curve, 50 μg/ml; upper curve, 100 μg/ml) cultures.
Sensitivity of transcription factor deletion mutants is altered upon chitosan treatment.
Analysis of the transcriptional response of S. cerevisiae to chitosan identified, in addition to the general stress response, three regulatory pathways which are mediated by the transcription factors Cin5p, Crz1p, and Rlm1p. In order to investigate whether loss of these regulators leads to increased sensitivity to chitosan, we tested deletion mutants of these genes. We observed a substantial increase in sensitivity of cin5Δ and crz1Δ cells compared to wild-type cells (Fig. 6). Interestingly, rlm1Δ cells showed no increased sensitivity but seemed to be slightly more resistant to chitosan than the wild type. Similar results have been obtained before with rlm1Δ cells subjected to cell wall stress (17, 46).
FIG. 6.

Chitosan susceptibility of S. cerevisiae deletion mutants. Wild-type (WT) and mutant strains were grown overnight in SC at 30°C, the OD600 was normalized, and 10-fold dilutions were spotted onto SC plates with or without chitosan. Plates were photographed after 3 days of growth at 30°C. Panel A, growth on SC medium without chitosan. Panel B, growth on SC medium with 200 μg of chitosan per ml.
DISCUSSION
Chitosan is a naturally occurring, deacetylated derivative of chitin and has been shown to exert antimicrobial action against a broad range of microorganisms without having a significant effect on mammalian cells (47, 48, 52). For this reason, it is attractive as a potential antimicrobial compound. We have shown here that chitosan affects the growth of the model fungus S. cerevisiae, the food spoilage fungus Z. bailii, and two medically important fungi, C. albicans and C. glabrata. To characterize the fungal response to chitosan on a genomewide scale, we used S. cerevisiae as a model organism. Transcriptome data were analyzed with a newly developed tool, T-Profiler (5). T-Profiler is a highly sensitive and relatively unbiased method that can be applied to single data sets and does not require the introduction of arbitrary cutoffs, in contrast to methods such as hierarchical or k-means clustering.
This analysis led to the identification of four groups of coexpressed genes participating in the environmental stress response, the Cin5p-, Crz1p-, and Rlm1p-mediated responses. The environmental stress response was induced rapidly together with the Cin5p-regulated response. The induction of environmental stress response upon chitosan treatment resembled the response patterns observed for other stress conditions (19). The upregulated genes controlled by Msn2p and Msn4p were acting in parallel with the downregulated genes containing PAC and rRPE motifs. After just 15 min of treatment, the Cin5p-mediated response was almost fully induced, and it remained consistently upregulated throughout the experiment. The Cin5p-controlled genes are known to be involved in multiple stress responses (16, 42, 43). Induction of the Cin5p-mediated response in cells treated with the plasma membrane perturbant chitosan suggests a possible role for this transcription factor in dealing with stress targeted at the plasma membrane. This was also supported by the observation that cin5Δ cells were hypersensitive to chitosan.
The Crz1p-mediated response was similar in strength to the Cin5p-mediated response, yet it increased more gradually and reached its maximal value only after 60 min of treatment, suggesting that it may represent a late response. The Crz1p-dependent response is activated by many forms of stress, including cell wall stress (33). Crz1p also induces a number of genes involved in ion homeostasis (63). Induction of cell leakage by chitosan stress (27; this work) could lead to activation of the calcineurin-dependent pathway in order to deal with ion fluctuations. In addition, the calcineurin-dependent pathway has also been shown to play an essential role in the survival of C. albicans subjected to fluconazole-induced membrane stress (7). We observed that blocking the calcineurin/Crz1p pathway with the specific calcineurin inhibitor FK506 led to increased sensitivity to chitosan, supporting the involvement of the calcineurin-dependent pathway in the response to chitosan-induced membrane stress. In addition, a crz1Δ strain was found to be hypersensitive to chitosan.
The Rlm1p-mediated response was considerably stronger than the Cin5p- and Crz1p-regulated responses. Since Rlm1p is under the sole control of the cell integrity signaling pathway (61), this suggests that this pathway is relatively strongly induced by chitosan. Of 16 genes identified as cell wall related and under the control of Rlm1p (28), we found 12 to be induced. When we compared our data with transcriptional studies of transient cell wall damage caused by Congo Red, Zymolyase, and Calcofluor White (4, 17), we found strong similarity to the chitosan stress response with respect to the group of upregulated genes involved in cell wall biogenesis and structure.
In a recent study, global transcription analysis of five S. cerevisiae cell wall deletion mutants, fks1Δ, kre6Δ, mnn9Δ, gas1Δ, and knr4Δ, was used to define a consensus group of genes that are significantly altered in expression by cell wall stress (33). The genes in this cell wall compensatory cluster suggest the involvement of three major signal transduction pathways: the environmental stress response mediated by Msn2 and Msn4, the Ca2+/calcineurin-mediated pathway, and the cell integrity pathway. We found that the same three pathways were induced in response to chitosan stress. Interestingly, on the level of single genes, we also observed many similarities, especially in the group of genes containing an Rlm1p-binding site, supporting the hypothesis that chitosan leads to induction of the cell wall integrity pathway.
The involvement of the cell wall integrity pathway in the chitosan response was validated by another experiment. It has been shown that various forms of cell wall stress result in cell wall modifications, which can be measured as increased resistance of intact cells to digestion with β-1,3-glucanase (4, 11, 30). In exponentially growing cells, this increase in resistance is dependent on SLT2 (11). We found that treatment of wild-type cells with 50 or 100 μg of chitosan per ml caused a significant increase in β-1,3-glucanase resistance, in a time- and concentration-dependent manner. The changes in the cell wall that cause the increased resistance to Quantazyme observed upon cell wall stress remain to be discovered. Possibly, it is due to an increase in the chitin content of the cell wall and the cross-linking of this polymer to cell wall glucans, which are known responses to cell wall stress (32). This idea is consistent with our observation that genes involved in chitin biosynthesis, such as CHS1 and CHS3, are induced by chitosan.
Increased incorporation of proteins into the outer layer of the cell wall, which make the β-1,3-glucan layer less accessible, might also contribute to increased resistance to β-1,3-glucanase. This possibility is supported by the strong upregulation of the genes CWP1 and PIR3, which encode cell wall proteins. We also tested the sensitivity of cells deleted for RLM1. In contrast to cin5Δ and crz1Δ cells, which as expected became more sensitive to chitosan, rlm1Δ cells were slightly more resistant to chitosan. This is consistent with earlier observations. For example, rlm1Δ cells do not become more sensitive to caspofungin and Congo Red, although both compounds are known to induce the cell wall integrity pathway (17, 46). It has further been shown that deletion of RLM1 does not cause a loss in cell integrity (61). The behavior of the rlm1Δ strain under cell wall stress conditions suggests that the cell wall integrity pathway can be activated via an Rlm1p-independent circuit. It also implies that Rlm1p is not the only target of Slt2p. A possible explanation is that Rlm1p is a member of a protein complex and that its deletion allows another protein to occupy its place in the protein complex and take over its function.
There are four tyrosine phosphatases known to negatively regulate Slt2 activity. These are Ptp2, Ptp3, Sdp1, and Msg5. Of the corresponding genes, only PTP2 was significantly upregulated in this study, in parallel with SLT2. This is in agreement with the finding that PTP2 is the only one of the four protein tyrosine phosphatase-encoding genes whose expression is regulated by Slt2 itself (21).
The Rlm1p-mediated response was delayed compared to the Cin5p-mediated response. Conceivably, chitosan-induced loss of plasma membrane integrity may affect the activity of plasma membrane-associated cell wall polysaccharide synthases such as β-1,3-glucan or chitin synthase and other membrane-bound enzymes involved in cell wall formation. This would result in defective cell wall formation, which the cells may try to counteract by mounting the Rlm1p-mediated response. Interestingly, it has been shown that the cationic drug chlorpromazine, which induces membrane stretch by inserting itself into the lipid bilayer, also activates the Pkc1-Slt2 signaling pathway (29). Furthermore, T-Profiler analysis of previously published expression profiles of other plasma membrane-perturbing compounds such as itraconazole and lovastatin (25) also shows activation of the Crz1p- and Rlm1p-mediated responses, suggesting an induction of a similar compensatory response on the cell wall level (data not shown).
In numerous studies, the binding of chitosan to anionic compounds has been demonstrated on the surface of both yeasts and gram-negative bacteria (23, 24). It is also known that the presence of divalent cations impairs the effect of chitosan, probably by binding to chitosan targets (23). This makes it plausible that the cationic nature of chitosan is part of its mode of action. In a recent study of chitosan effect on bacterial membranes, it has been shown to interact with negatively charged phospholipids, with the NH3+ groups being responsible for this interaction (36).
Yeast sphingolipids, which constitute a major part of plasma membrane lipids and reside in the outer layer, are negatively charged. The most abundant yeast sphingolipid, M(IP)2C, contains two negative charges. Thus, sphingolipids may represent possible binding sites for chitosan. Importantly, mammalian cells do not possess negatively charged sphingolipids, and that may explain why they are much less sensitive to chitosan. Another indication that chitosan may target sphingolipids is provided by the observation that a conserved group of cationic antimicrobial peptides, plant defensins, exert their antifungal effect by inducing membrane permeabilization through specific interaction with high-affinity binding sites on fungal cell surface (57).
The involvement of sphingolipids in sensitivity to plant defensins has been shown for the filamentous fungus Neurospora crassa (14). Among other plant defensins, the radish plant defensin RsAFP2 has been demonstrated to cause sphingolipid-dependent antifungal activity against the yeast species P. pastoris and C. albicans (57). DmAMP1, a plant defensin from Dahlia merckii, induces yeast membrane permeabilization that correlates with its antifungal activity (26, 54). In an enzyme-linked immunosorbent assay-based binding assay, DmAMP1 was found to interact with sphingolipids purified from S. cerevisiae, with optimal results obtained when an equimolar mixture of ergosterol and yeast sphingolipids was used to reflect the in vivo plasma membrane composition in specific domains, lipid rafts (55). Yeast lipid rafts are known to be enriched in both sphingolipids and ergosterol, raising the question of whether chitosan affects plasma membrane integrity by perturbing lipid rafts. The polycationic nature of chitosan, supported by our transcriptome analysis revealing the involvement of the plasma membrane in the chitosan stress response, suggests a mode of antifungal activity similar to that of defensins. Finally, chitosan has been shown to greatly improve the fungistatic effects of the classical weak acid preservative benzoic acid (49). The question of whether other synergistically active compounds exist will be addressed in future research together with further studies of the exact mechanism of S. cerevisiae response to chitosan on the molecular and cellular level.
Acknowledgments
We thank Jacqueline Kummer for performing the β-1,3-glucanase resistance assays.
This research was financially supported by grant APB.5504 from the Netherlands Technology Foundation (STW).
REFERENCES
- 1.Affymetrix. 2000. Protocols for yeast S98 chips. [Online.] http://www.affymetrix.com/support/technical/manual/expression_manual.affx.
- 2.Albertsen, M., I. Bellahn, R. Kramer, and S. Waffenschmidt. 2003. Localization and function of the yeast multidrug transporter Tpo1p. J Biol. Chem. 278:12820-12825. [DOI] [PubMed] [Google Scholar]
- 3.Ashburner, M., C. A. Ball, J. A. Blake, D. Botstein, H. Butler, J. M. Cherry, A. P. Davis, K. Dolinski, S. S. Dwight, J. T. Eppig, M. A. Harris, D. P. Hill, L. Issel-Tarver, A. Kasarskis, S. Lewis, J. C. Matese, J. E. Richardson, M. Ringwald, G. M. Rubin, and G. Sherlock. 2000. Gene ontology: tool for the unification of biology. The Gene Ontology Consortium. Nat. Genet. 25:25-29. [DOI] [PMC free article] [PubMed] [Google Scholar]
- 4.Boorsma, A., H. de Nobel, B. ter Riet, B. Bargmann, S. Brul, K. J. Hellingwerf, and F. M. Klis. 2004. Characterization of the transcriptional response to cell wall stress in Saccharomyces cerevisiae. Yeast 21:413-427. [DOI] [PubMed] [Google Scholar]
- 5.Boorsma, A., and H. Bussemaker. T-Profiler; a web-tool to infer transcriptional module activity from gene expression data. Nucleic Acids Res., submitted. [DOI] [PMC free article] [PubMed]
- 6.Bussemaker, H. J., H. Li, and E. D. Siggia. 2001., Regulatory element detection using correlation with expression. Nat. Genet. 27:167-171. [DOI] [PubMed] [Google Scholar]
- 7.Cruz, M. C., A. L. Goldstein, J. R. Blankenship, M. Del Poeta, D. Davis, M. E. Cardenas, J. R. Perfect, J. H. McCusker, and J. Heitman. 2002. Calcineurin is essential for survival during membrane stress in Candida albicans. EMBO J. 21:546-559. [DOI] [PMC free article] [PubMed] [Google Scholar]
- 8.Cyert, M. S. 2003. Calcineurin signaling in Saccharomyces cerevisiae: how yeast go crazy in response to stress. Biochem. Biophys. Res. Commun. 311:1143-1150. [DOI] [PubMed] [Google Scholar]
- 9.Daum, G., N. D. Lees, M. Bard, and R. Dickson. 1998. Biochemistry, cell biology and molecular biology of lipids of Saccharomyces cerevisiae. Yeast 14:1471-1510. [DOI] [PubMed] [Google Scholar]
- 10.De Nobel, J. G., F. M. Klis, T. Munnik, J. Priem, and H. van den Ende. 1990. An assay of relative cell wall porosity in Saccharomyces cerevisiae, Kluyveromyces lactis and Schizosaccharomyces pombe. Yeast 6:483-490. [DOI] [PubMed] [Google Scholar]
- 11.De Nobel, H., C. Ruiz, H. Martin, W. Morris, S. Brul, M. Molina, and F. M. Klis. 2000. Cell wall perturbation in yeast results in dual phosphorylation of the Slt2/Mpk1 MAP kinase and in an Slt2-mediated increase in FKS2-lacZ expression, glucanase resistance and thermotolerance. Microbiology 146:2121-2132. [DOI] [PubMed] [Google Scholar]
- 12.Dickson, R. C., and R. L. Lester. 2002. Sphingolipid functions in Saccharomyces cerevisiae. Biochim. Biophys. Acta 1583:13-25. [DOI] [PubMed] [Google Scholar]
- 13.Dodou, E., and R. Treisman. 1997. The Saccharomyces cerevisiae MADS-box transcription factor Rlm1 is a target for the Mpk1 mitogen-activated protein kinase pathway. Mol. Cell. Biol. 17:1848-1859. [DOI] [PMC free article] [PubMed] [Google Scholar]
- 14.Ferket, K. K., S. B. Levery, C. Park, B. P. Cammue, and K. Thevissen. 2003. Isolation and characterization of Neurospora crassa mutants resistant to antifungal plant defensins. Fungal Genet. Biol. 40:176-185. [DOI] [PubMed] [Google Scholar]
- 15.FunSpec. 2002. A web-based cluster interpreter for yeast. BMC Bioinformatics. [Online] http://funspec.med.utoronto.ca/. [DOI] [PMC free article] [PubMed]
- 16.Furuchi, T., H. Ishikawa, N. Miura, M. Ishizuka, K. Kajiya, S. Kuge, and A. Naganuma. 2001. Two nuclear proteins, Cin5 and Ydr259c, confer resistance to cisplatin in Saccharomyces cerevisiae. Mol. Pharmacol. 59:470-474. [DOI] [PubMed] [Google Scholar]
- 17.Garcia, R., C. Bermejo, C. Grau, R. Perez, J. M. Rodriguez-Pena, J. Francois, C. Nombela, and J. Arroyo. 2004. The global transcriptional response to transient cell wall damage in Saccharomyces cerevisiae and its regulation by the cell integrity signaling pathway. J. Biol. Chem. 279:15183-15195. [DOI] [PubMed] [Google Scholar]
- 18.Gasch, A. P., P. T. Spellman, C. M. Kao, O. Carmel-Harel, M. B. Eisen, G. Storz, D. Botstein, and P. O. Brown. 2000. Genomic expression programs in the response of yeast cells to environmental changes. Mol. Biol. Cell. 11:4241-4257. [DOI] [PMC free article] [PubMed] [Google Scholar]
- 19.Gasch, A. P. 2003. The environmental stress response: a common yeast response to diverse environmental stresses. Curr. Top. Genet. 1:11-70. [Google Scholar]
- 20.Gene ontology categories. 2000. Gene ontology categories [Online.]. ftp://genome-ftp.stanford.edu/pub/yeast/data_download/literature_curation/.
- 21.Hahn, J. S., and D. J. Thiele. 2002. Regulation of the Saccharomyces cerevisiae Slt2 kinase pathway by the stress-inducible Sdp1 dual specificity phosphatase. Biol. Chem. 277:21278-21284. [DOI] [PubMed] [Google Scholar]
- 22.Harbison, C. T., D. B. Gordon, T. I. Lee, N. J. Rinaldi, K. D. Macisaac, T. W. Danford, N. M. Hannett, J. B. Tagne, D. B. Reynolds, J. Yoo, E. G. Jennings, J. Zeitlinger, D. K. Pokholok, M. Kellis, P. A. Rolfe, K. T. Takusagawa, E. S. Lander, D. K. Gifford, E. Fraenkel, and R. A. Young. 2004. Transcriptional regulatory code of a eukaryotic genome. Nature 431:99-104. [DOI] [PMC free article] [PubMed] [Google Scholar]
- 23.Helander, I. M., E. L. Nurmiaho-Lassila, R. Ahvenainen, J. Rhoades, and S. Roller. 2001. Chitosan disrupts the barrier properties of the outer membrane of gram-negative bacteria. Int. J. Food Microbiol. 71:235-244. [DOI] [PubMed] [Google Scholar]
- 24.Horisberger, M., and M. F. Clerc. 1988. Ultrastructural localization of anionic sites on the surface of yeast, hyphal and germ-tube forming cells of Candida albicans, Eur. J. Cell. Biol. 46:444-452. [PubMed] [Google Scholar]
- 25.Hughes, T. R., M. J. Marton, A. R. Jones, C. J. Roberts, R. Stoughton, C. D. Armour, H. A. Bennett, E. Coffey, H. Dai, Y. D. He, M. J. Kidd, A. M. King, M. R. Meyer, D. Slade, P. Y. Lum, S. B. Stepaniants, D. D. Shoemaker, D. Gachotte, K. Chakraburtty, J. Simon, M. Bard, and S. H. Friend. 2000. Functional discovery via a compendium of expression profiles. Cell 102:109-126. [DOI] [PubMed] [Google Scholar]
- 26.Im, Y. J., J. Idkowiak-Baldys, K. Thevissen, B. P. A. Cammue, and J. Y. Takemoto. 2003. IPT1-independent sphingolipid biosynthesis and yeast inhibition by syringomycin E and plant defensin DmAMP1. FEMS Microbiol. Lett. 223:199-203. [DOI] [PubMed] [Google Scholar]
- 27.Jaspers, H. T. A., K. Christianse, and J. van Steveninck. 1975. An Improved method for the preparation of yeast enzymes in situ. Biochem. Biophys. Res. Commun. 65:1434-1439. [DOI] [PubMed] [Google Scholar]
- 28.Jung, U. S., and D. E. Levin. 1999. Genome-wide analysis of gene expression regulated by the yeast cell wall integrity-signalling pathway. Mol. Microbiol. 34:1049-1057. [DOI] [PubMed] [Google Scholar]
- 29.Kamada, Y., U. S. Jung, J. Piotrowski, and D. E. Levin. 1995. The protein kinase C-activated MAP kinase pathway of Saccharomyces cerevisiae mediates a novel aspect of the heat shock response. Genes Dev. 9:1559-1571. [DOI] [PubMed] [Google Scholar]
- 30.Kapteyn, J. C., B. ter Riet, E. Vink, S. Blad, H. De Nobel, H. Van Den Ende, and F. M. Klis. 2001. Low external pH induces HOG1-dependent changes in the organization of the Saccharomyces cerevisiae cell wall. Mol. Microbiol. 39:469-479. [DOI] [PubMed] [Google Scholar]
- 31.Kellis, M., N. Patterson, M. Endrizzi, B. Birren, and E. S. Lander. 2003. Sequencing and comparison of yeast species to identify genes and regulatory elements. Nature 423:241-254. [DOI] [PubMed] [Google Scholar]
- 32.Klis, F. M., P. Mol, K. Hellingwerf, and S. Brul. 2002. Dynamics of cell wall structure in Saccharomyces cerevisiae. FEMS Microbiol. Rev. 26:239-256. [DOI] [PubMed] [Google Scholar]
- 33.Lagorce, A., N. C. Hauser, D. Labourdette, C. Rodriguez, H. Martin-Yken, J. Arroyo, J. D. Hoheisel, and J. Francois. 2003. Genome-wide analysis of the response to cell wall mutations in the yeast Saccharomyces cerevisiae. J. Biol. Chem. 278:20345-20357. [DOI] [PubMed] [Google Scholar]
- 34.Lee, T. I., N. J. Rinaldi, F. Robert, D. T. Odom, Z. Bar-Joseph, G. K. Gerber, N. M. Hannett, C. T. Harbison, C. M. Thompson, I. Simon, J. Zeitlinger, E. G. Jennings, H. L. Murray, D. B. Gordon, B. Ren, J. J. Wyrick, J. B. Tagne, T. L. Volkert, E. Fraenkel, D. K. Gifford, and R. A. Young. 2002. Transcriptional regulatory networks in Saccharomyces cerevisiae. Science 298:799-804. [DOI] [PubMed] [Google Scholar]
- 35.Li, C., and W. H. Wong. 2001. Model-based analysis of oligonucleotide arrays: expression index computation and outlier detection. Proc. Natl. Acad. Sci. USA 98:31-36. [DOI] [PMC free article] [PubMed] [Google Scholar]
- 36.Liu, H., Y. Du, X. Wang, and L. Sun. 2004. Chitosan kills bacteria through cell membrane damage. Int. J. Food Microbiol. 95:147-155. [DOI] [PubMed] [Google Scholar]
- 37.Llinas, M., and the DeRisi Lab. 2001. Total RNA isolation from S. cerevisiae. [Online.]. http://www.microarrays.org/pdfs/TotalRNAIsolation.pdf.
- 38.Mendizabal, I., G. Rios, J. M. Mulet, R. Serrano, and I. F. de Larrinoa. 1998. Yeast putative transcription factors involved in salt tolerance. FEBS Lett. 425:323-328. [DOI] [PubMed] [Google Scholar]
- 39.MIPS. 2000. Comprehensive yeast genome database (CYGD), functional catalogue. [Online.]. http://mips.gsf.de/proj/funcatDB/search_main_frame.html.
- 40.Moskvina, E., E. M. Imre, and H. Ruis. 1999. Stress factors acting at the level of the plasma membrane induce transcription via the stress response element (STRE) of the yeast Saccharomyces cerevisiae. Mol. Microbiol. 32:1263-1272. [DOI] [PubMed] [Google Scholar]
- 41.Motulsky, H. 1995. Intuitive biostatistics. Oxford University Press, Inc., New York, N.Y.
- 42.Nevitt, T., Pereira, J., Azevedo, D., Guerreiro, P., and C. Rodrigues-Pousada. 2004. Expression of YAP4 in Saccharomyces cerevisiae under osmotic stress. Biochem. J. 379:367-374. [DOI] [PMC free article] [PubMed] [Google Scholar]
- 43.Nevitt, T., Pereira, J., and C. Rodrigues-Pousada. 2004. YAP4 gene expression is induced in response to several forms of stress in Saccharomyces cerevisiae. Yeast 21:1365-1374. [DOI] [PubMed] [Google Scholar]
- 44.Niewmierzycka, A., and S. Clarke. 1999. S-Adenosylmethionine-dependent methylation in Saccharomyces cerevisiae. Identification of a novel protein arginine methyltransferase. J. Biol. Chem. 274:814-824. [DOI] [PubMed] [Google Scholar]
- 45.Popolo, L., D. Gilardelli, P. Bonfante, and M. Vai. 1997. Increase in chitin as an essential response to defects in assembly of cell wall polymers in the ggp1 mutant of Saccharomyces cerevisiae. J. Bacteriol. 179:463-469. [DOI] [PMC free article] [PubMed] [Google Scholar]
- 46.Reinoso-Martin, C., C. Schuller, M. Schuetzer-Muehlbauer, and K. Kuchler. 2003. The yeast protein kinase C cell integrity pathway mediates tolerance to the antifungal drug caspofungin through activation of Slt2p mitogen-activated protein kinase signaling. Eukaryot. Cell 2:1200-1210. [DOI] [PMC free article] [PubMed] [Google Scholar]
- 47.Rhoades, J., and S. Roller. 2000. Antimicrobial actions of degraded and native chitosan against spoilage organisms in laboratory media and foods. Appl. Environ. Microbiol. 66:80-86. [DOI] [PMC free article] [PubMed] [Google Scholar]
- 48.Roller, S., and N. Covill. 1999. The antifungal properties of chitosan in laboratory media and apple juice. Int. J. Food Microbiol. 47:67-77. [DOI] [PubMed] [Google Scholar]
- 49.Sagoo, S. K., R. Board, and S. Roller. 2002. Chitosan potentiates the antimicrobial action of sodium benzoate on spoilage yeasts. Lett. Appl. Microbiol. 34:168-172. [DOI] [PubMed] [Google Scholar]
- 50.SCPD. 1998. The promoter database of Saccharomyces cerevisiae, Cold Spring Harbor Laboratory. [Online.]. http://cgsigma.cshl.org/jian/.
- 51.Seymour, I. J., and P. W. Piper. 1999. Stress induction of HSP30, the plasma membrane heat shock protein gene of Saccharomyces cerevisiae, appears not to use known stress-regulated transcription factors. Microbiology 145:231-239. [DOI] [PubMed] [Google Scholar]
- 52.Shahidi, F., J. K. V. Arachchi, and Y. J. Jeon. 1999. Food applications of chitin and chitosans. Trends Food Sci. Technol. 10:37-51. [Google Scholar]
- 53.Smits, G. J., H. van den Ende, and F. M. Klis. 2001. Differential regulation of cell wall biogenesis during growth and development in yeast. Microbiology 147:781-794. [DOI] [PubMed] [Google Scholar]
- 54.Thevissen, K., F. R. G. Terras, and W. F. Broekaert. 1999. Permeabilization of fungal membranes by plant defensins inhibits fungal growth. Appl. Environ. Microbiol. 65:5451-5458. [DOI] [PMC free article] [PubMed] [Google Scholar]
- 55.Thevissen, K., I. E. J. A. Francois, J. Y. Takemoto, K. K. A. Ferket, E. M. K. Meert, and B. P. A. Cammue. 2003. DmAMP1, an antifungal plant defensin from dahlia (Dahlia merckii), interacts with sphingolipids from Saccharomyces cerevisiae. FEMS Microbiol. Lett. 226:169-173. [DOI] [PubMed] [Google Scholar]
- 56.Thevissen, K., K. K. A. Ferket, I. E. J. A. Francois, and B. P. A. Cammue. 2003. Interactions of antifungal plant defensins with fungal membrane components. Peptides 24:1705-1712. [DOI] [PubMed] [Google Scholar]
- 57.Thevissen, K., D. C. Warnecke, I. E. Francois, M. Leipelt, E. Heinz, C. Ott, U. Zahringer, B. P. Thomma, K. K. Ferket, and B. P. Cammue. 2004. Defensins from insects and plants interact with fungal glucosylceramides. J. Biol. Chem. 279:3900-3905. [DOI] [PubMed] [Google Scholar]
- 58.Tomitori, H., K. Kashiwagi, T. Asakawa, Y. Kakinuma, A. J. Michael, and K. Igarashi. 2001. Multiple polyamine transport systems on the vacuolar membrane in yeast. Biochem. J. 353:681-688. [DOI] [PMC free article] [PubMed] [Google Scholar]
- 59.van der Rest, M. E., A. H. Kamminga, A. Nakano, Y. Anraku, B. Poolman, and W. N. Konings. 1995. The plasma membrane of Saccharomyces cerevisiae: structure, function and biogenesis. Microbiol. Rev. 59:304-322. [DOI] [PMC free article] [PubMed] [Google Scholar]
- 60.Watanabe, Y., K. Irie, and K. Matsumoto. 1995. Yeast RLM1 encodes a serum response factor-like protein that may function downstream of the Mpk1 (Slt2) mitogen-activated protein kinase pathway. Mol. Cell. Biol. 15:5740-5749. [DOI] [PMC free article] [PubMed] [Google Scholar]
- 61.Watanabe, Y., G. Takaesu, M. Hagiwara, K. Irie, and K. Matsumoto. 1997. Characterization of a serum response factor-like protein in Saccharomyces cerevisiae, Rlm1, which has transcriptional activity regulated by the Mpk1 (Slt2) mitogen-activated protein kinase pathway. Mol. Cell. Biol. 17:2615-2623. [DOI] [PMC free article] [PubMed] [Google Scholar]
- 62.Yang, F., X. Cui, and X. Yang. 2002. Interaction of low-molecular-weight chitosan with mimic membrane studied by electrochemical methods and surface plasmon resonance. Biophys. Chem. 99:99-106. [DOI] [PubMed] [Google Scholar]
- 63.Yoshimoto, H., K. Saltsman, A. P. Gasch, Hong Xia Li, N. Ogawa, D. Botstein, P. O. Brown, and M. S. Cyert. 2002. Genome-wide analysis of gene expression regulated by the calcineurin/ Crz1p signaling pathway in Saccharomyces cerevisiae. J. Biol. Chem. 277:31079-31088. [DOI] [PubMed] [Google Scholar]
- 64.Yphantis, D. A., Dainko, J. L., and F. Schlenk. 1967. Effect of some proteins on the yeast cell membrane. J. Bacteriol. 94:1509-1515. [DOI] [PMC free article] [PubMed] [Google Scholar]
- 65.Zahringer, H., M. Burgert, H. Holzer, and S. Nwaka. 1997. Neutral trehalase Nth1p of Saccharomyces cerevisiae encoded by the NTH1 gene is a multiple stress responsive protein. FEBS Lett. 412:615-620. [DOI] [PubMed] [Google Scholar]
- 66.Zhao, C., U. S. Jung, P. Garrett-Engele, T. Roe, M. S. Cyert, and D. E. Levin. 1998. Temperature-induced expression of yeast FKS2 is under the dual control of protein kinase C and calcineurin. Mol. Cell. Biol. 18:1013-1022. [DOI] [PMC free article] [PubMed] [Google Scholar]