

SUMMARY
Trans-differentiation from an adenocarcinoma to a small cell neuroendocrine state is associated with therapy resistance in multiple cancer types. To gain insight into the underlying molecular events of the trans-differentiation, we perform a multi-omics time course analysis of a pan-small cell neuroendocrine cancer model (termed PARCB), a forward genetic transformation using human prostate basal cells and identify a shared developmental, arc-like, and entropy-high trajectory among all transformation model replicates. Further mapping with single cell resolution reveals two distinct lineages defined by mutually exclusive expression of ASCL1 or ASCL2. Temporal regulation by groups of transcription factors across developmental stages reveals that cellular reprogramming precedes the induction of neuronal programs. TFAP4 and ASCL1/2 feedback are identified as potential regulators of ASCL1 and ASCL2 expression. Our study provides temporal transcriptional patterns and uncovers pan-tissue parallels between prostate and lung cancers, as well as connections to normal neuroendocrine cell states.
Keywords: Neuroendocrine, prostate, cancer, trans-differentiation, ASCL1, ASCL2, TFAP4, stem-like, small cell, lineage plasticity
Graphical Abstract

eTOC blurb
Chen et al. use temporal profiling of a small cell neuroendocrine prostate cancer model to inform anti-androgen therapy-induced trans-differentiation. An arc-like trajectory common to developmental biology is observed, and a bifurcation marked by ASCL1 and ASCL2, with parallels to SCLC. TFAP4 is identified as a common regulator of ASCL1 and ASCL2.
INTRODUCTION
Small cell neuroendocrine (SCN) cancer is an aggressive variant that arises from multiple tissues such as the lung and prostate 1,2. SCN is characterized by its histologically defined small cell morphology of densely packed cells with scant cytoplasm, poor differentiation, and aggressive tumor growth, as well as expression of canonical neuroendocrine markers including SYP, CHGA and NCAM1 3. In addition to their phenotypic resemblance, SCN cancers across multiple tissues show a striking transcriptional and epigenetic convergence in clinically annotated tumors 4,5. This molecular signature convergence is recapitulated by our established SCN transformation model that utilizes either normal lung epithelial cells, patient-derived benign prostate epithelial or bladder urothelial cells as the cells of origin 6,7.
Small cell neuroendocrine prostate cancer (SCNPC) occurs either de novo (<1% of untreated prostate cancer cases), or through therapy-mediated transversion of castration resistant prostate cancer (CRPC) (~20% of the resistance cases). The terminology SCNPC is canonical for the prostate cancer field, while the SCN terminology has been adopted to reflect the shared pan-tissue aspects of multiple SCN tumors, such as small cell lung cancer (SCLC). CRPC is a resistant variant of prostate adenocarcinoma (PRAD), which often responds to androgen deprivation therapy 8,9. Trans-differentiation from PRAD to the SCNPC state entails complicated epigenetic reprogramming at the chromatin level, resulting in transcriptional changes driven by a number of key master regulators 10,11. For example, methylation modulated by EZH2 and activation of transcriptional programs by SOX2 are required in TP53 and RB1 loss-mediated neuroendocrine differentiation in mouse transgenic models of SCNPC 12,13. Oncogenic mutation of FOXA1 potentiate pioneering activity and differentiation status of prostate cancer 14,15. Lastly, knockdown of transcription factors such as ONECUT2 has been shown to inhibit SCN differentiation 16,17. While the importance of these factors has been demonstrated, the chronological sequence of the associated epigenetic and transcriptional changes remains uncharacterized during the progression to SCNPC. Examination of the temporal evolution of lung cancer revealed a connection between transcription factor defined subtypes and cell plasticity 18,19. In our study, we sought to answer the following questions: 1) when do SCN-associated transcription factors emerge during SCNPC progression, 2) how do they coordinate SCN differentiation, and 3) can we identify a transition state defined by transcription factors that can be targeted?
Leveraging our previously developed human pan-small cell neuroendocrine cancer model, the PARCB forward genetics transformation model (driven by knockdown of RB1, alongside exogenous expression of dominant negative TP53, cMYC, BCL2 and myristoylated AKT1 via three lentiviral vectors) 6,7, tumor samples were harvested at different time points for multi-omics analyses. The transcriptional and epigenetic status of each time point was determined using integrative bulk RNA sequencing, ATAC sequencing, and single cell RNA sequencing. This longitudinal study provides insight into the temporal evolution of the epigenetic and transcriptional landscape during trans-differentiation and small cell cancer progression. We found consistent transcriptional patterns and differentiation trajectories across samples generated from independent patient tissues, as well as a bifurcation of end-stage neuroendocrine lineages, defined by ASCL1 and ASCL2 and their associated programs.
Achates-scute complex (AS-C) proteins are basic helix-loop-helix (bHLH) transcription factors, first identified in Drosophila Melanogaster 20. They are important in the development of peripheral nervous systems and sensory organs 21. Mammalian ASCL1 is a well-known neuroendocrine transcription factor in small cell cancers 22–24. Independently, ASCL2 is involved in embryonic development, colorectal stem cell biology and cancer 25–30. ASCL2 is largely understudied in SCNPC, mainly shown to be co-expressed with POU2F3 in non-neuroendocrine cell populations 5,31. Here, our study reveals temporal transcriptional patterns during small cell neuroendocrine differentiation in prostate cancer and associated lineage programs governed by general mutually exclusivity between ASCL1 and ASCL2. Follow-up analysis elucidated a transcriptional network circuity between ASCL1, ASCL2, and the transcription factor TFAP4 which was implicated by the trajectory data.
RESULTS
Temporal gene expression programs of the PARCB transformation model reveal SCNPC trans-differentiation pathways
To determine the timing of SCN differentiation events during prostate cancer development, we utilized the PARCB model system 6. Independent transformations were performed on basal cells extracted from benign regions of epithelial tissue from 10 prostate adenocarcinoma patients. Basal cells were transformed by the oncogenic lentiviral PARCB cocktail and subsequently cultured in an organoid system in vitro6. Transformed organoid-expanded cells from each patient tissue sample were subcutaneously implanted into multiple immunocompromised mice to allow for time-course collection of tumors from the matched starting material (Figure 1A). The tumors were collected at approximately two-week intervals until reaching 1 cm3 in size or occurrence of ulceration, whichever came first. The transformed tumor cells were triply fluorescent due to the lentiviral integration6, which allowed for cancer cell purification by fluorescence-activated cell sorting (FACS) followed by multi-omics sequencing and analysis (Figure 1A). Each patient series (P1-P10) contains five to six time point samples ranging from basal cells (TP1) to organoids (TP2) to tumors (TP3-TP5/TP6) (Figure 1A). Upon histological examination of the tumor issues by pathologists, we found that the time course tumors transitioned from squamous, to adenocarcinoma, then to mixed and eventually SCN phenotypes (Figure 1A and Figure S1A–C). Furthermore, clinically defined neuroendocrine markers, including SYP and NCAM1, emerge during the transition to late stages of the tumor progression (Figure 1A). The basal cell marker p63 were only positive in early-stage tumors by immunohistochemistry (IHC) staining (Figure S1D).
Figure 1. Temporal gene expression programs of the PARCB transformation model reveal SCNPC trans-differentiation pathways.

(A) Schematic summary of PARCB time course study and representative Hematoxylin and eosin (H&E) staining and immunohistochemistry (IHC) staining of neuroendocrine markers (SYP and NCAM1) on sequential tumors from the tissue microarray. Time point (TP1-6) samples were sequenced using bulk RNA sequencing (green circle), bulk ATAC-sequencing (red circle) and/or single cell RNA sequencing (blue circle, tumors only). (B) Projection of the PARCB time course samples onto the PCA framework defined by pan-cancer clinical tumor datasets 4,10,32–36. LUAD: Lung adenocarcinoma. LUAD norm: lung adenocarcinoma adjacent normal tissue. SCLC: small cell lung cancer. PRAD: prostate adenocarcinoma. PRAD norm: prostate adenocarcinoma adjacent normal tissue. CRPC: castration resistant prostate cancer. SCNPC: small cell neuroendocrine prostate cancer. (C) Arage gene expression of selected SCNPC-associated proteins and markers. (D) Heatmap of hierarchical clusters (HC) of samples (columns) and corresponding differentially upregulated gene modules (rows). Differential expression defined by one HC vs all other HCs). (E) PCA of the PARCB time course samples and trans-differentiation trajectories including primary arc and secondary bifurcation. A 3-dimensional rotatable version of this figure is available on the PARCB Multi-omics Explorer website. [For review, a 3D rotatable version is included as Data S1.] (F) Selected enriched GO terms across HC. See also Figure S1.
We first performed a temporal analysis of gene expression using bulk RNA sequencing to understand the changes in the transcriptional landscape during SCNPC trans-differentiation. By projection of PARCB samples onto principal component analysis (PCA) of clinical lung and prostate cancer tumor samples4,10,32–36, we validated that PARCB time course samples follow the transcriptionally defined convergence trajectory from adenocarcinoma to SCN states (Figure 1B and Figure S1E). Additional SCNPC associated factors including ASCL1 and NEUROD1 were also elevated during the progression (Figure 1C). The mRNA of androgen receptor (AR) was expressed in tumors at the early stage (Figure 1C), but the protein level was not detectable by immunostaining (Figure S1D). Taken together, the histological and omics data indicate that PARCB time course tumors recapitulate both the phenotypic and transcriptional changes observed in the clinic and provide a model system for studying the temporal evolution of SCNPC development.
To determine the transformation trajectories among the time course series generated from the 10 independent patient samples (P1-P10), we performed clustering and PCA of the transcriptomic data. To account for potential asynchronous development among each patient series and each individual tumor, we defined hierarchical clusters (HCs) of samples by their corresponding differential gene modules and found the resulting 6 clusters (HC1-6) to generally correspond with the time of collection (Figure 1D and Table S1A). This provides a clustering-based trans-differentiation reference frame and informs our subsequent multi-omics analyses. Unsupervised PCA demonstrates that the individual transformation paths of each series follow a generally consistent “arc-like” trajectory with a discernable bifurcation in late-stage samples (Figure 1E, Figure S1E–F and Table S1B). The late tumors were hence further defined as “Class I” and “Class II” tumors with correspondent HC5 and HC6 gene modules, respectively. HC2 to HC6 had elevated SCNPC signature scores compared to adenocarcinoma signature score (Figure S1G). This last finding supports the existence of two transcriptional programs or end points defining the terminal SCNPC tumor phenotypes.
Gene ontology enrichment analysis of the corresponding 6 differential gene modules identified biological processes enriched uniquely or shared among HCs, including Inflammatory response (HC1 and HC3, patient derived basal cells and early tumors, respectively), cell proliferation (HC2, in vitro organoids), epidermis development (HC3, early tumors), cell activation (HC4, transitional tumors), stem cell differentiation (HC5, Class I late tumors) and neuro-/chemical synapse (HC5 and HC6, both classes of late tumors) (Figure 1E and Table S1C). The transcriptome evolution supports the idea that trans-differentiation from adenocarcinoma to the SCN state is a systematically coordinated process, that involves a transitional stage followed by bifurcated pathways enriched in neuronal/neuroendocrine gene signatures.
Sequential transcription regulators modulate reprogramming and neuroendocrine programs through a highly entropic and accessible chromatin state
Temporal analyses on single transcription factor defined subtypes of small cell lung cancer (SCLC) models have delineated lineage plasticity in the development of lung neuroendocrine tumors 18. We sought to define the transcriptional evolution in SCNPC through an extensive survey of over 1600 transcription factors 37 by chromatin accessibility analyses using ATAC sequencing 38. A significant increase in overall accessible chromatin peaks across chromosomes is observed starting at the tumors at transitional stage (HC4) to late stages (HC5 and HC6) (Figure 2A). Unsupervised PCA using ATAC-sequencing data showed an arc-like and bifurcated trajectory consistent with the pattern observed using the RNA-sequencing data (Figure 1D and 2B). The Shannon entropy has been used to estimate the plasticity potential of a biological sample to change cellular state 39,40. We found that transitional samples (HC4) have the highest entropy (Figure 2B), suggesting there exists a high potential and less well-defined transcriptional state during the trans-differentiation process.
Figure 2. Sequential transcription regulators modulate reprogramming and neuroendocrine programs through a highly entropic and accessible chromatin state.

(A) Overall differential chromatin accessibility across HC. (B) PCA of chromatin accessibility of PARCB time course samples with entropy analysis using ATAC sequencing. (C) Overall mean accessible peaks near TSS of each HC in PARCB time course study. (D) Enriched motifs from suites of transcription factors in each HC using ATAC-sequencing. Top 5 motif suites for each comparison are shown, with additional analysis in Figure S2B, and full results in Table S1D. (E) Top ranked transcription factors and known neuroendocrine transcription factors across PARCB time course using bulk RNA sequencing. HOXC TFs avg: Average expression of HOXC4, HOXC5, HOXC6, HOXC8, HOXC9, HOXC10, HOXC11, HOXC12 and HOXC13. (F) Expression of ASCL1, ASCL2, NEURDO1 and POU2F3 in each HC. See also Figure S2.
To identify transcription factors that recognize the chromatin accessible regions at each stage of the transformation trajectory, we first looked at the overall accessibility near the transcription start sites (TSS) (Figure 2C). Transitional samples (HC4) have a strong increase in the accessible peaks as estimated by Shannon entropy calculations (Figure 2B and 2C), consistent with the gene-expression-based entropy calculations (Figure S2A). Next, motif enrichment analysis was performed on the accessible peaks from each HCs in a “one versus the rest” fashion. Since transcription factors from the same family share similar motifs and are deposited into a variety of databases, we used a pipeline that applies an ensemble of existing computational tools and suites of motifs (de novo and known) 41 (Figure 2D and Table S1D). Motif enrichment analysis implicated that 1) representative stress-responsive factors such as NFkB, JUN, ATF and STAT proteins were active from early to transition stage (HC1-4), 2) reprogramming factors such as POU/OCT and SOX families were active in Class I (HC5) tumors, and 3) neuronal/neural factors including ASCL and NEUROD family proteins were found at the later stage in Class II (HC6) tumors (Figure 2D). Due to ASCL1, ASCL2 and other bHLH factors sharing the same E-box motif, and the stringent “one HC versus the rest” differential accessibility analysis, the motif suite containing ASCL1 and ASCL2 factors is highly enriched and ranked in HC6 compared to HC5 (Figure 2D). Nonetheless, when HC6 is left out of the analysis, HC5 does demonstrate strong enrichment for the motif suite containing ASCL1 and ASCL2 factors, compared to HC1-4. (Figure S2B). The enrichment of stem-like and neuroendocrine programs in HC4-5 and HC6, respectively, was further confirmed by signature scores derived from the literature 33,42 (Figure S2C). This analysis provides a view of the overall transcriptional shift of the chromatin accessibility during trans-differentiation.
To determine whether expression of the transcription factors corresponds to their inferred activity from the motif enrichment analysis, we summarized the top ranked transcription factors (based on PC1, PC2 and PC3 loadings) across the transformation stages (HC1-HC6) (Figure 2E and Figure S2D, Table S1E) from the perspective of the PCA-based transformation trajectory (Figure 1E and Figure S1F). Overall, we observed that 1) AR mRNA expression is lost during progression towards late-stage tumors, 2) FOXA1, a known transcription factor of SCNPC 14,15, is shown to emerge at the early-transition stage, and 3) well-known neuroendocrine transcription factors such as ASCL1, NEUROD1, ONECUT2, SOX2, INSM1 and FOXA2 were increased towards the late stage (Figure 2E and Figure S2D)43–45. This analysis also revealed additional candidate stage-specific transcription factors that are largely understudied in SCNPC, such as LTF, ESR1, ZIC2 and TBX10 (Figure 2E). ASCL1 and ASCL2 expression were elevated in the late tumor stages (Figure 1C and Figure 2E–F). Notably, their expression was enriched in separate tumor endpoints (HC5: ASCL2+ and HC6: ASCL1+), supporting their probable contribution to the bifurcated trajectories (Figure 2E–F and Figure S2D).
Transcription factor-defined cell populations contribute to lineage divergence and tumor heterogeneity
To determine the degree of heterogeneity within the time course tumors, we performed single cell RNA sequencing on four time-defined serial tumor sets: P2, P5, P7 and P8 (TP3-TP6) (Figure 3A). Dimension reduction analysis (Uniform Manifold Approximation and Projection, UMAP) was used to visualize the overall distribution of cell populations at each time point of SCNPC development (Figure 3A–B and Figure S3A). Overall, a lineage differentiation from basal (KRT5+) to luminal (KRT18+) was observed from early to late tumors (Figure 3B–C). YAP1, whose expression defines a non-neuroendocrine SCLC subtype 46 and whose high expression is frequently seen in CRPC-PRAD but not SCNPC 47, is enriched in the early tumor cell populations (Figure 3B–C).
Figure 3. Transcription factor-defined cell populations contribute to lineage divergence and tumor heterogeneity.

(A) Dimension reduction UMAP analysis of four patient series (P2, P5, P6 and P7) over time (TP3-6) using single cell RNA sequencing. (B) Temporal UMAP analysis of all the samples. (C) Expression of selected markers and transcription factors. KRT5 marks basal cells. KRT15 marks luminal cells. The expression is presented in log normalized counts. (D) Top enriched inferred cell types from the Human Cell Type Database using SingleR 48. (E) Projection of single cell RNA-sequencing samples on PCA framework by bulk RNA-sequencing samples (top panel) and the expression of selected markers and transcription factors (bottom panel). Each data point is a single cell colored by their corresponding HC. (F) Expression of ASCL1 (top) and ASCL2 (middle) and percentage of ASCL1/2 positive cells (cells with expression value >0) (bottom) in human biopsy and GEMM model tumors from five single cell RNA-sequencing datasets 31,49–51. Other: prostatic intraepithelial neoplasia. NMYC_RB_M: Ptenf/f; Rb1f/f;MYCN + (PRN) and RB_M: Ptenf/f; Rb1f/f (PR) mouse model in Brady et al31. See also Figure S3.
To understand the association of known SCN transcription factors in contributing to intra-tumoral heterogeneity, we first assigned a SCNPC score 33 to each cell (Figure S3B). Despite the high SCNPC scores across populations of single cells, the number of NEUROD1 and/or ONECUT2 positive cells is very low, while deeper single cell sequencing depth would be required to fully investigate this result (Figure 3C and Figure S3B). Other well-known neuroendocrine transcription factors such as ASCL1, INSM1 and FOXA2 are enriched in the same cell cluster with high SCNPC score (Figure 3C and Figure S3B). However, in another cell cluster, ASCL2, POU2F3 and SOX9 were co-expressed with a medium level of SCNPC score (Figure 3C and Figure S3B). The general mutual exclusivity of ASCL1 and ASCL2 in single cells further supports ASCL1 and ASCL2 contributing to the bifurcated endpoint trajectories observed in the bulk tumors (Figure 3C and Figure S3C–D).
Single cell datasets available as reference from longitudinal clinical samples in advanced prostate cancer are rare, thus a cell type inference analysis using reference pure cell types was applied to infer the identity of individual cells in PARCB tumors 48. Five out of a total of 36 reference cell types from the Human Primary Cell Database were highly enriched in the PARCB time course tumor samples (Figure 3D). All tumor cells share a similar transcriptome as epithelial cells (Figure 3D). Particularly, a majority of tumor cells (other than early stage cells) exhibit stem-like gene expression patterns reflective of embryonic stem cells and induced pluripotent stem cells, indicative of a de-differentiation shift during SCNPC development and trans-differentiation (Figure 3D). Additionally, later-stage cells expressing either ASCL1 or ASCL2 had neuronal-like gene expression profiles, confirming the emergence of SCN differentiation (Figure 3B–D).
Single cell analysis supports the overall gene expression and chromatin accessibility patterns observed in bulk tumors. Projection of single cells onto the PCA framework generated from bulk RNA-sequencing samples (Figure 1E and Figure S1F) demonstrated that tumors clustering distinctly by bulk RNA-sequencing indeed consist primarily of single cells in the corresponding different transcriptional states, with some degree of heterogeneity (Figure 3E). Furthermore, transcription factors with high expression in tumors defined by bulk RNA-sequencing analysis (Figure 2E) show heterogenous patterns among single cells (Figure S3E). Tumors at transitional stage (HC4) and late stage (HC5) have the highest degree of gene fluctuation, further highlighting a potential role for increased intratumoral heterogeneity during the trans-differentiation process (Figure S3E). Importantly, we further validated the mutually exclusive expression pattern of ASCL1 and ASCL2 in multiple clinical and GEMM single cell RNA-sequencing datasets31,49–51. This analysis confirmed that ASCL2 is generally enriched in non-NE cells/adenocarcinoma and ASCL1 is more abundant in high NE cells/SCNPC clinically (Figure 3F), consistent with the PARCB temporal study (Figure S3F). ASCL1 and ASCL2 double-positive cells are observed at a low frequency, primarily in SCNPC tumors, and may reflect a transitional state between adenocarcinoma and SCN phenotypes (Figure 3F).
ASCL1 and ASCL2 specify independent transcriptional programs and sub-lineages in SCNPC
Given that ASCL1 and ASCL2 expression levels are mutually exclusive in single cells, we asked whether ASCL1 and ASCL2 represent separate cellular sub-lineages by inferred clonal tracing analyses52. With KRT5 (basal marker) set as the beginning of the tracing, the inferred tracing results in three primary lineage branches/states (Figure 4A). As hypothesized, single cells expressing either ASCL1 or ASCL2 are enriched in different lineage branches (Figure 4A–B). This result is further supported by a different analytic tool (RNA velocity) that measures the temporal ratio of un-spliced to spliced mRNAs to infer lineage trajectory 53 (Figure S4A). The inferred clonal tracing results complemented the real-time-based analysis visualized as the total composition of ASCL1- or ASCL2-positive, double positive and negative populations over time (Figure 4C), supporting that ASCL1 and ASCL2 are associated with independent sub-lineages. Double-positive cells are very infrequent in the PARCB temporal tumors. The double-positive population observed in the P2-TP5 tumor may capture the cells undergoing the transitional state (Figure 4C), and the overall low double-positive frequency is consistent with the clinical results above (Figure 3F).
Figure 4. ASCL1 and ASCL2 specify independent transcriptional programs and sub-lineages in SCNPC.
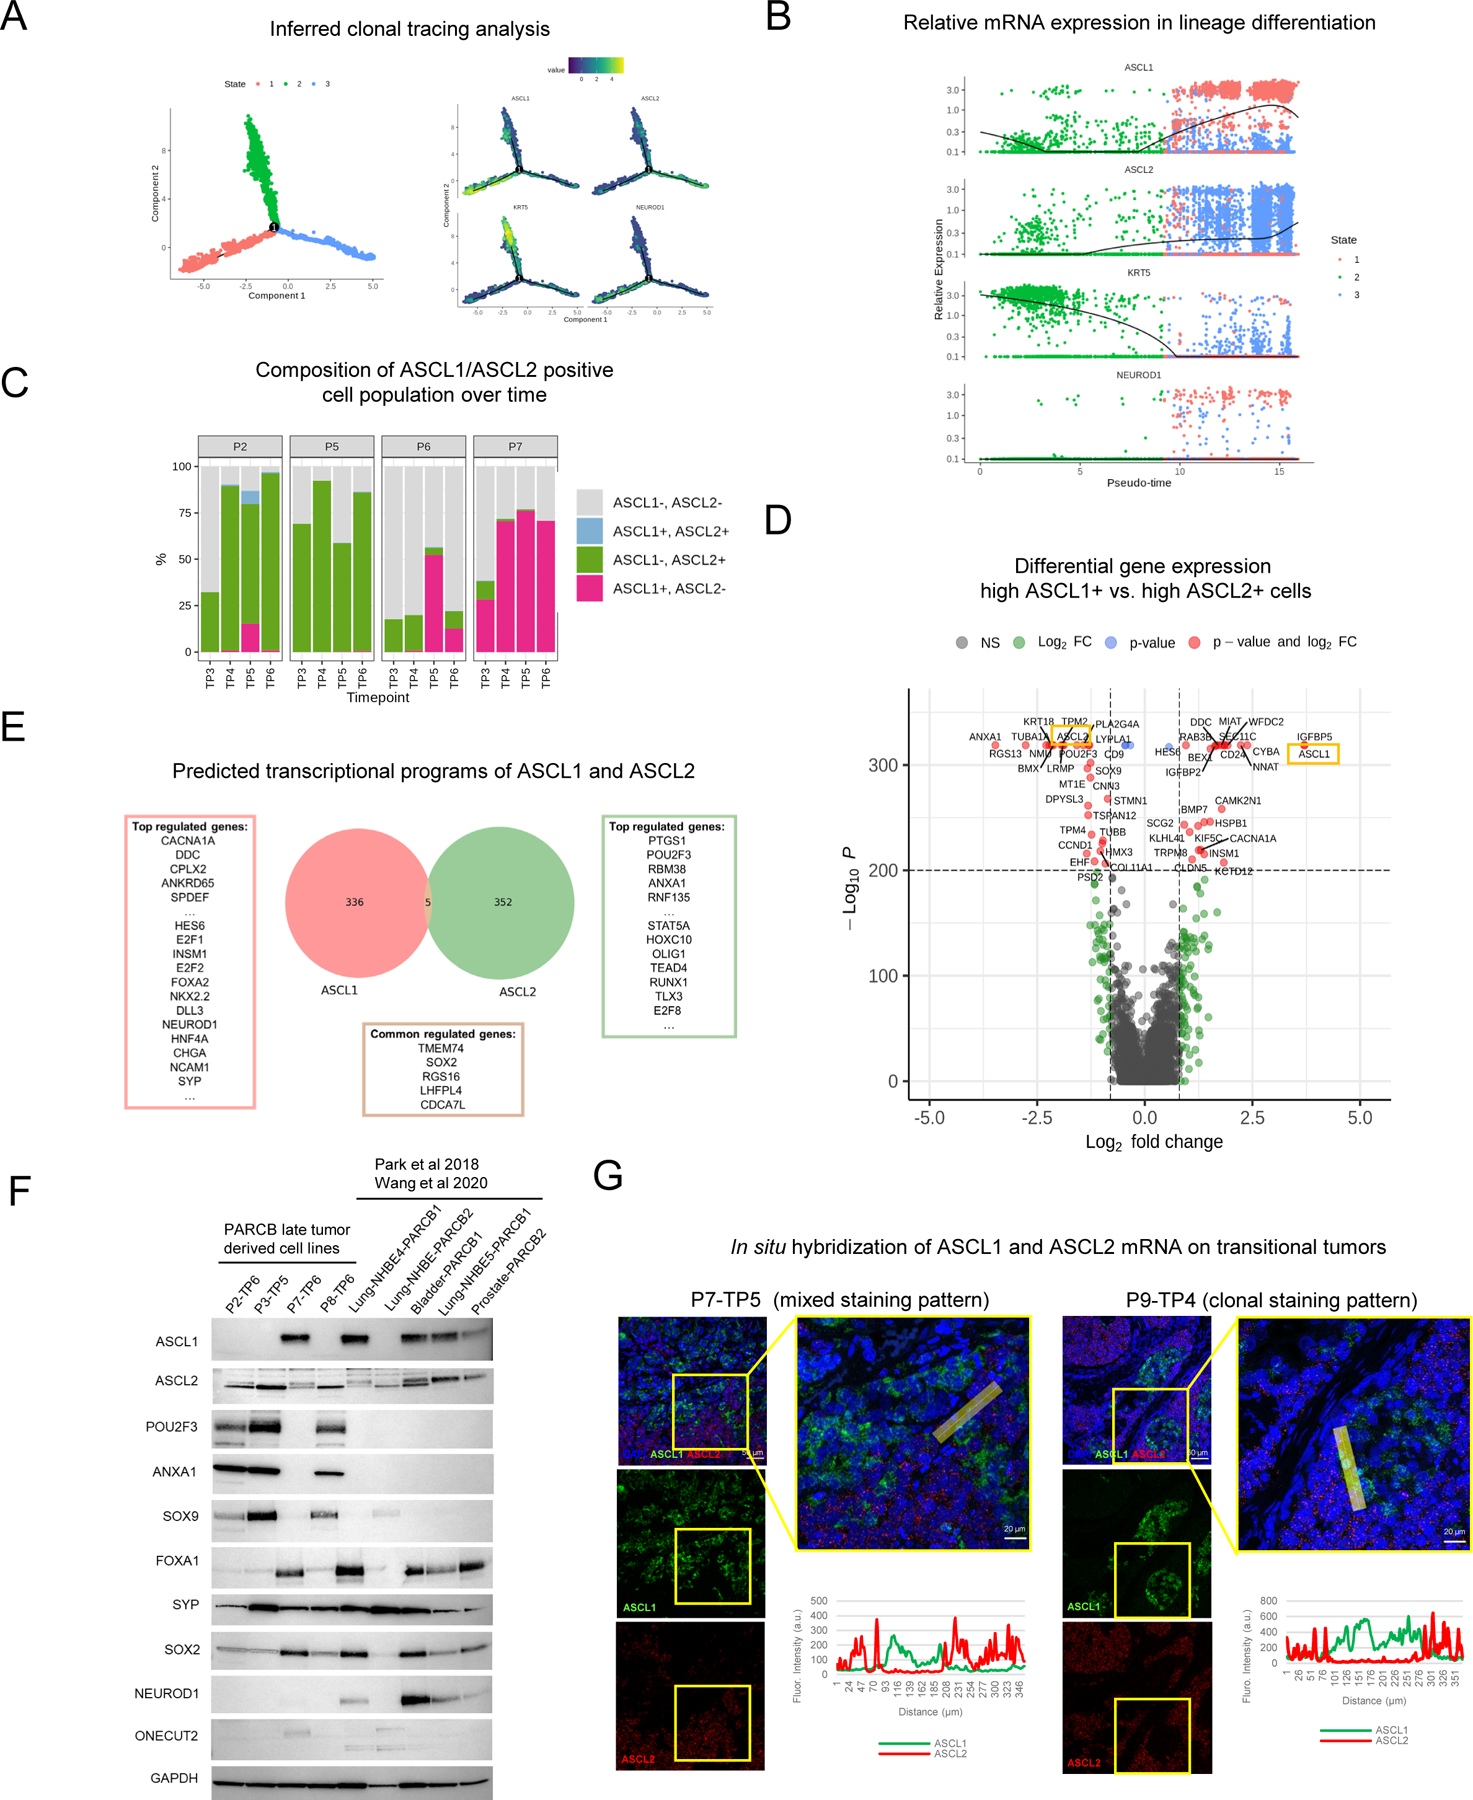
(A) Inferred clonal tracing analysis of the PARCB time course samples using Monocle 2 52. (B) Relative expression of KRT5, ASCL1 and ASCL2 in the inferred clonal tracing analysis (pseudo-time). (C) Percentages of ASCL1 or ASCL2 positive, double positive and double negative cell populations over time. (D) Volcano plot of differential gene expression in high ASCL1+ vs high ASCL2+ cell populations. (E) Representative genes from the predicted transcriptional programs of ASCL1 and ASCL2 trained on data from patient and model prostate cancer tumors (6,10,33 including TCGA), as determined by the ARACNE algorithm 81. (F) Western blot of panel of genes in the PARCB tumor derived cell lines from different tissue of origin (prostate, bladder and lung) 6,7. (G) Representative images of in situ hybridization of ASCL1 and ASCL2 mRNA analysis on transitional tumors (P7-TP5 and P9-TP4). See also Figure S4.
To further characterize the transcriptional difference between cells expressing a high level of ASCL1 or ASCL2, we analyzed their differential gene expression profiles (Figure 4D and Table S1F). Genes that are involved in synaptic and neuroendocrine regulation such as DDC, CACNA1A and INSM1 are enriched in ASCL1+ cells. ASCL2+ cells express genes with stem-like characteristics such as SOX9 and POU2F3 (Figure 4D). SOX9 is directly regulated by ASCL2 in intestinal stem cells 29, suggesting a possible contribution to stem-like properties in SCNPC trans-differentiation. Upon further investigation, we observed that genes implicated in the intestinal stem cell program such as EPBH3 and TNFRSF9 29 are positively correlated with ASCL2, but not ASCL1 (Figure S4B). In contrast, a well-known intestinal stem cell marker, LGR5 54, has no correlation with either ASCL1 or ASCL2, consistent with it having a more tissue specific intestinal role (Figure S4B).
To identify the transcriptional programs that are associated with either ASCL1 or ASCL2 in prostate cancer, we constructed an inferred network 55 using multiple bulk RNA sequencing prostate cancer and model datasets including The Cancer Genome Atlas (TCGA), additional patient tumor (Beltran), and SCNPC model (Park) datasets 6,33. The analysis identified 336 and 352 genes regulated independently by ASCL1 or ASCL2 (Figure 4E and Table S1G). Strikingly, there are only 5 genes from the inference analysis that are regulated by both factors: TMEM74, RGS16, LHFPL4, CDCA7L and SOX2 (Figure 4E). This result is consistent with the demonstrated role of SOX2 in regulating neuroendocrine differentiation in null TP53 and RB1 backgrounds 13, hence showing that SOX2 is involved in both ASCL1 and ASCL2 associated neuroendocrine sub-lineages. Genes that are regulated by ASCL1 are enriched in neuroendocrine differentiation markers and factors such as SYP, CHGA, NCAM1, and NEUROD1 (Figure 4E). ASCL2 is associated with genes including PTGS1/COX1, POU2F3, ANXA1 which are generally immune and stress responsive, and stem-like (Figure 4D–E). We further confirmed that PARCB tumor-derived cell lines from different tissues of origin (prostate, bladder, and lung) all have only one or the other gene expression patterns associated with either ASCL1 or ASCL2 expression (Figure 4F and Figure S4C). We next validated the predicted transcriptional programs of ASCL1 and ASCL2 by exogenously expressing either ASCL1 or ASCL2 in ASCL2+ or ASCL1+ cell lines, respectively. ASCL1 exogenous expression in ASCL2+ cells, increased the ASCL1 transcriptional program as indicated by increased signature score (Figure S4D). However, ASCL2 exogenous expression in ASCL1+ cells, did not have notable effect, suggesting that the ASCL1 endpoint state has higher stability (Figure S4D).
In situ hybridization of ASCL1 and ASCL2 mRNA in the transitional PARCB tumor samples further confirmed the mutually exclusive expression pattern (Figure 4G). The staining patterns demonstrated both ASCL1 and ASCL2 mixed populations (left, Figure 4G), as well as patch regions potentially resulting from local clonal expansion (right, Figure 4G) of ASCL1+ or ASCL2+ cells. Our combined results support that ASCL1 and ASCL2 define independent cellular sub-lineages and transcriptional programs with stem-like and neuroendocrine enrichment in SCNPC.
ASCL1 and ASCL2 as pan-cancer classifiers
Clinical subtypes are fairly well-defined in SCLC 46,56, but molecular subtyping remains an evolving challenge in SCNPC 8. By performing projection analysis of our samples onto a gene expression or chromatin accessibility PCA framework defined by the Tang et al. dataset of patient metastatic CRPC phenotypes57, we found that PARCB temporal samples share similar transcriptome and epigenome signatures, including a shared stem-cell like (SCL) group and a shared NEPC group (Figure 5A).
Figure 5. ASCL1 and ASCL2 as pan-cancer classifiers.

See also Figure S5. (A) Projection of the PARCB time course samples on the PCA framework defined by the CRPC subtypes using RNA sequencing (left) and ATAC-sequencing (right) 57. SCL: stem-cell like. NEPC: Neuroendocrine prostate cancer. 3-dimensional rotatable versions of these figures are available on the PARCB Multi-omics Explorer website. [For review, 3D rotatable versions are included as Data S2 and Data S3.] (B) Projection of the PARCB time course samples on the PCA framework defined by the SCLC subtypes 32,46. (C) mRNA expression of ASCL1 and ASCL2 in the PARCB time course samples and multiple sets of clinical CRPC-PRAD and SCNPC samples including TCGA and different research groups 10,33–36. (D) Representative images of in situ RNA hybridization of ASCL1 and ASCL2 in clinical SCNPC tissues. (E) mRNA expression of ASCL1 and ASCL2 in pan cancer cell lines (CCLE). (F) mRNA expression of ASCL1 and ASCL2 in pan cancer tumors from TCGA.
Given the high degrees of similarity in transcriptional profiles of SCLC and SCNPC 4, we compared our HC classification of the PARCB time course samples to the SCLC clinical subtypes: ASCL1 (A), NEUROD1 (N), POU2F3 (P) and YAP1 (Y) (Figure 5B) 32,46. The class I/ASCL2+ (HC5) tumor group shares transcriptome similarity with SCLC-P (Figure 5B), which is consistent with the co-expression pattern of ASCL2 and POU2F3 observed in multiple analyses (Figure 3C and 4D). Likewise, and concordant, the Class II/ASCL1+ (HC6) tumor group is transcriptionally aligned to SCLC-A (Figure 5B).
To investigate whether the ASCL1 and ASCL2 sub-classes from PARCB temporal study recapitulate patterns observed in clinical samples of prostate cancer, we compared ASCL1 and ASCL2 expression in PARCB temporal samples versus numerous clinical profiling datasets10,33–36. The results demonstrate that the expression levels of ASCL1 and ASCL2 are comparable between the PARCB model and clinical samples, and the transcriptional patterns of HC1 to HC6 generally corresponded with the transition from PRAD/CRPC-PRAD to SCNPC (Figure 5C). We further confirmed the general mutual exclusivity and low double positivity of ASCL1/2 expression using an RNA in situ hybridization assay on both CRPC-PRAD and SCNPC clinical samples and CRPC PDX models (Figure 5D and Figure S5A–B).
By comparing the expression levels of ASCL1 and ASCL2 across a broad panel of pan-cancer cell lines, we found that almost all cancers, apart from lung cancers, can be divided into three categories (i) demonstrating expression of ASCL1 (neuroblastoma), (ii) of ASCL2 (colorectal and breast cancers), and (iii) double negative (other cancers) (Figure 5E). Only SCLC and other lung cancer cell lines have mixed levels of ASCL1 and ASCL2. Combined with our results, this suggests a potential role for ASCL2 and POU2F3 in specifying intermediate, and/or heterogenous states in (small cell) lung cancer (Figure 5E). Protein expression analysis in lung squamous carcinoma (NCI-H1385), SCLC-A (NCI-H1385, NCI-H146 and DMS79), SCLC-P (NCI-H526 and COR-L311) and SCNPC (NCI-H660) cell lines further highlighted a mutually exclusive pattern of ASCL1 and ASCL2 (Figure S5C). SCLC-N (NCI-H1694) is double negative for ASCL1 and ASCL2 and positive for NEUROD1 as expected (Figure S5C). Last but not the least, in patient tumor pan-cancer data, the exclusive expression of either ASCL1 or ASCL2 is again observed, highlighting that binary distinctions defined by ASCL1 and ASCL2 occur across multiple tissue types (Figure 5F). In sum, an inverse and generally mutually exclusive relationship between ASCL1 and ASCL2 is observed in multiple and pan-cancer contexts, and mutual exclusivity is strongly observed at the single cell level.
Alternating ASCL1 and ASCL2 expression through reciprocal interaction and TFAP4 epigenetic regulation
With the evidence that ASCL1 or ASCL2 expression levels are mutually exclusive in single cells during SCNPC trans-differentiation, we explored two hypotheses: 1) These two factors mutually regulate each other’s expression, or 2) they share a common upstream transcription factor that alternates their transcription through regulated differential binding to respective gene regulatory elements. To test the first hypothesis, we expressed V5-tagged ASCL2 in multiple PARCB tumor derived cell lines (lung and prostate) and observed that ASCL1 protein expression was significantly suppressed in these cells (Figure 6A). In contrast, expression of V5-tagged ASCL1 increased ASCL2 expressions both at protein and mRNA levels (Figure 6A and Figure S6A). Thus in our model cells, ASCL1 and ASCL2 mutually regulate each other at the protein level, but each in the opposite manner.
Figure 6. Alternating ASCL1 and ASCL2 expression through reciprocal interaction and TFAP4 epigenetic regulation.

See also Figure S6. (A) Western blot analysis of exogenously expressing either V5 tagged ASCL2 in ASCL1+ cell lines 6 (left) or V5-tagged ASCL1 in ASCL2+ cell lines (right). (B) Schematic of putative cis regulatory elements (CREs) of ASCL1 and ASCL2 (top) and the heatmap of open chromatin accessibility across CREs of ASCL1 and ASCL2 using the PARCB time course ATAC-sequencing (bottom). Red box: CREs containing predicted TFAP4 binding sites by HOMER motif enrichment analysis 58. (C) Top 8 ranked transcription factor motifs in ASCL1 promoter and ASCL2 enhancer regions, ranked by p-values. (D) Western blot analysis of doxycycline-inducible knockout of TFAP4 and proteins of interest in P7-TP6 (ASCL1+) and P3-TP5 (ASCL2+) cell lines. DOX: doxycycline. (E) Cell proliferation analysis of P7-TP6 (ASCL1+) and P3-TP5 (ASCL2+) cell lines with doxycycline-inducible knockout of TFAP4. Ctrl: no addition of doxycycline. TFAP4: with addition of doxycycline. (G) Schematic summary of the PARCB time course study.
To test the second hypothesis of a common regulator, known promoter and enhancer regions of ASCL1 and ASCL2 were first annotated in the PARCB time course ATAC-sequencing data (Figure 6B). An opposing pattern of open and closed chromatin formation is found on both the ASCL1 promoter and the ASCL2 enhancer regions (Figure 6B). A rank list of transcription factors that have matching motifs in the regions was generated to determine potential shared regulators 58 (Figure 6C and Table S1H). An extensive literature search of all the factors whose motifs were found in both ASCL1 and ASCL2 regulatory regions revealed that TFAP4 was reported to form different transcription complex to either activate or repress target genes, including facilitating epithelial-to-mesenchymal transition in colorectal cancer and repressing neuronal programs in non-neuronal cells 59,60. The TFAP4 motif was shared in both the ASCL1 promoter (ranked 2nd) and the ASCL2 enhancer region (ranked 6th) in the top 8 list of shared transcription factor motifs (Figure 6C), and is expressed across all the SCLC, SCNPC and PARCB tumor derived cell lines tested (Figure S5C and S6B). Interestingly, NCI-H1385, a lung squamous carcinoma (non-small cell) cell line, has lower TFAP4 expression compared to other small cell neuroendocrine cell lines (Figure S5C).
The direct differential binding of TFAP4 to the ASCL1 promoter and the ASCL2 enhancer region was confirmed by the CUT&RUN technique 61, a chromatin immunoprecipitation experiment using TFAP4 antibody in both ASCL1+ and ASCL2+ PARCB tumor derived cell lines. Despite cell lines having various degrees of TFAP4 binding signals due to potential mixed cell clones within the cell lines, TFAP4 was found to have higher binding affinity near the ASCL1 promoter in ASCL1+ cell lines (P7-TP6) than ASCL2+ cell lines (P2-TP6 and T3-TP5) (Figure S6C). In contrast, TFAP4 consistently bound to ASCL2 enhancer regions in ASCL2+ cell lines compared to ASCL1+ cell line (Figure S6C). This result supports that TFAP4 potentially regulates transcription of ASCL1 and ASCL2 in a context-specific manner.
To determine whether TFAP4 directly regulates the expression of ASCL1 and ASCL2, we introduced a doxycycline-inducible CRISPR sgRNA targeting TFAP4 in multiple ASCL1+ and ASCL2+ cell lines, including PARCB tumor-derived cell lines and the patient-derived cell line NCI-H660. Both ASCL1 and ASCL2 expression decreased, with various strength, after TFAP4 knockout was induced by the addition of doxycycline in the respective cell lines (Figure 6F and Figure S6D). However, other lineage associated proteins did not change (Figure 6F and Figure S6D). Cell growth assays showed a mild decrease in P7-TP6 (ASCL1+) cell growth, and in contrast a drastic increase in P3-TP5 (ASCL2+) growth upon the knockout of TFAP4 (Figure 6E). To explore the clinical relevance of TFAP4 in cancer and SCNPC, we surveyed the expression of TFAP4 across subtypes of cancers compared to normal tissue. There is a substantial increase in TFAP4 expression in small cell cancers compared to adenocarcinoma, and compared to normal tissue, in both prostate and lung cancer indications (Figure 6F), as well as in pan cancer tumors (TCGA) vs. normal tissue (GTEx) (Figure S6E).
Thus in our transcriptional regulatory circuit studies, we found a reciprocal, non-symmetric regulatory relationship between ASCL1 and ASCL2; and that within this circuit, ASCL1 and ASCL2 have a shared positive regulatory factor, TFAP4. In the sum of our studies, the PARCB model provided a blueprint of SCNPC trans-differentiation as specified by temporal transcription factors (Figure 6G). In particular, ASCL1 and ASCL2 define distinct bifurcated sub-lineage trans-differentiation trajectories in small cell cancers, and binary transcriptional profiles in a pan-cancer context.
DISCUSSION
SCNPC has a rare de novo presentation, however, trans-differentiation from prostate adenocarcinoma to SCN cancer is a frequent adverse consequence of cancer cells acquiring resistance to therapeutics repressing AR signaling 8,9. In a pan-cancer context, therapy-induced trans-differentiation from adenocarcinoma to SCN cancer is a growing clinical challenge in lung cancer with the expansion of effective targeted therapies, such as EGFR, ALK, BRAF, KRAS inhibitors 62. Genetically engineered mouse models of SCNPC and SCLC have been generated to provide insight into the tumorigenesis of SCN cancers 12,18,31,43,63,64, with some models demonstrating evidence of the adenocarcinoma to SCN cancer transition 13,31,65,66. Patient tumor-derived organoids and circulating tumor cells have also provided models for monitoring differentiation state transitions 50,67, including reversion to non-SCN states via specific signaling inhibition 50. Our PARCB froward genetics in vivo temporal transformation model further adds to these resources by being human cell-based, recapitulating the adenocarcinoma to SCN phenotype trans-differentiation at both the histological and molecular signature levels, and providing the temporal resolution to reveal an arc-like plasticity trajectory and associated stem cell-like (reprogrammed) intermediate states. A limitation of the PARCB model is that inhibition of the AR axis is not an initiating component of the trans-differentiation process.
Such an arc-like trajectory is commonly observed in unbiased profiling of development and differentiation processes, including in cancer contexts 39,68–74. The pattern is reminiscent of temporal regulation in development, with the differentiation transition stage promoted by temporally regulated epigenetic and transcriptomic plasticity programs 75–77.
The transcription profiles of the transition stage from adenocarcinoma to SCNPC provide evidence for an initial de-differentiation or reprogramming step when cells enter the trans-differentiation process, with enrichment of stem cell and iPSC programs. Furthermore, we find samples in the transitional state have a higher degree of entropy at both the epigenetic and gene expression level. Our findings are in concordance with a recent study in an adenocarcinoma lung cancer mouse model where a highly plastic intermediate state was seen as cells transitioned from lung hyperplasia to adenocarcinoma 19, and with past observations of increased entropy proceeding differentiation processes 39. Together these findings support the idea that de-differentiation, and epigenetic loosening and/or cellular heterogeneity are prerequisites for further lineage trans-differentiation during cancer evolution.
At the end-stages, the trans-differentiation trajectory demonstrates a bifurcation, resulting in two neuroendocrine states, one characterized by ASCL2 and POU2F3 expression (Class I tumors), the other by ASCL1 expression (class II tumors). Throughout the trans-differentiation trajectory, individual cells demonstrate mutually exclusive expression of either ASCL1 or ASCL2, with emergence of ASCL2 generally earlier and more prominent than ASCL1. Thus, the ASCL2 state and double positive state may reflect a semi-stable and transitional state. The molecular switch from ASCL2 to ASCL1 demonstrates the dynamic transcriptional control in SCNPC. An analogous temporal shift from FOXA1 to FOXA2 orchestrated transcriptional programs was observed in an independent SCNPC temporal GEMM model 43, and the FOXA1 to FOXA2 transition is reflected in the PARCB model (Figure S2D).
SCLC tumor subtypes are canonically defined by the predominant expression of one of four master regulators (ASCL1, NEUROD1, POU2F3, and YAP1) 46, and tumors expressing ASCL1 have been reported in therapy induced SCNPC 5,51. Nevertheless, single cell data from mouse models of SCNPC have identified both a distinct cell subpopulation with co-expression and open chromatin accessibility of ASCL2 and POU2F3 motifs 31, and a POU2F3 expression-dominant cell subpopulation 50. Upon close examination of clinical prostate cancer expression datasets 31,49–51, and upon performing RNA hybridization studies of prostate tumor histology sections, we found that ASCL2+ cells are common in castration-resistant and therapy-exposed prostate cancers. Thus, the previous reports combined with our findings support a potential cancer physiology role for the ASCL2/POU2F3 subtype in prostate cancer trans-differentiation. In parallel, NEUROD1, a marker of a previously defined prostate (and SCLC) cancer subtype 5,46 has relatively low expression in the PARCB temporal study. However, a NEUROD1-expressing cell cluster is situated between the ASCL1 and ASCL2 cell clusters in the lineage analysis, suggesting a potential facilitating role in lineage bifurcation and trans-differentiation.
Prior links between master regulators POU2F3 and ASCL2 have previously been reported, such as a unique dependency on ASCL2 in the POU2F3 subtype of SCLC cell lines 78. Whether ASCL2 and POU2F3 regulate highly overlapping transcriptional targets remains to be determined. One potential mechanism is through the co-activation of E-box and octamer DNA binding by ASCL2 and POU2F3, respectively. This interaction mechanism was observed previously between ASCL1 and POU3F2 (BRN2) in neurogenesis 79. Further work will help answer if ASCL2 facilitates the transitional stage and/or is a more default program during the de-differentiated transition stage.
Despite sharing similar nomenclature and pro-neuronal properties in the literature 20, ASCL1 and ASCL2 are known to play different roles in stem cell, lineage, and cancer biology 22,29. ASCL1 is a prominent driver for neuroendocrine differentiation in normal cells 22. However, recent cancer studies have shown that ASCL1 contributes to high lineage plasticity, resulting in subtype changes via remodeling of the global epigenetic state 18,24. The role of ASCL2 requires further investigation to determine its balance of compensatory and competitive characteristics in regard to ASCL1 function in small cell neuroendocrine cancers. In our mechanistic studies, we found that increased ASCL1 leads to increased ASCL2 expression, whereas ASCL2 suppresses ASCL1 expression using PARCB tumor-derived cell lines from multiple tissues of origin (prostate and lung). This leads to a future testable hypothesis on whether existence or absence of ASCL2 is required to arrive at an ASCL1-positive neuroendocrine state via trans-differentiation.
A dynamic lineage plasticity among subtypes of SCLC has been reported 18. However, the triggers and mechanisms underlying cancer cells switching to different lineages remain elusive. In SCNPC, beyond our discovery of the reciprocal regulation between ASCL1 and ASCL2, our results identified TFAP4 as an additional candidate member of this transcriptional circuitry. In particular, TFAP4 can alternate the expression of ASCL1 and ASCL2 by differential binding to cis regulatory elements on both genes. TFAP4 has been shown to have both activating and repressing properties in gene regulation through interactions with distinct transcription factors 59,60. TFAP4 demonstrates substantial increased expression in small cell vs. non-small cell cancers and is elevated in cancers compared to normal tissue. Future mechanistic and functional studies on TFAP4 will help clarify its master regulator role in lineage trans-differentiation in SCNPC and SCLC.
In clinical therapy, different forms of tumor plasticity define the battle grounds for acquired resistance. In the primary prostate cancer setting, the vast majority of prostate cancers are adenocarcinomas while all other histologic types are rare. In the castration-resistant setting, especially with the clinical introduction of next-generation anti-AR therapies, many different variant histology has been observed, including rare cases of squamous carcinoma80. In this combat, trans-differentiation to a small cell neuroendocrine state in response to otherwise effective molecular therapies is an emerging challenge across multiple cancer types. The temporal profiling of SCNPC development in the human cell based PARCB model revealed that trans-differentiation from an adenocarcinoma to neuroendocrine state is a temporally complicated, yet systematically coordinated process. The combination of bulk and single cell profiling approaches allowed for the identification of an arc-like trajectory and a transitory period characterized by epigenetic loosening, which are shared in general by other differentiation and development processes. Consistent with genetically engineered mouse SCNPC models, and with the multiple subtypes of SCLC, we find a role for both ASCL1 and ASCL2/POU2F3 in trans-differentiation to SCNPC. The results from our model have provided insight into the regulatory crosstalk between different neuroendocrine master regulators and provide a resource for identifying candidate approaches for blocking this clinically challenging case of trans-differentiation.
STAR METHODS TEXT
REOURCE AVAILABILIY
Lead contact
Further information and requests for resources and reagents should be directed to and will be fulfilled by the lead contact, Thomas Graeber (TGraber@mednet.ucla.edu).
Material availability
All material generated in this study including plasmids and cell lines is available from the lead contact upon request with appropriate material transfer agreements.
Date and code availability
Bulk RNA-sequencing data, bulk ATAC-sequencing data, single cell RNA-sequencing data and ChIP-seq (CUT&RUN) data have been deposited at dbGAP (phs003230.v1). In addition, the gene expression counts of Bulk RNA-sequencing and single cell RNA-sequencing data have been deposited at GEO (GSE240058). Accession numbers are also listed in the key resources table.
This paper does not report any original code.
Any additional information required to reanalyze the data reported in this paper is available from the lead contact upon request.
KEY RESOURCES TABLE
| REAGENT or RESOURCE | SOURCE | IDENTIFIER |
|---|---|---|
| Antibodies | ||
| CD49f-PECy7 | Invitrogen | Cat# 25-0495-82 |
| CD45-APC | Invitrogen | Cat# 47-0459-42 |
| TROP2-APC | R&D Systems | Cat# FAB650A |
| ASCL1 | Abcam | Cat# ab21327 |
| ASCL2 | R&D Systems | Cat# AF6539 |
| GAPDH-HRP | GeneTex | Cat# GT239 |
| SOX9 | Abcam | Cat# ab185230 |
| POU2F3 | Cell Signaling | Cat# 92579 |
| ANXA1 | Cell Signaling | Cat# 3299 |
| SOX2 | Cell Signaling | Cat# 3579 |
| FOXA1 | Abcam | Cat# ab170933 |
| SYP | Cell Signaling | Cat# 5461 |
| NEUROD1 | Abcam | Cat# ab109224 |
| ONECUT2 | Proteintech | Cat# 21916-1-AP |
| NCAM1/CD56 | Abcam | Cat# ab133345 |
| V5 | Invitrogen | Cat# 46-0705 |
| Biological Samples | ||
| prostatectomy tissue | UCLA TPCL | N/A |
| Chemicals, Peptides, and Recombinant Proteins | ||
| Matrigel | Corning | Cat# 356234 |
| Matrigel (HC) | Corning | Cat# 354248 |
| dispase | Thermo Fisher | Cat# 17105041 |
| Gateway LR Clonase II | Thermo Fisher | Cat# 11791020 |
| BamHI-HF | New England Biolabs | Cat# R3136 |
| Epredia™ Cytoseal™ Mountant | Fisher Scientific | Cat# 22-050-262 |
| cOmplete™ Protease Inhibitor Cocktail | Millipore Sigma | Cat# 11697498001 |
| Opal dye 520 | Akoya Biosciences | Cat# FP1487001KT |
| Opal dye 570 | Akoya Biosciences | Cat# FP1488001KT |
| DAPI | Thermo Fisher | Cat# D3571 |
| Critical Commercial Assays | ||
| RNAscope Multiplex Fluorescent V2 kit | ACDBio | Cat# 323270 |
| ASCL1 Double Z Probe | ACDBio | Cat# 459721-C2 |
| ASCL2 Double Z Probe | ACDBio | Cat# 323100 |
| Cell Titer-Glo Luminescent Cell Viability Assay | Promega | Cat# G7570 |
| CUT&RUN Assay kit | Cell Signaling | Cat# 86652 |
| Gibson Assembly | New England Biolabs | Cat# E5510 |
| miRNeasy Mini Kit | Qiagen | Cat# 217004 |
| SuperScript IV First-Strand Synthesis System | Thermo Fisher | Cat# 18091050 |
| SYBR Green PCR Master Mix | Thermo Fisher | Cat# 4309155 |
| KAPA Stranded mRNA-Seq Kit | Roche | Cat# KK8420 |
| MycoAlert™ PLUS Mycoplasma Detection Kit | Lonza | Cat# LT07-703 |
| Deposited Data | ||
| PARCB temporal data (bulk RNA-seq, ATAC-seq, single cell RNA-seq and ChIP-seq) | This paper | phs003230.v1.p1 |
| PARCB temporal gene expression (bulk and single cell RNA-seq) | This paper | GSE240058 |
| gene expression data: small-cell neuroendocrine cancers | Balanis et al, 2019 | https://www.cell.com/cancer-cell/fulltext/S1535-6108(19)30296-X |
| bulk RNA-seq FASTQs: CRPC/NEPC tumors (Beltran) |
Beltran et al, 2016
Beltran et al, 2019 |
phs000909.v.p1 phs001666.v1.p1 |
| bulk RNA-seq FASTQs: CRPC/NEPC tumors (SU2C) | Abida et al, 2019 | phs000915.v2.p2 |
| bulk RNA-seq FASTQs: CRPC tumors (Sharp) | Sharp et al, 2019 | GSE118435 |
| bulk RNA-seq FASTQs: CRPC tumors (Labrecque) |
Labrecque et al, 2019 Labrecque et al, 2021 |
GSE126078 |
| bulk RNA-seq and ATAC-seq FASTQs: | Tang et al, 2022 | GSE199190 |
| bulk RNA-seq FASTQs: SCLC tumors (George) | George et al, 2015 | EGAD00001001244 |
| SCLC subtype annotations | Rudin et al, 2019 | https://www.nature.com/articles/s41568-019-0133-9 |
| gene expression data: TCGA Pan-Cancer | Hoadley et al, 2018 | https://xenabrowser.net/datapages/?cohort=TCGA%20Pan-Cancer%20(PANCAN)&removeHub=http%3A%2F%2F127.0.0.1%3A7222 |
| gene expression data: pan-cancer CCLE | Ghandi et al, 2019 | https://depmap.org/portal/download/all/ |
| single-cell gene expresion data: advanced prostate cancers human biopsies | He et al, 2021 | https://singlecell.broadinstitute.org/single_cell/study/SCP1244/transcriptional-mediators-of-treatment-resistance-in-lethal-prostate-cancer |
| single-cell RNA-seq FASTQs: Brady GEMM model of advanced prostate cancers | Brady et al, 2021 | GSE151426 |
| single-cell RNA-seq FASTQs: Chan GEMM and Human CRPC tumor biopsies | Chan et al, 2022 | GSE210358 |
| single-cell RNA-seq FASTQs: Dong et al Human biopsy | Dong et al 2020 | GSE137829 |
| Experimental Models: Cell Lines | ||
| NCI-H1385 | American Type Culture Collection (ATCC) | Cat# CRL-5867 |
| NCI-H1930 | American Type Culture Collection (ATCC) | Cat# CRL-5906 |
| NCI-H1694 | American Type Culture Collection (ATCC) | Cat# CRL-5888 |
| NCI-H146 | American Type Culture Collection (ATCC) | Cat# HTB-173 |
| DMS79 | American Type Culture Collection (ATCC) | Cat# CRL-2049 |
| NCI-H526 | American Type Culture Collection (ATCC) | Cat# CRL-5811 |
| NCI-H660 | American Type Culture Collection (ATCC) | Cat# CRL-5813 |
| COR-L311 | Sigma Aldrich | Cat# 96020721 |
| Lung-NHBE4-PARCB1 | Park et al, 2018 | N/A |
| Lung-NHBE-PARCB2 | Park et al, 2018 | N/A |
| Bladder-PARCB1 | Liang et al., 2020 | N/A |
| Lung-NHBE5-PARCB1 | Park et al., 2018 | N/A |
| Prostate-PARCB2 | Park et al., 2018 | N/A |
| PARCB-P2-TP6 | This paper | N/A |
| PARCB-P3-TP5 | This paper | N/A |
| PARCB-P7-TP6 | This paper | N/A |
| PARCB-P8-TP6 | This paper | N/A |
| Prostate-PARCB9 | Park et al, 2018 | N/A |
| Prostate-PARCB1 | Park et al., 2018 | N/A |
| Experimental Models: Organisms/Strains | ||
| NOD.Cg-Prkdcscid Il2rgtm1Wjl/SzJ (NSG) mice | Jackson Laboratories | RRID:IMSR_JAX:005557 |
| Oligonucleotides | ||
| PUM1 F | IDT | 5’-ATGGACGGCGGCACAC-3’ |
| PUM1 R | IDT | 5’-TCTCATTCTGCTGGTCTGAAGG-3’ |
| ASCL1 F | IDT | 5’-CAAGCAAGTCAAGCGACAGC-3’ |
| ASCL1 R | IDT | 5’-CTCATCTTCTTGTTGGCCGC-3’ |
| ASCL2 F | IDT | 5’-ATGGACGGCGGCACAC-3’ |
| ASCL2 R | IDT | 5’-CAAGTTCACCAGCTTCACGC-3’ |
| Recombinant DNA | ||
| pLENTI6.3-V5-ASCL1 | DNASU | Cat#: HsCD00852286 |
| pLenti6/V5-DEST Gateway Vector | Thermo Fisher | Cat# V496100 |
| pDONR221-ASCL2 | DNASU | Cat# HsCD00829357 |
| TLCv2 | Addgene | Cat# 87360 |
| Software and Algorithms | ||
| DESeq2 (v1.34.0) | Love, Huber, and Anders, 2014 | https://bioconductor.org/packages/release/bioc/html/DESeq2.html |
| HOMER (v4.11) | Heinz, Benner, Spann, Bertolino et al, 2010 | http://homer.ucsd.edu/homer/download.html |
| GimmeMotifs (v0.17.0) | Bruse and van Heeringen, 2018 van Heeringen and Veenstra, 2011 |
https://gimmemotifs.readthedocs.io/en/master/index.html# |
| EnrichR (v3.1) | Chen et al, 2013 Kuleshov et al, 2016 Xie et al, 2021 |
https://cran.r-project.org/web/packages/enrichR/index.html |
| WiggleTools (v1.2) | Zerbino et al, 2014 | https://github.com/Ensembl/WiggleTools |
| deepTools (v3.5.1) | Ramirez et al, 2014 | https://deeptools.readthedocs.io/en/develop/index.html |
| DescTools (v0.99.47) | https://cran.r-project.org/web/packages/DescTools/index.html | |
| Seurat (v3.2.3) | Hao and Hao et al, 2021 Stuart and Butler et al, 2019 Butler et al, 2018 Satija and Farrell et al, 2015 |
https://satijalab.org/seurat/ |
| singleR (v1.8.1) | Aran et al, 2019 | https://bioconductor.org/packages/release/bioc/html/SingleR.html |
| Monocle 2 (v3.12) | Trapnell and Cacchiarelli et al, 2014 Qiu, Hill, Trapnell et al, 2017 Qiu and Trapnell et al, 2017 |
http://cole-trapnell-lab.github.io/monocle-release/ |
| scVelo (v0.2.3) | La Manno et al, 2018 Bergen et al, 2020 Bergen et al, 2021 |
https://scvelo.readthedocs.io/en/stable/ |
| ARACNe-AP |
Lachmann et al, 2016
Margolin et al, 2006 |
https://github.com/califano-lab/ARACNe-AP |
| fgsea (1.20.0) | Korotkevich, Sukhov, and Sergushichev, 2019 | https://bioconductor.org/packages/release/bioc/html/fgsea.html |
| TOIL (v3.12.0) | Vivian et al, 2017 | https://toil.ucsc-cgl.org/ |
| ENCODE ATAC-seq pipeline | Hitz et al, 2023 | https://github.com/ENCODE-DCC/atac-seq-pipeline |
| ENCODE Transcription Factor and Histone ChIP-Seq processing pipeline | Hitz et al, 2023 | https://github.com/ENCODE-DCC/chip-seq-pipeline2 |
| CellRanger (v4.0.0) | 10x Genomics | https://support.10xgenomics.com/single-cell-gene-expression/software/pipelines/latest/using/tutorial_ct |
| ggplot2 (v3.3.6) | Wickham 2016 | https://cran.r-project.org/web/packages/ggplot2/index.html |
| GSVA (v1.42.0) | Hänzelmann, Castelo, and Guinney, 2013 | https://bioconductor.org/packages/release/bioc/html/GSVA.html#:~:text=Gene%20Set%20Variation%20Analysis%20(GSVA,of%20a%20expression%20data%20set. |
| Stats (v3.6.2) | https://stat.ethz.ch/R-manual/R-devel/library/stats/html/00Index.html | |
| pheatmap (v1.0.12) | https://cran.r-project.org/web/packages/pheatmap/pheatmap.pdf | |
| limma (v3.50.3) | Ritchie et al, 2015 | https://bioconductor.org/packages/release/bioc/html/limma.html |
| bedtools (v2.26.0) | Quinlan and Hall, 2010 | https://bedtools.readthedocs.io/en/latest/ |
| Fiji (v2.14.0) | Schindelin, Arganda-Carreras and Frise et al., 2019 | https://imagej.net/software/fiji/ |
| StepOne Software (v2.3) | Thermo Fisher | https://www.thermofisher.com/us/en/home/technical-resources/software-downloads/StepOne-and-StepOnePlus-Real-Time-PCR-System.html |
EXPERIMENTAL MODEL AND STUDY PARTICIPANT DETAILS
PARCB transformation temporal model
Prostate tissues from donors were provided in a de-identified manner and therefore exempt from Institutional Review Board (IRB) approval. Processing of human tissue, isolation of basal cells, organoid transformation, and xenograft assay were described in detail previously 6. 20,000 cells FACS-sorted cells per organoid were plated in 18–20ul of growth factor-reduced Matrigel (Cat# 356234, Corning) with PARCB lentiviruses (MOI=50/lentivirus). Organoids were cultured in the prostate organoid media82 for about 10–14 days. Transduced organoids were harvested by dissociation of Matrigel with 1mg/mL Dispase (Cat# 17105041, Thermo Fisher Scientific). The organoids were washed three times with 1xPBS to remove Dispase and re-suspended in 10μl of growth factor reduced Matrigel and 10ul Matrigel with High Concentration (Cat# 354248, Corning). The organoid-Matrigel mixture was implanted subcutaneously in immunodeficient NOD.Cg-Prkdcscid Il2rgtm1Wjl/SzJ (NSG) mice 83.Tumors were extracted in every two-week window, with the last tumor collection of the time course series determined by either reaching around 1cm in diameter in tumor size or ulceration, whichever came first. NSG mice had been transferred from the Jackson Laboratories and housed and bred under the care of the Division of Laboratory Animal Medicine at the University of California, Los Angeles (UCLA). All animal handling and subcutaneous injections were performed following the protocols approved by UCLA’s Animal Research Committee.
Cell lines
NCI-H1385 (Cat# CRL-5867), NCI-H1930 (Cat# CRL-5906), NCI-H1694 (Cat# CRL-5888), NCI-H146 (Cat# HTB-173), DMS79 (Cat# CRL-2049), NCI-H526 (Cat# CRL-5811), and NCI-H660 (Cat# CRL-5813) were purchased from American Type Culture Collection (ATCC). COR-L311 was obtained from Sigma Aldrich (Cat# 96020721). All commercially available cell lines were cultured and maintained based on the instruction from the vendors. PARCB tumor derived cell lines were generated using the previous method 6. All the cell lines in the study are free of Mycoplasma using a MycoAlert™ PLUS Mycoplasma Detection Kit (Cat# LT07-703, Lonza).
METHOD DETAILS
Lentiviral vectors and lentiviruses
The myristoylated AKT1 vector (FU-myrAKT1-CGW), exogenous expression of cMYC and BCL2 (FU-cMYC-P2A-BCL2-CRW), dominant TP53 mutant (R175H) and shRNA targeting RB1 vector (FU-shRB1-TP53DN-CYW) have been described previously 6. Exogenous expression of V5 tagged ASCL1 (pLENTI6.3-V5-ASCL1) is obtained from DNASU (Cat#: HsCD00852286) 84. For making exogenous expression of ASCL2 containing vector (pLENTI6.3-V5-ASCL2), Gateway cloning (Cat# 11791020, Thermo Fisher) was performed using pLenti6/V5-DEST Gateway Vector (Cat# V49610, Thermo Fisher) and the entry plasmid (pDONR221-ASCL2) was obtained from DNASU (Cat# HsCD00829357) 84. For making doxycycline- inducible sgTFAP4 (TLCv2-Cas9-BFP-sgTFAP4), TLCv2 (Cat# 87360, Addgene) was first digested with BamHI-HF (Cat# R3136, New England Biolabs) and Nhel-HF (Cat# 3131, New England Biolabs) at 37℃ for 1 hour and inserted with a synthesized fragment containing T2A-Hpal-BFP sequence (gBlock service provided by IDT) using Gibson Assembly (Cat# E5510, New England Biolabs). sgTFAP4 sequence was cloned into the previously described TLCv2-BFP vector using an established protocol 85. sgTFAP4-primers are listed in the key resources table. Lentiviruses were produced and purified by a previously established method 86.
Tissue section, histology, and immunohistochemistry (IHC)
PARCB model tumor tissues were fixed in 10% buffered formaldehyde overnight at 4℃ and followed by 70% ethanol solution. Tissue microarray construction and hematoxylin and eosin (H&E) staining were performed by Translation Pathology Core Laboratory (TPCL) in UCLA using standard protocol. TPCL is a CAP/CLIA certified research facility in the UCLA Department of Pathology and Laboratory Medicine and a UCLA Jonsson Comprehensive Cancer Center Shared Facility. For immunohistochemistry staining, formalin-fixed, paraffin-embedded (FFPE) sections were deparaffinized and rehydrated with a washing sequence of xylene and different concentration of ethanol. Citrate buffer (pH6.0) was used to retrieve antigens. The sections were incubated in citrate buffer and heated in a pressure cooker. 3% of H2O2 in methanol was used to block endogenous peroxidase activity for 10 mins at room temperature. The sections were blocked then incubated with primary antibodies overnight at 4°C. Anti-mouse/rabbit secondary antibodies were used to detect proteins of interest and DAB EqV substrate was used to visualize the staining. All components were included in the ImmPRESS Kit (MP-7801-15 and MP-7802-15, Vector Laboratories) The slides were then dehydrated and mounted with Xylene-based drying medium (Cat# 22-050-262, Fisher Scientific).
Western blot
Cells were lysed on ice using UREA lysis buffer (8M UREA, 4% CHAPS, 2x protease inhibitor cocktail (Cat# 11697498001, Millipore Sigma)). Genomic DNA was removed by ultracentrifuge (Beckman Optima MAX-XP, rotor TLA-120.1, 48,000 rpm for 90 min). Protein concentrations were measured using the Pierce BCA Protein Assay Kit (Cat#: 23227, Thermo Scientific). Samples were electrophoresed on polyacrylamide gels (Cat# NW04120BOX, Thermo Fisher), transferred to nitrocellulose membranes (Cat# 88018, Thermo Fisher). Western blots were visualized using iBright CL1500 Imaging system (Cat#44114, Thermo Fisher).
RT-qPCR
Total RNA was isolated from cells using miRNeasy Mini Kit (Cat# 217004, Qiagen). cDNA was synthesized from 2 ug of total RNA using the SuperScript IV First-Strand Synthesis System (Cat# 18091050, Thermo Fisher). RT-qPCR was performed using SYBR Green PCR Master Mix (Cat# 4309155, Thermo Fisher). Amplification was carried out using the StepOne Real-Time PCR System (Cat# 4376357, Thermo Fisher) and analysis was performed using the StepOne Software v2.3. with the following primers were used at a concentration of 250 uM: Relative quantification was determined using the Delta-Delta Ct Method. Primer sequences are listed in the key resources table.
In situ RNA hybridization assay and image analysis
The RNAscope Multiplex Fluorescent V2 kit was used to perform in situ hybridization on FFPE tissue microarray slides following the manufacturer’s protocol (Cat# 323270, ACDBio). The Institutional Review Board of the University of Washington approved this study (protocol no. 2341). All rapid autopsy tissues were collected from patients who signed written informed consent under the aegis of the Prostate Cancer Donor Program at the University of Washington. The establishment of the patient-derived xenografts was approved by the University of Washington Institutional Animal Care and Use Committee (protocol no. 3202–01). For multiplex hybridization, the Double Z probes targeting ASCL1 (Cat# 459721-C2, ACDBio) and ASCL2 (Cat# 323100, ACDBio) were hybridized to the samples for 2 hours at 40°C. ASCL1 signal was visualized using Opal dye 520 (Cat# FP1487001KT, Akoya Biosciences) and ASCL2 signal was visualized using Opal dye 570 (Cat# FP1488001KT, Akoya Biosciences). DAPI (Cat# D3571, Thermo Fisher) was used to visualize nuclei. Confocal fluorescence images were acquired using an inverted Zeiss LSM 880 confocal microscope. All images were processed using Fiji (https://imagej.net/software/fiji/).
Cell proliferation assay
3000 cells per cell line in five replicates were seeded on 96-well plates on Day 0. Cell viability was measured on Day 1, 3, 4, 5 and 6. using Cell Titer-Glo Luminescent Cell Viability Assay (Cat# G7570, Promega). Luminescence was measured at an integration time of 0.5 second per well.
Bulk RNA sequencing and dataset collection
Tumors were dissociated into single cells, followed by cell sorting of triple colors (RFP, GFP and YFP) by flow cytometry. Total RNA was extracted from the cell lysates using miRNeasy mini kit (Cat# 217084, Qiagen). Libraries for RNA-sequencing of PARCB time course samples were prepared with KAPA Stranded mRNA-Seq Kit (Cat# KK8420, Roche). The workflow consists of mRNA enrichment and fragmentation. Sequencing was performed on Illumina Hiseq 3000 or NovaSeq 6000 for PE 2×150 run. Data quality check was done on Illumina SAV. Demultiplexing was performed with Illumina Bcl2fastq v2.19.1.403 software. Raw sequencing reads were processed through the UCSC TOIL RNA Sequencing pipeline1 for quality control, adapter trimming, sequence alignment, and expression quantification. Briefly, sequence adapters were trimmed using CutAdapt v1.9, sequences were then aligned to human reference genome GRCh38 using STAR v2.4.2a and gene expression quantification was performed using RSEM v1.2.25 with transcript annotations from GENCODE v23 87.
The FASTQ files of the Park dataset 6, Beltran dataset 33, George dataset 32 and Tang dataset 57 were all processed through the TOIL pipeline with the same parameters to get RSEM expected counts. The TOIL-RSEM expected counts of TCGA pan cancer samples were obtained directly from UCSC Xena browser (https://xenabrowser.net/datapages) and gene expression (log2(TPM + 1)) of pan-cancer cell lines from the Cancer Cell Line Encyclopedia (CCLE) were downloaded from DepMap Portal (DepMap Public 22Q1) (https://depmap.org/portal/download/all/). The RSEM counts of all combined datasets were upper quartile normalized, log2(x+1) transformed (referred to as log2(UQN+1) counts) and filtered down to HUGO protein coding genes (http://www.genenames.org/) for the downstream analyses. SCLC subtypes 46 and CRPC subtypes 57were previously defined. The details of the bulk RNA-sequencing of PARCB time course are described in Table S1I.
Differential gene expression analysis and hierarchical clustering
PARCB time course samples were grouped into 6 hierarchical clusters (HC) by performing Ward’s hierarchical clustering (k=6) on log2(UQN + 1) counts using the hclust function from the base R package, Stats (https://stat.ethz.ch/R-manual/R-devel/library/stats/html/00Index.html). Differential gene expression analysis was then performed on each HC in a “one vs. rest” fashion, i.e., between one cluster vs. the remaining five clusters, using DESeq2 with the following parameters: independentFiltering=F, cooksCutoff=FALSE, alpha=0.1 88. For each HC vs. rest comparison, genes with a log2FC > 2 and p-adjusted value < 0.05 were considered upregulated for that HC gene module. However, four genes (IL1RL1, KRT36, PIK3CG, NPY) were upregulated among multiple HC vs. rest comparisons. As a result, these genes were assigned to the HC gene module with the smaller p-adjusted value for that gene. Z-scores for upregulated genes in each cluster were then plotted in a heatmap using pheatmap function. PARCB time course samples were subsequently categorized by this HC definition in downstream analyses.
GO enrichment analysis
Enrichment analysis was performed using the “GO_Biological_Process_2021” database and the enrichr function from the R package, enrichR, using upregulated genes for each HC 89. Pathways were selected based on their adjusted p-value for each HC. The results were plotted using ggplot().
Bulk ATAC sequencing and dataset collection
Tumors were dissociated into single cells, followed by cell sorting of triple colors (RFP, GFP and YFP) by flow cytometry. ATAC-sequencing samples were prepared following the previously published protocol38. Bulk ATAC sequencing was performed in the Technology Center for Genomics & Bioinformatics Core in UCLA. Sequencing was performed on Illumina NovaSeq 6000 for PE 2×50 run. Data quality check was done on Illumina SAV. Demultiplexing was performed with Illumina Bcl2fastq v2.19.1.403 software. The raw FASTQ files were processed using the published ENCODE ATAC-Seq Pipeline (https://github.com/ENCODE-DCC/atac-seq-pipeline). The reads were trimmed and aligned to hg38 using bowtie2. Picard was used to de-duplicate reads, which were then filtered for high-quality paired reads using SAMtools. All peak calling was performed using MACS2. The optimal irreproducible discovery rate (IDR) thresholded peak output was used for all downstream analyses, with a threshold P value of 0.05. Other ENCODE3 parameters were enforced with the flag-encode3. Reads that mapped to mitochondrial genes or blacklisted regions, as defined by the ENCODE pipeline, were removed. The peak files were merged using bedtools merge to create a consensus set of peaks across all samples, and the number of reads in each peak was determined using bedtools multicov 90. A variance stabilizing transformation was performed on peak counts using DESeq2 88 and batch effects were removed using removeBatchEffect() from limma 91. All downstream ATAC-sequencing analysis was performed using this matrix (referred to as VST peak counts), unless otherwise specified. P1-TP1 was not collected for ATAC-sequencing due to insufficient cell number for sequencing. P7-TP2 was not included for the processing due to low read counts (total of 1536). P1-TP5, P2-TP6 and P10-TP2 were not included in PCA due to reaching within 95th percentile of calculated Shannon entropy for all ATAC-sequencing samples. The details of the bulk ATAC-sequencing processing of PARCB temporal samples are described in Table S1J
Raw FASTQ files of Tang ATAC-sequencing dataset were downloaded from GSE193917 57. The raw FASTQ files were processed using the same ENCODE pipeline described above with the same parameters.
Differential chromatin accessibility and Transcription start site (TSS) analysis
Differential peak analysis was performed on each HC in a one vs. rest fashion, as described above in the bulk RNA-sequencing analysis. Peaks were called hyper- or hypo-accessible if the log2 fold change was greater than 2 or less than 2, respectively, and had an adjusted p-value of less than 0.05. The z-scores of the union of all differentially accessible peaks were used to plot the heatmap using VST peak counts, with the rows ordered by chromosomal location.
For mapping peaks near TSS sites, the bigwig files containing ATAC-sequencing readings were first converted into wig files. Wig files from samples within the same HC were then merged by calculating the mean across peak regions using wiggleTools 92. The TSS analysis was performed using deepTools and computeMatrix in reference-point mode with parameters referencePoint=TSS, a=2000, b=2000 to compute the scores from merged bigwigs in regions 2 kbp flanking the region of interest. plotHeatmap was used with parameters zMin=0, zMax=5, binSize=10 was to plot the TSS figure from the score matrix 93.
PCA and projection analyses
Unsupervised PCA of the PARCB time course samples using log2(UQN +1) counts was performed using the prcomp function from the stats package available on R (described above). PC2 and PC3 sample scores were then multiplied by a 30-degree clockwise rotation matrix. Ellipses were drawn around samples with 95% confidence based on real time labels using stat_ellipse() from ggplot2. The PCA projection of PARCB time course samples onto the framework using pan small cell cancer combined gene expression datasets have been discussed previously 4. In brief, the input matrix for this PCA was centered but not scaled. PARCB time course samples were then projected by multiplying the data matrix by the PCA loadings. For projection of PARCB time course samples onto the framework using gene expression data of CRPC subtypes 57 or SCLC subtypes 46, the same methodology was applied.
For projection of PARCB time course samples onto the framework using ATAC-sequencing data of CRPC subtypes 57, peak coverage of the Tang dataset was determined using the consensus set of peaks from the PARCB time course data with function bedtools multicov 90. Tang dataset peak read counts were then variance stabilized transformed using DESeq2 88. PCA was performed on VST peak read counts of the Tang dataset using the prcomp function with the parameters center = T, scale = F. PARCB time course samples were then projected onto the framework by multiplying PARCB time course VST peak read counts by PCA loadings.
For projection of PARCB time course single cells onto the framework defined by the bulk RNA-sequencing data, the single cell data after integration by batch was down-sampled for 1000 cells within each patient series or cluster. The single cell and bulk RNA-sequencing data were centered separately prior to projection. The projection was carried out by multiplying the single cell data matrix by PCA loadings of PARCB bulk samples.
Transcription factor analysis
Top ranked transcription factors (TF) were selected using the gene loading scores derived from the unsupervised PCA of gene expression described above. PC2 and PC3 loading scores were rotated 30 degrees clockwise by multiplying a 30-degree clockwise rotation matrix to the gene loading scores (resulting components called PC2’ and PC3’, respectively). The loading scores were then filtered to include only transcription factors 37. The center of the TF loading scores was determined by taking the average of PC1, PC2’, and PC3’. The Euclidean distance from the center was calculated for each TF, and the top 60 TFs furthest from center were selected. Hierarchical clustering (k = 5) was performed on the log2(UQN +1) counts of the top 60 TFs. The z-scores for each TF were plotted using pheatmap. Average z-score of HOXC genes was calculated from HOXC 4–13 (except for HOXC7) in each PARCB time course sample.
Shannon Entropy analysis
Shannon entropy for each PARCB time course sample was calculated on variance stabilized transformed (VST) ATAC-sequencing peak counts using the Entropy() function from the R package DescTools (https://cran.r-project.org/web/packages/DescTools/index.html). PARCB samples falling within the 95th percentile of calculated Shannon entropy scores were included in the following PCA. PCA was performed on VST peak counts and was plotted using ggplot2 with samples colored by their Entropy scores and ellipses with 95% confidence were drawn around each time point group using stat_ellipse().
Prostate cancer gene regulatory network analysis
The RNA-sequencing data of PARCB time course study, Park dataset 6, Beltran dataset 33, and TCGA PRAD/PRAD-norm dataset were included in this analysis. TCGA PRAD/PRAD-norm data was down sampled to match the sample size of other cohorts. Gene network was built on the combined datasets using ARACNe-AP 81.
Signature scores (adult stem cell, adenocarcinoma and SCNPC)
SCNPC signature was derived using Beltran dataset 33, following the methods described previously 6. The adult stem cell (ASC) signature in our analysis is defined in literature 42. For prostate adenocarcinoma signature, differential gene expression analysis was performed on TCGA PRAD samples vs CRPC-PRAD and SCNPC samples from the Beltran dataset 10,33 using DESeq2. The adenocarcinoma signature was defined by all the upregulated genes (log2FoldChange >2 and padj < 0.05) from the differential gene expression analysis. Adenocarcinoma and SCNPC signature scores of our PARCB time course samples were calculated using gsva with method=”ssgsea”.
Motif analysis
Hyper-accessible peaks in each HC from the differential peak analysis described previously were used for motif enrichment analysis using GimmeMotifs 41,90. Differential motif analysis was performed on hyper-accessible peaks for each HC against a hg38 whole-genome background using the maelstrom function with default parameters. The top 5 enriched motifs and their aggregated z-scores for each HC are shown in the heatmap (each individual HC vs all others). Additionally, we performed differential peak analysis on HC5 vs HC1-HC4 and HC6 vs HC1-HC4 with the same parameters as described previously using DESeq2. Likewise, hyper-accessible peaks for HC5 and HC6 in these comparisons were defined by a threshold of log2FoldChange > 2 and padj < 0.05. Differential motif analysis was performed on the set of hyper-accessible peaks from HC5 vs HC1-4 and HC6 vs HC1-4 using the maelstrom function as described above. Note that in the GimmeMotif enrichment analysis, transcription factors are culled to minimize redundancy, and this step is impacted by the exact input data and sample group comparison indicated. Thus, each motif suite may contain slightly different enriched transcription factors. However the transcription factor sets remain highly consistent between each case.
For identifying transcription factors that recognize ASCL1 and ASCL2 regulatory sequences, ASCL1 and ASCL2 promoter and enhancer regions were mapped using UCSC Genome Browser Gateway (https://genome.ucsc.edu/cgi-bin/hgGateway). Motif analysis was then performed on each ASCL1 and ASCL2 promoter and enhancer region using the findMotifGenome function from HOMER with the parameters -size 200 and - mask 58. Resulting motifs were then ranked by their p-value. Additionally, ASCL1 and ASCL2 enhancer and promoter regions were mapped to accessible peaks from ATAC-sequencing data of the PARCB time course to identify chromatin changes of ASCL1 and ASCL2 cis-regulatory sequences. Peak regions from the PARCB consensus peak set overlapping with the ASCL1 and ASCL2 enhancer and promoter regions were then plotted in a heatmap using VST peak counts and scaled per sample.
Single-cell RNA sequencing
PARCB time course samples were sequenced in two batches: P2/P5 and P6/P7 series. Single cell gene expression libraries were created using Chromium Next GEM Single Cell 3’ (v3.1 Chemistry) (Cat# PN1000123, 10x Genomics), Chromium Next GEM Chip G Single Cell Kit (Cat# PN1000120, 10x Genomics), and Single Index Kit T Set A (Cat# PN1000213, 10x Genomics) according to the manufacturer’s instructions. Briefly, cells were loaded to target 10,000 cells to form GEMs and barcode individual cells. GEMs were then cleaned cDNA and libraries were also created according to manufacturer’s instructions. Library quality was assessed using 4200 TapeStation System (Cat# G2991BA, Agilent) and D1000 ScreenTape (Cat# 5067–5582, Agilent) and Qubit 2.0 (Cat# Q32866, Invitrogen) for concentration and size distribution. Samples were sequenced using Novaseq 6000 sequencer (Catl# A00454, Illumina) using 100 cycles (28+8+91). The illumina base calling files were converted to FASTQ using the mkfastq function in Cell Ranger suite (https://support.10xgenomics.com/single-cell-gene-expression/). The reads were then aligned to GRCh38 for UMI counting with cellranger count function. The details of the single cell-seq of PARCB time course are described in Table S1K.
UMAP analysis
The downstream quality control, statistics and visualization of PARCB single cell RNAseq data were performed mainly using the Seurat (v3.2.3) R package 94. Briefly, the data from all four patient series was first filtered for cells with total number of unique features above 500 and below 10000 as well as mitochondria feature counts below 10%. The mitochondrial genes and ribosomal genes were then removed from the count matrix for the downstream analysis. To overcome batch effect, we performed Seurat integration between batch 1 (Series P2 and P5) and 2 (Series P6 and P7). Briefly, for each batch, the two corresponding matrices were combined first, and log transformation and library size normalization were performed with NormalizeData function. Then the 2500 most variable genes were selected as anchor features to integrate for all coding genes. After integration, the top 30 principal components were used to perform UMAP analysis.
Processed single cell RNA-sequencing data of advanced prostate cancers were downloaded from the Single Cell Portal hosted by Broad Institute (https://singlecell.broadinstitute.org/single_cell/study/SCP1244/transcriptional-mediators-of-treatment-resistance-in-lethal-prostate-cancer)49. For this dataset, UMAP analysis was performed on TPM values of prostate cancer cells only as defined in the paper using the umap function in base R. For UMAP visualization of this dataset, TPM values were log2 transformed with a pseudo count of +1. Single cell RNA-sequencing data of N-myc GEMM tumors 31, and human biopsy and GEMM tumors 50 were downloaded from the Gene Expression Omnibus (GEO) database with the accession numbers GSE151426 and GSE21035, respectively, and processed with cellranger count.
In the Brady et al paper, single-cell data were first filtered for cells with total number of unique features > 200 and < 10000 as well as mitochondrial feature counts < 10%. We then performed Seurat SCTransform integration on each sample. Briefly, for each sample, the matrices were first combined and normalized using SCTransform function. Then the top 3000 most variable genes were selected as anchor features to integrate all genes. After integration, the top 15 principal components were used to perform UMAP analysis. In the Chan et al paper, GEMM single-cell data were filtered with the following thresholds nFeature_RNA >200 & nFeature_RNA < 8000 & percent.mt < 5 and human biopsy tissues single-cell data were filtered with nFeature_RNA > 200 & nFeature_RNA < 10000 & percent.mt < 5. Seurat integration of filtered cells for both datasets were then performed as described above. After integration, the top 50 principal components were used to perform UMAP analysis.
In the Dong et al analysis, the human biopsy scRNA-sequencing data was downloaded from GSE137829. We used the filtration parameters of the manuscript, total number of unique features > 500 and <7000, and mitochondrial feature counts < 10%. We filtered cells to only include epithelial (cancer) cells, as described by the CellType column in the annotation. Seurat NormalizeData was used with the LogNormalize method and a scale factor of 10000. The top 30 principal components were used to perform UMAP analysis.
Inferred cell type and cellular lineages analysis
The cell type inferences of PARCB single cells were implemented using the singleR R package 48. For scoring each cell for each general cell type, the Human Primary Cell Atlas data from LTLA/celldex package that contains normalized expression values was used as the reference.
Single cell trajectory analysis of PARCB samples was performed using two different methods, expression-based method Monocle2 52 and RNA Velocity based method scVelo 53. For Monocle2, the integrated Seurat object was used as the input for the program. DDRtree was used as the reduction method. Cells were ordered by the most variable 3000 genes in Seurat. For calculating pseudotime, the KRT5 population was selected as the root state. For RNA velocity, the spliced and unspliced counts were quantified by velocyto accounting for repeat masking. The spliced counts were then normalized using Seurat sctransform method followed by integration by batch. The integrated data was used for UMAP visualization. In scVelo, the data was filtered for genes with a minimum of 5 shared counts. The top 3000 highly variable genes were extracted based on the dispersion. Velocities were estimated by dynamical model and then projected onto the UMAP embedding.
Differential gene expression analysis in single cells
FindMarkers function in Seurat R package (described above) was used to identify differential expressed genes between ASCL1+ and ASCL2+ single cell populations. Patient series was regressed out by including it as the covariate. ASCL1+ cells and ASCL2+ cells are defined as cells with log normalized expression counts > 0 for ASCL1 or ASCL2, respectively. Genes that are differentially expressed in ASCL1+ population were defined by the difference of gene expression in ASCL1+ cells minus the one in ASCL2 expression (log and library size normalized) above 3. Genes that are differentially expressed in ASCL2+ cells were defined by such a difference below −1.
CUT&RUN sequencing
The CUT&RUN experiment was performed using previously established method 61 (Skene et al., 2018) and the manufacturer’s protocol (Cat# 86652, Cell Signaling). 100k live cells were used per reaction. 50pg of Spike-In DNA (Cat# 12931, Cell Signaling) was added per reaction for downstream normalization. DNA was purified using MinElute PCR Purification Kit (Cat# 28004, Qiagen), followed by fragmentation by using sonicator (Cat# M202, Covaris). Dual size selection was applied using KAPA Pure beads (Cat# KR1245, Roche). DNA Libraries were prepared with the KAPA DNA HyperPrep kit (Cat# KK8504, Roche).
Sequencing was performed on Illumina HiSeq3000 for a SE 1×50 run. Data quality check was done on Illumina SAV. Demultiplexing was performed with Illumina Bcl2fastq v2.19.1.403 software. Raw FASTQ files were processed using the published ENCODE-TF CHIP Seq pipeline. Batch 1 samples (P3-TP5 and P7-TP6) were processed with the parameter “chip.paired_end” : false while Batch 2 sample (P2-TP6) were processed with the parameter “chip.paired_end” : true. (https://github.com/ENCODE-DCC/chip-seq-pipeline2). For all samples, the reads were trimmed and aligned to hg38 (target) and S. cerevisiae strain S288C (spike-in) reference genomes using bowtie2. After alignment, Picard was used to remove PCR duplicates reads and SAMtools was used to further filter high-quality paired reads (i.e., remove reads that were unmapped, not primary alignment, reads failing platform, and/or multi-mapped). Peak calling was performed using MACS2. Peaks overlapping with blacklisted regions were removed (https://www.encodeproject.org/files/ENCFF356LFX/). Lastly, spike-in normalization factors were calculated following established protocol 95. The details of the CUT&RUN sequencing of PARCB time course are described in Table S1L.
QUANTIFICATION AND STATISTICAL ANALYSIS
All data were analyzed and processed using R v4.1.2, Python v3.11.5 and Excel. Error bars show mean ± SD unless otherwise specified. Significance was determined by Student’s two-tailed unpaired t tests or Wald test with 95% confidence intervals. P values <0.05 is considered statistically significant. P values were adjusted based on various methods dependent on the analysis including Benjamin-Hochberg method (Figure 1D and Figure 1F) and Bonferroni correction (Figure 4D). No statistical methods were used to predetermine sample sizes. Other details such as sequencing processing can be found in Table S1. All statistical methods for the bioinformatic analyses are described in detail in the method section.
ADDITIONAL RESOURCES
PARCB Multi-omics Explorer provides an interactive platform for visualization of gene expression using bulk RNA-sequencing and single cell RNA-sequencing of this time course study (https://systems.crump.ucla.edu/transdiff/).
Supplementary Material
Highlights.
PARCB temporal model profiling informs key aspects of SCNPC trans-differentiation
Trans-differentiation trajectory resembles a common developmental arc-like pattern
ASCL1 and ASCL2 mark distinct bifurcating SCNPC trans-differentiation trajectories
TFAP4 as a common regulator of ASCL1/2 implicated in SCNPC trans-differentiation
ACKNOWLEDGEMENTS
We thank the University of California, Los Angeles (UCLA) Tissue Procurement Core Laboratories for prostate tissue preparation and histological staining, and the UCLA Technology Center for Genomics and Bioinformatics for RNA sequencing, ATAC sequencing, CUT&RUN sequencing and single cell RNA sequencing. We thank the patients and their families, Bruce Montgomery, Celestia Higano, Evan Yu, Heather Cheng, Mike Schweizer, Andrew Hsieh, Lawrence True, Funda Vakar-Lopez, Martine Roudier and the rapid autopsy teams in the Urology and Laboratory Medicine & Pathology Departments at the University of Washington. Funding: This project is supported by an NIH UCLA SPORE in Prostate Cancer Grant P50CA092131 (O.N.W. and T.G.G.), the Department of Defense Prostate Cancer Research Program Idea Development Award W81XWH2110806 (O.N.W. and J.W.P.), NIH R01 Grant R01CA222877 (O.N.W. and T.G.G.), W.M. Keck Foundation Award 20182490 (O.N.W. and T.G.G.), UCLA Eli and Edythe Broad Center of Regenerative Medicine and Stem Cell Research Hal Gaba Director’s Fund for Cancer Stem Cell Research (O.N.W. and T.G.G.), Parker Institute for Cancer Immunotherapy (O.N.W.), Pacific Northwest Prostate Cancer SPORE Grant P50CA97186 (C.M., E.C. and P.S.N), NIH R01 Grant R01CA234715 (P.S.N), NIH P01 Grant PO1CA163227 (C.M., E.C. and P.S.N) and the Institute for Prostate Cancer Research (C.M., E.C. and P.S.N). C.C. is supported by the UCLA Eli and Edythe Broad Center of Regenerative Medicine and Stem Cell Research predoctoral fellowship and UCLA Dissertation Year Fellowship. K.M.S. is supported by the UCLA Medical Scientist Training Program (NIH NIGMS T32 GM008042). G.V. is supported by UCLA Tumor Cell Biology Training Program (USHHS Ruth L. Kirschstein Institutional National Research Service Award T32 CA009056).
Footnotes
Publisher's Disclaimer: This is a PDF file of an unedited manuscript that has been accepted for publication. As a service to our customers we are providing this early version of the manuscript. The manuscript will undergo copyediting, typesetting, and review of the resulting proof before it is published in its final form. Please note that during the production process errors may be discovered which could affect the content, and all legal disclaimers that apply to the journal pertain.
DECLARATION OF INTERESTS
E.C. served as a paid consultant to DotQuant and received Institutional sponsored research funding unrelated to this work from AbbVie, Gilead, Sanofi, Zenith Epigenetics, Bayer Pharmaceuticals, Forma Therapeutics, Genentech, GSK, Janssen Research, Kronos Bio, Foghorn Therapeutics, and MacroGenics. P.S.N. has served as a paid consultant for Janssen, Merck, Bristol Myers Squibb and received research funding from Janssen for work unrelated to the present study. O.N.W. currently has consulting, equity, and/or board relationships with Trethera Corporation, Kronos Biosciences, Sofie Biosciences, Breakthrough Properties, Vida Ventures, Nammi Therapeutics, Two River, Iconovir, Appia BioSciences, Neogene Therapeutics, 76Bio, and Allogene Therapeutics. None of these companies contributed to or directed any of the research reported in this article. T.G.G. reports receiving an honorarium from Amgen, having consulting and equity agreements with Auron Therapeutics, Boundless Bio, Coherus BioSciences and Trethera Corporation. The lab of T.G.G. has completed a research agreement with ImmunoActiva. A provisional patent application related to this study was submitted.
INCLUSION AND DIVERSITY
One or more of the authors of this paper self-identifies as a gender minority in their field of research. One or more of the authors of this paper self-identifies as a member of the LGBTQIA+ community.
SUPPLEMENTAL TABLE
Table S1. Supplemental information of bioinformatic analyses, related to Figure 1, 2, 4 and 6. A) Upregulated genes in each hierarchical clusters (HC); B) PCA scores of PARCB time course samples with HC and timepoint annotations; C) Enrichr GO Biological Processes 2021 results of upregulated genes per HC; D) Motif enrichment analysis per HC; E) List of weighted transcription factors for PCA loadings of PARCB time course data; F) Differential genes in ASCL1 vs ASCL2 cell populations; G) List of predicted gene network of ASCL1 and ASCL2; H) Ranked transcription factors motifs in ASCL1 and ASCL2 cis regulatory sequences; I) RNA-seq sequencing statistics; J) ATAC-seq sequencing statistics; K) Single Cell RNA sequencing statistics of PARCB time course sample; L) CUT&RUN sequencing statistics.
REFERENCES
- 1.Nadal R, Schweizer M, Kryvenko ON, Epstein JI, and Eisenberger MA (2014). Small cell carcinoma of the prostate. Nat Rev Urol 11, 213–219. 10.1038/nrurol.2014.21. [DOI] [PMC free article] [PubMed] [Google Scholar]
- 2.Pietanza MC, Byers LA, Minna JD, and Rudin CM (2015). Small cell lung cancer: will recent progress lead to improved outcomes? Clin Cancer Res 21, 2244–2255. 10.1158/1078-0432.CCR-14-2958. [DOI] [PMC free article] [PubMed] [Google Scholar]
- 3.Yamada Y, and Beltran H (2021). Clinical and Biological Features of Neuroendocrine Prostate Cancer. Curr Oncol Rep 23, 15. 10.1007/s11912-020-01003-9. [DOI] [PMC free article] [PubMed] [Google Scholar]
- 4.Balanis NG, Sheu KM, Esedebe FN, Patel SJ, Smith BA, Park JW, Alhani S, Gomperts BN, Huang J, Witte ON, and Graeber TG (2019). Pan-cancer Convergence to a Small-Cell Neuroendocrine Phenotype that Shares Susceptibilities with Hematological Malignancies. Cancer Cell 36, 17–34 e17. 10.1016/j.ccell.2019.06.005. [DOI] [PMC free article] [PubMed] [Google Scholar]
- 5.Cejas P, Xie Y, Font-Tello A, Lim K, Syamala S, Qiu X, Tewari AK, Shah N, Nguyen HM, Patel RA, et al. (2021). Subtype heterogeneity and epigenetic convergence in neuroendocrine prostate cancer. Nat Commun 12, 5775. 10.1038/s41467-021-26042-z. [DOI] [PMC free article] [PubMed] [Google Scholar]
- 6.Park JW, Lee JK, Sheu KM, Wang L, Balanis NG, Nguyen K, Smith BA, Cheng C, Tsai BL, Cheng DH, et al. (2018). Reprogramming normal human epithelial tissues to a common, lethal neuroendocrine cancer lineage. Science 362, 91–95. 10.1126/science.aat5749. [DOI] [PMC free article] [PubMed] [Google Scholar]
- 7.Wang L, Smith BA, Balanis NG, Tsai BL, Nguyen K, Cheng MW, Obusan MB, Esedebe FN, Patel SJ, Zhang H, et al. (2020). A genetically defined disease model reveals that urothelial cells can initiate divergent bladder cancer phenotypes. Proc Natl Acad Sci U S A 117, 563–572. 10.1073/pnas.1915770117. [DOI] [PMC free article] [PubMed] [Google Scholar]
- 8.Aggarwal R, Huang J, Alumkal JJ, Zhang L, Feng FY, Thomas GV, Weinstein AS, Friedl V, Zhang C, Witte ON, et al. (2018). Clinical and Genomic Characterization of Treatment-Emergent Small-Cell Neuroendocrine Prostate Cancer: A Multi-institutional Prospective Study. J Clin Oncol 36, 2492–2503. 10.1200/JCO.2017.77.6880. [DOI] [PMC free article] [PubMed] [Google Scholar]
- 9.Dicken H, Hensley PJ, and Kyprianou N (2019). Prostate tumor neuroendocrine differentiation via EMT: The road less traveled. Asian J Urol 6, 82–90. 10.1016/j.ajur.2018.11.001. [DOI] [PMC free article] [PubMed] [Google Scholar]
- 10.Beltran H, Hruszkewycz A, Scher HI, Hildesheim J, Isaacs J, Yu EY, Kelly K, Lin D, Dicker A, Arnold J, et al. (2019). The Role of Lineage Plasticity in Prostate Cancer Therapy Resistance. Clin Cancer Res 25, 6916–6924. 10.1158/1078-0432.CCR-19-1423. [DOI] [PMC free article] [PubMed] [Google Scholar]
- 11.Davies A, Zoubeidi A, and Selth LA (2020). The epigenetic and transcriptional landscape of neuroendocrine prostate cancer. Endocr Relat Cancer 27, R35–R50. 10.1530/ERC-19-0420. [DOI] [PubMed] [Google Scholar]
- 12.Ku SY, Rosario S, Wang Y, Mu P, Seshadri M, Goodrich ZW, Goodrich MM, Labbe DP, Gomez EC, Wang J, et al. (2017). Rb1 and Trp53 cooperate to suppress prostate cancer lineage plasticity, metastasis, and antiandrogen resistance. Science 355, 78–83. 10.1126/science.aah4199. [DOI] [PMC free article] [PubMed] [Google Scholar]
- 13.Mu P, Zhang Z, Benelli M, Karthaus WR, Hoover E, Chen CC, Wongvipat J, Ku SY, Gao D, Cao Z, et al. (2017). SOX2 promotes lineage plasticity and antiandrogen resistance in TP53- and RB1-deficient prostate cancer. Science 355, 84–88. 10.1126/science.aah4307. [DOI] [PMC free article] [PubMed] [Google Scholar]
- 14.Adams EJ, Karthaus WR, Hoover E, Liu D, Gruet A, Zhang Z, Cho H, DiLoreto R, Chhangawala S, Liu Y, et al. (2019). FOXA1 mutations alter pioneering activity, differentiation and prostate cancer phenotypes. Nature 571, 408–412. 10.1038/s41586-019-1318-9. [DOI] [PMC free article] [PubMed] [Google Scholar]
- 15.Parolia A, Cieslik M, Chu SC, Xiao L, Ouchi T, Zhang Y, Wang X, Vats P, Cao X, Pitchiaya S, et al. (2019). Distinct structural classes of activating FOXA1 alterations in advanced prostate cancer. Nature 571, 413–418. 10.1038/s41586-019-1347-4. [DOI] [PMC free article] [PubMed] [Google Scholar]
- 16.Guo H, Ci X, Ahmed M, Hua JT, Soares F, Lin D, Puca L, Vosoughi A, Xue H, Li E, et al. (2019). ONECUT2 is a driver of neuroendocrine prostate cancer. Nat Commun 10, 278. 10.1038/s41467-018-08133-6. [DOI] [PMC free article] [PubMed] [Google Scholar]
- 17.Rotinen M, You S, Yang J, Coetzee SG, Reis-Sobreiro M, Huang WC, Huang F, Pan X, Yanez A, Hazelett DJ, et al. (2018). ONECUT2 is a targetable master regulator of lethal prostate cancer that suppresses the androgen axis. Nat Med 24, 1887–1898. 10.1038/s41591-018-0241-1. [DOI] [PMC free article] [PubMed] [Google Scholar]
- 18.Ireland AS, Micinski AM, Kastner DW, Guo B, Wait SJ, Spainhower KB, Conley CC, Chen OS, Guthrie MR, Soltero D, et al. (2020). MYC Drives Temporal Evolution of Small Cell Lung Cancer Subtypes by Reprogramming Neuroendocrine Fate. Cancer Cell 38, 60–78 e12. 10.1016/j.ccell.2020.05.001. [DOI] [PMC free article] [PubMed] [Google Scholar]
- 19.Marjanovic ND, Hofree M, Chan JE, Canner D, Wu K, Trakala M, Hartmann GG, Smith OC, Kim JY, Evans KV, et al. (2020). Emergence of a High-Plasticity Cell State during Lung Cancer Evolution. Cancer Cell 38, 229–246 e213. 10.1016/j.ccell.2020.06.012. [DOI] [PMC free article] [PubMed] [Google Scholar]
- 20.Garcia-Bellido A, and Santamaria P (1978). Developmental Analysis of the Achaete-Scute System of DROSOPHILA MELANOGASTER. Genetics 88, 469–486. 10.1093/genetics/88.3.469. [DOI] [PMC free article] [PubMed] [Google Scholar]
- 21.Garcia-Bellido A, and de Celis JF (2009). The complex tale of the achaete-scute complex: a paradigmatic case in the analysis of gene organization and function during development. Genetics 182, 631–639. 10.1534/genetics.109.104083. [DOI] [PMC free article] [PubMed] [Google Scholar]
- 22.Borges M, Linnoila RI, van de Velde HJ, Chen H, Nelkin BD, Mabry M, Baylin SB, and Ball DW (1997). An achaete-scute homologue essential for neuroendocrine differentiation in the lung. Nature 386, 852–855. 10.1038/386852a0. [DOI] [PubMed] [Google Scholar]
- 23.Borromeo MD, Savage TK, Kollipara RK, He M, Augustyn A, Osborne JK, Girard L, Minna JD, Gazdar AF, Cobb MH, and Johnson JE (2016). ASCL1 and NEUROD1 Reveal Heterogeneity in Pulmonary Neuroendocrine Tumors and Regulate Distinct Genetic Programs. Cell Rep 16, 1259–1272. 10.1016/j.celrep.2016.06.081. [DOI] [PMC free article] [PubMed] [Google Scholar]
- 24.Nouruzi S, Ganguli D, Tabrizian N, Kobelev M, Sivak O, Namekawa T, Thaper D, Baca SC, Freedman ML, Aguda A, et al. (2022). ASCL1 activates neuronal stem cell-like lineage programming through remodeling of the chromatin landscape in prostate cancer. Nat Commun 13, 2282. 10.1038/s41467-022-29963-5. [DOI] [PMC free article] [PubMed] [Google Scholar]
- 25.Guillemot F, Nagy A, Auerbach A, Rossant J, and Joyner AL (1994). Essential role of Mash-2 in extraembryonic development. Nature 371, 333–336. 10.1038/371333a0. [DOI] [PubMed] [Google Scholar]
- 26.Kinoshita M, Li MA, Barber M, Mansfield W, Dietmann S, and Smith A (2021). Disabling de novo DNA methylation in embryonic stem cells allows an illegitimate fate trajectory. Proc Natl Acad Sci U S A 118. 10.1073/pnas.2109475118. [DOI] [PMC free article] [PubMed] [Google Scholar]
- 27.Murata K, Jadhav U, Madha S, van Es J, Dean J, Cavazza A, Wucherpfennig K, Michor F, Clevers H, and Shivdasani RA (2020). Ascl2-Dependent Cell Dedifferentiation Drives Regeneration of Ablated Intestinal Stem Cells. Cell Stem Cell 26, 377–390 e376. 10.1016/j.stem.2019.12.011. [DOI] [PMC free article] [PubMed] [Google Scholar]
- 28.Stange DE, Engel F, Longerich T, Koo BK, Koch M, Delhomme N, Aigner M, Toedt G, Schirmacher P, Lichter P, et al. (2010). Expression of an ASCL2 related stem cell signature and IGF2 in colorectal cancer liver metastases with 11p15.5 gain. Gut 59, 1236–1244. 10.1136/gut.2009.195701. [DOI] [PubMed] [Google Scholar]
- 29.van der Flier LG, van Gijn ME, Hatzis P, Kujala P, Haegebarth A, Stange DE, Begthel H, van den Born M, Guryev V, Oving I, et al. (2009). Transcription factor achaete scute-like 2 controls intestinal stem cell fate. Cell 136, 903–912. 10.1016/j.cell.2009.01.031. [DOI] [PubMed] [Google Scholar]
- 30.Zhu R, Yang Y, Tian Y, Bai J, Zhang X, Li X, Peng Z, He Y, Chen L, Pan Q, et al. (2012). Ascl2 knockdown results in tumor growth arrest by miRNA-302b-related inhibition of colon cancer progenitor cells. PLoS One 7, e32170. 10.1371/journal.pone.0032170. [DOI] [PMC free article] [PubMed] [Google Scholar]
- 31.Brady NJ, Bagadion AM, Singh R, Conteduca V, Van Emmenis L, Arceci E, Pakula H, Carelli R, Khani F, Bakht M, et al. (2021). Temporal evolution of cellular heterogeneity during the progression to advanced AR-negative prostate cancer. Nat Commun 12, 3372. 10.1038/s41467-021-23780-y. [DOI] [PMC free article] [PubMed] [Google Scholar]
- 32.George J, Lim JS, Jang SJ, Cun Y, Ozretic L, Kong G, Leenders F, Lu X, Fernandez-Cuesta L, Bosco G, et al. (2015). Comprehensive genomic profiles of small cell lung cancer. Nature 524, 47–53. 10.1038/nature14664. [DOI] [PMC free article] [PubMed] [Google Scholar]
- 33.Beltran H, Prandi D, Mosquera JM, Benelli M, Puca L, Cyrta J, Marotz C, Giannopoulou E, Chakravarthi BV, Varambally S, et al. (2016). Divergent clonal evolution of castration-resistant neuroendocrine prostate cancer. Nat Med 22, 298–305. 10.1038/nm.4045. [DOI] [PMC free article] [PubMed] [Google Scholar]
- 34.Abida W, Cyrta J, Heller G, Prandi D, Armenia J, Coleman I, Cieslik M, Benelli M, Robinson D, Van Allen EM, et al. (2019). Genomic correlates of clinical outcome in advanced prostate cancer. Proc Natl Acad Sci U S A 116, 11428–11436. 10.1073/pnas.1902651116. [DOI] [PMC free article] [PubMed] [Google Scholar]
- 35.Labrecque MP, Coleman IM, Brown LG, True LD, Kollath L, Lakely B, Nguyen HM, Yang YC, da Costa RMG, Kaipainen A, et al. (2019). Molecular profiling stratifies diverse phenotypes of treatment-refractory metastatic castration-resistant prostate cancer. J Clin Invest 129, 4492–4505. 10.1172/JCI128212. [DOI] [PMC free article] [PubMed] [Google Scholar]
- 36.Sharp A, Welti JC, Lambros MBK, Dolling D, Rodrigues DN, Pope L, Aversa C, Figueiredo I, Fraser J, Ahmad Z, et al. (2019). Clinical Utility of Circulating Tumour Cell Androgen Receptor Splice Variant-7 Status in Metastatic Castration-resistant Prostate Cancer. Eur Urol 76, 676–685. 10.1016/j.eururo.2019.04.006. [DOI] [PubMed] [Google Scholar]
- 37.Lambert SA, Jolma A, Campitelli LF, Das PK, Yin Y, Albu M, Chen X, Taipale J, Hughes TR, and Weirauch MT (2018). The Human Transcription Factors. Cell 175, 598–599. 10.1016/j.cell.2018.09.045. [DOI] [PubMed] [Google Scholar]
- 38.Buenrostro JD, Giresi PG, Zaba LC, Chang HY, and Greenleaf WJ (2013). Transposition of native chromatin for fast and sensitive epigenomic profiling of open chromatin, DNA-binding proteins and nucleosome position. Nat Methods 10, 1213–1218. 10.1038/nmeth.2688. [DOI] [PMC free article] [PubMed] [Google Scholar]
- 39.Richard A, Boullu L, Herbach U, Bonnafoux A, Morin V, Vallin E, Guillemin A, Papili Gao N, Gunawan R, Cosette J, et al. (2016). Single-Cell-Based Analysis Highlights a Surge in Cell-to-Cell Molecular Variability Preceding Irreversible Commitment in a Differentiation Process. PLoS Biol 14, e1002585. 10.1371/journal.pbio.1002585. [DOI] [PMC free article] [PubMed] [Google Scholar]
- 40.Shannon CE (1997). The mathematical theory of communication. 1963. MD Comput 14, 306–317. [PubMed] [Google Scholar]
- 41.van Heeringen SJ, and Veenstra GJ (2011). GimmeMotifs: a de novo motif prediction pipeline for ChIP-sequencing experiments. Bioinformatics 27, 270–271. 10.1093/bioinformatics/btq636. [DOI] [PMC free article] [PubMed] [Google Scholar]
- 42.Smith BA, Balanis NG, Nanjundiah A, Sheu KM, Tsai BL, Zhang Q, Park JW, Thompson M, Huang J, Witte ON, and Graeber TG (2018). A Human Adult Stem Cell Signature Marks Aggressive Variants across Epithelial Cancers. Cell Rep 24, 3353–3366 e3355. 10.1016/j.celrep.2018.08.062. [DOI] [PMC free article] [PubMed] [Google Scholar]
- 43.Han M, Li F, Zhang Y, Dai P, He J, Li Y, Zhu Y, Zheng J, Huang H, Bai F, and Gao D (2022). FOXA2 drives lineage plasticity and KIT pathway activation in neuroendocrine prostate cancer. Cancer Cell 40, 1306–1323 e1308. 10.1016/j.ccell.2022.10.011. [DOI] [PubMed] [Google Scholar]
- 44.Park JW, Lee JK, Witte ON, and Huang J (2017). FOXA2 is a sensitive and specific marker for small cell neuroendocrine carcinoma of the prostate. Mod Pathol 30, 1262–1272. 10.1038/modpathol.2017.44. [DOI] [PMC free article] [PubMed] [Google Scholar]
- 45.Sreekumar A, and Saini S (2023). Role of transcription factors and chromatin modifiers in driving lineage reprogramming in treatment-induced neuroendocrine prostate cancer. Front Cell Dev Biol 11, 1075707. 10.3389/fcell.2023.1075707. [DOI] [PMC free article] [PubMed] [Google Scholar]
- 46.Rudin CM, Poirier JT, Byers LA, Dive C, Dowlati A, George J, Heymach JV, Johnson JE, Lehman JM, MacPherson D, et al. (2019). Molecular subtypes of small cell lung cancer: a synthesis of human and mouse model data. Nat Rev Cancer 19, 289–297. 10.1038/s41568-019-0133-9. [DOI] [PMC free article] [PubMed] [Google Scholar]
- 47.Cheng S, Prieto-Dominguez N, Yang S, Connelly ZM, StPierre S, Rushing B, Watkins A, Shi L, Lakey M, Baiamonte LB, et al. (2020). The expression of YAP1 is increased in high-grade prostatic adenocarcinoma but is reduced in neuroendocrine prostate cancer. Prostate Cancer Prostatic Dis 23, 661–669. 10.1038/s41391-020-0229-z. [DOI] [PMC free article] [PubMed] [Google Scholar]
- 48.Aran D, Looney AP, Liu L, Wu E, Fong V, Hsu A, Chak S, Naikawadi RP, Wolters PJ, Abate AR, et al. (2019). Reference-based analysis of lung single-cell sequencing reveals a transitional profibrotic macrophage. Nat Immunol 20, 163–172. 10.1038/s41590-018-0276-y. [DOI] [PMC free article] [PubMed] [Google Scholar]
- 49.He MX, Cuoco MS, Crowdis J, Bosma-Moody A, Zhang Z, Bi K, Kanodia A, Su MJ, Ku SY, Garcia MM, et al. (2021). Transcriptional mediators of treatment resistance in lethal prostate cancer. Nat Med 27, 426–433. 10.1038/s41591-021-01244-6. [DOI] [PMC free article] [PubMed] [Google Scholar]
- 50.Chan JM, Zaidi S, Love JR, Zhao JL, Setty M, Wadosky KM, Gopalan A, Choo ZN, Persad S, Choi J, et al. (2022). Lineage plasticity in prostate cancer depends on JAK/STAT inflammatory signaling. Science 377, 1180–1191. 10.1126/science.abn0478. [DOI] [PMC free article] [PubMed] [Google Scholar]
- 51.Dong B, Miao J, Wang Y, Luo W, Ji Z, Lai H, Zhang M, Cheng X, Wang J, Fang Y, et al. (2020). Single-cell analysis supports a luminal-neuroendocrine transdifferentiation in human prostate cancer. Commun Biol 3, 778. 10.1038/s42003-020-01476-1. [DOI] [PMC free article] [PubMed] [Google Scholar]
- 52.Qiu X, Mao Q, Tang Y, Wang L, Chawla R, Pliner HA, and Trapnell C (2017). Reversed graph embedding resolves complex single-cell trajectories. Nat Methods 14, 979–982. 10.1038/nmeth.4402. [DOI] [PMC free article] [PubMed] [Google Scholar]
- 53.Bergen V, Lange M, Peidli S, Wolf FA, and Theis FJ (2020). Generalizing RNA velocity to transient cell states through dynamical modeling. Nat Biotechnol 38, 1408–1414. 10.1038/s41587-020-0591-3. [DOI] [PubMed] [Google Scholar]
- 54.Barker N, van Es JH, Kuipers J, Kujala P, van den Born M, Cozijnsen M, Haegebarth A, Korving J, Begthel H, Peters PJ, and Clevers H (2007). Identification of stem cells in small intestine and colon by marker gene Lgr5. Nature 449, 1003–1007. 10.1038/nature06196. [DOI] [PubMed] [Google Scholar]
- 55.Margolin AA, Nemenman I, Basso K, Wiggins C, Stolovitzky G, Dalla Favera R, and Califano A (2006). ARACNE: an algorithm for the reconstruction of gene regulatory networks in a mammalian cellular context. BMC Bioinformatics 7 Suppl 1, S7. 10.1186/1471-2105-7-S1-S7. [DOI] [PMC free article] [PubMed] [Google Scholar]
- 56.Gay CM, Stewart CA, Park EM, Diao L, Groves SM, Heeke S, Nabet BY, Fujimoto J, Solis LM, Lu W, et al. (2021). Patterns of transcription factor programs and immune pathway activation define four major subtypes of SCLC with distinct therapeutic vulnerabilities. Cancer Cell 39, 346–360 e347. 10.1016/j.ccell.2020.12.014. [DOI] [PMC free article] [PubMed] [Google Scholar]
- 57.Tang F, Xu D, Wang S, Wong CK, Martinez-Fundichely A, Lee CJ, Cohen S, Park J, Hill CE, Eng K, et al. (2022). Chromatin profiles classify castration-resistant prostate cancers suggesting therapeutic targets. Science 376, eabe1505. 10.1126/science.abe1505. [DOI] [PMC free article] [PubMed] [Google Scholar]
- 58.Heinz S, Benner C, Spann N, Bertolino E, Lin YC, Laslo P, Cheng JX, Murre C, Singh H, and Glass CK (2010). Simple combinations of lineage-determining transcription factors prime cis-regulatory elements required for macrophage and B cell identities. Mol Cell 38, 576–589. 10.1016/j.molcel.2010.05.004. [DOI] [PMC free article] [PubMed] [Google Scholar]
- 59.Jackstadt R, Roh S, Neumann J, Jung P, Hoffmann R, Horst D, Berens C, Bornkamm GW, Kirchner T, Menssen A, and Hermeking H (2013). AP4 is a mediator of epithelial-mesenchymal transition and metastasis in colorectal cancer. J Exp Med 210, 1331–1350. 10.1084/jem.20120812. [DOI] [PMC free article] [PubMed] [Google Scholar]
- 60.Kim MY, Jeong BC, Lee JH, Kee HJ, Kook H, Kim NS, Kim YH, Kim JK, Ahn KY, and Kim KK (2006). A repressor complex, AP4 transcription factor and geminin, negatively regulates expression of target genes in nonneuronal cells. Proc Natl Acad Sci U S A 103, 13074–13079. 10.1073/pnas.0601915103. [DOI] [PMC free article] [PubMed] [Google Scholar]
- 61.Skene PJ, Henikoff JG, and Henikoff S (2018). Targeted in situ genome-wide profiling with high efficiency for low cell numbers. Nat Protoc 13, 1006–1019. 10.1038/nprot.2018.015. [DOI] [PubMed] [Google Scholar]
- 62.Rudin CM, Brambilla E, Faivre-Finn C, and Sage J (2021). Small-cell lung cancer. Nat Rev Dis Primers 7, 3. 10.1038/s41572-020-00235-0. [DOI] [PMC free article] [PubMed] [Google Scholar]
- 63.Schaffer BE, Park KS, Yiu G, Conklin JF, Lin C, Burkhart DL, Karnezis AN, Sweet-Cordero EA, and Sage J (2010). Loss of p130 accelerates tumor development in a mouse model for human small-cell lung carcinoma. Cancer Res 70, 3877–3883. 10.1158/0008-5472.CAN-09-4228. [DOI] [PMC free article] [PubMed] [Google Scholar]
- 64.Jia D, Augert A, Kim DW, Eastwood E, Wu N, Ibrahim AH, Kim KB, Dunn CT, Pillai SPS, Gazdar AF, et al. (2018). Crebbp Loss Drives Small Cell Lung Cancer and Increases Sensitivity to HDAC Inhibition. Cancer Discov 8, 1422–1437. 10.1158/2159-8290.CD-18-0385. [DOI] [PMC free article] [PubMed] [Google Scholar]
- 65.Bishop JL, Thaper D, Vahid S, Davies A, Ketola K, Kuruma H, Jama R, Nip KM, Angeles A, Johnson F, et al. (2017). The Master Neural Transcription Factor BRN2 Is an Androgen Receptor-Suppressed Driver of Neuroendocrine Differentiation in Prostate Cancer. Cancer Discov 7, 54–71. 10.1158/2159-8290.CD-15-1263. [DOI] [PubMed] [Google Scholar]
- 66.Zou M, Toivanen R, Mitrofanova A, Floch N, Hayati S, Sun Y, Le Magnen C, Chester D, Mostaghel EA, Califano A, et al. (2017). Transdifferentiation as a Mechanism of Treatment Resistance in a Mouse Model of Castration-Resistant Prostate Cancer. Cancer Discov 7, 736–749. 10.1158/2159-8290.CD-16-1174. [DOI] [PMC free article] [PubMed] [Google Scholar]
- 67.Faugeroux V, Pailler E, Oulhen M, Deas O, Brulle-Soumare L, Hervieu C, Marty V, Alexandrova K, Andree KC, Stoecklein NH, et al. (2020). Genetic characterization of a unique neuroendocrine transdifferentiation prostate circulating tumor cell-derived eXplant model. Nat Commun 11, 1884. 10.1038/s41467-020-15426-2. [DOI] [PMC free article] [PubMed] [Google Scholar]
- 68.Tsoi J, Robert L, Paraiso K, Galvan C, Sheu KM, Lay J, Wong DJL, Atefi M, Shirazi R, Wang X, et al. (2018). Multi-stage Differentiation Defines Melanoma Subtypes with Differential Vulnerability to Drug-Induced Iron-Dependent Oxidative Stress. Cancer Cell 33, 890–904 e895. 10.1016/j.ccell.2018.03.017. [DOI] [PMC free article] [PubMed] [Google Scholar]
- 69.Deng Q, Ramskold D, Reinius B, and Sandberg R (2014). Single-cell RNA-seq reveals dynamic, random monoallelic gene expression in mammalian cells. Science 343, 193–196. 10.1126/science.1245316. [DOI] [PubMed] [Google Scholar]
- 70.Basili D, Zhang JL, Herbert J, Kroll K, Denslow ND, Martyniuk CJ, Falciani F, and Antczak P (2018). In Silico Computational Transcriptomics Reveals Novel Endocrine Disruptors in Largemouth Bass ( Micropterus salmoides). Environ Sci Technol 52, 7553–7565. 10.1021/acs.est.8b02805. [DOI] [PubMed] [Google Scholar]
- 71.Jiang S, Williams K, Kong X, Zeng W, Nguyen NV, Ma X, Tawil R, Yokomori K, and Mortazavi A (2020). Single-nucleus RNA-seq identifies divergent populations of FSHD2 myotube nuclei. PLoS Genet 16, e1008754. 10.1371/journal.pgen.1008754. [DOI] [PMC free article] [PubMed] [Google Scholar]
- 72.Kassambara A, Reme T, Jourdan M, Fest T, Hose D, Tarte K, and Klein B (2015). GenomicScape: an easy-to-use web tool for gene expression data analysis. Application to investigate the molecular events in the differentiation of B cells into plasma cells. PLoS Comput Biol 11, e1004077. 10.1371/journal.pcbi.1004077. [DOI] [PMC free article] [PubMed] [Google Scholar]
- 73.O’Meara CC, Wamstad JA, Gladstone RA, Fomovsky GM, Butty VL, Shrikumar A, Gannon JB, Boyer LA, and Lee RT (2015). Transcriptional reversion of cardiac myocyte fate during mammalian cardiac regeneration. Circ Res 116, 804–815. 10.1161/CIRCRESAHA.116.304269. [DOI] [PMC free article] [PubMed] [Google Scholar]
- 74.Yan L, Yang M, Guo H, Yang L, Wu J, Li R, Liu P, Lian Y, Zheng X, Yan J, et al. (2013). Single-cell RNA-Seq profiling of human preimplantation embryos and embryonic stem cells. Nature Structural & Molecular Biology 20, 1131–1139. 10.1038/nsmb.2660. [DOI] [PubMed] [Google Scholar]
- 75.Ebisuya M, and Briscoe J (2018). What does time mean in development? Development 145. 10.1242/dev.164368. [DOI] [PMC free article] [PubMed] [Google Scholar]
- 76.Ivakhnitskaia E, Lin RW, Hamada K, and Chang C (2018). Timing of neuronal plasticity in development and aging. Wiley Interdiscip Rev Dev Biol 7. 10.1002/wdev.305. [DOI] [PMC free article] [PubMed] [Google Scholar]
- 77.Montavon T, and Soshnikova N (2014). Hox gene regulation and timing in embryogenesis. Semin Cell Dev Biol 34, 76–84. 10.1016/j.semcdb.2014.06.005. [DOI] [PubMed] [Google Scholar]
- 78.Huang YH, Klingbeil O, He XY, Wu XS, Arun G, Lu B, Somerville TDD, Milazzo JP, Wilkinson JE, Demerdash OE, et al. (2018). POU2F3 is a master regulator of a tuft cell-like variant of small cell lung cancer. Genes Dev 32, 915–928. 10.1101/gad.314815.118. [DOI] [PMC free article] [PubMed] [Google Scholar]
- 79.Castro DS, Skowronska-Krawczyk D, Armant O, Donaldson IJ, Parras C, Hunt C, Critchley JA, Nguyen L, Gossler A, Gottgens B, et al. (2006). Proneural bHLH and Brn proteins coregulate a neurogenic program through cooperative binding to a conserved DNA motif. Dev Cell 11, 831–844. 10.1016/j.devcel.2006.10.006. [DOI] [PubMed] [Google Scholar]
- 80.Weindorf SC, Taylor AS, Kumar-Sinha C, Robinson D, Wu YM, Cao X, Spratt DE, Kim MM, Lagstein A, Chinnaiyan AM, and Mehra R (2019). Metastatic castration resistant prostate cancer with squamous cell, small cell, and sarcomatoid elements-a clinicopathologic and genomic sequencing-based discussion. Med Oncol 36, 27. 10.1007/s12032-019-1250-8. [DOI] [PMC free article] [PubMed] [Google Scholar]
- 81.Lachmann A, Giorgi FM, Lopez G, and Califano A (2016). ARACNe-AP: gene network reverse engineering through adaptive partitioning inference of mutual information. Bioinformatics 32, 2233–2235. 10.1093/bioinformatics/btw216. [DOI] [PMC free article] [PubMed] [Google Scholar]
- 82.Drost J, Karthaus WR, Gao D, Driehuis E, Sawyers CL, Chen Y, and Clevers H (2016). Organoid culture systems for prostate epithelial and cancer tissue. Nat Protoc 11, 347–358. 10.1038/nprot.2016.006. [DOI] [PMC free article] [PubMed] [Google Scholar]
- 83.Shultz LD, Ishikawa F, and Greiner DL (2007). Humanized mice in translational biomedical research. Nat Rev Immunol 7, 118–130. 10.1038/nri2017. [DOI] [PubMed] [Google Scholar]
- 84.Seiler CY, Park JG, Sharma A, Hunter P, Surapaneni P, Sedillo C, Field J, Algar R, Price A, Steel J, et al. (2014). DNASU plasmid and PSI:Biology-Materials repositories: resources to accelerate biological research. Nucleic Acids Res 42, D1253–1260. 10.1093/nar/gkt1060. [DOI] [PMC free article] [PubMed] [Google Scholar]
- 85.Joung J, Konermann S, Gootenberg JS, Abudayyeh OO, Platt RJ, Brigham MD, Sanjana NE, and Zhang F (2017). Genome-scale CRISPR-Cas9 knockout and transcriptional activation screening. Nat Protoc 12, 828–863. 10.1038/nprot.2017.016. [DOI] [PMC free article] [PubMed] [Google Scholar]
- 86.Tiscornia G, Singer O, and Verma IM (2006). Production and purification of lentiviral vectors. Nat Protoc 1, 241–245. 10.1038/nprot.2006.37. [DOI] [PubMed] [Google Scholar]
- 87.Vivian J, Rao AA, Nothaft FA, Ketchum C, Armstrong J, Novak A, Pfeil J, Narkizian J, Deran AD, Musselman-Brown A, et al. (2017). Toil enables reproducible, open source, big biomedical data analyses. Nat Biotechnol 35, 314–316. 10.1038/nbt.3772. [DOI] [PMC free article] [PubMed] [Google Scholar]
- 88.Love MI, Huber W, and Anders S (2014). Moderated estimation of fold change and dispersion for RNA-seq data with DESeq2. Genome Biol 15, 550. 10.1186/s13059-014-0550-8. [DOI] [PMC free article] [PubMed] [Google Scholar]
- 89.Kuleshov MV, Jones MR, Rouillard AD, Fernandez NF, Duan Q, Wang Z, Koplev S, Jenkins SL, Jagodnik KM, Lachmann A, et al. (2016). Enrichr: a comprehensive gene set enrichment analysis web server 2016 update. Nucleic Acids Res 44, W90–97. 10.1093/nar/gkw377. [DOI] [PMC free article] [PubMed] [Google Scholar]
- 90.Quinlan AR, and Hall IM (2010). BEDTools: a flexible suite of utilities for comparing genomic features. Bioinformatics 26, 841–842. 10.1093/bioinformatics/btq033. [DOI] [PMC free article] [PubMed] [Google Scholar]
- 91.Ritchie ME, Phipson B, Wu D, Hu Y, Law CW, Shi W, and Smyth GK (2015). limma powers differential expression analyses for RNA-sequencing and microarray studies. Nucleic Acids Res 43, e47 10.1093/nar/gkv007. [DOI] [PMC free article] [PubMed] [Google Scholar]
- 92.Zerbino DR, Johnson N, Juettemann T, Wilder SP, and Flicek P (2014). WiggleTools: parallel processing of large collections of genome-wide datasets for visualization and statistical analysis. Bioinformatics 30, 1008–1009. 10.1093/bioinformatics/btt737. [DOI] [PMC free article] [PubMed] [Google Scholar]
- 93.Ramirez F, Ryan DP, Gruning B, Bhardwaj V, Kilpert F, Richter AS, Heyne S, Dundar F, and Manke T (2016). deepTools2: a next generation web server for deep-sequencing data analysis. Nucleic Acids Res 44, W160–165. 10.1093/nar/gkw257. [DOI] [PMC free article] [PubMed] [Google Scholar]
- 94.Stuart T, Butler A, Hoffman P, Hafemeister C, Papalexi E, Mauck WM 3rd, Hao Y, Stoeckius M, Smibert P, and Satija R (2019). Comprehensive Integration of Single-Cell Data. Cell 177, 1888–1902 e1821. 10.1016/j.cell.2019.05.031. [DOI] [PMC free article] [PubMed] [Google Scholar]
- 95.Greulich F, Mechtidou A, Horn T, and Uhlenhaut NH (2021). Protocol for using heterologous spike-ins to normalize for technical variation in chromatin immunoprecipitation. STAR Protoc 2, 100609. 10.1016/j.xpro.2021.100609. [DOI] [PMC free article] [PubMed] [Google Scholar]
Associated Data
This section collects any data citations, data availability statements, or supplementary materials included in this article.