Abstract
Exocytosis is an ultrafast cellular process which facilitates neuron–neuron communication in the brain. Microelectrode electrochemistry has been an essential tool for measuring fast exocytosis events with high temporal resolution and high sensitivity. Due to carbon fiber’s irreproducible and inhomogeneous surface conditions, however, it is often desirable to develop simple and reproducible modification schemes to enhance a microelectrode’s analytical performance for single-cell analysis. Here we present carbon-fiber microelectrodes (CFEs) modified with a thin film of electrodeposited gold for the detection of exocytosis from rat pheochromocytoma cells (PC12), a model cell line for neurosecretion. These new probes are made by a novel voltage-pulsing deposition procedure and demonstrate improved electron-transfer characteristics for catecholamine oxidation, and their fabrication is tractable for many different probe designs. When we applied the probes to the detection of catecholamine release, we found that they outperformed unmodified CFEs. Further, the improved performance was conserved at cells incubated with L-DOPA (l-3,4dihydroxyphenylalanine), a precursor to dopamine that increases the quantal size of the release events. Future use of this method may allow nanoelectrodes to be modified for highly sensitive detection of exocytosis from chemical synapses.
Graphical Abstract
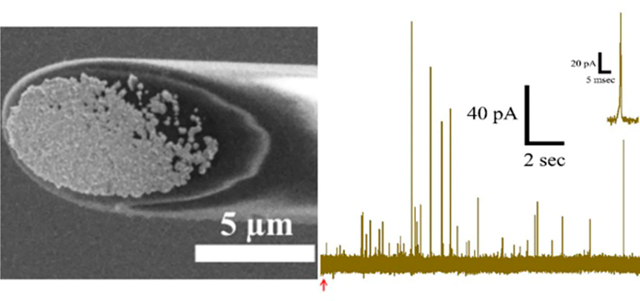
Electrochemical methods for the detection of exocytosis are centrally important to a quantitative understanding of chemical communication in the brain.1 The primary advantages of electrochemical measurements, such as amperometry, lie in their fast temporal resolution (sub-millisecond) and low limits of detection (e.g., a few thousand molecules).2,3 Amperometry with carbon-fiber microelectrodes (CFEs) has been applied for the past few decades to the detection of exocytosis from a variety of cell types, allowing quantification of neurotransmitter release from small synaptic vesicles (~50 nm diameter) of ventral midbrain neurons4,5 and large densecore vesicles [~130 nm radius in chromaffin cells,6 ~100 nm radius in pheochromocytoma (PC12) cells]7 of neuroendocrine cells.8,9 Carbon nanoelectrodes have also been used to measure neurotransmitter efflux from a neuromuscular junction10 and for intracellular measurements of vesicle content.11
While amperometric techniques have contributed significantly to our understanding of the biophysics of neurotransmitter release, such as the relationship between neurotransmitter content and vesicle size,12,13 how membrane dynamics constrain the rate of neurotransmitter release,14,15 and different vesicle fusion modes,16,17 several challenges remain in exocytosis research. First, diffusional broadening dramatically reduces signal-to-noise ratio (S/N),18 which has a strong negative effect on measurements of synaptic vesicles (due to their small quantal size)4,5 or array experiments, where several electrodes monitor a single cell or a group of cells.19,20 Second, CFE sensitivity has been increasingly scrutinized in the fast-scan cyclic voltammetry (FSCV) community,21,22 where low limits of detection are critical for accurate measurements of the concentration of dopamine and other analytes. Faster electron-transfer kinetics are desirable to increase S/N in these in vivo measurements as well as for in vitro measurements at neurons. Third, any electrode fabrication or modification that addresses the first two issues would need to be applicable to nanometric probes to have a broader impact given recent developments in single-cell research.10,11 For these reasons, we were interested in developing a facile electrode modification that improves electron transfer (which could concomitantly increase S/N via faster catecholamine oxidation) and be applied to existing frameworks for exocytosis detection.
The neurochemistry community has explored different electrode materials23–25 and modification schemes on CFEs using various nanomaterials, such as carbon nanotubes,26–28 graphene,29,30 carbon nanohorns,31 and metal nanoparticles.32 It is well-recognized that gold (Au) has improved sensing capabilities compared to CFEs, likely because of the higher availability of oxide groups relative to carbon,33 which are thought to facilitate the oxidation of catecholamines. Despite this, only a few examples exist in the literature of Au microelectrodes for catecholamine detection.33,34 Notably, our group previously demonstrated that modification of CFEs with Au nanoparticles could improve temporal characteristics of catecholamine detection,32 but the fabrication process was not tractable for other electrode scaffolds.
In this study, we endeavored to develop a fast, sensitive electrochemical sensor for measuring catecholamine release. We found that electrodeposition of gold onto CFE surfaces could be well-controlled, generating a reproducible layer of gold nanoparticles that significantly changed the electron transfer for dopamine. We then applied Au-CFEs to the measurement of catecholamine release from rat PC12 cells, a well-established model neuronal cell line.35 We observed a significant increase in the average amount of catecholamine released, and the phenomenon appears to be material-dependent. To test the generalizability of the probe, we augmented the catecholamine content of PC12 cells using L-DOPA, a precursor to dopamine, and found that Au-CFEs detected a similar relative change in neurotransmitter release. A mechanism for this behavior is explored and implications in exocytosis research discussed.
EXPERIMENTAL SECTION
Reagents and Materials.
Sodium chloride (NaCl), potassium chloride (KCl), magnesium chloride hexahydrate (MgCl2·6H2O), calcium chloride (CaCl2), HEPES (4-(2-hydroxyethyl)-1-piperazineethanesulfonic acid), glucose, dopamine hydrochloride, phosphate-buffered saline (PBS, 10×), and L-3,4-dihydroxyphenylalanine (L-DOPA) were purchased from Sigma. HAuCl4 was purchased as a 1% AuCl3 solution from Salt Lake Metals. All reagents used were reagent grade or better.
Microelectrode Preparation.
CFEs were prepared by aspirating a carbon fiber (5 μm) into a borosilicate glass capillary (1.2 mm o.d., 0.9 mm i.d., Sutter) that was pulled to a fine tip using a P97 pipet puller (Sutter). The microelectrode was cut and sealed in epoxy (Epoxy Technologies), followed by curing for 2 h at 80 °C and 2 h at 150 °C. CFEs were then polished at a 45° angle on a home-built micropipette beveler. CFEs were backfilled with 3 M KCl to establish electrical contact.
Electrodeposition and Characterization.
All potentials reported in this work were referenced to a Ag/AgCl electrode. CFEs were characterized with cyclic voltammetry (CV) (−0.4 to +0.6 V, 100 mV/s) in 0.1 mM dopamine (1× PBS, pH 7.4). Only electrodes with good electron-transfer kinetics and stable i–V curves were used subsequently. For electrodeposition, CFEs were immersed in freshly sonicated 10 mM HAuCl4, 0.5 M H2SO4 and subjected to the waveform specified in Figure 1A for 1500 cycles. Briefly, Edeposit was held for 0.1 s before stepping to Erest = +0.2 V for 0.1 s to allow AuCl4− ions to diffuse back to the electrode surface. Au-CFEs were characterized by CV in 0.5 M H2SO4 (−0.2 to +1.2 V, 100 mV/s). Only Au-CFEs with a gold oxide reduction peak were characterized again in 0.1 mM dopamine and used for experiments.
Figure 1.
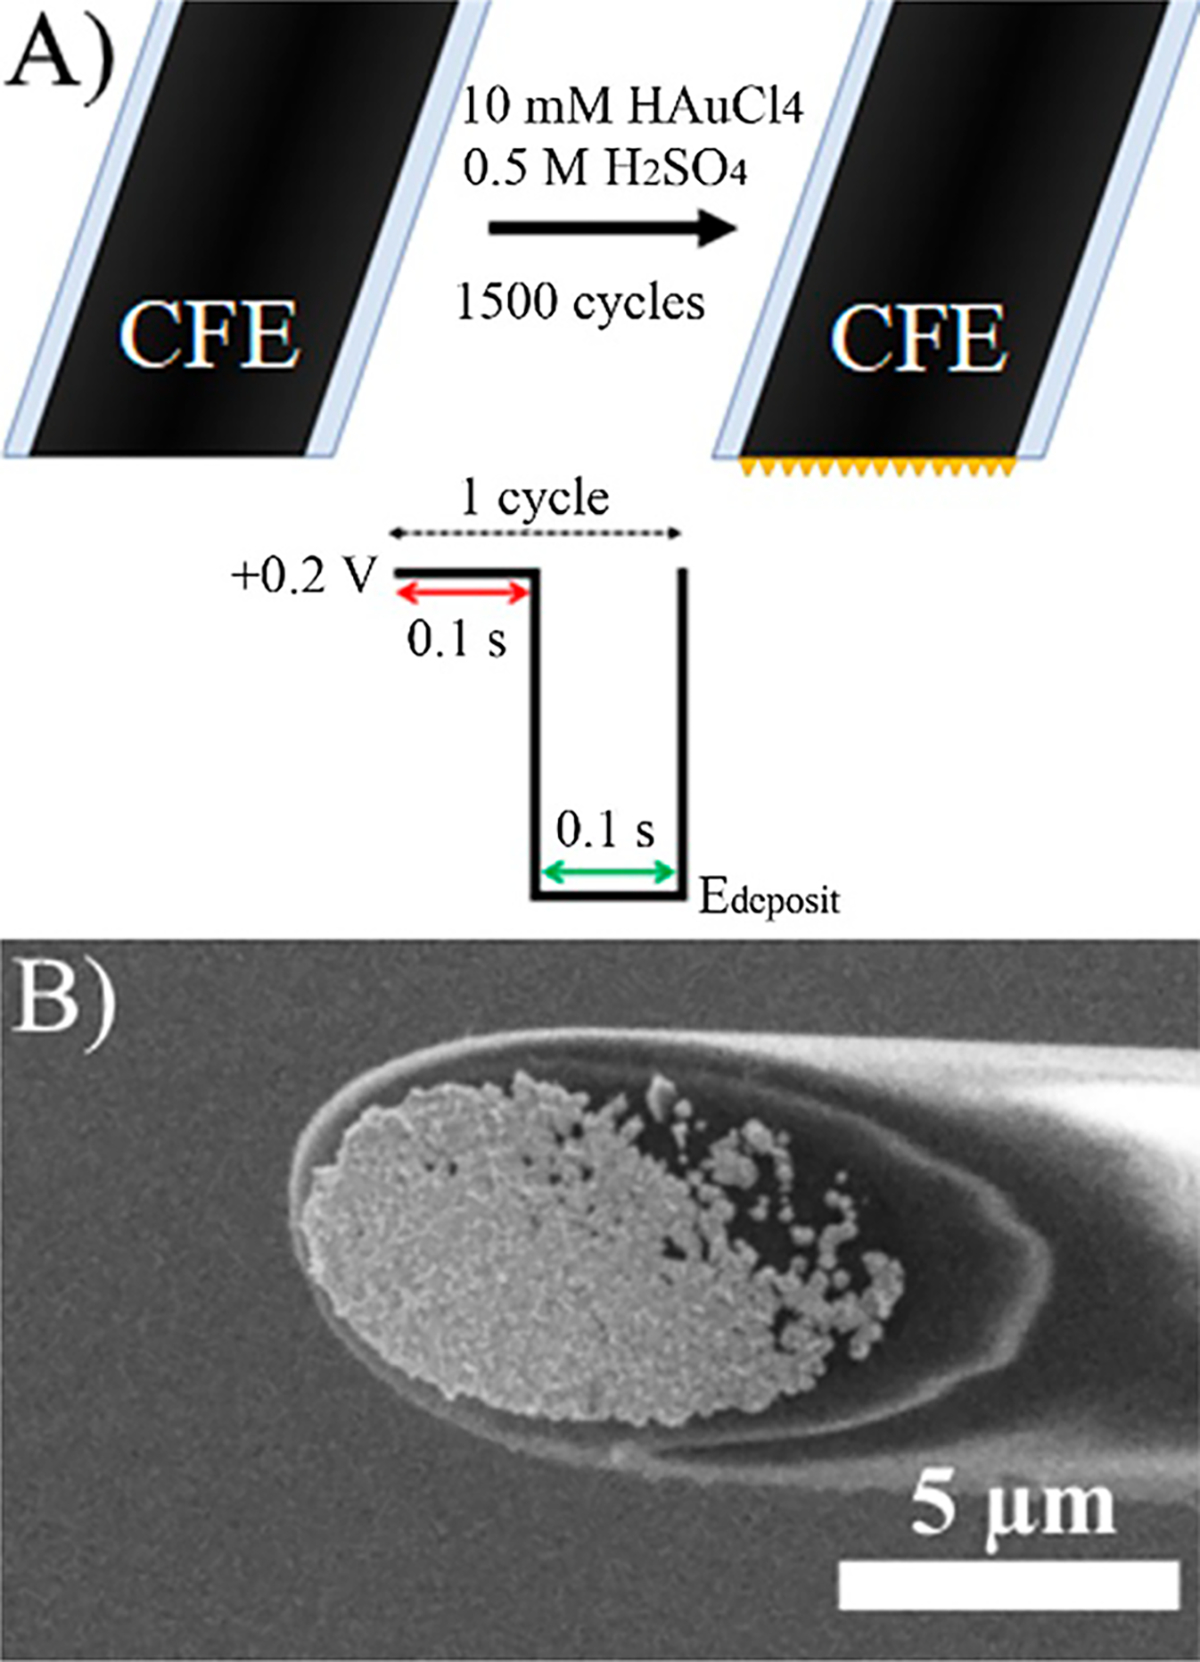
Fabrication of Au-CFEs. (A) Scheme for pulsed electrodeposition. (B) SEM image of an Au-CFE fabricated at Edeposit = −0.4 V.
Cell Culture.
Stock PC12 cells were generously provided by Professor Andrew Ewing (University of Gothenburg) and maintained as described previously.14 Briefly, PC12 cells were grown on mouse collagen IV-coated culture dishes (VWR) in supplemented RPMI-1640 medium. Cells were maintained in a 7% CO2, 37 °C atmosphere and subcultured approximately every 7–9 days or when confluency was reached. Cells were used for experiments between days 5 and 12 of subculturing.
Single-Cell Amperometry.
PC12 cells were bathed in prewarmed 37 °C isotonic saline (150 mM NaCl, 5 mM KCl, 1.2 mM MgCl2·6H2O, 2 mM CaCl2, 5 mM glucose, and 10 mM HEPES, pH 7.4) for all experiments. Exocytosis from PC12 cells was measured by gently lowering CFEs or Au-CFEs onto a cell of interest using a hydraulic micropositioner (MHW-3, Narishige). For CFEs, Eapp = +0.7 V, while for Au-CFEs, Eapp was stepped in 50 mV increments to assess the baseline current—we often observed a large increase in the baseline current prior to +0.7 V which we attributed to oxidation of Au in the presence of chloride.33 To avoid any change in the electrode surface, only potentials at which the baseline current was stable were used (Eapp = 0.4–0.7 V).
Cells were stimulated to exocytose using a 20 psi, 5 s pulse (FemtoJet; Eppendorf) of physiological saline with 100 mM K+ (iso-osmotically substituted with NaCl). Stimulation pipettes were cut to ~10 μm in diameter and positioned 30–50 μm from a cell. Each cell was stimulated once. Experiments were maintained at 37 ± 1 °C (Warner Instruments). For L-DOPA experiments, cells were preincubated with 100 μM L-DOPA in isotonic saline for 1 h.
Data Acquisition and Analysis.
Electrodes were held at Eapp versus Ag/AgCl using a commercial patch-clamp current amplifier (Axopatch 200B; Axon Instruments). The current was filtered at 2 kHz using an internal low-pass Bessel filter and sampled at 100 kHz using a Digidata 1322 digitizer (Axon Instruments). Exocytotic spikes and their characteristics, including the spike characteristics imax (peak amplitude, pA), t1/2 (full width of peak at half-maximum, ms), trise (10–90% max peak height, ms), tfall (90–10% max peak height, ms), and Q (integrated charge, fC) were identified using pClamp v10.6 software (Axon Instruments). Spikes were identified if the imax exceeded 5 times the standard deviation (SD) of the noise. All identified spikes were inspected, and unfit spikes were manually discarded (such as double or superimposed spikes).
Statistics were calculated by taking the mean of the median value from each cell measured.11 Statistical significance was assessed using the Mann–Whitney–Wilcoxon rank-sum U test (Mann–Whitney). The Kolmogorov–Smirnov test (KS test) was used to assess the differences in distributions. Statistics are reported as the mean ± SEM (standard error of the mean).
RESULTS AND DISCUSSION
Electrodeposition of Au onto CFEs.
Au was deposited onto freshly beveled CFEs using pulsed electrodeposition. Pulsed electrodeposition of metals has previously been shown to greatly enhance control over the morphology and quality of the electrodeposited metal layer.36 Compared with constant potential, pulsed deposition allows generation of more homogeneously distributed nucleation sites on the electrode. These nucleation sites also grow more evenly, as the metal salt near the electrode surface is consumed during the deposition period and replenished during the resting period.
Figure 1A shows the electrodeposition process. By alternating the potential between Erest = +0.2 V and Edeposit = −0.4 V at 100 ms intervals for 1500 cycles (total time Edeposit = 150 s), we found that we could achieve a reproducible metal layer consisting of many Au nanoparticles on beveled CFEs. Figure 1B shows a scanning electron microscopy (SEM) image of a Au-modified CFE (Au-CFE) fabricated at −0.4 V (for higher magnification, see Figure S1); many Au nanoclusters have grown on the CFE, increasing the surface area. The density and morphology of the deposited Au layer depend on the Edeposit as the rate of Au reduction increases at more cathodic potentials. This resulted in surface layers ranging from a few scattered Au nanoclusters (Edeposit = −0.3 V) to overgrowth with Au nanoclusters (Edeposit = −0.6 V) (data not shown).
Electrochemical Characterization.
We assessed the electrochemical performance of our Au-CFEs by recording CVs in 0.1 mM dopamine (Experimental Section). Figure 2A shows representative CVs (for additional examples, see Figure S2A–D), where Au-CFEs fabricated at different Edeposit are compared to a bare CFE. The most interesting result is a shift in the position of the oxidation wave of dopamine, which can be quantified by the E1/2, defined as the potential at 50% of the limiting current, iss. In conventional two-electrode systems, E1/2 is closely related to the formal potential, E°, of the redox reaction, while in bipolar electrochemical cells, such as the electrolyte-filled CFE, E1/2 is closely related to the difference of the two formal potentials of the redox reactions in and outside of the bipolar CFE.37
Figure 2.
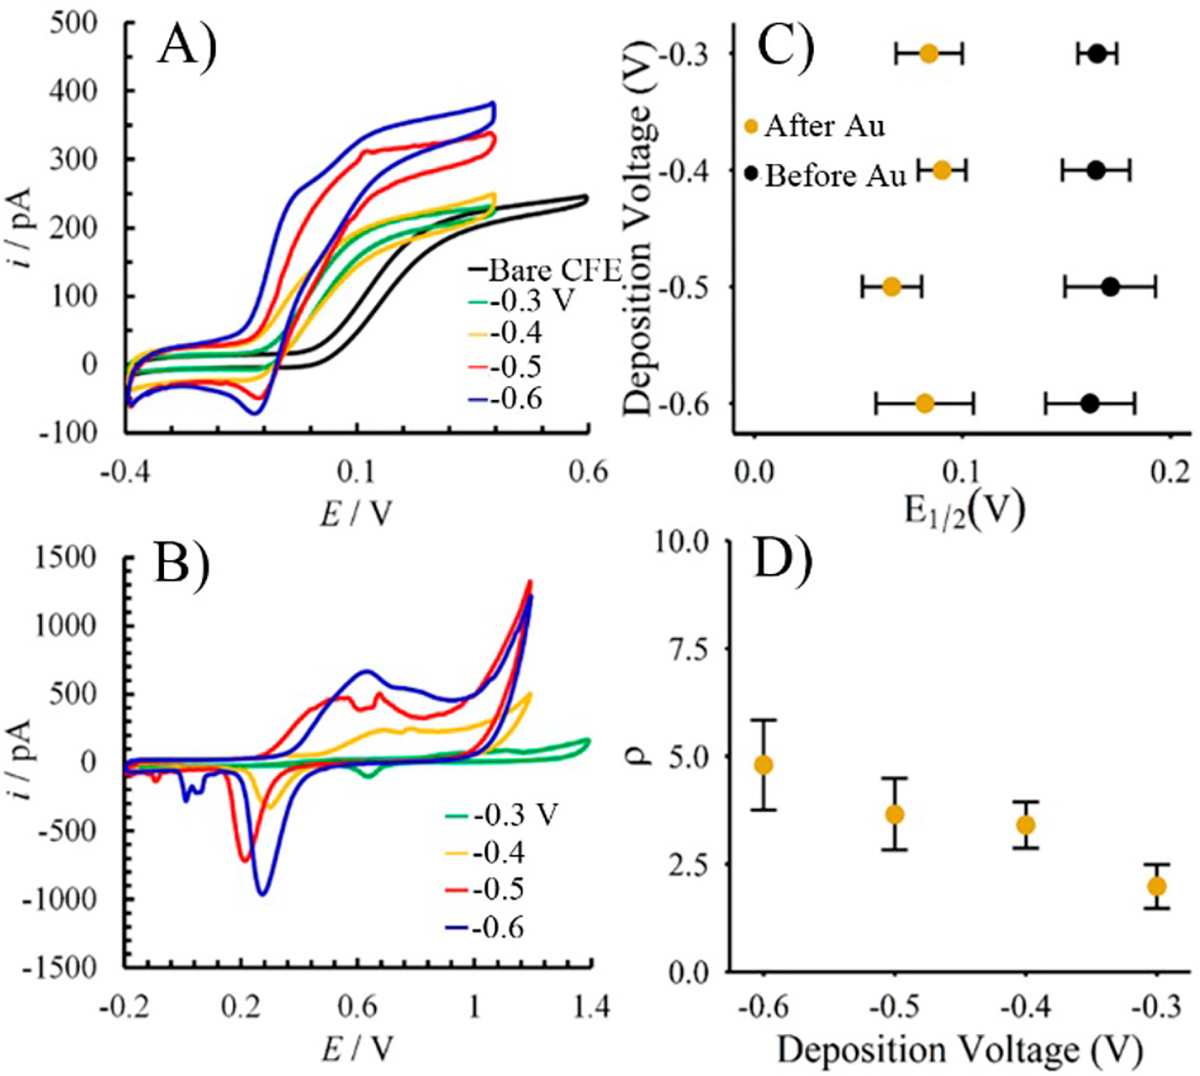
Electrochemical characterization of Au-CFEs. (A) Representative CVs in 0.1 mM dopamine of Au-CFEs fabricated at different potentials. The iss increases as more Au is deposited. (B) CVs in 0.5 M H2SO4 of the same electrodes as in panel A. (C) E1/2 shifts for dopamine oxidation as a function of deposition voltage. (D) Surface roughness (ρ) as a function of deposition voltage.
As summarized in Figure 2C, the E1/2 was always observed to shift negatively after Au deposition, even in the −0.3 V case where the gold layer was restricted to a few clusters of particles scattered across the CFE surface. To understand this, we compared the oxidation of dopamine on a solid Au ultramicroelectrode (UME) with a directly connected CFE and observed a negative shift in the oxidation wave of dopamine ~40 mV (data not shown). Thus, we posit that dopamine is likely oxidized preferentially on the gold surfaces, shifting the oxidation wave cathodically even at low surface densities. Though dopamine oxidation has an E°′ = +0.11 V versus SCE,38 one may notice that the E1/2 for bare CFEs averages ~+0.16 V (Figure 2C and Table S1). This is due to CFE’s bipolar nature; we have shown that electrolyte-backfilled CFEs function as closed bipolar electrodes where an oxidation reaction on the outer pole (dopamine oxidation) must be coupled to a reduction reaction on the inner pole, which in this case is likely to be O2 reduction.39 The bipolar nature of our electrodes also had the effect of slowing the rate of the Au deposition and altering the position of the gold oxide reduction peaks in H2SO4 scans (Figure 2B).
We observed qualitatively that Au modification resulted in a faster rise time to iss in dopamine solution (Figure 2A). This was directly quantified following the procedures proposed by Mirkin and Bard by finding the ΔE1/4 = E1/4 − E1/2 and ΔE3/4 = E3/4 − E1/2 values, where E1/4 and E3/4 are the potentials at one-quarter and three-quarters of the steady-state limiting current iss, respectively.40 Table 1 shows the shift in the magnitude of the ΔE1/4 and ΔE3/4. At almost all Edeposit, ΔE1/4 and ΔE3/4 changed significantly compared to CFEs (p < 0.05, paired Mann–Whitney). As an inner-sphere redox molecule, dopamine oxidation is limited by adsorption to an available electron-transfer site (surface oxide groups).38 Given the higher availability of oxides on Au33 and the many possible angles of approach afforded by nanoclusters, we suspect adsorption/desorption is accelerated on Au-CFEs.
Table 1.
Electrode Characteristics Determined by CV Analysisa
| Edeposit (V) | n | ECSA (μm2) | ρ | ΔE1/2 (mV) | ΔE1/4 (mV) | ΔE3/4 (mV) |
|---|---|---|---|---|---|---|
| bare CFE | 14 | 277 ± 11b | 219 ± 9b | |||
| −0.3 | 10 | 55.0 ± 14.1 | 1.98 ± 0.51 | −80 ± 18 | 193 ± 10** | 155 ± 14** |
| −0.4 | 14 | 94.4 ± 14.8 | 3.41 ± 0.53 | −74 ± 15 | 207 ± 6** | 132 ± 17** |
| −0.5 | 12 | 101.1 ± 23.0 | 3.65 ± 0.83 | −105 ± 19 | 175 ± 14** | 147 ± 20* |
| −0.6 | 10 | 133.0 ± 28.9 | 4.80 ± 1.04 | −79 ± 27 | 170 ± 12** | 144 ± 12 |
ECSA and ρ are from H2SO4 CVs, and ΔE1/2, ΔE1/4, ΔE3/4 are from dopamine CVs. Significance of kinetic enhancement was assessed using paired Mann-Whitney test.
p < 0.01,
p < 0.05.
Bare CFE kinetic data corresponds to unmodified electrodes from the −0.4 V group.
The presence and quantity of Au was determined by scanning in 0.5 M H2SO4 (Figure 2B; for additional CVs, see Figure S3A–D). The charge of the oxide reduction peak was converted to electrochemical surface area (ECSA) via the value 390 μC/cm2.41 The roughness factor, ρ, could then be calculated by dividing the ECSA by the geometric area of the electrode (27.7 μm2 for a 5 μm CFE beveled at 45°). Varying the Edeposit changed the amount of deposited Au and the apparent surface roughness (Figure 2D). Table 1 shows the values obtained for the ECSA and ρ. Examining Figure 2B, one will notice a small reduction process occurring after the main gold oxide reduction peak (most prominently, Edeposit = −0.6 V). Given that the process became both more pronounced and common for more negative deposition potentials and our reference electrode for deposition was Ag/AgCl, we expect that this is related to deposition of Ag+ from solution onto the CFE surface.
Au-CFEs Are More Sensitive to Catecholamine Release from PC12 Cells.
Having characterized the Au-CFEs, we applied them to PC12 cells to assess their quality for the measurement of catecholamine release. In Figure 3, one can see a few amperometric traces recorded from electrodes of various Edeposit potentials (for additional traces, see Figure S4). Table 2 shows that the peak current, imax, has increased significantly for Edeposit = −0.4 V Au-CFEs. However, we expected to see a concomitant decrease in some of the temporal characteristics of the peaks detected, consistent with our previous study;32 rather, we observed that the average t1/2, trise, and tfall were similar between control and all Au-CFEs.
Figure 3.
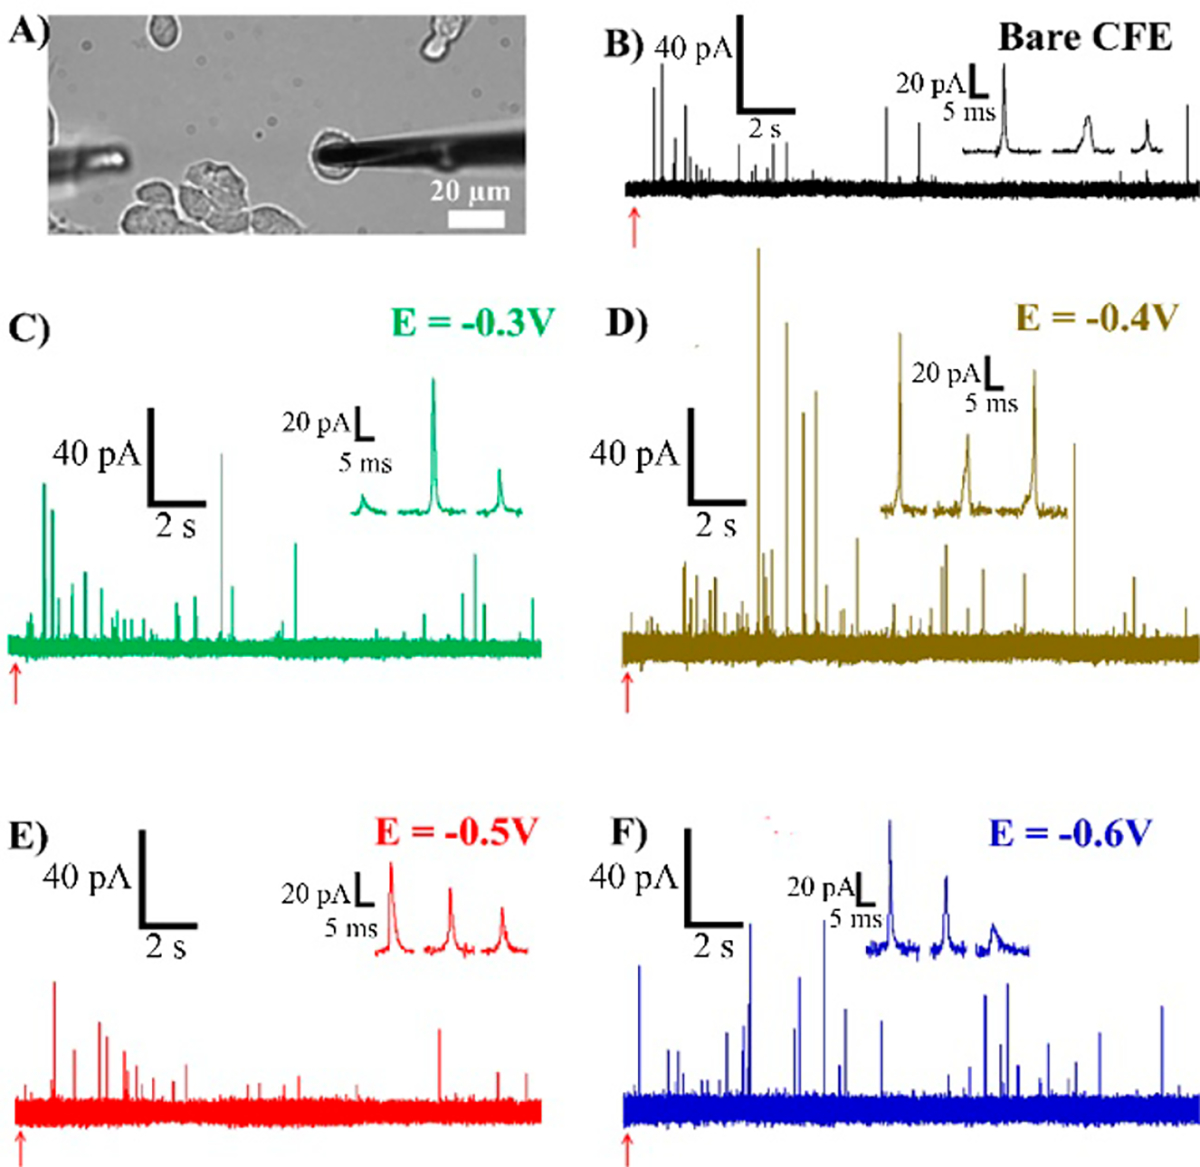
Single-cell amperometry. (A) Optical microscope picture of the experiment. The CFE (right) is lowered onto a PC12 cell and stimulated to release using the stimulation pipet (left, out of focus). (B–F) Example amperometric response using different probes. Stimulation is indicated with the red arrows. Inset shows three peaks from each trace.
Table 2.
Spike Characteristics Collected from Individual Exocytosis Events under Different Probe Conditionsa
| Edeposit (V) | events | imax (pA) | t1/2 (ms) | trise (ms) | tfall (ms) | Nmolecules (103) |
|---|---|---|---|---|---|---|
| CFE | 957 | 14.0 ± 1.5 | 0.88 ± 0.06 | 1.39 ± 0.57 | 1.22 ± 0.10 | 61.8 ± 4.1 |
| −0.3 | 575 | 16.0 ± 1.9 | 0.85 ± 0.08 | 0.81 ± 0.07 | 1.16 ± 0.14 | 64.0 ± 4.2 |
| −0.4 | 516 | 22.6 ± 1.8† | 1.05 ± 0.10 | 0.87 ± 0.07 | 1.36 ± 0.10 | 103.4 ± 5.8‡ |
| −0.5 | 406 | 14.1 ± 1.3 | 1.25 ± 0.14 | 0.84 ± 0.09 | 1.54 ± 0.23 | 77.2 ± 12.5 |
| −0.6 | 536 | 17.5 ± 1.5 | 0.99 ± 0.07 | 0.93 ± 0.06 | 1.44 ± 0.15 | 92 ± 9.9* |
p values were determined using Mann-Whitney rank-sum U test. Each probe was compared with bare CFE to determine significance.
= p <0.05,
= p < 0.01,
= p < 0.001,
= p < 0.0001.
Integration of the peak charge, Q, allows quantification of the number of molecules released (Nmolecules) via Faraday’s law, Q = nFN, where F = 96 485 C/mol is the Faraday’s constant, N is Avogadro’s number, and n = 2 is the number of electrons transferred per dopamine. The Nmolecules detected reached a maximum of 103 400 ± 5800 molecules with Au-CFEs fabricated at Edeposit = −0.4 V, which was significantly different (p < 0.0001, Mann–Whitney) than that detected on control CFEs (61 800 ± 4100 molecules). Our control value is a bit lower when compared to the literature,11 but we found it to be very reproducible. We expect this disparity may be due to subtle differences in cell culture conditions. Figure 4A shows the cumulative distribution of Nmolecules collected from each electrode sample, which allows use of the KS test to see whether two samples came from the same population. Interestingly, Edeposit = −0.3 V showed no significant difference from control, suggesting that a few scattered Au nanoparticles on the CFE surface are enough to change dopamine CV but cannot alter exocytosis detection from a cell. However, Edeposit = −0.4, −0.5, −0.6 V were all significantly different from bare CFEs (p < 0.0001, KS test), suggesting that a Au layer covering the electrode surface fundamentally alters the detection. Figure 4B shows the frequency-normalized distribution of Nmolecules, and Figure 4C shows the frequency-normalized distribution of Nmolecules1/3, which may be fit by a Gaussian, consistent with the literature.35
Figure 4.
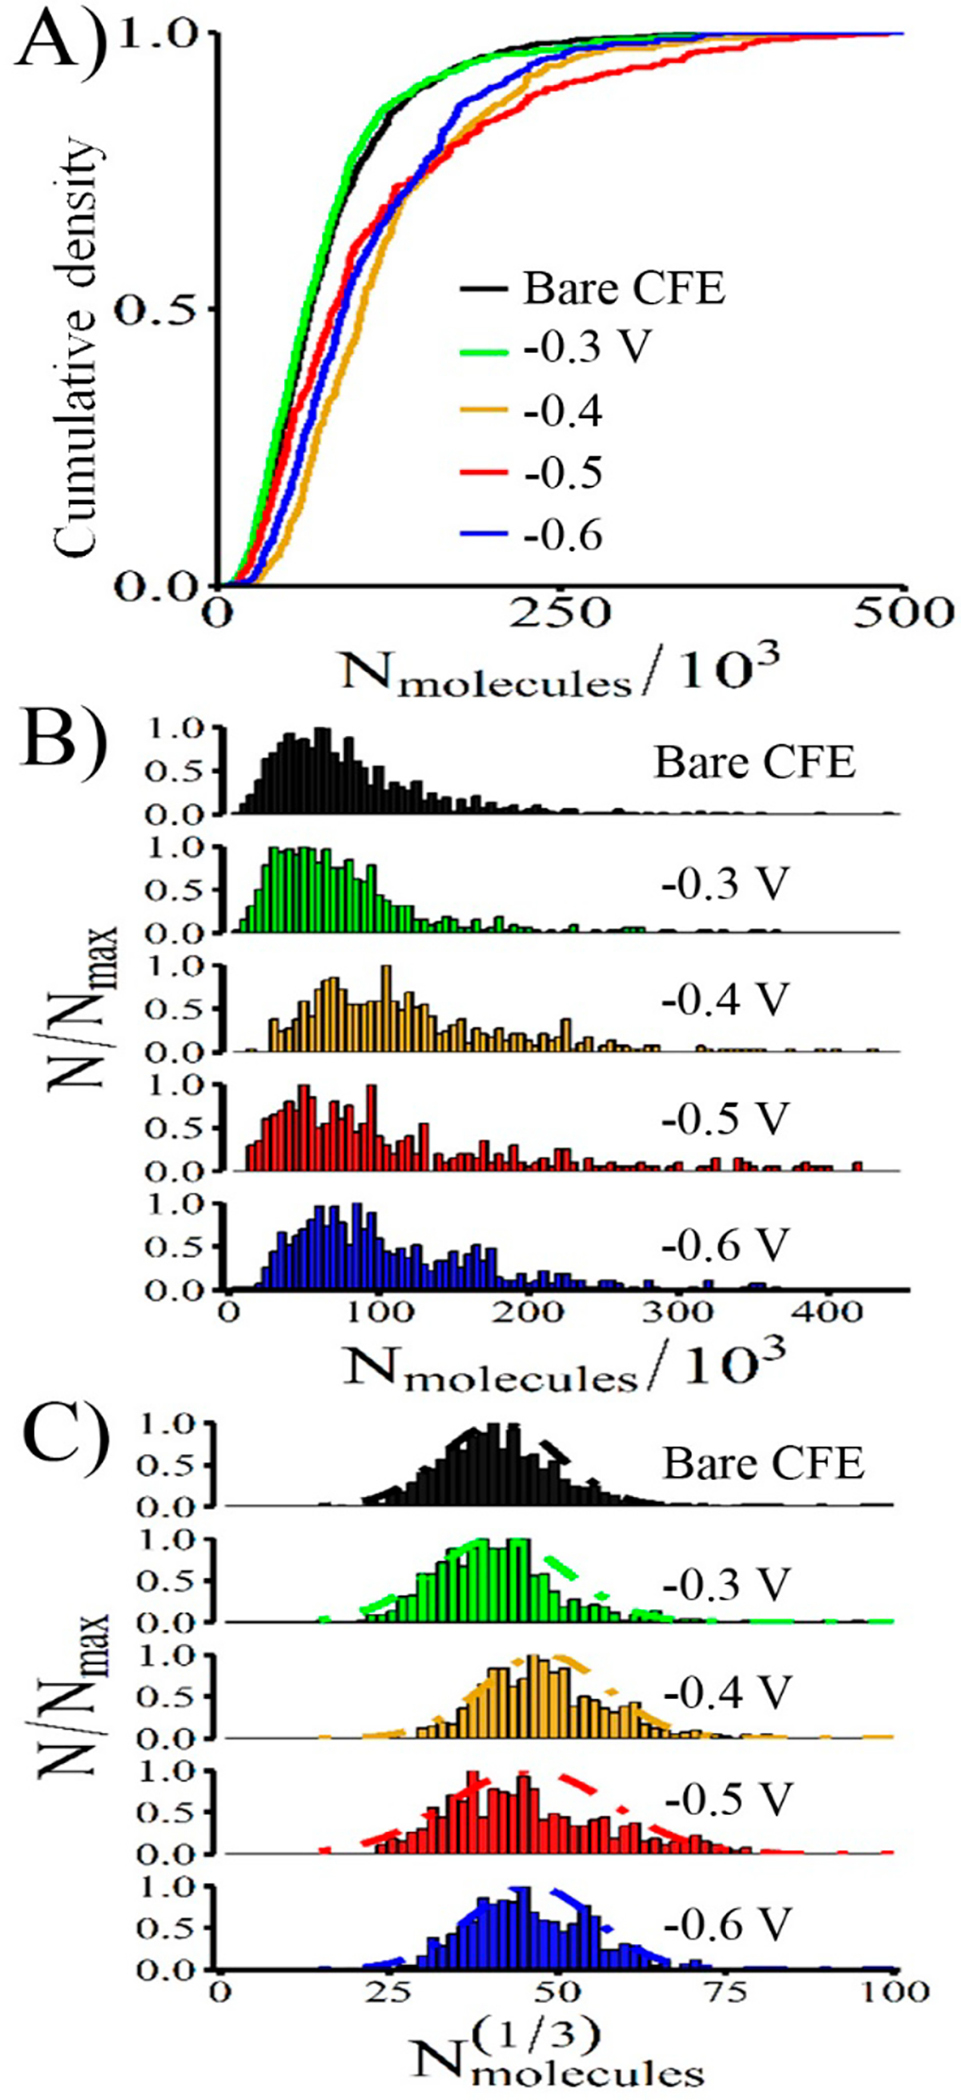
Au-CFEs demonstrate improved detection of catecholamine release from PC12 cells. (A) Cumulative distributions of release events show a significant difference between bare CFEs and Au-CFEs modified with Edeposit = −0.4 V‡, −0.5 V‡, and −0.6 V‡ (KS test, ‡ = p < 0.0001). (B) Normalized frequency histogram of molecules released and (C) normalized frequency distribution of the cube root of the number of molecules released. The cube root distribution may be fit with a Gaussian curve.
For Edeposit = −0.4 V probes, we achieved consistently improved detection of exocytosis, though this effect was not shared by all probes. Despite their similar cumulative distributions, the average imax and Nmolecules for Edeposit = −0.5, −0.6 V were not significantly different from control, in contrast to E = −0.4 V (Table 2). The quality of the gold layer likely suffers at more negative deposition potentials, where overgrowth of the electrode surface is common due to the development of voids within the gold layer.
Mechanism for Improved Performance of Au-CFEs.
Given the considerable improvement in signal to noise on the Edeposit = −0.4 V probes, we explored a few possible mechanisms for the behavior. To determine whether the behavior was facilitated by a better electrode material alone (e.g., noble metal), we repeated the experiment with Pt-modified CFEs on an independent cell culture (amperometric traces, Figure S5). Platinum has similar electron-transfer properties to Au, but we found no significant difference between the distributions of Nmolecules of bare CFEs and Pt-CFEs (KS test; Figure S6, statistics, Table S2).
Next, we considered the possibility that the Au-CFEs either detected fewer events (biasing statistics toward higher values) or altered detection through an interaction with the cell. However, examining the total number of events per cell and the interspike interval, we found no significant differences between Au-CFEs and bare CFEs (Figures S7 and S8), except for Edeposit = −0.4 V, which detected fewer events on average than control (p < 0.05, Mann–Whitney) in untreated cells.
Finally, we considered that our increased detection on Au-CFEs could be due to the detection of intracellular vesicles by cell penetration and vesicle impact electrochemical cytometry (VIEC). VIEC has been shown to result in increased catecholamine detection due to more complete oxidation of the vesicle contents.6,7,11,17 Detection via VIEC does not require stimulation of the cell; therefore, we performed cell experiments with each probe in Ca2+-free solution (Figure S9). No events were detected on any probe (n = 3 probes, 10–12 cells each condition). Thus, the detection results are very likely to be from stimulated exocytosis alone, without any biasing from intracellular vesicle detection.
The presence of Au (rather than Pt) apparently plays a significant role in the improvements to catecholamine detection without altering exocytosis detection in other ways. The high availability of surface oxides on Au compared to bare CFEs likely increases coulometric efficiency. Kisler et al. showed that Au-coated electrodes detected greater catecholamine release from chromaffin cells when compared to indium tin oxide (ITO) electrodes,42 consistent with our results. Au-CFEs may also penetrate the extracellular matrix (ECM) of proteoglycans surrounding the cell, allowing more complete detection of dopamine. Previously, Trouillon and Ewing showed partial digestion of the ECM yielded greater catecholamine detection,43 though the relative increase was less than observed here.
Au-CFEs Demonstrate Similar Sensitivity when Measuring Augmented Vesicle Content.
We have shown that Au-CFEs have characteristics that make them attractive for the detection of catecholamine release. To assess the generalizability of the probe, we introduced a perturbation to the PC12 cell measurement by preincubating the cells with 100 μM L-DOPA, which augments the catecholamine content of the vesicles.13 Since Edeposit = −0.4 V probes had the best sensitivity to released catecholamine in previous experiments, we used this probe for comparison. Interestingly, we detected a similar increase in the average Nmolecules when using the AuCFE. The Nmolecules distributions and sample amperometric traces may be seen in Figure 5. The difference between the cumulative distributions of Nmolecules was significant (KS test, p < 0.0001), consistent with our previous experiments. The spike parameters are tabulated in Table S3, where one can see that the change in imax is also conserved. There were no significant differences in the average number of events observed per cell or the interspike interval when comparing Au-CFEs to control CFEs (Figure S8), supporting our conclusion that Au-CFEs are not altering exocytosis or detecting fewer events.
Figure 5.
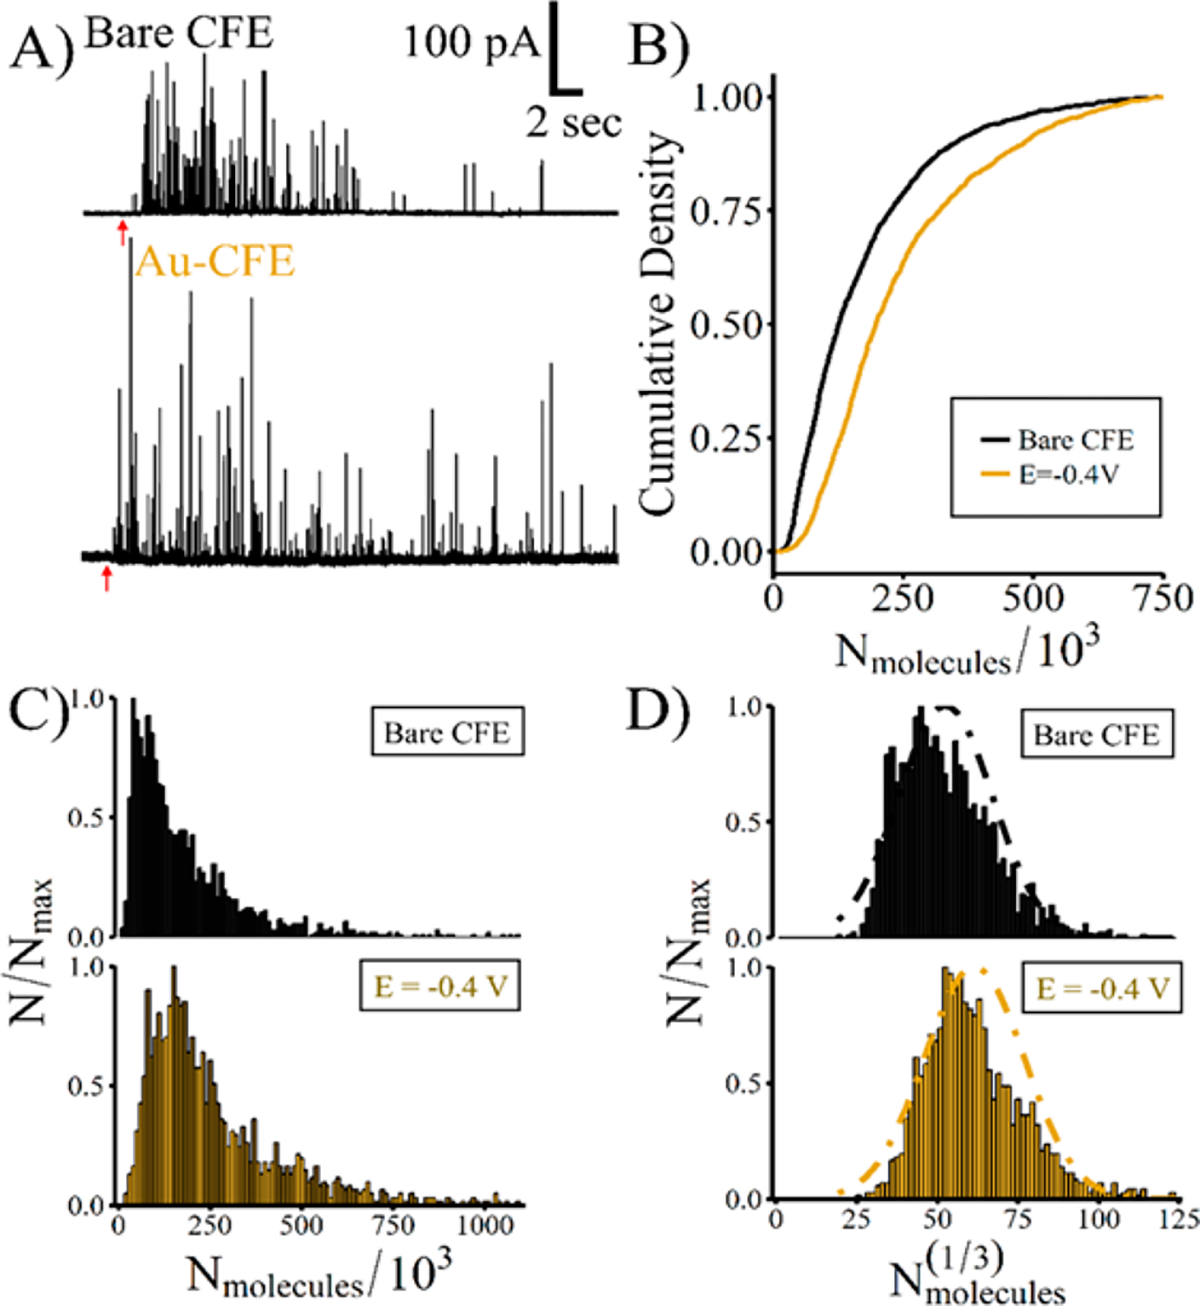
Au-CFEs detect more catecholamine release from L-DOPA-augmented PC12 cells. (A) Example traces collected from bare CFEs or Au-CFEs. The red arrow indicates stimulation. (B) Cumulative density distributions of the number of molecules released show Edeposit = −0.4 V‡ is significantly different from bare CFEs (KS test, ‡ = p < 0.0001). (C) Normalized frequency histograms of the number of molecules released. (D) Normalized frequency histogram of the cube root of the number of molecules for each electrode type.
CONCLUSIONS
In summary, we developed CFEs with a thin layer of electrodeposited Au that allowed more sensitive measurement of released catecholamine from PC12 cells. Au-CFEs demonstrated improved electron-transfer kinetics and catalyzed the oxidation of dopamine at more negative potentials. The morphology and roughness of the deposited gold layer could be controlled by the Edeposit potential; we found that the presence of gold, even without full surface coverage, was sufficient to shift the E1/2 and improve electron transfer for dopamine. Our results suggest that the high surface area and morphology of the Au-CFEs improved detection of catecholamine. The method employed here may find applications in improving electrode array sensitivity, nanoelectrode surface area and sensitivity, or even FSCV applications to improve electron-transfer kinetics or anchor new chemical-sensing modalities.
Supplementary Material
ACKNOWLEDGMENTS
This research was supported by the National Institute of Health (R01 GM101133). Part of this work was conducted at the Molecular Analysis Facility, a National Nanotechnology Coordinated Infrastructure site at the University of Washington which is supported in part by the National Science Foundation (Grant ECC-1542101), the University of Washington, the Molecular Engineering and Sciences Institute, the Clean Energy Institute, and the National Institutes of Health.
Footnotes
Notes
The authors declare no competing financial interest.
ASSOCIATED CONTENT
Supporting Information
The Supporting Information is available free of charge on the ACS Publications website at DOI: 10.1021/acs.analchem.8b02750.
Additional information on the experimental section, amperometric traces, and detailed statistics for L-DOPA measurements and Pt-CFEs (PDF)
REFERENCES
- (1).Robinson DL; Hermans A; Seipel AT; Wightman RM Chem. Rev. 2008, 108, 2554–2584. [DOI] [PMC free article] [PubMed] [Google Scholar]
- (2).Mosharov EM; Sulzer D Nat. Methods 2005, 2, 651–658. [DOI] [PubMed] [Google Scholar]
- (3).Ganesana M; Lee ST; Wang Y; Venton BJ Anal. Chem. 2017, 89, 314–341. [DOI] [PMC free article] [PubMed] [Google Scholar]
- (4).Staal RGW; Mosharov EV; Sulzer D Nat. Neurosci. 2004, 7, 341–346. [DOI] [PubMed] [Google Scholar]
- (5).Pothos EN; Davila V; Sulzer DJ Neurosci. 1998, 18, 4106–4118. [DOI] [PMC free article] [PubMed] [Google Scholar]
- (6).Dunevall J; Fathali H; Najafinobar N; Lovric J; Wigström J; Cans AS; Ewing AG J. Am. Chem. Soc. 2015, 137, 4344–4346. [DOI] [PubMed] [Google Scholar]
- (7).Li X; Dunevall J; Ren L; Ewing AG Anal. Chem. 2017, 89, 9416–9423. [DOI] [PubMed] [Google Scholar]
- (8).Wightman RM; Jankowski JA; Kennedy RT; Kawagoe KT; Schroeder TJ; Leszczyszyn DJ; Near JA; Diliberto EJ; Viveros OH Proc. Natl. Acad. Sci. U. S. A. 1991, 88, 10754–10758. [DOI] [PMC free article] [PubMed] [Google Scholar]
- (9).Zerby SE; Ewing AG Brain Res. 1996, 712, 1–10. [DOI] [PubMed] [Google Scholar]
- (10).Li Y; Zhang S; Wang X; Zhang X; Oleinick AI; Svir I; Amatore C; Huang W Angew. Chem., Int. Ed. 2015, 54, 9313–9318. [DOI] [PubMed] [Google Scholar]
- (11).Li X; Majdi S; Dunevall J; Fathali H; Ewing AG Angew. Chem., Int. Ed. 2015, 54, 11978–11982. [DOI] [PMC free article] [PubMed] [Google Scholar]
- (12).Sombers LA; Hanchar HJ; Colliver TL; Wittenberg N; Cans A; Arbault S; Amatore C; Ewing AG J. Neurosci. 2004, 24, 303–309. [DOI] [PMC free article] [PubMed] [Google Scholar]
- (13).Colliver TL; Pyott SJ; Achalabun M; Ewing AG J. Neurosci. 2000, 20, 5276–5282. [DOI] [PMC free article] [PubMed] [Google Scholar]
- (14).Sombers LA; Wittenberg NJ; Maxson MM; Adams KL; Ewing AG ChemPhysChem 2007, 8, 2471–2477. [DOI] [PubMed] [Google Scholar]
- (15).Oleinick A; Svir I; Amatore C Proc. R. Soc. London, Ser. A 2017, 473, 20160684. [DOI] [PMC free article] [PubMed] [Google Scholar]
- (16).van Kempen GT; vanderLeest HT; van den Berg RJ; Eilers P; Westerink RH S. Biophys. J. 2011, 100, 968–977. [DOI] [PMC free article] [PubMed] [Google Scholar]
- (17).Ren L; Mellander L; Keighron J; Cans A; Kurczy M; Svir I; Oleinick A; Amatore C; Ewing AG Q. Rev. Biophys. 2016, 49, e12. [DOI] [PubMed] [Google Scholar]
- (18).Schroeder TJ; Jankowski JA; Kawagoe KT; Wightman RM; Lefrou C; Amatore C Anal. Chem. 1992, 64, 3077–3083. [DOI] [PubMed] [Google Scholar]
- (19).Zhang B; Adams KL; Luber S; Eves DJ; Heien M; Ewing AG Anal. Chem. 2008, 80, 1394–1400. [DOI] [PMC free article] [PubMed] [Google Scholar]
- (20).Zhang B; Heien MLAV; Santillo MF; Mellander L; Ewing AG Anal. Chem. 2011, 83, 571–577. [DOI] [PMC free article] [PubMed] [Google Scholar]
- (21).Yang C; Wang Y; Jacobs CB; Ivanov I; Venton BJ Anal. Chem. 2017, 89, 5605–5611. [DOI] [PMC free article] [PubMed] [Google Scholar]
- (22).Yang C; Trikantzopoulos E; Jacobs CB; Venton BJ Anal. Chim. Acta 2017, 965, 1–8. [DOI] [PMC free article] [PubMed] [Google Scholar]
- (23).Jacobs CB; Ivanov IN; Nguyen MD; Zestos AG; Venton BJ Anal. Chem. 2014, 86, 5721–5727. [DOI] [PMC free article] [PubMed] [Google Scholar]
- (24).Larsen ST; Vreeland RF; Heien ML; Taboryski R Analyst 2012, 137, 1831–1836. [DOI] [PubMed] [Google Scholar]
- (25).Schmidt AC; Wang X; Zhu Y; Sombers LA ACS Nano 2013, 7, 7864–7873. [DOI] [PubMed] [Google Scholar]
- (26).Chen RS; Huang WH; Tong H; Wang ZL; Cheng JK Anal. Chem. 2003, 75, 6341–6345. [DOI] [PubMed] [Google Scholar]
- (27).Zhang M; Liu K; Xiang L; Lin Y; Su L; Mao L Anal. Chem. 2007, 79, 6559–6565. [DOI] [PubMed] [Google Scholar]
- (28).Swamy BE; Venton BJ Analyst 2007, 132, 876–884. [DOI] [PubMed] [Google Scholar]
- (29).Zhu M; Zeng C; Ye J Electroanalysis 2011, 23, 907–914. [Google Scholar]
- (30).Bai J; Wang X; Meng Y; Zhang HM; Qu L Anal. Sci. 2014, 30, 903–909. [DOI] [PubMed] [Google Scholar]
- (31).Puthongkham P; Cheng Y; Venton BJ Electroanalysis 2018, 30, 1073–1081. [DOI] [PMC free article] [PubMed] [Google Scholar]
- (32).Adams KL; Jena BK; Percival SJ; Zhang B Anal. Chem. 2011, 83, 920–927. [DOI] [PubMed] [Google Scholar]
- (33).Zachek MK; Hermans A; Wightman RM; McCarty GS J. Electroanal. Chem. 2008, 614, 113–120. [DOI] [PMC free article] [PubMed] [Google Scholar]
- (34).Wang K; Zhao X; Li B; Wang K; Zhang X; Mao L; Ewing A; Lin Y Anal. Chem. 2017, 89, 8683–8688. [DOI] [PubMed] [Google Scholar]
- (35).Westerink RHS; Ewing AG Acta Physiol. 2008, 192, 273–285. [DOI] [PMC free article] [PubMed] [Google Scholar]
- (36).Rothe J; Frey O; Madangopal R; Rickus J; Hierlemann A Sensors 2017, 17, 22. [DOI] [PMC free article] [PubMed] [Google Scholar]
- (37).Cox JT; Guerrette JP; Zhang B Anal. Chem. 2012, 84, 8797–8804. [DOI] [PMC free article] [PubMed] [Google Scholar]
- (38).Bath BD; Michael DJ; Trafton BJ; Joseph JD; Runnels PL; Wightman RM Anal. Chem. 2000, 72, 5994–6002. [DOI] [PubMed] [Google Scholar]
- (39).Guerrette JP; Oja SM; Zhang B Anal. Chem. 2012, 84, 1609–1616. [DOI] [PubMed] [Google Scholar]
- (40).Mirkin MV; Bard AJ Anal. Chem. 1992, 64 (19), 2293–2302. [Google Scholar]
- (41).Burke LD; Nugent PF Gold Bull. 1997, 30, 43–53. [Google Scholar]
- (42).Kisler K; Kim BN; Liu X; Berberian K; Fang Q; Mathai CJ; Gangopadhyay S; Gillis KD; Lindau MJ Biomater. Nanobiotechnol. 2012, 3, 243–253. [DOI] [PMC free article] [PubMed] [Google Scholar]
- (43).Trouillon R; Ewing AG Anal. Chem. 2013, 85, 4822–4828. [DOI] [PMC free article] [PubMed] [Google Scholar]
Associated Data
This section collects any data citations, data availability statements, or supplementary materials included in this article.


