

Abstract
Background:
Artificial intelligence/computer-aided diagnosis (AI/CADx) and its use of radiomics have shown potential in diagnosis and prognosis of breast cancer. Performance metrics such as the area under the receiver operating characteristic (ROC) curve (AUC) are frequently used as figures of merit for the evaluation of CADx. Methods for evaluating lesion-based measures of performance may enhance the assessment of AI/CADx pipelines, particularly in the situation of comparing performances by classifier.
Purpose:
The purpose of this study was to investigate the use case of two standard classifiers to (1) compare overall classification performance of the classifiers in the task of distinguishing between benign and malignant breast lesions using radiomic features extracted from dynamic contrast-enhanced magnetic resonance (DCE-MR) images, (2) define a new repeatability metric (termed sureness), and (3) use sureness to examine if one classifier provides an advantage in AI diagnostic performance by lesion when using radiomic features.
Methods:
Images of 1,052 breast lesions (201 benign, 851 cancers) had been retrospectively collected under HIPAA/IRB compliance. The lesions had been segmented automatically using a fuzzy c-means method and thirty-two radiomic features had been extracted. Classification was investigated for the task of malignant lesions (81% of the dataset) versus benign lesions (19%). Two classifiers (linear discriminant analysis, LDA and support vector machines, SVM) were trained and tested within 0.632 bootstrap analyses (2000 iterations). Whole-set classification performance was evaluated at two levels: (1) the 0.632+ bias-corrected area under the ROC curve (AUC) and (2) performance metric curves which give variability in operating sensitivity and specificity at a target operating point (95% target sensitivity). Sureness was defined as 1–95% confidence interval of the classifier output for each lesion for each classifier. Lesion-based repeatability was evaluated at two levels: (1) repeatability profiles, which represent the distribution of sureness across the decision threshold and (2) sureness of each lesion. The latter was used to identify lesions with better sureness with one classifier over another while maintaining lesion-based performance across the bootstrap iterations.
Results:
In classification performance assessment, the median and 95% CI of difference in AUC between the two classifiers did not show evidence of difference (ΔAUC = −0.003 [−0.031, 0.018]). Both classifiers achieved the target sensitivity. Sureness was more consistent across the classifier output range for the SVM classifier than the LDA classifier. The SVM resulted in a net gain of 33 benign lesions and 307 cancers with higher sureness and maintained lesion-based performance. However, with the LDA there was a notable percentage of benign lesions (42%) with better sureness but lower lesion-based performance.
Conclusions:
When there is no evidence for difference in performance between classifiers using AUC or other performance summary measures, a lesion-based sureness metric may provide additional insight into AI pipeline design. These findings present and emphasize the utility of lesion-based repeatability via sureness in AI/CADx as a complementary enhancement to other evaluation measures.
Keywords: computer-aided diagnosis, AI, repeatability, breast, magnetic resonance imaging, machine learning
1. Introduction
Methods of artificial intelligence/computer-aided diagnosis (AI/CADx) extract quantitative information from medical data, including images, to support decision-making in clinical medicine.1 Radiomic features are a form of quantitative information2 that can be used in AI/CADx systems and are derived from regions of interest in medical images, such as lesions found in the breast, and they can be merged using classifiers. A primary method for performance evaluation of radiomic features is receiver operating characteristic (ROC) curve analysis,3 which evaluates the true positive rate (sensitivity) as a function of the false positive rate (1-specificity) as the area under this curve (AUC) across the range of classifier output for all test lesions. The utility of computer-aided diagnosis has been demonstrated, but additional work is needed4 in characterizing the variability of the AI/CADx pipeline in the context of factors such as variations in training set.
There have been several investigations to characterize the repeatability of specific radiomic features in their own right when extracted from several modalities for various clinical purposes,5 such as those regarding non-small cell lung cancer6 (NSCLC) and cervical cancer.7 In a survey of studies involving measuring repeatability and reproducibility of individual radiomic features,5 only one study met criteria for quality investigated the reproducibility of image-based features of breast lesions, using PET-based features.8 There have been limited reports of the repeatability of MR-based features. One recent review specifically noted that at its time of publication, no repeatability studies had been published for individual radiomic features extracted from MR images.9 A subsequent study10 investigated the repeatability of individual radiomic features extracted from NSCLC imaging, using a small set of 15 lesions that had been imaged with both MR and computed tomography. These studies have established that collections of radiomic features have different degrees of variability from different sources, but have not established their impact to repeatability of classification by lesion in AI/CADx.
Repeatability of lesion-based classification is the variation that can be expected for a single lesion when its probability of classification is determined using an AI/CADx workflow that incorporates collections of radiomic features. A potential use case of AI/CADx repeatability in medicine is to provide physicians with the AI output of likelihood of disease or prognosis for a specific lesion as well as the repeatability. A second use case is to investigate the impact of variability in the workflow on operating sensitivity and specificity in the context of decision threshold selection, both to all lesions in a test set collectively and to individual lesions. For example, a CADx/AI system could output both a likelihood of malignancy (e.g., 60% likelihood of being cancer) along with the sureness metric (e.g., 80% sure). These characterizations are both unique and complementary to the AUC, since differences in the AI/CADx workflow, such as classifier used, may impact lesion-based repeatability when there is variability in the training set.
To demonstrate, we have investigated the use case of breast AI/CADx with linear discriminant analysis (LDA) and support vector machines (SVM) classifiers, which are well-established in radiomics pipelines. Using them in a study of this type supports focus on the potential utility of a novel measure of lesion-based repeatability to expand metrics of evaluation in AI/CADx. In our use case, to demonstrate the benefit of the role of lesion-based repeatability comparing two classifiers, we thus conducted classification performance analysis to compare between the use of the two classifiers in the task of distinguishing between benign and malignant breast lesions using radiomic features extracted from breast lesions imaged with dynamic contrast-enhanced magnetic resonance (DCE-MR) imaging. We defined lesion-based repeatability as a sureness metric, a measure related to the 95% confidence interval (CI) of the lesion-based classifier output (CO). We used this sureness method to assess the impact of variability in the training set on the classification of individual lesions in the test set, and determined if one classifier may be preferred over the other for individual lesions.
2. Methods
2.1. Dataset description
The dataset consisted of a collection of DCE-MR images of 1,052 unique lesions that had been acquired during 2005–2015. All lesions had been imaged in the axial plane at 1.5 or 3.0 T using Philips Achieva or Philips Intera Achieva scanners. A T1-weighted spoiled gradient sequence was used. The repetition time across all lesions was approximately 5.5 ms, while the echo time was approximately 2.7 ms. The flip angle for most lesions imaged at 1.5 T was 12 degrees, while the flip angle for most lesions imaged at 3.0 T was 10 degrees. The temporal resolution of the DCE-MR imaging series across all lesions was around 60 s. The images had been retrospectively collected under IRB/HIPAA compliance. There were 201 unique benign lesions and 851 unique malignant lesions, one lesion per patient in the dataset.
2.2. Lesion segmentation, radiomic feature extraction, and classification
Previously, lesions had been automatically segmented using a fuzzy c-means method11 after indication of a seed point and thirty-two radiomic features (Table S-1)describing lesion shape, morphology,12 texture13 (using a 32 binned co-occurrence matrix on the first post-contrast image), and contrast enhancement14 (using all time point images) extracted on a dedicated radiomics workstation. While other features can be extracted from MR images, we have used these particular features in several previous studies15,16, including external validation,17 and have established their utility for the classification of breast lesions as malignant or benign. This supports the ability of our study to use them to investigate lesion-based classification repeatability. It is also important to note that in general, the number of features used in classification must be carefully considered and limited in order to reduce the potential for overfitting.18 Our use of thirty-two features contributes to the rigor of the classification pipeline to ensure the robust study of lesion-based repeatability. Classifier training and testing was performed using linear discriminant analysis (LDA) and support vector machines (SVM) as classifiers using a 0.632 bootstrap19 paradigm with 2000 iterations. For LDA, stepwise feature selection within each bootstrap fold was conducted. All features were input to the SVM because that classifier type identifies weights using all features. Within each bootstrap fold, lesions were randomly selected to be in either a training or test fold with prevalence of each class maintained within each fold (stratified random sampling). The same set of bootstrap folds was used for each classifier. Each classifier was trained within the training folds and then applied to the lesions in the corresponding test folds to obtain the lesion-based classifier output (CO), i.e., the posterior probability that a lesion was malignant. In the assessment of classification performance by classifier, the collection of CO was used in ROC analysis and the associated AUC (AUCLDA and AUCSVM) served as the performance metric for each classifier respectively. The AUC was calculated from the bootstrap samples using the proper binormal model20 and the 0.632+ bootstrap bias correction,18,19 which was used to address bias due to sample selection in the bootstrap.
2.3. Assessment of classification performance
2.3.1. Comparison of classification performance through ROC analysis
The AUC in the task of classifying lesions as malignant or benign was compared by classifier through the median and 95% confidence interval (CI) of the difference in the AUC (ΔAUC = AUCSVM -AUCLDA) empirically across the bootstrap. If the 95% CI of the difference in AUC included zero, it was concluded that we failed to show any evidence that the classification performance of one classifier was statistically significantly better than the other. Alternatively, if the 95% CI of the difference in AUC did not include zero, then the classification performance of one classifier was deemed statistically superior to the other. For each classifier, the median ROC curve was plotted using the proper binormal parameters associated with the median AUC result from the bootstrap. Similarly, the 95% CI of the ROC for each curve was plotted using the proper binormal parameters from the 2.5th and 97.5th percentile AUC results, respectively.
2.3.2. Operating sensitivity and specificity
To investigate the impact of variation in the training set on variability in sensitivity and specificity in the bootstrap test folds, sensitivity and specificity within the training and test folds were investigated as a function of thresholds for the decision variable (i.e., the lesion-based output, CO). The aim was to determine (1) the sensitivity and specificity, and their variabilities, within the training folds for given thresholds of the decision variable, and (2) the corresponding sensitivity and specificity, and their variabilities, in the test folds at the same thresholds. This was evaluated at athreshold for an example target of 95% sensitivity. All results were reported in terms of median and 95% CI in performance metric curve (PMC) format.21 Note that the McNemar test22 can sometimes be appropriate to compare operating sensitivity and specificity, but its implementation inherently assumes little variability in the training set.23 Because the variability of the training set is a fundamental design element of this study, the McNemar test was not used to quantitatively compare sensitivity and specificity across classifiers at this target operating point.
2.4. Assessment of lesion-based sureness and performance
The impact of variation in the training set on CO by classifier was assessed in three ways.
2.4.1. Sureness
To measure the lesion-based repeatability of the CO, we define sureness as 1-CO95CI, where CO95CI is the 95% confidence interval of the lesion-based classifier output. Sureness will have a theoretical maximum of 1, where 1 represents a lesion that has CO with no variation , and will approach a minimum of 0, where 0 represents an exteme scenario in which the CO range is the entire range of the decision threshold. Sureness was measured for each lesion across the bootstrap folds using each classifier.
2.4.2. Repeatability profiles
A variation on a previously published repeatability profile diagram24,25 was constructed for each classifier. The lesions were sorted in ascending order by median CO for each lesion when appearing in the test folds of the bootstrap iterations. Ten bins were subsequently constructed with an equal number of lesions within each bin. The height of each bin represented the median sureness of the lesions within that bin. Additionally, a marker on each bin indicated the median of the CO in that bin by its horizontal position and the 95% CI of sureness for the bin via an error bar. The sureness for each lesion from the classifier was superimposed on each repeatability profile for each classifier in order to view the prevalence of benign lesions and cancers within each bin as well as their individual sureness.
2.4.3. Comparison of lesion-based sureness and performance
The impact of variation in the training set and associated decision threshold on both the sureness and performance was investigated for each lesion when used in a testing fold. In this study, lesion-based performance was evaluated in terms of the fraction of bootstrap folds in which each lesion was classified correctly, i.e., how frequently each benign lesion was classified as benign and each malignant lesion was classified as malignant). (Note that each lesion does not appear as a test lesion in every bootstrap fold, so this fraction was measured as the fraction out of the number of bootstrap test folds in which each lesion appeared.) The difference in lesion-based performance versus the difference in lesion sureness by classifier was assessed for each lesion type.
A schematic of the data collection and analysis workflow is shown in Figure 1.
Figure 1:
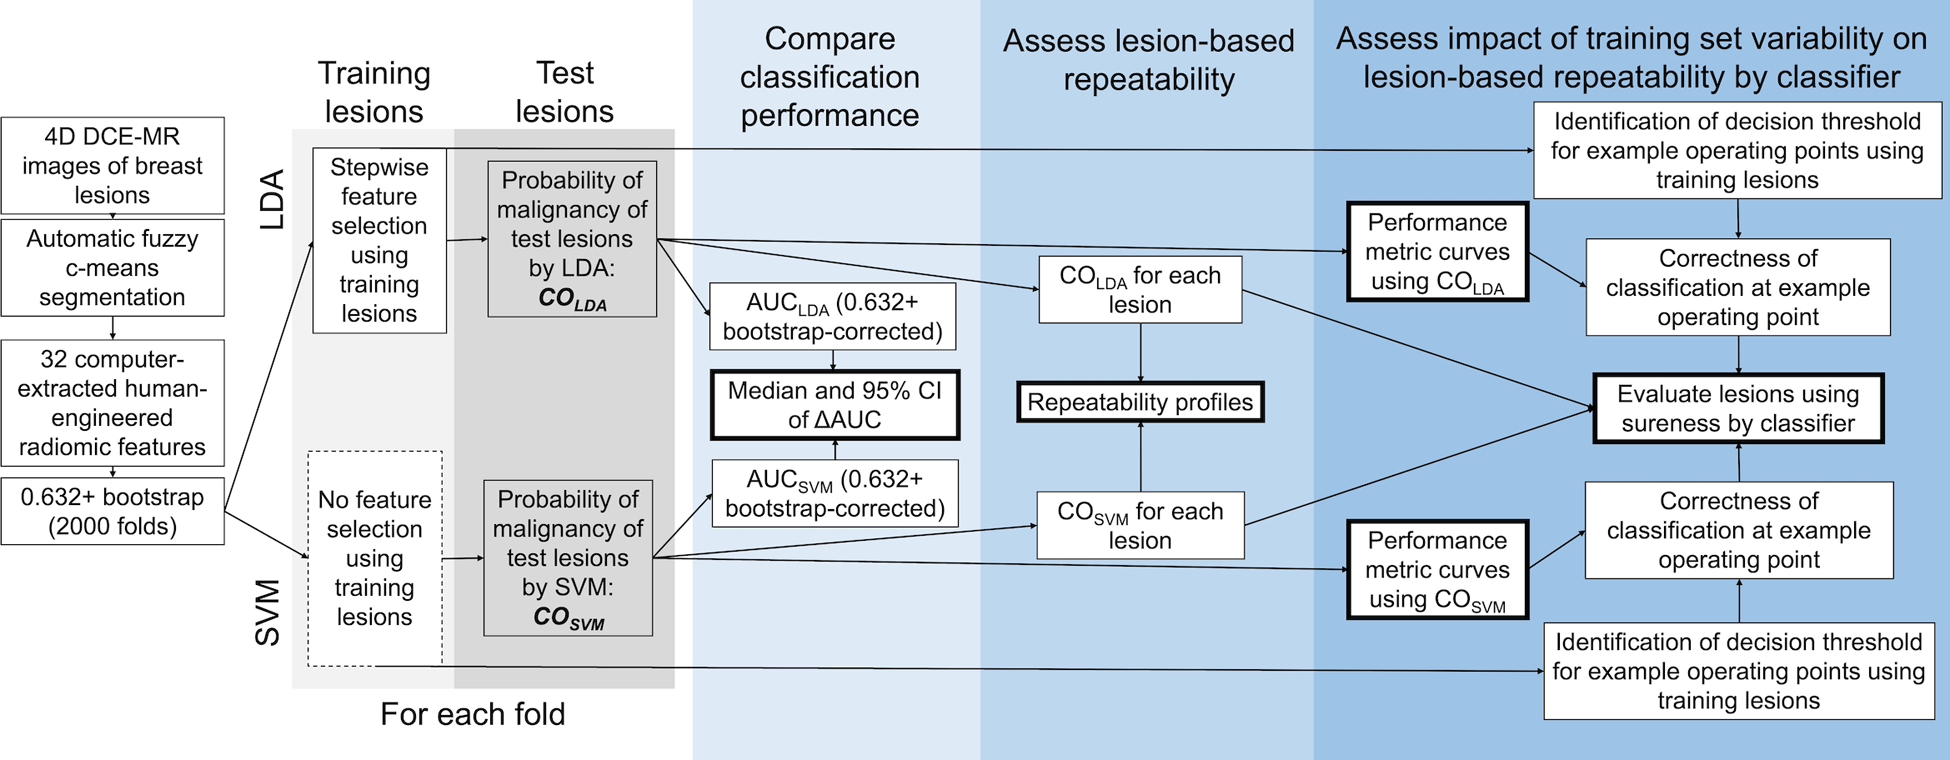
Schematic of dataset collection and analysis workflow. DCE-MR: dynamic contrast-enhanced magnetic resonance; LDA: linear discriminant analysis; SVM: support vector machine; CO: lesion-based classifier output giving likelihood of malignancy; AUC: area under the receiver operating characteristic curve.
3. Results
3.1. Assessment of classification performance
3.1.1. Comparison of classification performance
The 0.632+ bias-corrected median AUC [95% CI] for the task of classification of lesions as benign or malignant was AUCLDA = 0.822 [0.782, 0.849] and AUCLSVM = 0.819 [0.775, 0.848] (Figure 2). The median and 95% CI of difference in AUC between the two classifiers (ΔAUC = AUCSVM -AUCLDA) was −0.003 [−0.031, 0.018], indicating that we failed to find a statistically significant difference in AUC between the two classifiers for this task and for this dataset.
Figure 2.
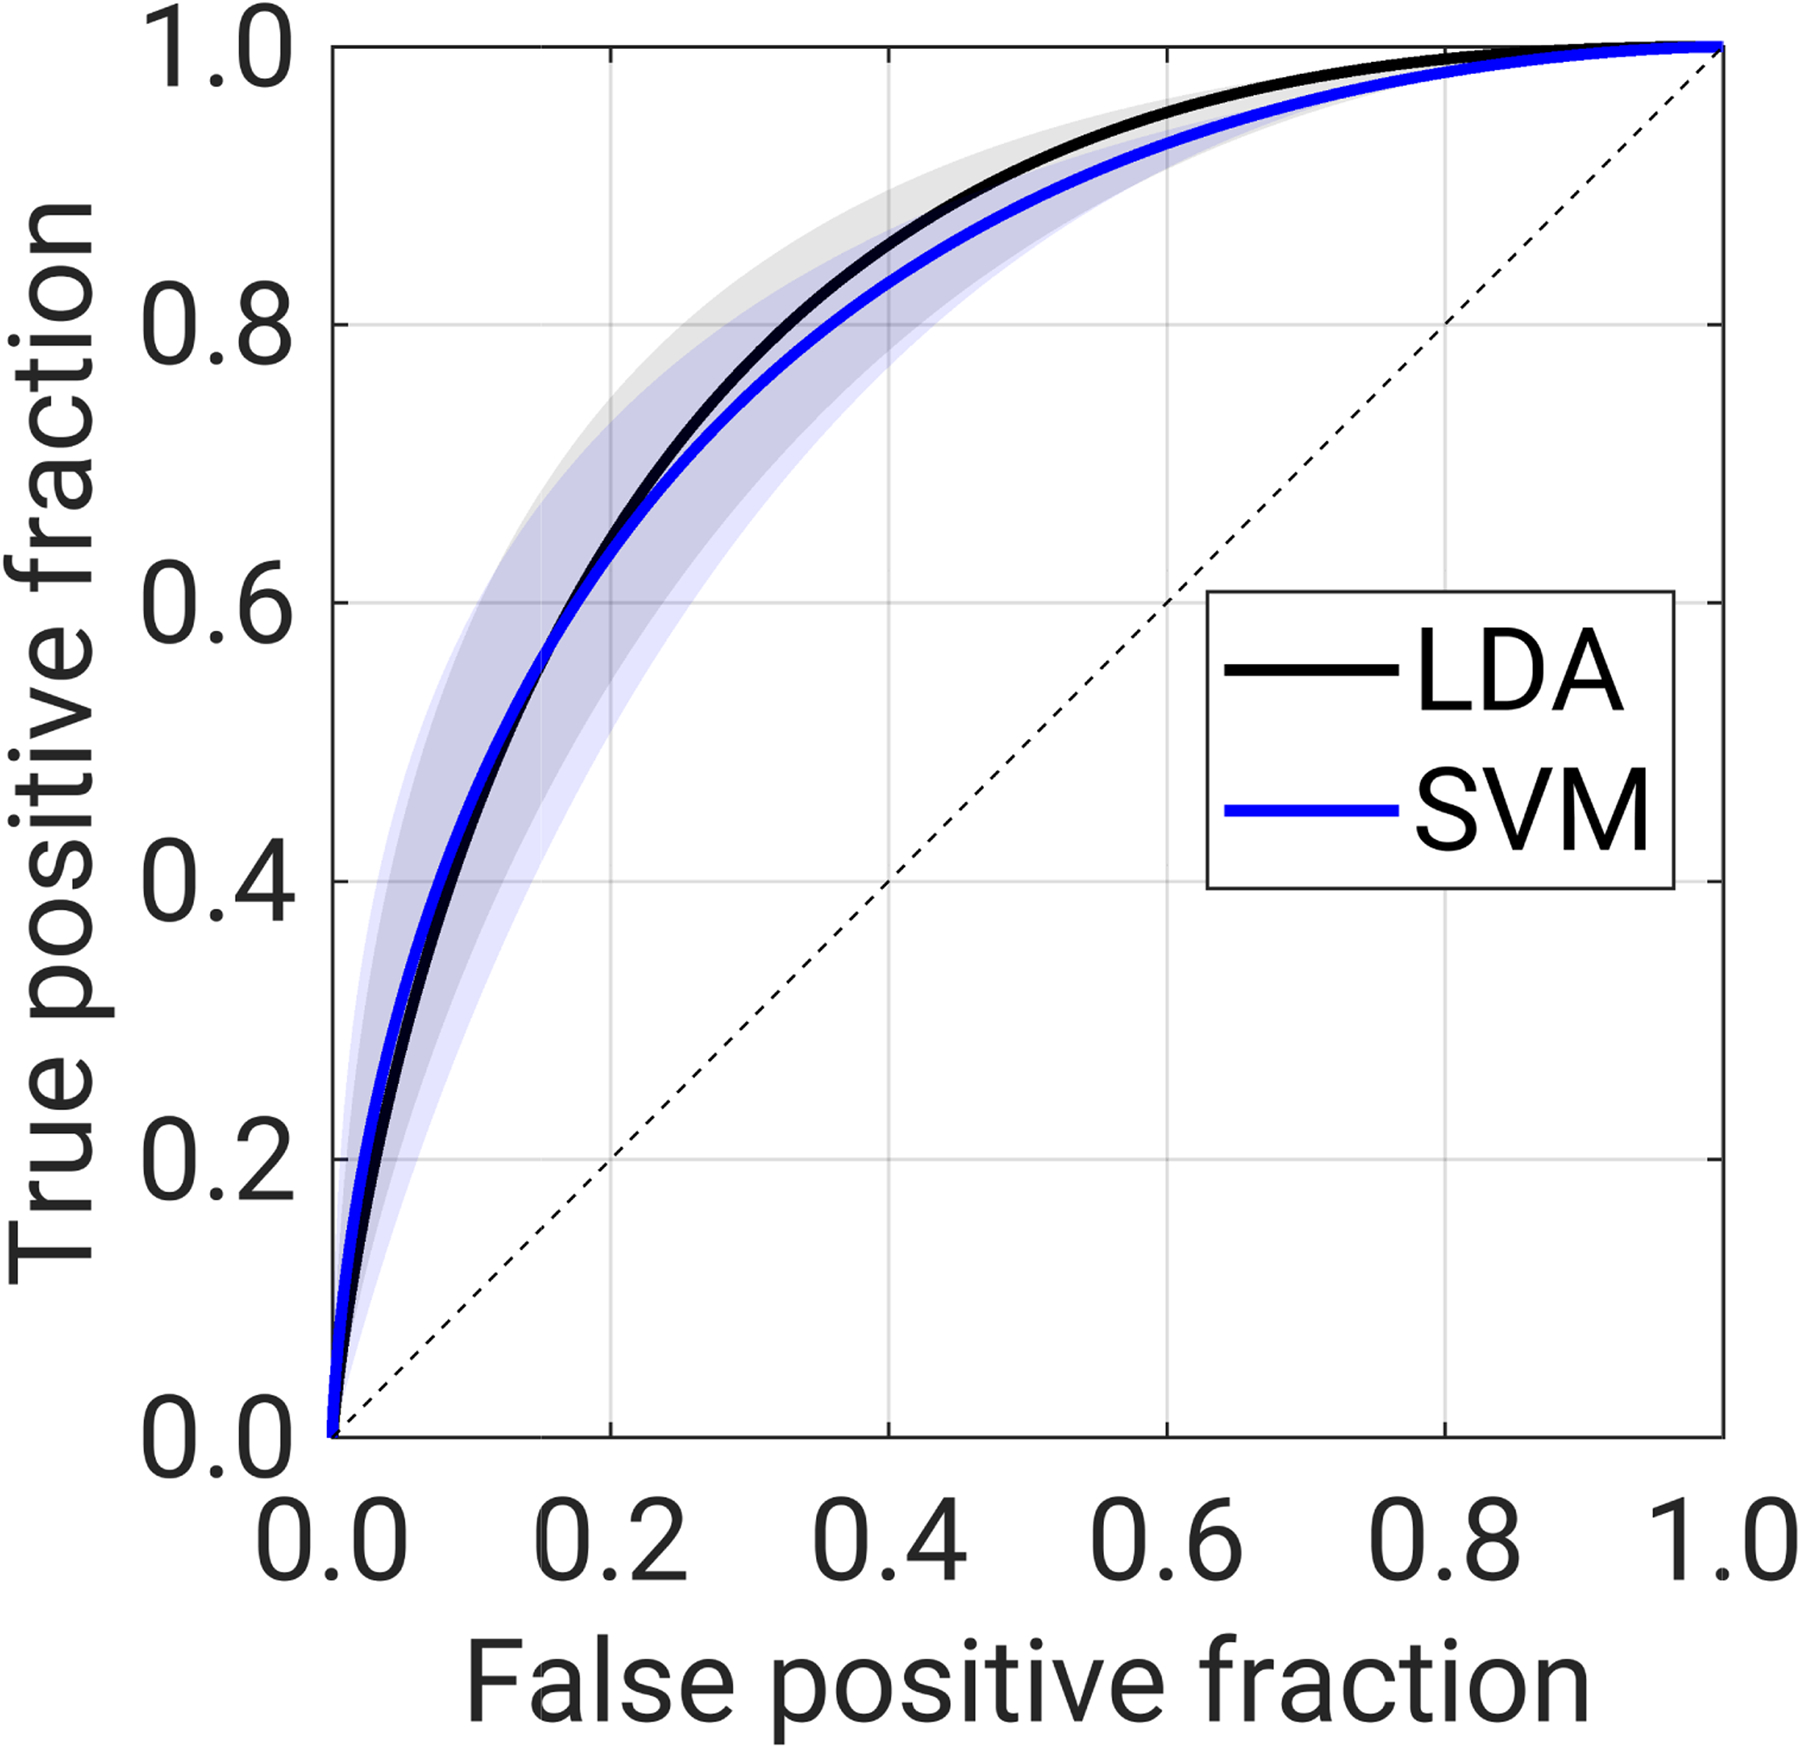
Receiver operating characteristic (ROC) curve in the task of classification of lesions as malignant or benign using a linear discriminant analysis (LDA, shown in black) classifier and support vector machines (SVM, shown in blue) classifier. Solid lines show the ROC curve associated with the median AUC for each classifier, while shading indicates the range of the ROC curves associated with the 95% CI of the AUC for each classifier.
3.1.2. Operating sensitivity and specificity
While each classifier attained the target 95% sensitivity, the PMCs (Figure 3) indicated some differences in repeatability of decision thresholds, determined from the training folds, associated with the target operating point between classifiers (Table 1). Specifically, the 95% CI of the decision threshold for target 95% sensitivity was more narrow for the LDA classifier than for the SVM classifier (Table 1). The sensitivity in the training set was similar to the attained sensitivity in the test set for both classifiers, in the decision threshold regions for the target operating point (Figure 3).
Figure 3:

Performance metric curves displaying sensitivity (magenta) and specificity (purple) in the training and the test sets. Left: linear discriminant analysis classifier (LDA), right: support vector machines classifier (SVM). The lines indicate median values, while the shading indicates the 95% CI of the performance metric (attained in the test set) or the decision threshold (determined from the training set).
Table 1:
Decision threshold and attained sensitivity and specificity from the training set and attained operating sensitivity and specificity in the test set, for the target operating point of target 95% sensitivity when using the linear discriminant analysis (LDA) and support vector machines (SVM) classifiers.
|
From the LDA classifier
Median [95% CI] |
From the SVM classifier
Median [95% CI] |
||
| From the training set | Decision threshold | 0.06 [0.04, 0.07] | 0.28 [0.23, 0.36] |
| Attained sensitivity | 0.949 [0.946, 0.957] | 0.949 [0.940, 0.960] | |
| On the test set | Attained operating sensitivity | 0.941 [0.908, 0.975] | 0.930 [0.875, 0.971] |
| Attained operating specificity | 0.390 [0.265, 0.516] | 0.418 [0.271, 0.573] | |
3.2. Assessment of lesion-based sureness and performance
3.2.1. Sureness
Classifier output by lesion had higher sureness when using one classifier or the other. Only one lesion (benign) had the same sureness when using either classifier (Figure 4).
Figure 4.

Sureness of each lesion (left: benign lesions, right: malignant lesions) when used in the testing folds when the training set is varied using a 0.632 bootstrap and (1) a linear discriminant analysis (LDA) classifier and (2) a support vector machines (SVM) classifier. For most lesions, sureness was higher when using one classifier over the other.
3.2.2. Repeatability profiles
Sureness was generally more consistent among lesions with median CO across the decision threshold when the SVM classifier was used, as indicated by the more uniform height of the repeatability profile bars (Figure 5).
Figure 5.

Sureness versus median lesion-based classifier output (CO) for (left) the linear discriminant analysis (LDA) classifier and (right) support vector machines (SVM) classifier, with repeatability profile. Each dot represents a lesion, and each lesion appears in each subfigure. The bars provide a repeatability profile for all lesions when a given classifier is used, wherein the COs of the test lesions were sorted based on ascending classifier output and collected into ten bins. The edges of each bin were determined by the lowest and highest value in each bin, and the horizontal location of the dark, filled circles represent the median CO within each bin. The height of the bins is the bin median lesion-based sureness, and error bars show the 95% confidence intervals of the bin heights. Higher bin heights and dot location indicate greater repeatability.
3.2.3. Comparison of lesion-based sureness and performance
Lesion-based sureness and performance evaluation gives insight into the differences (or lack thereof) for individual lesions between the two classifiers (Figure 6).
Figure 6:

Difference in percent of bootstrap folds in which a lesion was classified correctly (i.e., lesion-based performance) versus difference in sureness, between the linear discriminant analysis (LDA) and support vector machines (SVM) classifiers. Each dot represents one unique lesion. The lesion were divided into three tiers, described in the text. There was one benign lesion which had the same sureness and same number of bootstraps in which it was classified correctly between the two classifiers, and thus it does not appear in the lesions described by text in the figure. Percentages in each subfigure may not add to 100% due to rounding.
For each classifier and each lesion type, there are three tiers of lesions in terms of sureness and performance:
Tier 1: lesions for which both sureness and performance is better with one classifier than when using the other classifier (1LDA and 1SVM),
Tier 2: lesions for which sureness is better and performance is the same with one classifier than when using the other classifier (2LDA and 2SVM), resulting in an advantage for a classifier solely in terms of sureness (lesions along the horizontal midline of the subfigures), and
Tier 3: lesions for which sureness is better but performance is lower with one classifier than when using the other classifier (3LDA and 3SVM).
For the LDA classifier, 59 benign lesions (29%) were in tier 1, 3 benign lesions (1%) were in tier 2, and and 84 benign lesions (42%) in tier 3, while 152 malignant lesions (18%) were in tier 1, 127 malignant lesions (15%) were in tier 2, and 46 malignant lesions (5%) of lesions were in tier 3. For the SVM classifier, 13 benign lesions (6%) were in tier 1, 36 benign lesions (18%) were in tier 2, and and 5 benign lesions (2%) in tier 3, while 7 malignant lesions (1%) were in tier 1, 434 malignant lesions (51%) were in tier 2, and 85 malignant lesions (10%) of lesions were in tier 3. From these results, it can be concluded that using the SVM classifier would result in a net gain in sureness for 16% of the benign lesions (33 benign lesions) and 36% of the malignant lesions (307 malignant lesions) while maintaining lesion-based performance (Tier 2).
Another scenario that could be considered from Figure 6 is the proportion of lesions in each class with better sureness and equal or better performance when using one classifier versus the other. In this dataset, 62 benign lesions (34%) and 279 malignant lesions (33%) would meet this criteria when the LDA classifier was used (tiers 1LDA and 2LDA) while 49 benign lesions (24%) and 441 malignant lesions (52%) would when the SVM classifier was used (tiers 1SVM and 2SVM). For this dataset, this may point to an additional advantage to malignant lesions in particular when using the SVM classifier, in terms of sureness.
Finally, the relatively large percentage of benign lesions (84 lesions, 42%) with better sureness when using the LDA classifier but lower lesion-based performance compared to using the SVM classifier is also notable and could potentially be inspected further for possible trends of differences in properties of their radiomic features compared to other benign lesions.
4. Discussion
The work presented here investigates sureness (a metric of lesion-based repeatability) of malignant and benign breast lesions using radiomic features extracted from DCE-MR images, for the use case of two different classifiers (LDA and SVM). This work also presents sureness as a useful and intuitive measurement of the repeatability of lesion-based classifier output, building upon our previous work presenting the concept in terms of repeatability profiles that utilized the standard deviation24,26 and 95% CI25,27–29 of classifier output as measures of repeatability. The results suggest that for most lesions in this dataset, using the SVM classifier may be preferred for lesion-based sureness. We believe the most important finding is that sureness can be used to choose between classifiers in order to gain lesion-based repeatability, when more typical measures of performance for the entire dataset (e.g.., AUC) do not show any evidence of statistically significant difference.
Sureness contributes an additional characterization that can contribute to AI/CADx evaluation by measuring repeatability in classification when using radiomic features extracted from medical images. It can be used as a lesion-based metric applied to any dataset of radiomic features, such as those extracted from MR images as demonstrated here and from digital mammography, CT, ultrasound, or PET images. Further, sureness can be used to evaluate existing datasets for which classification performance has already been established in terms of AUC, prompting further study and improvement of AI/CADx pipelines for a wide variety of modalities and classification tasks. Its use could unlock new insights into AI/CADx, both in terms of pipeline/model development and model deployment (especially for personalized medicine).
One interesting finding of this study is that while classification performance (as measured by AUC and observed in operating metrics of sensitivity and specificity) failed to show differences between performances of two common classifiers when the training set was varied, our new sureness metric did demonstrate a difference between classifiers for all lesions except for one benign lesion. These results point to the differences in focus within the evaluation of a AI/CADx pipeline, in that collectively, a set of lesions may show no difference in classification performance but an individual lesion may receive substantially different outputs. In the future, we will study lesions in detail based on their sureness, and anticipate that sureness may help develop new understandings of subgroups of lesions, such as by molecular subtype or various benign pathologies. The findings also point to groups of lesions with interesting classification behaviors, such as those with COs that are robust to variations in the training set (e.g., those with high sureness for both classifiers). From this finding, future work will investigate the optimization of AI/CADx pipelines in terms of both classification performance levels and sureness.
This study has some limitations, several of which will be the topic of future study. First, the dataset had a high prevalence of cancer (81%). Prevalence scaling was applied to the posterior probabilities as part of the analysis process, and as noted above, AUC itself is theoretically unaffected by prevalence scaling. If the study was repeated with different prevalence, such as in the scenario of additional lesions being added to the dataset for training and/or testing, the classification performance could change, and this study did not investigate the impact to classifier performance in this scenario. Relatedly, the dataset does not represent the prevalence of malignant breast cancers in a clinical setting, which would be much lower. Secondly, this work focused on the repeatability of classification using radiomic features extracted from DCE-MR images of the breast. Future work will investigate the repeatability of classification in terms of radiomic features extracted from images of other modalities (such as digital mammography) and for different classification tasks. Thirdly, the difference in sureness of classifier output may depend upon class prevalence. The repeatability profiles, the density of lesion prevalence within the bins of median sureness versus CO, and the lesion-based sureness and performance across the bootstrap folds could change if the prevalence of the dataset differed. Further, the results presented here are inherent to the makeup of this particular dataset, the classifier used for classification, and the target operating point,21 and every dataset and machine learning method should be approached individually to assess repeatability in this manner. Finally, this study focused on the impacts of variability of the training set to overall classification performance and to sureness through the use case of the LDA and SVM classifiers, which have separately been used extensively in AI/CADx. Directly comparing classifiers in machine learning has been the topic of extensive study for several decades,23,30–36 and it is well known that this is a challenging task for several reasons. In our study, the datasets in the bootstrap are not independent due to the resampling of the training set.36 For this reason, we have taken the approach of evaluating sureness on a lesion-by-lesion basis. Future work will focus on developing criteria for additional quantitative evaluation within the constraints of classifier comparison methods and the contexts useful for AI/CADx, as well as reader studies which investigate the impact of presenting sureness as a property of a lesion’s AI classification performance to radiologists interpreting diagnostic breast MR images.
5. Conclusion
Lesion-based repeatability, leading to a sureness metric, in AI/CADx using radiomic features extracted from DCE-MR images of the breast has been presented for classification of lesions as malignant or benign. Sureness was introduced as a measure of repeatability of lesion-based classifier output, and was used together with an target operating point to identify lesions for which one classifier may provide a gain in sureness while maintaining lesion-based diagnostic performance. These results may contribute to a better understanding of lesion-based variability within computer-aided diagnosis and prognosis AI systems and enhance the tools available to evaluate them.
Conflict of Interest Statement
Supplementary Material
Acknowledgments
This work was funded in part by NIH NCI R15 CA227948, NIH NCI U01 CA195564, the University of Chicago Comprehensive Cancer Center, the Physics Student Researcher Fund in the Department of Physics at Wheaton College, and the Alumni Association at Wheaton College.
Footnotes
Conflict of Interest Statement
MLG is a stockholder in R2 Technology/Hologic and a cofounder and equity holder in Quantitative Insights (now Qlarity Imaging). MLG receives royalties from Hologic, GE Medical Systems, MEDIAN Technologies, Riverain Medical, Mitsubishi, and Toshiba. KD receives royalties from Hologic. It is the University of Chicago Conflict of Interest Policy that investigators disclose publicly actual or potential significant financial interest that would reasonably appear to be directly and significantly affected by the research activities.
References
- 1.Bi WL, Hosny A, Schabath MB, et al. Artificial intelligence in cancer imaging: Clinical challenges and applications. CA A Cancer J Clin. Published online 2019. doi: 10.3322/caac.21552 [DOI] [PMC free article] [PubMed] [Google Scholar]
- 2.Gillies RJ, Kinahan PE, Hricak H. Radiomics: Images Are More than Pictures, They Are Data. Radiology. 2016;278(2):563–577. doi: 10.1148/radiol.2015151169 [DOI] [PMC free article] [PubMed] [Google Scholar]
- 3.Metz CE. Basic principles of ROC analysis. Seminars in Nuclear Medicine. 1978;8(4):283–298. doi: 10.1016/S0001-2998(78)80014-2 [DOI] [PubMed] [Google Scholar]
- 4.Obuchowski NA, Reeves AP, Huang EP, et al. Quantitative imaging biomarkers: A review of statistical methods for computer algorithm comparisons. Stat Methods Med Res. 2015;24(1):68–106. doi: 10.1177/0962280214537390 [DOI] [PMC free article] [PubMed] [Google Scholar]
- 5.Traverso A, Wee L, Dekker A, Gillies R. Repeatability and Reproducibility of Radiomic Features: A Systematic Review. International Journal of Radiation Oncology*Biology*Physics. 2018;102(4):1143–1158. doi: 10.1016/j.ijrobp.2018.05.053 [DOI] [PMC free article] [PubMed] [Google Scholar]
- 6.van Velden FHP, Kramer GM, Frings V, et al. Repeatability of Radiomic Features in Non-Small-Cell Lung Cancer [18F]FDG-PET/CT Studies: Impact of Reconstruction and Delineation. Mol Imaging Biol. 2016;18(5):788–795. doi: 10.1007/s11307-016-0940-2 [DOI] [PMC free article] [PubMed] [Google Scholar]
- 7.Fiset S, Welch ML, Weiss J, et al. Repeatability and reproducibility of MRI-based radiomic features in cervical cancer. Radiotherapy and Oncology. 2019;135:107–114. doi: 10.1016/j.radonc.2019.03.001 [DOI] [PubMed] [Google Scholar]
- 8.Orlhac F, Soussan M, Maisonobe JA, Garcia CA, Vanderlinden B, Buvat I. Tumor Texture Analysis in 18 F-FDG PET: Relationships Between Texture Parameters, Histogram Indices, Standardized Uptake Values, Metabolic Volumes, and Total Lesion Glycolysis. J Nucl Med. 2014;55(3):414–422. doi: 10.2967/jnumed.113.129858 [DOI] [PubMed] [Google Scholar]
- 9.Yip SSF, Aerts HJWL. Applications and limitations of radiomics. Phys Med Biol. 2016;61(13):R150–R166. doi: 10.1088/0031-9155/61/13/R150 [DOI] [PMC free article] [PubMed] [Google Scholar]
- 10.Mahon RN, Hugo GD, Weiss E. Repeatability of texture features derived from magnetic resonance and computed tomography imaging and use in predictive models for non-small cell lung cancer outcome. Phys Med Biol. 2019;64(14):145007. doi: 10.1088/1361-6560/ab18d3 [DOI] [PubMed] [Google Scholar]
- 11.Chen W, Giger ML, Bick U. A fuzzy C-Means (FCM)-based approach for computerized segmentation of breast lesions in dynamic contrast-enhanced MR images. Academic Radiology. 2006;13(1):63–72. doi: 10.1016/j.acra.2005.08.035 [DOI] [PubMed] [Google Scholar]
- 12.Gilhuijs KGA, Giger ML, Bick U. Computerized analysis of breast lesions in three dimensions using dynamic magnetic-resonance imaging. Med Phys. 1998;25(9):1647–1654. doi: 10.1118/1.598345 [DOI] [PubMed] [Google Scholar]
- 13.Chen W, Giger ML, Li H, Bick U, Newstead GM. Volumetric texture analysis of breast lesions on contrast-enhanced magnetic resonance images. Magn Reson Med. 2007;58(3):562–571. doi: 10.1002/mrm.21347 [DOI] [PubMed] [Google Scholar]
- 14.Chen W, Giger ML, Bick U, Newstead GM. Automatic identification and classification of characteristic kinetic curves of breast lesions on DCE-MRI. Med Phys. 2006;33(8):2878–2887. doi: 10.1118/1.2210568 [DOI] [PubMed] [Google Scholar]
- 15.Bhooshan N, Giger ML, Jansen SA, Li H, Lan L, Newstead GM. Cancerous Breast Lesions on Dynamic Contrast-enhanced MR Images: Computerized Characterization for Image-based Prognostic Markers. Radiology. 2010;254(3):680–690. doi: 10.1148/radiol.09090838 [DOI] [PMC free article] [PubMed] [Google Scholar]
- 16.Shimauchi A, Giger ML, Bhooshan N, et al. Evaluation of Clinical Breast MR Imaging Performed with Prototype Computer-aided Diagnosis Breast MR Imaging Workstation: Reader Study. Radiology. 2011;258(3):696–704. doi: 10.1148/radiol.10100409 [DOI] [PubMed] [Google Scholar]
- 17.Ji Y, Li H, Edwards AV, et al. Independent validation of machine learning in diagnosing breast cancer on magnetic resonance imaging within a single institution. Cancer Imaging. 2019;19(1):64. doi: 10.1186/s40644-019-0252-2 [DOI] [PMC free article] [PubMed] [Google Scholar]
- 18.Sahiner B, Chan HP, Hadjiiski L. Classifier performance prediction for computer-aided diagnosis using a limited dataset. Med Phys. 2008;35(4):1559–1570. doi: 10.1118/1.2868757 [DOI] [PMC free article] [PubMed] [Google Scholar]
- 19.Efron B, Tibshirani R. Improvements on Cross-Validation: The .632+ Bootstrap Method. Journal of the American Statistical Association. 1997;92(438):548–560. [Google Scholar]
- 20.Metz CE, Pan X. “Proper” binormal ROC curves: Theory and maximum-likelihood estimation. Journal of Mathematical Psychology. 1999;43(1):1–33. doi: 10.1006/jmps.1998.1218 [DOI] [PubMed] [Google Scholar]
- 21.Whitney HM, Drukker K, Giger ML. Performance metric curve analysis framework to assess impact of the decision variable threshold, disease prevalence, and dataset variability in two-class classification. J Med Imag. 2022;9(03). doi: 10.1117/1.JMI.9.3.035502 [DOI] [PMC free article] [PubMed] [Google Scholar]
- 22.McNemar Q Note on the sampling error of the difference between correlated proportions or percentages. Psychometrika. 1947;12(2):153–157. doi: 10.1007/BF02295996 [DOI] [PubMed] [Google Scholar]
- 23.Dietterich TG. Approximate Statistical Tests for Comparing Supervised Classification Learning Algorithms. Neural Computation. 1998;10(7):1895–1923. doi: 10.1162/089976698300017197 [DOI] [PubMed] [Google Scholar]
- 24.Drukker K, Pesce L, Giger M. Repeatability in computer-aided diagnosis: Application to breast cancer diagnosis on sonography. Med Phys. 2010;37:2659–2669. doi: 10.1118/1.3427409 [DOI] [PMC free article] [PubMed] [Google Scholar]
- 25.Van Dusen A, Vieceli M, Drukker K, Abe H, Giger ML, Whitney HM. Repeatability profiles towards consistent sensitivity and specificity levels for machine learning on breast DCE-MRI. In: Samuelson FW, Taylor-Phillips S, eds. Medical Imaging 2020: Image Perception, Observer Performance, and Technology Assessment. SPIE; 2020:113160I. doi: 10.1117/12.2548159 [DOI] [Google Scholar]
- 26.Drukker K, Pesce LL, Giger ML. Repeatability and classifier bias in computer-aided diagnosis for breast ultrasound. In: Medical Imaging 2010: Computer-Aided Diagnosis. Vol 7624. SPIE; 2010:681–687. doi: 10.1117/12.844889 [DOI] [Google Scholar]
- 27.Vieceli M, Van Dusen A, Drukker K, Abe H, Giger ML, Whitney HM. Case-based repeatability of machine learning classification performance on breast MRI. In: Hahn HK, Mazurowski MA, eds. Medical Imaging 2020: Computer-Aided Diagnosis. SPIE; 2020:70. doi: 10.1117/12.2548144 [DOI] [Google Scholar]
- 28.de Oliveira M, Drukker K, Vieceli M, Abe H, Giger ML, Whitney HM. Comparison of diagnostic performances, case-based repeatability, and operating sensitivity and specificity in classification of breast lesions using DCE-MRI. In: Samuelson FW, Taylor-Phillips S, eds. Medical Imaging 2021: Image Perception, Observer Performance, and Technology Assessment. SPIE; 2021. doi: 10.1117/12.2581883 [DOI] [Google Scholar]
- 29.Amstutz P, Drukker K, Li H, Abe H, Giger ML, Whitney HM. Case-based diagnostic classification repeatability using radiomic features extracted from full-field digital mammography images of breast lesions. In: Drukker K, Mazurowski MA, eds. Medical Imaging 2021: Computer-Aided Diagnosis. SPIE; 2021:30. doi: 10.1117/12.2580743 [DOI] [Google Scholar]
- 30.Salzberg SL. On Comparing Classifiers: Pitfalls to Avoid and a Recommended Approach. Data Mining and Knowledge Discovery. 1997;1(3):317–328. doi: 10.1023/A:1009752403260 [DOI] [Google Scholar]
- 31.Nadeau C, Bengio Y. Inference for the Generalization Error. Machine Learning. 2003;52(3):239–281. doi: 10.1023/A:1024068626366 [DOI] [Google Scholar]
- 32.Brazdil PB, Soares C. A Comparison of Ranking Methods for Classification Algorithm Selection. In: Proceedings of the European Conference on Machine Learning. ; 2000:63–75. [Google Scholar]
- 33.Bouckaert RR. Choosing Between Two Learning Algorithms Based on Calibrated Tests. In: Proceedings of the Twentieth International Conference on Machine Learning (ICML-2003). ; 2003. [Google Scholar]
- 34.Demsar J Statistical Comparisons of Classifiers over Multiple Data Sets. Journal of Machine Learning Research. 2006;7:1–30. [Google Scholar]
- 35.Raeder T, Hoens TR, Chawla NV. Consequences of Variability in Classifier Performance Estimates. In: 2010. IEEE International Conference on Data Mining. IEEE; 2020:421–430. doi: 10.1109/ICDM.2010.110 [DOI] [Google Scholar]
- 36.Santafe G, Inza I, Lozano JA. Dealing with the evaluation of supervised classification algorithms. Artif Intell Rev. 2015;44(4):467–508. doi: 10.1007/s10462-015-9433-y [DOI] [Google Scholar]
Associated Data
This section collects any data citations, data availability statements, or supplementary materials included in this article.