Abstract
Melanoma is a malignant skin tumor. This study aimed to explore and assess the effect of novel biomarkers on the progression of melanoma. Differently expressed genes (DEGs) were screened from GSE3189 and GSE46517 datasets of Gene Expression Omnibus database using GEO2R. Gene Ontology and Kyoto Encyclopedia of Genes and Genomes pathway analyses were conducted based on the identified DEGs. Hub genes were identified and assessed using protein–protein interaction networks, principal component analysis, and receiver operating characteristic curves. Quantitative real-time polymerase chain reaction was employed to measure the mRNA expression levels. TIMER revealed the association between aldehyde dehydrogenase 2 (ALDH2) and tumor immune microenvironment. The viability, proliferation, migration, and invasion were detected by cell counting kit-8, 5-ethynyl-2′-deoxyuridine, wound healing, and transwell assays. Total 241 common DEGs were screened out from GSE3189 and GSE46517 datasets. We determined 6 hub genes with high prediction values for melanoma, which could distinguish tumor samples from normal samples. ALDH2, ADH1B, ALDH3A2, DPT, EPHX2, and GATM were down-regulated in A375 and SK-MEL-2 cells, compared with the human normal melanin cell line (PIG1 cells). ALDH2 was selected as the candidate gene in this research, presenting a high diagnostic and predictive value for melanoma. ALDH2 had a positive correlation with the infiltrating levels of immune cells in melanoma microenvironment. Overexpression of ALDH2 inhibited cell viability, proliferation, migration, and invasion of A375/SK-MEL-2 cells. ALDH2 is a new gene biomarker of melanoma, which exerts an inhibitory effect on melanoma.
Keywords: Melanoma, Differently expressed genes, Hub gene, ALDH2
Subject terms: Biotechnology, Cancer, Cell biology, Genetics, Molecular biology
Introduction
Melanoma, one of lethal skin tumors cancers, stems from pigment-producing cells and also appears in other parts of the body1–3. Additionally, melanoma is the most aggressive and fastest-growing form of all skin cancers, which is often diagnosed at an advanced stage4–6. Prognosis is mainly dependent on disease stage, with 5-year survival rates for melanoma being less than 10% in patients with stage IV (distant metastatic) disease7. The annual incidence of melanoma has risen steadily over the past 40 years8. Immunotherapies, such as ipilimumab, pembrolizumab, and nivolumab, are the treatment options for malignant melanoma9. In addition, biomarkers associated with tumorigenesis have been identified as potential targets for molecularly targeted melanoma therapies, such as tyrosine kinase inhibitors10. Treatment with conventional methods suggests some defects such as poor efficacy, long treatment time, easy relapse, and drug resistance11. Therefore, a combination of immunotherapy and a single or multiple tyrosine kinase inhibitors has been proven to improve outcomes for melanoma patients compared to monotherapy12. The limitations of melanoma treatment options emphasize the need for biomarkers to guide treatment decisions13. Nevertheless, searching for potential gene therapeutic targets associated with melanoma is essential.
Aldehyde dehydrogenase 2 (ALDH2) is a mitochondrial enzyme, which is responsible for the metabolism of acetaldehyde and lipid peroxides14,15. Low expression of ALDH2 leads to the accumulation of aldehydes, which plays a key role in the progression of cancer16. Recent investigations prove that ALDH2 has a significant effect on cancer susceptibility17. In hypopharyngeal squamous cell carcinoma, ALDH2 is associated with the poorer prognosis and shorter survival of patients18. Additionally, down-regulation of ALDH2 contributes to the progression of hepatocellular cancer19. By evaluating the survival and pathological features of 455 patients with gastric cancer, it is found that overexpression of ALDH2 is related to better prognosis of patients with gastric cancer, which is reflected in the lower pathological malignancy of patients with gastric cancer with high expression of ALDH220. However, the underlying molecular mechanism of ALDH2 in melanoma is still unclear and requires further investigation.
The development of analytical systems for the identification of biomarkers is an important direction in cancer therapy21. Numerous genes have been reported to be involved in melanoma. LRRK2 improves the survival probability of patients with cutaneous melanoma by single-cell RNA sequencing and in vitro experiments22. DNA binding inhibitor 1 is highly expressed in primary melanoma23. After examining gene expression and clinical data from cutaneous melanoma patients based on the Cancer Genome Atlas and Gene Expression Synthesis, CDCA8, DPF1, ABCC3, CAPS2, CCR6, CLU, PTK2B, SATB1, and SYNE are identified as prognostic biomarkers of melanoma, which have significant effects on the prognosis of melanoma24. Nevertheless, whether ALDH2 is involved in tumor regulation in melanoma has not been fully investigated.
In this study, we analyzed GSE3189 and GSE46517 datasets from Gene Expression Omnibus (GEO) database to search the differentially expressed genes (DEGs) of melanoma. After comprehensive bioinformatics analysis, ALDH2, as a key gene of melanoma was identified. Then we investigated the role of ALDH2 in proliferation, migration, and invasion of melanoma in vitro. Our research hopes to offer new perceptions into the mechanism of melanoma, which can reveal potential molecular targets for the treatment of melanoma.
Materials and methods
Microarray data source
The gene expression data analyzed in this study were retrieved from GEO of the National Center for Biotechnology Information (https://www.ncbi.nih.gov/geo/). Two microarray datasets, GSE3189 and GSE46517, were retrieved from the database using the search term “melanoma”.
DEGs selection
GEO2R (www.ncbi.nlm.nih.gov/geo/geo2r) was applied to analyze the dataset. DEGs (tumor vs. control) were determined with adj. P < 0.05 and |logFC|≥ 2 as filter criteria. Heatmaps and volcano plots were generated to display the identified DEGs. The standardization and cross-comparison evaluation of the dataset samples were exhibited using boxplots.
Functional enrichment analysis of common DEGs
Gene Ontology (GO) and Kyoto Encyclopedia of Genes and Genomes (KEGG) pathway enrichment analyses for common DEGs were analyzed in the DAVID (Database for Annotation, Visualization, and Integrated Discovery) database (https://david.ncifcrf.gov/). The results with the minimum P-value were selected to display, indicating the most significant enrichment. Bar and bubble plots were drawn to visualize the enrichment results.
Protein–protein interaction (PPI) network construction and hub module analysis
DEGs were analyzed using the Search Tool for the Retrieval of Interacting Genes (https://www.string-db.org/) online database to reveal the interactions between proteins encoded by DEGs that played important roles in the pathogenesis of melanoma. A confidence interaction score set at 0.15 was regarded as significant standards. Subsequently, the PPI network was constructed and visualized using Cytoscape software (www.cytoscape.org/) based on the protein interaction information. and key modules were identified from the PPI network using MCODE (Molecular Complex Detection). The plugin CytoHubba (Version 0.1) of Cytoscape was employed to calculate the degree of each protein node, and the hub genes were selected according to the degree.
Analysis of hub genes
The expression ridge plot was plotted using R package ggplot2. The expression levels of hub genes were used as variables for principal component analysis (PCA). PCA analysis was conducted to determine whether the hub genes could distinguish between the tumor samples from control samples. PC1 and PC2 were obtained as principal component variables. The value of the original variable corresponding to the arrow in the horizontal and vertical directions could reflect the correlation between the variable and PC1 and PC2, respectively.
Receiver operating characteristic (ROC) curves were plotted to evaluate the diagnostic accuracy of hub genes by calculating the area under the ROC curve (AUC) using Gene expression profile interactive analysis (http://gepia.cancer-pku.cn/). The expression of hub genes was further confirmed using the Gene Expression Profiling Interactive Analysis 2 database.
Survival analysis and correlation analysis between key gene and immune infiltration
Kaplan–Meier plotter (http://kmplot.com/analysis/) was applied to reveal the association between the expression levels of the key gene and the survival of patients with melanoma. The correlation between the expression level of key gene and the infiltration of different types of immune cells in the melanoma microenvironment was analyzed via Tumor Immune Estimation Resource database (https://cistrome.shinyapps.io/timer/).
Cell culturing and transfection
Human normal melanin cell line, PIG1 (American type culture collection, Manzas, Virginia, USA), and malignant melanoma cells, A375 and SK-MEL-2 cells (iCell Bioscience Inc, Shanghai, China) were maintained in Dulbecco's Modified Eagle's Medium (DMEM) supplemented with 10% fetal bovine serum at 37° C with 5% CO2. The pcDNA3.1-ALDH2 plasmid synthesized by GenePharma (Shanghai, China) was transfected into A375 and SK-MEL-2 cells with the presence of Lipo3000 transfection reagent (Thermo Fisher Scientific, Waltham, MA, USA). Transfected cells were harvested after 48 h of incubation in 6-well plates and the transfection efficiency was measured using quantitative real-time polymerase chain reaction (qRT-PCR).
qRT-PCR
After TRIZOL reagent (Invitrogen, Carlsbad, CA, USA) extracting RNA from cells, the RNA concentration and absorbance values at 260 nm and 280 nm were measured using a UV spectrophotometer. Samples with an OD260/OD280 ratio between 1.9 and 2.0 indicated high purity, which was suitable for subsequent experiments. Reverse transcription was carried out using a PCR instrument to synthesize cDNA templates, and qRT-PCR was performed using ABI7500 quantitative PCR instrument (Applied Biosystems, Foster City, CA, USA). The reaction procedures were as follows: 95 °C for 30 s pre-denaturation, 95 °C for 10 s denaturation, 60 °C for 30 s annealing, and 40 cycles. GAPDH was used as an internal control. The Ct values were analyzed by the 2−ΔΔCt method. The experiment was repeated three times. Primer sequences could be seen in Table 1.
Table 1.
Primer sequences.
| Name | Sequences (5′-3′) |
|---|---|
| GAPDH-F | AACTTTGGCATTGTGGAAGG |
| GAPDH-R | ACACATTGGGGGTAGGAACA |
| ALDH2-F | GACACGAGAAAGCGTCATCA |
| ALDH2-R | GAGAGGAGAGTGCGTGGAAC |
| ALDH3A2-F | TGAAGCATCCCTCCAAAATC |
| ALDH3A2-R | GTTGGGGCTATGTAGCGTGT |
| ADH1B-F | GAGTGTTGGAGAAGGGGTGA |
| ADH1B-R | GTGCCAAGGAAGTGGTGAAT |
| DPT-F | CTAGGAAGGCTGGCAGACAC |
| DPT-R | GGACATCACAGGAGGAGGAA |
| EPHX2-F | ACGACCGTGCTGAGAGAGAT |
| EPHX2-R | TTCAGATTAGCCCCGATGTC |
| GATM-F | TGAGTTTGAGCCATGCTTTG |
| GATM-R | TATGCATGGGATTGGGATCT |
Cell counting kit-8 (CCK-8) assay
Cell viability was detected using a Cell Counting Kit-8 (CCK-8) (Solarbio, Beijing, China). Cells were seeded in 96-well plates with 100 μL of cell suspension (1 × 10⁴/well). As directed by the manufacturer, the A375 and SK-MEL-2 cells were cultured at 37 °C until 80% confluence, and the medium was replaced with maintenance medium (2% fetal bovine serum + 98% DMEM). After adding the cell suspension, the 96-well culture plate was placed in an incubator for 24 h. After washing twice with Dulbecco’s phosphate-buffered saline, cells were added with the maintenance medium (90 μL) and 10 μL CCK-8 solution and incubated with cells for 2 h. The absorbance at 450 nm was measured using a microplate reader.
5-ethynyl-2′-deoxyuridine (EdU) assay
Cell proliferation was assessed using the EdU kit (Solarbio). In brief, A375 and SK-MEL-2 cells were incubated with 4% paraformaldehyde for 15 min. Afterwards, cells were permeabilized with 0.3% TritonX-100 and then stained with the reaction solution. The cells were then incubated with 4′,6-Diamidino-2-Phenylindole for 30 min in the dark. The stained cells were observed using a fluorescence microscope (Olympus, Tokyo, Japan).
Wound healing assay
The wound-healing assay was performed to detect cell migration ability. Each experiment was repeated thrice. Briefly, the A375 and SK-MEL-2 cells (5 × 10⁵/well) were seeded in 6-well plates. After complete adherence, cells were scratched using 10 μL sterile pipette tips. The cells were washed with phosphate-buffered saline, and fresh medium was added. At 0 h, cells were photographed using an inverted microscope. Images were captured after 24 h to calculate the cell migration rate. The healing ratio (%) = (scratch spacing at 0 h − scratch spacing at 24 h)/ scratch spacing at 0 h × 100%.
Transwell assay
In the migration assay, cell suspension (1 × 10⁵/well) was seeded into the upper chamber and 600 μl medium containing 20% fetal bovine serum was added to the lower compartment. After incubation for 24 h, cells were fixed with 4% paraformaldehyde for 30 min and stained with 0.1% crystal violet. The non-migrated cells were removed and washed three times with phosphate buffered solution. Cells were observed under a microscope to take photos for counting.
Statistical analysis
GraphPad Prism 7.0 was used to perform a statistical analysis on the data, which were all represented as mean ± standard deviation. Comparisons between two groups were conducted by t test. One-Way ANOVA followed by Tukey's multiple comparisons test was used for comparison between multiple groups. P < 0.05 represented statistically significant.
Ethics approval and consent to participate
No human and animal studies were used in this study.
Results
DEGs identification
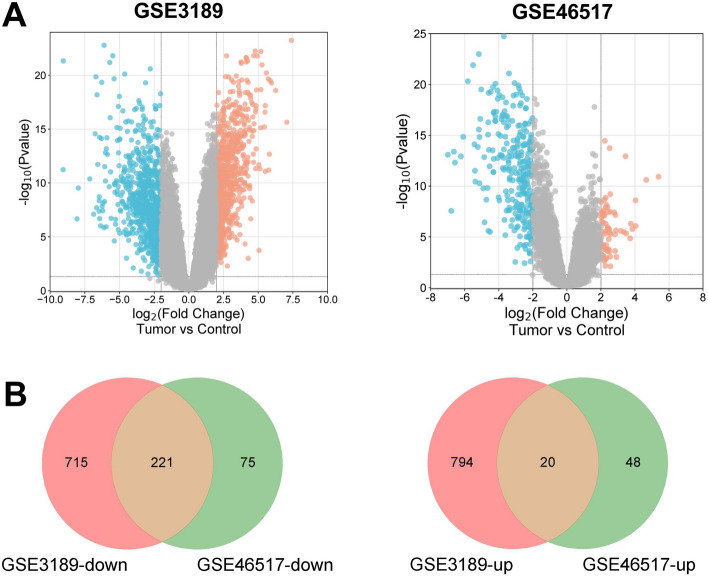
Total 7 normal samples (Control) and 45 tumor samples of GSE3189 dataset were selected for analysis. We obtained 1750 DEGs according to adj. P < 0.05 and |logFC|≥ 2, of which 814 DEGs were up-regulated and 936 DEGs were down-regulated. The GSE46517 dataset included 8 normal samples (Control) and 73 tumor samples. We selected 365 DEGs in GSE46517 dataset according to adj. P < 0.05 and |logFC|≥ 2, of which 68 DEGs were up-regulated and 297 DEGs were down-regulated. Afterwards, the volcano maps showed the distribution of up-regulated and down-regulated DEGs in GSE3189 and GSE46517 datasets (Fig. 1A). The common DEGs in the 2 datasets were displayed in a Venn diagram, which suggested that there were 241 common DEGs between the two datasets (Fig. 1B).
Figure 1.
Differently expressed genes (DEGs) in GSE3189 and GSE46517 datasets. (A) Volcano map of DEGs in GSE3189 and GSE46517 datasets. The x-coordinate is log2FoldChange, and the y-coordinate is − log10 (P-value). Red dots indicate up-regulated genes and blue dots indicate down-regulated genes. (B) Venn diagram of common DEGs. The numbers in each circle represent the total number of DEGs, and the overlapping part of the circles represents the common DEGs.
Using GEO2R, the qualified samples in GSE3189 and GSE46517 datasets were obtained after data correction (Figure S1A, C). The top 25 significantly up-regulated and down-regulated DEGs (Supplementary materials) were selected to generate the heat maps of DEGs, which indicated that the sample had good clustering and high confidence (Figure S1B,D).
Enrichment analysis of DEGs
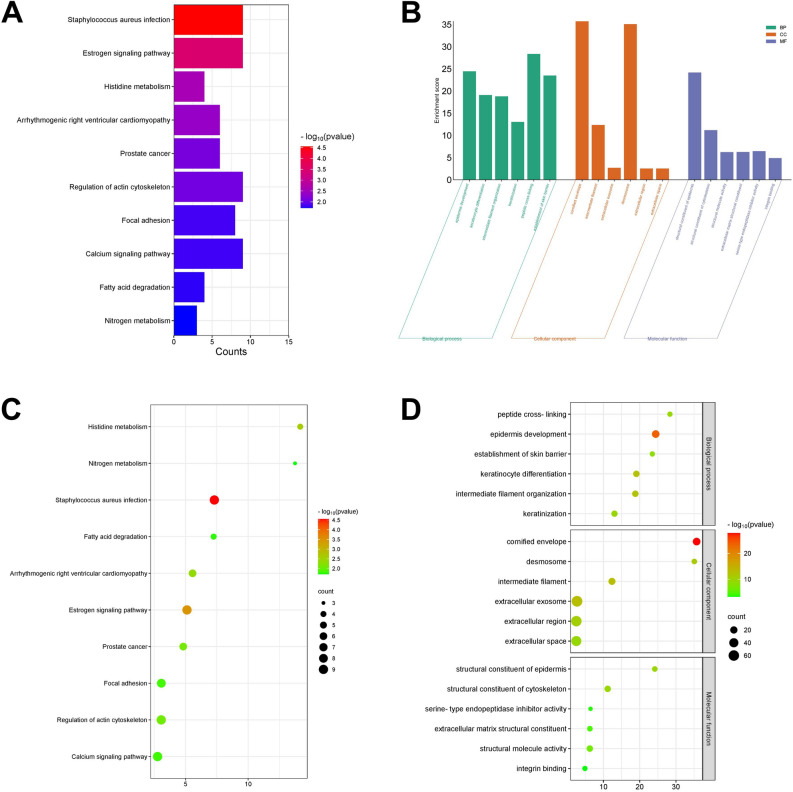
Based on the KEGG enrichment analysis, we identified the top 10 significantly enriched pathways with the minimum P-value, as shown in the KEGG pathway enrichment bar chart and KEGG enrichment bubble chart (Fig. 2A,C). The pathways enriched by dysregulated DEGs mainly included “Staphylococcus aureus infection”, “Estrogen signaling pathway”, “Histidine metabolism”, “Arrhythmogenic right ventricular cardiomyopathy”, “Prostate cancer”, “Regulation of actin cytoskeleton”, etc.
Figure 2.
Enrichment analysis of DEGs. (A) Kyoto Encyclopedia of Genes and Genomes (KEGG) bar chart; (B) Histogram of Gene Ontology (GO) enrichment analysis. The abscissa is Go term, and the ordinate is − log10 (P-value). (C) KEGG bubble map; (D) GO enrichment analysis bubble map, the color depth of nodes represents the corrected p-value, and the size of nodes refers to the number of genes involved.
Copyright permission: All the KEGG data in this study were publicly available from KEGG database (www.kegg.jp/kegg/kegg1.html) and we have obtained the copyright permission to use the following KEGG pathway map images in this article.
For the GO enrichment analysis of DEGs, the enrichment results were mainly divided into 3 categories: molecular function (MF), biological process (BP), and cellular component (CC). The top 6 significantly enriched functions were exhibited in the GO enrichment bar chart and bubble chart (Fig. 2B,D). The changes in MF enriched by DEGs were in “structural constituent of epidermis”, “structural constituent of cytoskeleton”, “structural molecule activity”, etc. The changes in BP enriched by DEGs were significantly enriched in “epidermis development”, “keratinocyte differentiation”, “intermediate filament organization”, etc. The changes in CC enriched by DEGs were mainly enriched in “cornified envelope”, “intermediate filament”, “extracellular exosome”, etc.
Hub genes identified from PPI networks
The Search Tool for the Retrieval of Interacting Genes online database was employed to construct PPI networks based on the DEGs, which were visualized using Cytoscape software (Figure S2A). We identified the highly interconnected cluster from the PPI network of DEG as potential functional molecular complexes in melanoma (Figure S2B). Then, genes in this cluster were sequenced according to the score. After literature research, we chose 6 hub genes: ALDH2, ADH1B, ALDH3A2, DPT, EPHX2, and GATM, which were rarely reported in melanoma as the object of this research to explore their accuracy in the diagnosis and prediction of melanoma.
Analysis of hub genes
The correlation coefficient of hub gene expression in the datasets was shown in the heat map (Figure S3A). After processing PCA analysis, the obtained PC1 and PC2 provided a variance explanation rate of 87.3%. Using PC1 and PC2 as the axes to plot the scatter plot, there was an apparent separation between the samples, further confirming the effectiveness of PC1 and PC2. There were obvious differences in the expression of hub genes between the Control group and the Tumor group, suggesting that the expression of hub genes could be a basis for distinguishing control group samples from melanoma group samples (Figure S3B). The ridge plot revealed the expression of hub genes in the GSE3189 dataset (Figure S3C).
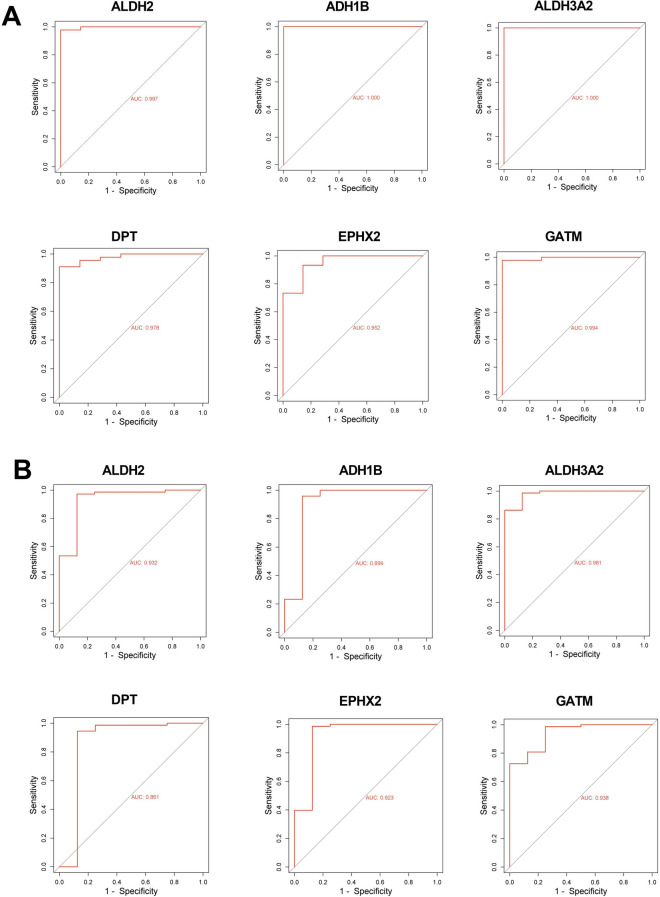
We used the expression of ALDH2, ADH1B, ALDH3A2, DPT, EPHX2, and GATM in GSE3189 dataset to draw ROC curves, showing the false positive rates of 0.3%, 0%, 0%, 2.2%, 4.8%, 0.06%, respectively, and the true positive rate of 99.7%, 100%, 100%, 97.8%, 95.2%, 99.4%, respectively (Fig. 3A). The expression of hub genes in GSE46517 dataset was also applied to plot the ROC curve, with the false positive rates of 6.8%, 10.1%, 1.9%, 13.9%, 7.7%, 6.2%, respectively, and the true positive rate of 93.2%, 89.9%, 98.1%, 86.1%, 92.3%, 93.8%, respectively (Fig. 3B). The ROC curves indicated that the hub genes were qualified indicators for distinguishing between melanoma and healthy controls.
Figure 3.
The receiver operating characteristic (ROC) analysis of hub genes. (A) The ROC curve plotted using the expression of hub gene in GSE3189 dataset. (B) The ROC curve plotted using the expression of hub gene in GSE46517 dataset. The horizontal coordinate is false positive rate and the vertical coordinate is true positive rate, indicating the expression value of the gene in the sample data.
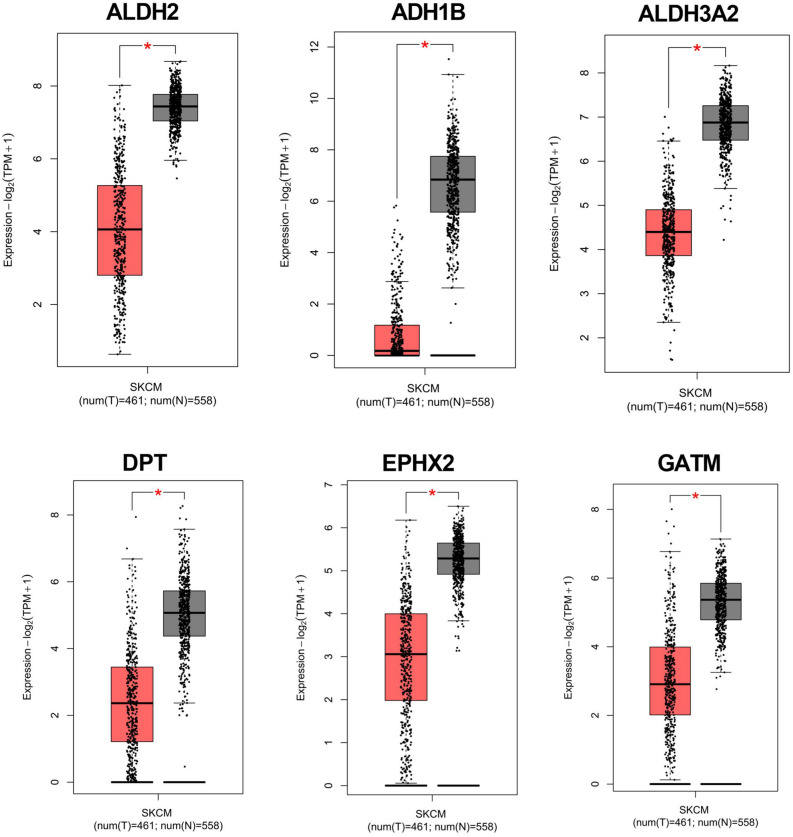
The Expression-DIY Box-Plot function in the Gene Expression Profiling Interactive Analysis 2 database (http://gepia2.cancer-pku.cn/#index) was employed to verify the expression of the hub genes in melanoma. ALDH2, ADH1B, ALDH3A2, DPT, EPHX2, and GATM were down-regulated in the tumor tissues, which is consistent with the expression of hub genes in the GSE3189 and GSE46517 datasets (Fig. 4).
Figure 4.
The expression levels of hub genes verified by Gene Expression Profiling Interactive Analysis 2 database. The expression levels of ALDH2, ADH1B, ALDH3A2, DPT, EPHX2, and GATM in melanoma were verified in Gene Expression Profiling Interactive Analysis 2 database.
Analysis of ALDH2 in melanoma
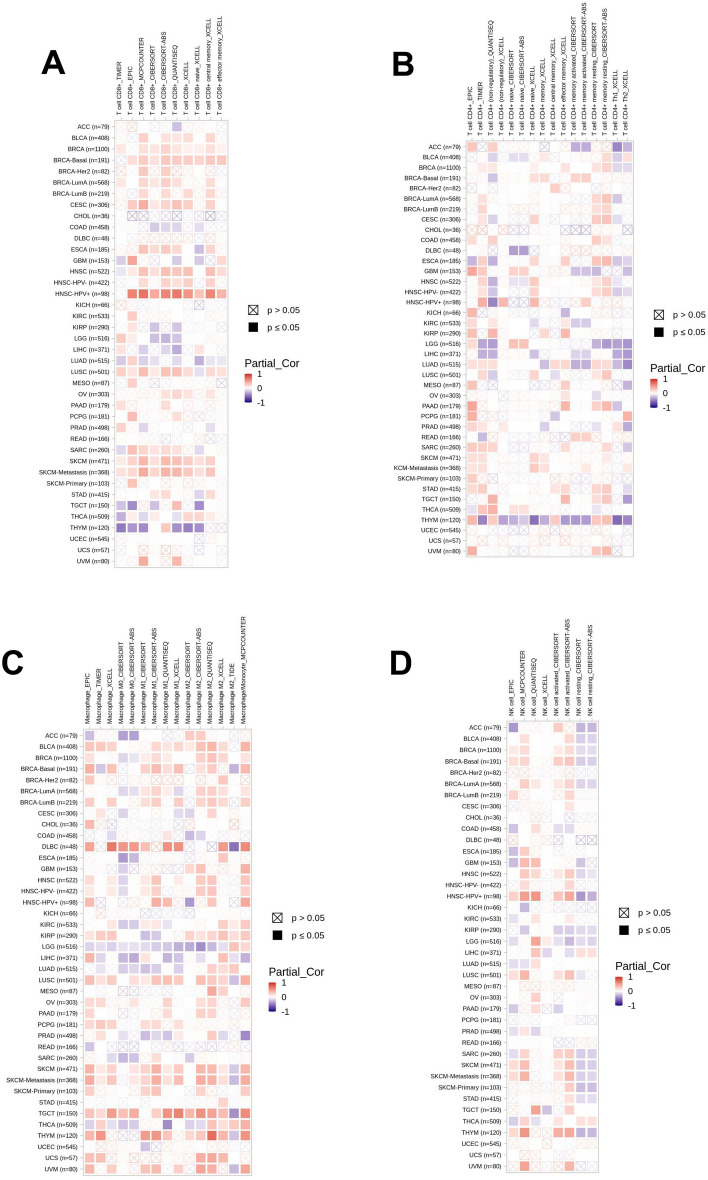
Survival analysis revealed a significant difference in survival rate between patients with high and low expression levels of ALDH2, which indicated the expression of ALDH2 could distinguish melanoma patients from normal people (Figure S4). The immune infiltration analysis demonstrated that the expression of ALDH2 was significantly correlated with the infiltration of the immune cells in melanoma (Figure S5). Low expression of ALDH2 had a significant impact on the infiltrating levels of immune cells, promoting immune infiltration in tumor microenvironment (Fig. 5A–D).
Figure 5.
Correlation between ALDH2 and infiltrating level of immune cells. (A) The correlation between ALDH2 and infiltrating level of CD8+ cells. (B) The correlation between ALDH2 and infiltrating level of CD4+ cells. (C) The correlation between ALDH2 and infiltrating level of Macrophage. (D) The correlation between ALDH2 and infiltrating level of natural killer cells.
Validation for the expression of hub genes using qRT-PCR
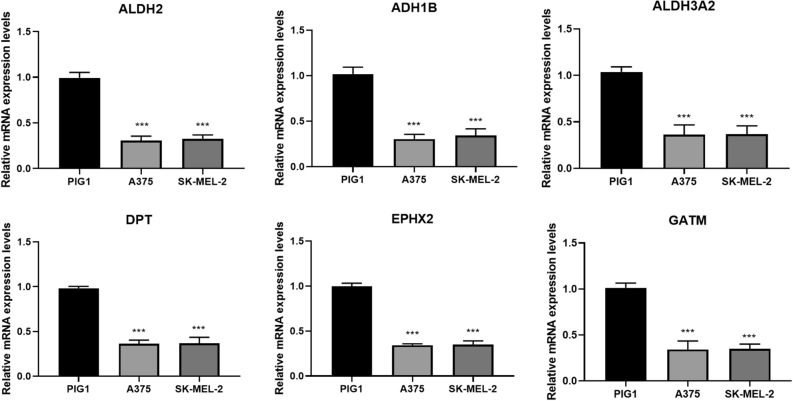
Compared to PIG1 cells, the mRNA expression levels of ALDH2, ADH1B, ALDH3A2, DPT, EPHX2, and GATM in A375 and SK-MEL-2 cells were significantly lower, which is consistent with the results of bioinformatics analysis (Fig. 6).
Figure 6.
The mRNA expression of ALDH2, ADH1B, ALDH3A2, DPT, EPHX2, and GATM was measured in melanoma cells (A375/SK-MEL-2 cells) and human normal melanin cell line (PIG1 cells) by quantitative real-time polymerase chain reaction (qRT-PCR), **P < 0.01, ***P < 0.001 versus PIG1 cells.
Overexpression of ALDH2 inhibits viability, proliferation, migration, and invasion of melanoma cells
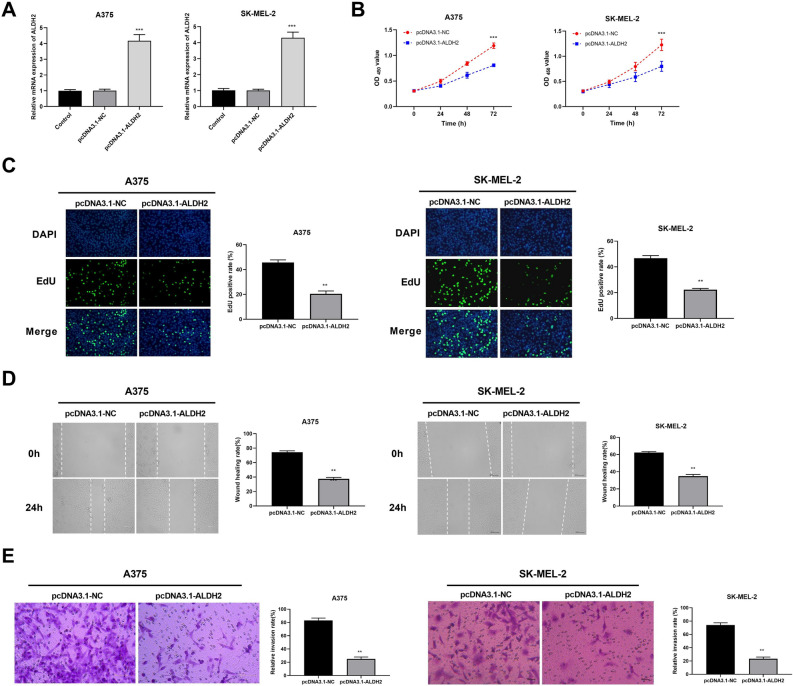
The mRNA expression of ALDH2 in the pcDNA3.1-ALDH2 group was apparently lower than that in the pcDNA3.1-NC group (Fig. 7A). The CCK-8 assay suggested that compared with the pcDNA3.1-NC group, the cell viability of A375 and SK-MEL-2 cells in the pcDNA3.1-ALDH2 group was significantly suppressed at 24 h, 48 h, and 72 h (Fig. 7B). EdU results demonstrated that the EdU-positive A375 and SK-MEL-2 cells in the pcDNA3.1-ALDH2 group were significantly reduced, compared with the pcDNA3.1-NC group (Fig. 7C). Additionally, the migration and invasion abilities A375 and SK-MEL-2 cells in the pcDNA3.1-ALDH2 group were significantly decreased, compared with the pcDNA3.1-NC group, according to wound healing and transwell assays (Fig. 7D,E).
Figure 7.
ALDH2 inhibits viability, proliferation, migration, and invasion of melanoma cells. (A) Transfection efficiency was detected by qRT-PCR. (B) The viability of A375/SK-MEL-2 cells was measured by Cell counting Kit-8 assay. (C) The proliferation was detected by 5-Ethynyl-2′-deoxyuridine assay. (D) The migration of A375/SK-MEL-2 cells was measured by wound healing assay. (E) The invasion of A375/SK-MEL-2 cells was measured by Transwell assay. ***P < 0.001 versus pcDNA3.1-NC group.
Discussion
Melanoma is one of the most metastatic and drug-resistant solid tumors25. Advances in bioinformatics tools such as sequencing and microarrays have made it possible to develop highly reliable and accurate biomarkers, which are important for early identification, rapid diagnosis, accurate prognosis, and progression prevention 26,27. In this paper, we identified 6 hub genes based on the gene expression dataset of GEO database and PPI network. Subsequently, we systematically assessed that hub genes were reliable and sensitive biomarkers for melanoma with high prediction values. In addition, it was determined that ALDH2 could accurately distinguish between melanoma and normal samples. Additionally, we also discovered that overexpression of ALDH2 inhibited viability, proliferation, migration, and invasion of melanoma cells.
ALDH2, ADH1B, ALDH3A2, DPT, EPHX2, and GATM have been screened out as biomarkers in various tumors based on bioinformatics analysis. Among these hub genes, ALDH2 has been reported in hepatocarcinogenesis28, endometrial cancer29, and colorectal cancer30. In addition, after analyzing expression profiles of GEO database, ALDH3A2 is overexpressed in gastric cancer, and survival analysis suggests that patients with low ALDH3A2 expression have significantly shorter overall survival than those with high ALDH3A2 expression, indicating that ALDH3A2 can serve as an independent predictor and a prognostic marker for gastric cancer31. In ovarian cancer, ADH1B is found significantly down-regulated in ovarian cancer cells and tissues after integrated bioinformatics analysis and western blot assay32. DPT is a candidate protein biomarker in tissue lysates of metastatic melanoma and is identified in tissue lysates of malignant melanoma by selected reaction monitoring33. The reduction of EPHX2 in A375 melanoma cells reveals a disruption of the antioxidant system, thus enhancing its ability to metastasize34. Based on the GSE45216, GSE98774, and GSE108008 datasets, GATM is identified as one of the hub genes in cutaneous squamous cell carcinoma35. We identified 6 hub genes of melanoma from the PPI network based on the GSE3189 and GSE46517 datasets. Taken together, ALDH2, ADH1B, ALDH3A2, DPT, EPHX2, and GATM are potential biomarkers of melanoma, which have high prediction values for melanoma.
ALDH2 is related to immune cells in various tumor microenvironments. In head and neck squamous cell carcinoma, ALDH2 is associated with CD8+ T cell infiltration in the tumor microenvironment36. As a biomarker of prostate cancer prognosis, ALDH2 expression is positively associated with B cells, CD8+ T cells, neutrophils, and macrophages37. ALDH2 expression level is significantly lower in hepatocellular carcinoma tissue than in normal liver tissue and is correlated with the immune infiltration of dendritic cells and macrophages38. In lung adenocarcinoma, ALDH2 is highly associated with B cell activity and partial correlation with CD4+ T-cell activity, suggesting that ALDH2 interacts with B cells and T cells in patients with lung adenocarcinoma39. Herein, we found that the expression of ALDH2 was correlated with CD8+ , CD4+, macrophage and other immune cells, which could promote the infiltration of immune cells. All in all, ALDH2 was associated with tumor immune infiltration of immune cells in tumor microenvironment of melanoma.
The role of ALDH2 in tumorigenesis, growth, and metastasis has been widely reported. Low or high expression of ALDH2 promotes or inhibits tumor progression in various cancers40. ALDH2 expression is down-regulated in hepatocellular carcinoma, which can be used as a tumor inhibitor, and overexpression of ALDH2 inhibits the proliferation, migration, and invasion in hepatocellular cancer41. Knockdown of ALDH2 expression can significantly suppress the migration of colon cancer cells, while activation of ALDH2 can promote the migration of colon cancer cells42. In lung adenocarcinoma, down-regulation of ALDH2 expression leads to the accumulation of acetaldehyde, which promotes the proliferation and migration abilities of lung adenocarcinoma cells43. The expression of ALDH2 in human lung cancer is significantly down-regulated, and the overexpression of ALDH2 causes an inhibitory effect on the proliferation and colony formation of lung cancer cells, while the silencing of ALDH2 can reverse the tumor-suppressive effects44. Our study found that overexpression of ALDH2 suppressed the viability, proliferation, migration, and invasion of A375 and SK-MEL-2 cells. Taken together, overexpression of ALDH2 may exert an anti-tumor function in melanoma.
In brief, we identified a key gene biomarker, ALDH2, after comprehensive bioinformatics analysis, which had good specificity and sensitivity to be a biomarker of melanoma. ALDH2 was down-regulated in melanoma, promoting the infiltration levels of immune cells in tumor microenvironment. Most importantly, overexpression of ALDH2 suppressed the viability, proliferation, migration, and invasion of melanoma cells, which may contribute to the anti-tumor outcomes in the development of melanoma. We provided a new insight into the molecular mechanisms and a potential biomarker for diagnosis of melanoma. Our findings indicate that overexpressing ALDH2 may be a potential gene target for the therapies for melanoma.
Supplementary Information
Author contributions
H.L. and J.L.: Conceptualization; Formal analysis; Methodology; Writing—original draft; Validation; Resources; X.W.: Data curation; Investigation; Software; Writing—review & editing; R.H.: Formal analysis; Resources;Writing—review & editing; Visualization; C.Y. and J.Y.: Methodology; Project administration; Supervision; Writing—review & editing; Validation; all authors have read and approved the manuscript.
Funding
Clinical Research and Transformation Fund of Sichuan Provincial People's Hospital (No. 2021LY04).
Data availability
The datasets used and/or analysed during the current study are available from the corresponding author on reasonable request.
Competing interests
The authors declare no competing interests.
Footnotes
Publisher's note
Springer Nature remains neutral with regard to jurisdictional claims in published maps and institutional affiliations.
These authors contributed equally: Hua Lei and Jinfeng Liao.
Contributor Information
Chuanpeng Ying, Email: yingchuanpeng@163.com.
Jianing Yang, Email: dryangjn@163.com.
Supplementary Information
The online version contains supplementary material available at 10.1038/s41598-024-54084-y.
References
- 1.Caksa S, Baqai U, Aplin AE. The future of targeted kinase inhibitors in melanoma. Pharmacol. Ther. 2022;239:108200. doi: 10.1016/j.pharmthera.2022.108200. [DOI] [PMC free article] [PubMed] [Google Scholar]
- 2.Garbe C, et al. European consensus-based interdisciplinary guideline for melanoma. Part 1: Diagnostics: Update 2022. Eur. J. Cancer. 2022;170:236–255. doi: 10.1016/j.ejca.2022.03.008. [DOI] [PubMed] [Google Scholar]
- 3.Strub T, Ballotti R, Bertolotto C. The "ART" of epigenetics in melanoma: From histone "Alterations, to resistance and therapies". Theranostics. 2020;10(4):1777–1797. doi: 10.7150/thno.36218. [DOI] [PMC free article] [PubMed] [Google Scholar]
- 4.Gorry C, et al. Neoadjuvant treatment for stage III and IV cutaneous melanoma. Cochrane Database Syst. Rev. 2023;1:Cd012974. doi: 10.1002/14651858.CD012974.pub2. [DOI] [PMC free article] [PubMed] [Google Scholar]
- 5.Juszczak AM, et al. Skin cancer, including related pathways and therapy and the role of luteolin derivatives as potential therapeutics. Med. Res. Rev. 2022;42(4):1423–1462. doi: 10.1002/med.21880. [DOI] [PMC free article] [PubMed] [Google Scholar]
- 6.Brunsgaard, E., Wu, Y. P. & Grossman, D. Melanoma in skin of color: Part I. Epidemiology and clinical presentation. J. Am. Acad. Dermatol., (2022). [DOI] [PubMed]
- 7.Keung EZ, Gershenwald JE. Clinicopathological features, staging, and current approaches to treatment in high-risk resectable melanoma. J. Natl. Cancer Inst. 2020;112(9):875–885. doi: 10.1093/jnci/djaa012. [DOI] [PMC free article] [PubMed] [Google Scholar]
- 8.Carter TJ, et al. Melanoma in pregnancy: Diagnosis and management in early-stage and advanced disease. Eur. J. Cancer. 2022;166:240–253. doi: 10.1016/j.ejca.2022.02.016. [DOI] [PubMed] [Google Scholar]
- 9.de Oliveira Filho RS, et al. A review of advanced cutaneous melanoma therapies and their mechanisms, from immunotherapies to lysine histone methyl transferase inhibitors. Cancers (Basel) 2023;15(24):5751. doi: 10.3390/cancers15245751. [DOI] [PMC free article] [PubMed] [Google Scholar]
- 10.Li X, et al. Research progress of microneedles in the treatment of melanoma. J. Control Release. 2022;348:631–647. doi: 10.1016/j.jconrel.2022.06.021. [DOI] [PubMed] [Google Scholar]
- 11.Qu F, et al. Advanced nanocarrier- and microneedle-based transdermal drug delivery strategies for skin diseases treatment. Theranostics. 2022;12(7):3372–3406. doi: 10.7150/thno.69999. [DOI] [PMC free article] [PubMed] [Google Scholar]
- 12.Rager T, et al. Treatment of metastatic melanoma with a combination of immunotherapies and molecularly targeted therapies. Cancers (Basel) 2022;14(15):3779. doi: 10.3390/cancers14153779. [DOI] [PMC free article] [PubMed] [Google Scholar]
- 13.Medhin LB, et al. Extracellular vesicles as a liquid biopsy for melanoma: Are we there yet? Semin. Cancer Biol. 2023;89:92–98. doi: 10.1016/j.semcancer.2023.01.008. [DOI] [PubMed] [Google Scholar]
- 14.Zhang, J. et al., The role of aldehyde dehydrogenase 2 in cardiovascular disease.Nat. Rev. Cardiol. (2023). [DOI] [PubMed]
- 15.Song BJ, et al. Post-translational modifications of mitochondrial aldehyde dehydrogenase and biomedical implications. J. Proteom. 2011;74(12):2691–2702. doi: 10.1016/j.jprot.2011.05.013. [DOI] [PMC free article] [PubMed] [Google Scholar]
- 16.Yang M, Zhang Y, Ren J. ALDH2 polymorphism and ethanol consumption: A genetic-environmental interaction in carcinogenesis. Adv. Exp. Med. Biol. 2019;1193:229–236. doi: 10.1007/978-981-13-6260-6_14. [DOI] [PubMed] [Google Scholar]
- 17.Li R, et al. ALDH2 gene polymorphism in different types of cancers and its clinical significance. Life Sci. 2016;147:59–66. doi: 10.1016/j.lfs.2016.01.028. [DOI] [PubMed] [Google Scholar]
- 18.Avinçsal MO, et al. Impact of alcohol dehydrogenase-aldehyde dehydrogenase polymorphism on clinical outcome in patients with hypopharyngeal cancer. Head Neck. 2018;40(4):770–777. doi: 10.1002/hed.25050. [DOI] [PubMed] [Google Scholar]
- 19.Hou G, et al. Aldehyde dehydrogenase-2 (ALDH2) opposes hepatocellular carcinoma progression by regulating AMP-activated protein kinase signaling in mice. Hepatology. 2017;65(5):1628–1644. doi: 10.1002/hep.29006. [DOI] [PubMed] [Google Scholar]
- 20.Yao S, et al. High ALDH2 expression is associated with better prognosis in patients with gastric cancer. Am. J. Cancer Res. 2022;12(12):5425–5439. [PMC free article] [PubMed] [Google Scholar]
- 21.Pilvenyte G, et al. Molecularly imprinted polymers for the determination of cancer biomarkers. Int. J. Mol. Sci. 2023;24(4):4105. doi: 10.3390/ijms24044105. [DOI] [PMC free article] [PubMed] [Google Scholar]
- 22.Yan J, et al. LRRK2 correlates with macrophage infiltration in pan-cancer. Genomics. 2022;114(1):316–327. doi: 10.1016/j.ygeno.2021.11.037. [DOI] [PubMed] [Google Scholar]
- 23.Ryu B, et al. Id1 expression is transcriptionally regulated in radial growth phase melanomas. Int. J. Cancer. 2007;121(8):1705–1709. doi: 10.1002/ijc.22875. [DOI] [PubMed] [Google Scholar]
- 24.Lee S, et al. Identification of prognostic mRNAs in metastatic cutaneous melanoma. Melanoma Res. 2020;30(6):543–547. doi: 10.1097/CMR.0000000000000697. [DOI] [PubMed] [Google Scholar]
- 25.Ruocco MR, et al. Metabolic flexibility in melanoma: A potential therapeutic target. Semin. Cancer Biol. 2019;59:187–207. doi: 10.1016/j.semcancer.2019.07.016. [DOI] [PubMed] [Google Scholar]
- 26.Ibrahim J, et al. Methylation biomarkers for early cancer detection and diagnosis: Current and future perspectives. Eur. J. Cancer. 2023;178:91–113. doi: 10.1016/j.ejca.2022.10.015. [DOI] [PubMed] [Google Scholar]
- 27.Chen J, et al. Biomarker discovery and application-An opportunity to resolve the challenge of liver cancer diagnosis and treatment. Pharmacol. Res. 2023;189:106674. doi: 10.1016/j.phrs.2023.106674. [DOI] [PubMed] [Google Scholar]
- 28.Jin S, et al. ALDH2(E487K) mutation increases protein turnover and promotes murine hepatocarcinogenesis. Proc. Natl. Acad. Sci. USA. 2015;112(29):9088–9093. doi: 10.1073/pnas.1510757112. [DOI] [PMC free article] [PubMed] [Google Scholar]
- 29.Aboulouard S, et al. In-depth proteomics analysis of sentinel lymph nodes from individuals with endometrial cancer. Cell Rep. Med. 2021;2(6):100318. doi: 10.1016/j.xcrm.2021.100318. [DOI] [PMC free article] [PubMed] [Google Scholar]
- 30.Zhang H, et al. Aldehyde dehydrogenase 2 mediates alcohol-induced colorectal cancer immune escape through stabilizing PD-L1 expression. Adv. Sci. (Weinh) 2021;8(10):2003404. doi: 10.1002/advs.202003404. [DOI] [PMC free article] [PubMed] [Google Scholar]
- 31.Yin Z, et al. Identification of ALDH3A2 as a novel prognostic biomarker in gastric adenocarcinoma using integrated bioinformatics analysis. BMC Cancer. 2020;20(1):1062. doi: 10.1186/s12885-020-07493-x. [DOI] [PMC free article] [PubMed] [Google Scholar]
- 32.Xu Z, et al. The roles of drug metabolism-related ADH1B in immune regulation and therapeutic response of ovarian cancer. Front. Cell Dev. Biol. 2022;10:877254. doi: 10.3389/fcell.2022.877254. [DOI] [PMC free article] [PubMed] [Google Scholar]
- 33.Welinder C, et al. Feasibility study on measuring selected proteins in malignant melanoma tissue by SRM quantification. J. Proteome Res. 2014;13(3):1315–1326. doi: 10.1021/pr400876p. [DOI] [PubMed] [Google Scholar]
- 34.Bracalente C, et al. Reprogramming human A375 amelanotic melanoma cells by catalase overexpression: Upregulation of antioxidant genes correlates with regression of melanoma malignancy and with malignant progression when downregulated. Oncotarget. 2016;7(27):41154–41171. doi: 10.18632/oncotarget.9273. [DOI] [PMC free article] [PubMed] [Google Scholar]
- 35.Chen H, Yang J, Wu W. Seven key hub genes identified by gene co-expression network in cutaneous squamous cell carcinoma. BMC Cancer. 2021;21(1):852. doi: 10.1186/s12885-021-08604-y. [DOI] [PMC free article] [PubMed] [Google Scholar]
- 36.Zhang H, Li Z, Zheng Y. Identifying the therapeutic and prognostic role of the CD8+ T cell-related gene ALDH2 in head and neck squamous cell carcinoma. Cancer Inf. 2022;21:11769351221139252. doi: 10.1177/11769351221139252. [DOI] [PMC free article] [PubMed] [Google Scholar]
- 37.Feng D, et al. Mitochondrial aldehyde dehydrogenase 2 represents a potential biomarker of biochemical recurrence in prostate cancer patients. Molecules. 2022;27(18):6000. doi: 10.3390/molecules27186000. [DOI] [PMC free article] [PubMed] [Google Scholar]
- 38.Yao S, et al. ALDH2 is a prognostic biomarker and related with immune infiltrates in HCC. Am. J. Cancer Res. 2021;11(11):5319–5337. [PMC free article] [PubMed] [Google Scholar]
- 39.Tran TO, et al. ALDH2 as a potential stem cell-related biomarker in lung adenocarcinoma: Comprehensive multi-omics analysis. Comput. Struct. Biotechnol. J. 2023;21:1921–1929. doi: 10.1016/j.csbj.2023.02.045. [DOI] [PMC free article] [PubMed] [Google Scholar]
- 40.Zhang H, Fu L. The role of ALDH2 in tumorigenesis and tumor progression: Targeting ALDH2 as a potential cancer treatment. Acta Pharm. Sin. B. 2021;11(6):1400–1411. doi: 10.1016/j.apsb.2021.02.008. [DOI] [PMC free article] [PubMed] [Google Scholar]
- 41.Chen X, et al. miR-671-5p promotes cell proliferation, invasion, and migration in hepatocellular carcinoma through targeting ALDH2. Crit. Rev. Eukaryot. Gene Expr. 2022;32(4):73–82. doi: 10.1615/CritRevEukaryotGeneExpr.2022041749. [DOI] [PubMed] [Google Scholar]
- 42.Wei, P. L. et al., ALDH2 promotes cancer stemness and metastasis in colorectal cancer through activating β-catenin signaling.J. Cell Biochem., (2023). [DOI] [PubMed]
- 43.Li K, et al. ALDH2 repression promotes lung tumor progression via accumulated acetaldehyde and DNA damage. Neoplasia. 2019;21(6):602–614. doi: 10.1016/j.neo.2019.03.008. [DOI] [PMC free article] [PubMed] [Google Scholar]
- 44.Li Y, et al. Long noncoding RNA SNHG16 regulates the growth of human lung cancer cells by modulating the expression of aldehyde dehydrogenase 2 (ALDH2) J. Oncol. 2022;2022:2411642. doi: 10.1155/2022/2411642. [DOI] [PMC free article] [PubMed] [Google Scholar]
Associated Data
This section collects any data citations, data availability statements, or supplementary materials included in this article.
Supplementary Materials
Data Availability Statement
The datasets used and/or analysed during the current study are available from the corresponding author on reasonable request.


