Abstract
Objective
To estimate exposure-response associations between chronic exposure to fine particulate matter (PM2.5) and risks of the first hospital admission for major cardiovascular disease (CVD) subtypes.
Design
Population based cohort study.
Setting
Contiguous US.
Participants
59 761 494 Medicare fee-for-service beneficiaries aged ≥65 years during 2000-16. Calibrated PM2.5 predictions were linked to each participant’s residential zip code as proxy exposure measurements.
Main outcome measures
Risk of the first hospital admission during follow-up for ischemic heart disease, cerebrovascular disease, heart failure, cardiomyopathy, arrhythmia, valvular heart disease, thoracic and abdominal aortic aneurysms, or a composite of these CVD subtypes. A causal framework robust against confounding bias and bias arising from errors in exposure measurements was developed for exposure-response estimations.
Results
Three year average PM2.5 exposure was associated with increased relative risks of first hospital admissions for ischemic heart disease, cerebrovascular disease, heart failure, cardiomyopathy, arrhythmia, and thoracic and abdominal aortic aneurysms. For composite CVD, the exposure-response curve showed monotonically increased risk associated with PM2.5: compared with exposures ≤5 µg/m3 (the World Health Organization air quality guideline), the relative risk at exposures between 9 and 10 µg/m3, which encompassed the US national average of 9.7 µg/m3 during the study period, was 1.29 (95% confidence interval 1.28 to 1.30). On an absolute scale, the risk of hospital admission for composite CVD increased from 2.59% with exposures ≤5 µg/m3 to 3.35% at exposures between 9 and 10 µg/m3. The effects persisted for at least three years after exposure to PM2.5. Age, education, accessibility to healthcare, and neighborhood deprivation level appeared to modify susceptibility to PM2.5.
Conclusions
The findings of this study suggest that no safe threshold exists for the chronic effect of PM2.5 on overall cardiovascular health. Substantial benefits could be attained through adherence to the WHO air quality guideline.
Introduction
Particulate matter with an aerodynamic diameter of ≤2.5 µm (PM2.5) is a major component of ambient air pollution.1 These particles are small enough to be inhaled deeply into the lungs, and they can enter the bloodstream, leading to a range of health problems such as systematic inflammation, vasoconstriction, cardiac electrical changes, and formation of blood clots, all of which can contribute to the development of cardiovascular disease (CVD).2 Numerous studies, including large scale epidemiological studies, have consistently found that exposure to PM2.5 can trigger adverse cardiovascular conditions and increase the risk of cardiovascular related hospital admission and mortality.3 4 5 6 7 8 9 10 11 12 13 Chronic exposures to PM2.5, lasting one year or more, have been found to pose a much greater risk to cardiovascular health than short term exposures spanning only a few days.14
However, major gaps in knowledge remain. First, most published studies focused on one or a small number of CVD subtypes, or treated CVD as a composite endpoint, which can fail to identify subtypes most vulnerable to PM2.5. With the rapidly growing burden of CVD worldwide, a direct comparison of the effect sizes across subtypes from within the same cohort would help to better understand the underlying mechanisms and inform targeted interventions to reduce the impact of PM2.5.15 Additionally, errors in exposure measurement can bias the estimated exposure-response association between PM2.5 and CVD, limiting the ability to know whether a safe threshold exists below which toxicity does not occur.16 This is of particular importance considering that the US Environmental Protection Agency has expressed uncertainty about the effect of annual PM2.5 levels <9 µg/m3.3 17 Consequently, an assessment below that threshold becomes crucial for public health considerations.18 Further, most studies have reported effects only on a multiplicative scale (eg, relative risk), which might obscure the actual size of the risk.19 Moreover, fewer studies have used causal methods, which provide greater assurance against confounding. Finally, although concerns about environmental justice are growing, the role of co-occurrence of individual level and neighborhood level factors in the association between PM2.5 and CVD has not been comprehensively studied.7
We estimated the exposure-response associations between three year average exposure to PM2.5 and the risks of a first hospital admission for seven major subtypes of CVD—ischemic heart disease, cerebrovascular disease, heart failure, cardiomyopathy, arrhythmia, valvular heart disease, and thoracic and abdominal aortic aneurysms, for Medicare fee-for-service beneficiaries aged ≥65 years in the contiguous US during 2000-16. We also examined the risk of a first hospital admission for the composite of these CVD subtypes. Both relative and absolute effects were assessed to provide a comprehensive understanding of the risks posed by PM2.5. Extensive subgroup analyses by individual and neighborhood level factors were performed to identify susceptible groups, in particular socioeconomically deprived neighborhoods.
Methods
Study population
The study data included all Medicare beneficiaries aged ≥65 years who resided in the contiguous US and enrolled in the fee-for-service programme at some point during 2000-16. From the Medicare denominator file, we obtained a unique identifier for each beneficiary and details of sex, race/ethnicity, age, enrollment status in Medicaid, residential zip code, and date of death if it occurred during the study period. Information on age, residential zip code, and enrollment status in Medicaid are updated annually. Medicaid provided additional coverage for participants with a low income and therefore we used enrollment status in Medicaid as a proxy for personal socioeconomic status. From the Medicare Provider Analysis and Review file, we obtained the date of hospital admission, ICD-9 and ICD-10 (international classification of diseases, ninth and 10th revisions, respectively) codes for principal discharge diagnosis, and a unique identifier used to match to the denominator file for each beneficiary. For each subtype of CVD, we constructed a separate cohort by following each beneficiary each year until the first hospital admission for that subtype of CVD, death, or end of the study period in 2016, whichever occurred earliest.20 To examine the risk of first hospital admission for the composite CVD outcome, we constructed another cohort by following each beneficiary each year until the first hospital admission for any of the studied CVD subtypes, death, or end of the study period in 2016, whichever occurred earliest. The supplementary material lists the specific ICD-9 and ICD-10 codes used for the identification of each CVD subtype related hospital admission.
PM2.5 exposure estimation, calibration, and aggregation
We used geographically weighted regressions to predict ambient daily PM2.5 levels at a spatial resolution of 1-km2 grid cells across the contiguous US during 2000-16. Our ensemble model combined predictions from multiple machine learning algorithms, including random forests, gradient boosting, and neural networks. To generate these predictions, we integrated various data sources, such as satellite data, meteorology, land use variables, monitoring data, and simulations of chemical transport model.21 The ensemble model showed better predictive performance than the individual machine learners, with a 10-fold cross validated R2 value of 0.86.
We employed a regression calibration approach to enhance the precision of grid level PM2.5 estimates and reduce biases in the health effect estimates due to exposure error.22 First, we used a logistic regression to predict the probability of having at least one PM2.5 monitoring site for each zip code in each year, given population density, per cent of the population who identified as being of Black race, per cent of the population who identified as Hispanic, per cent of the population who identified as Asian, per cent below the threshold for poverty, distance between industrial facility and zip code centroid, road density, normalized difference vegetation index, and tree canopy. We did this to adjust for the uneven distribution of the monitored locations via inverse probability weights, thus making the non-monitored locations more representative. Next, we stratified the monitored, seasonal averaged PM2.5 levels by season, elevation, and census division and generated 1000 bootstrap samples for each stratum. For each bootstrap sample, we fitted a linear regression of monitored PM2.5 levels on the predicted PM2.5 at grid cells where the monitoring sites were located, adjusted for wind speed, humidity, imperviousness, and calendar year, and weighted by the inversed probabilities of having at least one monitoring site derived from the earlier logistic regression. This allowed higher weights in strata that had lower probabilities of having monitoring sites. Then we stratified, across the contiguous US, the grid level PM2.5 estimates by season, elevation, and census division; the same as for the monitored PM2.5. For each stratum, we used the fitted regressions to estimate 1000 sets of calibrated PM2.5 levels, based on the grid level PM2.5 estimates and covariates. This process produced 1000 regression calibrated, seasonal averaged PM2.5 levels at all grid cells. By averaging seasonal averages within a year, we obtained 1000 calibrated, annual PM2.5 levels for each grid cell per year. The supplementary material provides a comprehensive description of the calibration process.
To match the spatial resolution of the Medicare cohort, we aggregated the calibrated PM2.5 estimates at grid cells to zip codes. Briefly, we estimated zip code level PM2.5 by averaging the predictions at grid cells with centroids inside the polygonal area for general zip codes, and by assigning the prediction at the nearest grid for other zip codes that lacked polygon representations, such as apartment buildings, military bases, and post offices.23 This method produced 1000 calibrated PM2.5 levels for each zip code per year.
The exposure of primary interest was three year average exposure to PM2.5 over the current and previous two years (lag 0-2). We also examined exposures to PM2.5 at single lag years, specifically lag 0, lag 1, and lag 2.
Covariates
We adjusted for calendar year; individual level characteristics, including sex, race/ethnicity, age group, and Medicaid enrollment; and various neighborhood level covariates as potential confounders based on substantive knowledge and the most relevant literature.14 24 25 26 Neighborhood level socioeconomic and personal covariates, including proportion of the population aged ≥65 years living below the threshold for poverty, population density, median value of owner-occupied properties, proportion of housing units occupied by owners, proportion of the population who identified as Hispanic, and proportion of the population aged ≥65 years who had not graduated from high school, were obtained from the US Census and the American Community Survey.27 28 These data were available in 2000 and from 2010 to 2016 by zip code and were linearly interpolated to estimate missing values for all other years.
County level risk factors, including mean body mass index and the prevalence of ever smokers, were obtained from the Behavioral Risk Factor Surveillance System of the Centers for Disease Control and Prevention and were linked to respective zip codes.29 Additionally, we computed the annual rate of lung cancer related hospital admissions in each zip code from the Medicare data as a surrogate for smoking and tobacco use.
Healthcare covariates, including the proportion of Medicare beneficiaries who received at least one test for glycated hemoglobin each year, the proportion of beneficiaries who had at least one ambulatory visit to a doctor in a year, and the proportion of female beneficiaries who received mammography within a two year period, were obtained from the Dartmouth Atlas of Health Data.30 These covariates represented the most commonly utilized healthcare services. We collected data at the hospital service area level and linked them to zip codes. Further, we computed the distance from the centroid of each zip code to the nearest hospital, using hospital locations sourced from a dataset produced by Esri (Redlands, CA) as an overall measure of access to healthcare.31
Similar to PM2.5, we aggregated concurrent air pollutants and weather data, including annual warm season ozone (April-September), annual nitrogen dioxide levels, and annual temperature at grid cells, to zip codes and linked to the Medicare cohort.23 32 33
In analyses examining effects of exposure to PM2.5 in a single year, we adjusted the PM2.5 levels from the other two lag years as covariates to obtain independent effect estimates.
Statistical analysis
We divided the PM2.5 exposure levels into 11 disjoint intervals. These intervals included [0, 5), [5, 6), . . . , [13, 14), [14, ∞), two wider intervals for the extremely low and high levels, and nine 1 unit intervals for those in between. For each outcome, we prepared a dataset with person year representations of follow-up to allow for time varying exposures and covariates. We aggregated person years by all the categorical variables, including zip code, year, sex (male or female), race/ethnicity (white or non-white), age group (65-74 years or ≥75 years), and Medicaid enrollment status (yes or no), so that each observation represented a stratum of a unique combination of those variables. Numbers of hospital admissions and person years were cumulated for each stratum.20
Assuming the 1000 calibrated PM2.5 exposure levels for each stratum were normally distributed, we calculated the probability of a PM2.5 level falling within an exposure interval, based on the mean and standard deviation of the 1000 calibrated PM2.5 levels. This allowed us to directly incorporate uncertainty about the exposure into the exposure-response estimations. Using the logit link function, we fitted a beta regression to predict the probability of the PM2.5 level falling within that exposure interval, given the covariates delineated above as predictors and weighted by the number of person years. We used the predicted probability to estimate stabilized inverse probability weight, defined as: swij=p(Xj) divided by expit(g(Xij|C)) where swij represented the stabilized inverse probability weight for stratum i in exposure interval j; P(Xj) the probability of any stratum with an exposure level of X in interval j; expit(·)=exp(·) divided by 1+exp(·), the inverse logit function; and g(Xij|C) the beta regression for predicting the probability of being exposed at PM2.5 level within interval j, given covariates C. This generated 11 inverse probability weights per stratum, each corresponding to a distinct exposure interval, thus allowing for different impacts of confounders across intervals.
Then we categorized the mean of the 1000 calibrated PM2.5 exposure levels per stratum into one of the exposure intervals and assigned the inverse probability weight corresponding to that exposure interval for estimation of the exposure-response association. Assuming the inverse probability weight resulted in an exposure in each interval that was independent of all covariates, the exposure effect for that exposure interval was a valid substitute for the counterfactual scenario, in which all strata would be exposed to PM2.5 levels falling within that particular interval.34 Finally, we fitted a quasi-Poisson regression for the count of hospital admissions against the categorized exposure interval, weighted by the inverse probability weight. The model also included an offset for the number of person years to account for the difference in size of population at risk between strata. This quasi-Poisson regression provided the relative risks of the first hospital admission for all exposure intervals, using the lowest exposure interval as the reference. The entire process was repeated for each CVD outcome. For all effect estimates within an exposure interval, considering the inherent correlations among the eight CVD outcomes, we used the Bonferroni correction to adjust 95% confidence intervals. Absolute scale exposure-response associations were obtained based on the cohort’s baseline risks of hospital admission for the lowest exposure interval of [0, 5) combined with the estimated relative risks.
To identify susceptible subpopulations, we conducted separate analyses by age group and sex. Further, to identify neighborhood level factors that contributed to susceptibility, we performed subgroup analyses by upper or lower fourths of per cent population aged ≥65 years who did not graduate from high school, distance from the centroid of each zip code to the nearest hospital, and the national area deprivation index as a composite metric for level of neighborhood disadvantage.35 For consistency across CVD outcomes, we used the same upper or lower fourth of the neighborhood level variables based on the entire Medicare fee-for-service cohort.
Patient and public involvement
The study population was not involved in this study owing to the deidentified nature of the Medicare data and restricted access to these data. However, one author, through regular clinical interactions with patients admitted to hospital for cardiovascular conditions, discussed the potential impacts of air pollution. These discussions informed our study design and interpretation of the results.
Results
Table 1 shows the characteristics of the studied Medicare fee-for-service cohort during 2000-16. The cohort comprised 59 761 494 adults with 476 953 892 person years of follow-up and consisted of mostly white adults (84.3%, n=50 382 526), a higher proportion of female beneficiaries (55.0%, n=32 894 731), and individuals mostly aged 65-74 years at study entry (75.1%, n=44 858 373). In total, 17.6% (n=10 542 856) of the beneficiaries enrolled in Medicaid at some point during the study period. Overall, 21.8% (n=13 001 853) of the beneficiaries had a composite CVD related hospital admission (ie, any of the seven CVD subtypes). Ischemic heart disease was the most prevalent CVD subtype resulting in hospital admission, with 8.8% (n=5 248 669) of beneficiaries experiencing the condition, followed by cerebrovascular disease (7.7%, n=4 580 000), heart failure (6.6%, n=3 964 836), and arrhythmia (6.5%, n=3 885 622). Given that the exposure of primary interest was the three year average PM2.5, for which data have been available since 2000, the earliest CVD related hospital admissions occurred in 2002. The supplementary materials provide summary statistics of the neighborhood level variables.
Table 1.
Personal characteristics of Medicare fee-for-service cohort in the contiguous US, 2000-16. Values are number (percentage) unless stated otherwise
| Characteristics | Study population (n=59 761 494) |
|---|---|
| Person years | 476 953 892 |
| Average follow-up (years) | 8.0 |
| Hospital admission type*: | |
| Composite cardiovascular disease | 13 001 853 (21.8) |
| Ischemic heart disease | 5 248 669 (8.8) |
| Cerebrovascular disease | 4 580 000 (7.7) |
| Heart failure | 3 964 836 (6.6) |
| Cardiomyopathy | 71 290 (0.1) |
| Arrhythmia | 3 885 622 (6.5) |
| Valvular heart disease | 537 879 (0.9) |
| Thoracic and abdominal aortic aneurysms | 476 448 (0.8) |
| Sex: | |
| Male | 26 866 763 (45.0) |
| Female | 32 894 731 (55.0) |
| Race/Ethnicity: | |
| White | 50 382 526 (84.3) |
| Non-white | 9 378 968 (15.7) |
| Age group at study entry (years): | |
| 65-74 | 44 858 373 (75.1) |
| ≥75 | 14 903 121 (24.9) |
| Ever enrolled in Medicaid during study period | 10 542 856 (17.6) |
Given that the exposure of interest was three year average PM2.5, data for which were available from 2000, the earliest hospital admissions related to cardiovascular disease occurred in 2002.
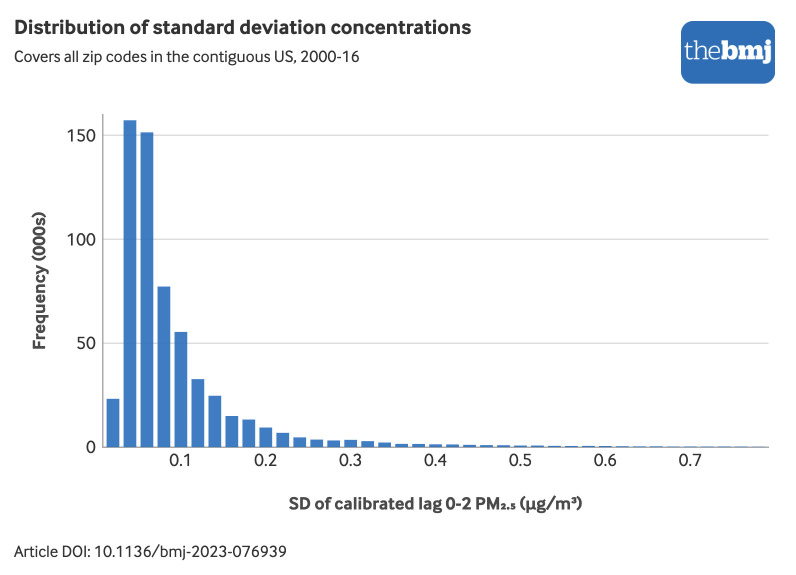
Figure 1 and figure 2 show the distributions of mean and standard deviation for 1000 calibrated lag 0-2 PM2.5 concentration per zip code-year combination, respectively. The distribution covers all zip codes in the contiguous US during 2000-16. The mean of calibrated lag 0-2 PM2.5 concentration followed an approximate normal distribution, averaging at 9.7 µg/m3, substantially below the current national standard of 12 µg/m3. The standard deviation of the calibrated PM2.5 values showed a right skewed distribution, with a minimum of 0.03 μg/m3. Out of the total 39 188 zip codes in our analysis, 3871 (9.9%) contained monitoring sites.
Fig 1.
Distribution of mean for 1000 calibrated lag 0-2 PM2.5 concentration per zip code-year combination. The distribution covers all zip codes in the contiguous US, 2000-16. An interactive version of this graphic is available at https://public.flourish.studio/visualisation/14948756/
Fig 2.
Distribution of standard deviation for 1000 calibrated lag 0-2 PM2.5 concentration per zip code-year combination. The distribution covers all zip codes in the contiguous US, 2000-16. SD=standard deviation. An interactive version of this graphic is available at https://public.flourish.studio/visualisation/14948970/
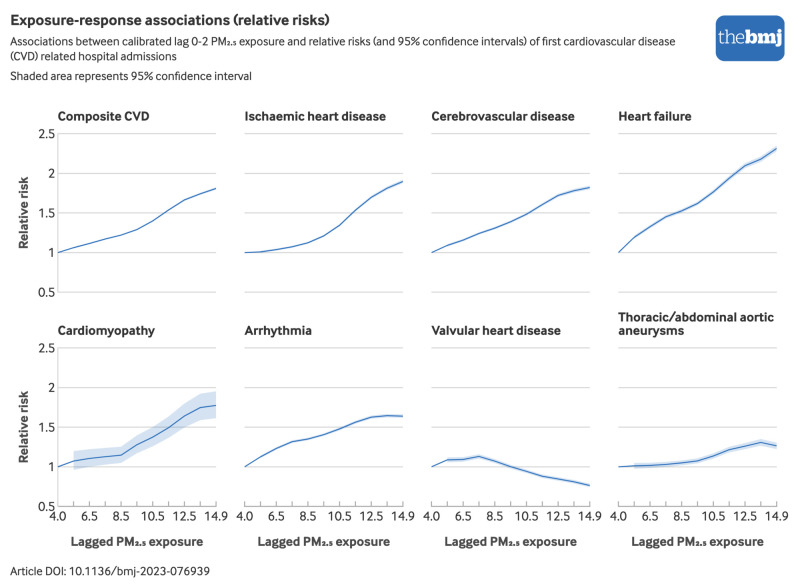
Figure 3 shows the estimated exposure-response associations between the calibrated lag 0-2 PM2.5 exposure level and relative risks of first CVD related hospital admissions. For each effect estimate, the exposure level corresponds to the median value (see supplementary table S3) within that exposure interval for the entire Medicare fee-for-service cohort. The exposure-response curves for composite CVD, ischemic heart disease, cerebrovascular disease, heart failure, and cardiomyopathy monotonically increased. Notably, the curve for heart failure displayed the steepest slope, with the relative risk for a first hospital admission associated with calibrated lag 0-2 PM2.5 concentration ranging from 1.19 (95% confidence interval 1.17 to 1.22) for the [5, 6) exposure interval to 2.31 (2.28 to 2.35) for the highest exposure interval of [14, ∞). The exposure-response curve for valvular heart disease fluctuated around 1, with a substantially smaller risk compared to other CVD subtypes. For arrhythmia and thoracic and abdominal aortic aneurysms, the exposure-response curves monotonically increased until the [13, 14) exposure interval, and decreased slightly at the highest exposure interval.
Fig 3.
Exposure-response associations between exposure to calibrated lag 0-2 PM2.5 level and relative risks of first cardiovascular disease related hospital admissions. CVD=cardiovascular disease. An interactive version of this graphic is available at https://public.flourish.studio/visualisation/14949076/
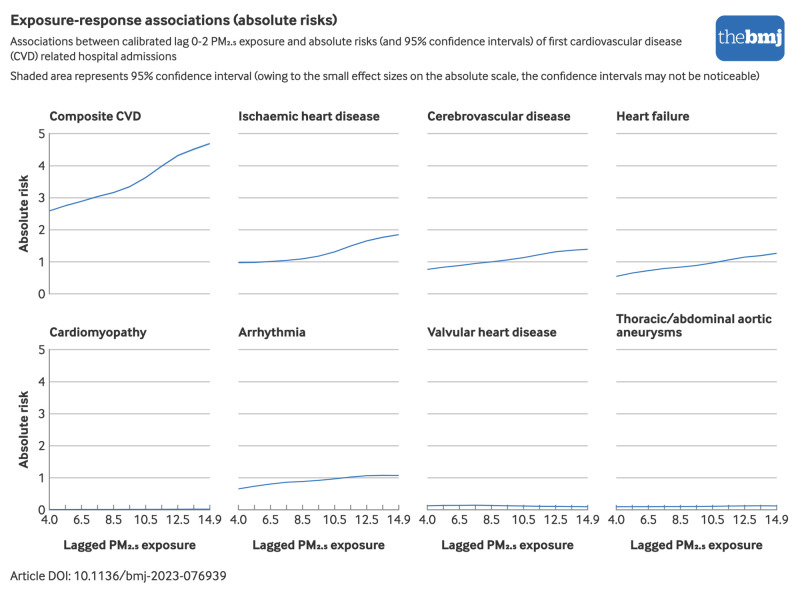
Figure 4 shows the estimated exposure-response associations between exposure to the calibrated lag 0-2 PM2.5 concentration and absolute risks of first CVD related hospital admissions. Among CVD subtypes, ischemic heart disease, cerebrovascular disease, heart failure, and arrhythmia showed relatively high baseline risks of hospital admission and were clearly positively associated with lag 0-2 PM2.5 concentration. For composite CVD, the absolute risk monotonically increased from 2.59% at baseline to 4.69% (95% confidence interval 4.65% to 4.73%) at the highest exposure interval. Cardiomyopathy, valvular heart disease, and thoracic and abdominal aortic aneurysms presented considerably lower risks compared with the composite CVD and other subtypes.
Fig 4.
Exposure-response associations between exposure to calibrated lag 0-2 PM2.5 level and absolute risks of first cardiovascular disease related hospital admissions. Numeric values for 95% confidence intervals are detailed in the supplementary file for reference. CVD=cardiovascular disease. An interactive version of this graphic is available at https://public.flourish.studio/visualisation/16472028/
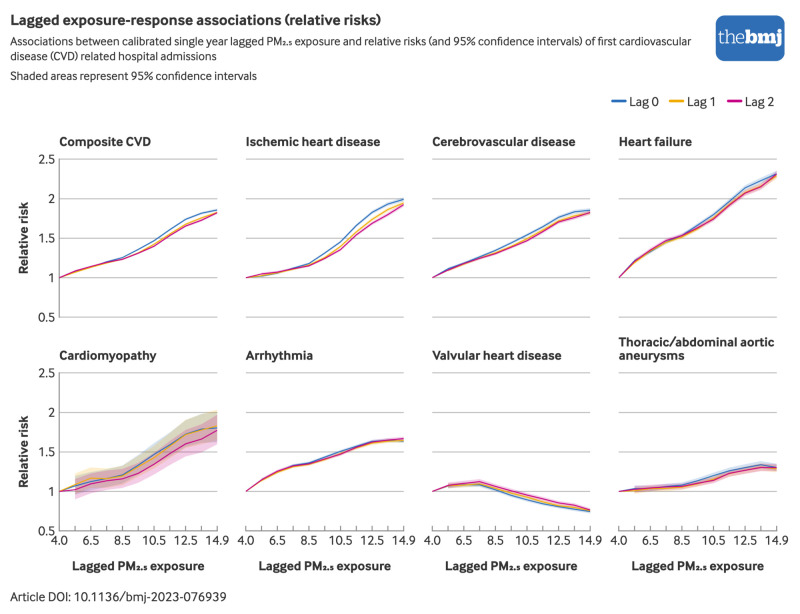
Figure 5 shows the estimated exposure-response associations between exposures to calibrated PM2.5 concentration at lag 0, lag 1, and lag 2 and relative risks of first CVD related hospital admissions. The effect estimates of these three lagged exposures were mutually adjusted and therefore independent. For composite CVD and the three most prevalent CVD subtypes—ischemic heart disease, cerebrovascular disease, and heart failure—the highest risk was associated with immediate exposure to PM2.5 at lag 0. This was followed by a slightly reduced effect at lag 1 PM2.5 level and a further reduction at lag 2 PM2.5 level. For each outcome, the single year lagged exposure-response curves were similar to each other and were consistent with the curve for lag 0-2 PM2.5 level (fig 3).
Fig 5.
Exposure-response associations between exposure to calibrated single year lagged PM2.5 level and relative risks of first cardiovascular disease related hospital admissions. The effect estimates of three lagged exposures were independent as they were mutually adjusted. CVD=cardiovascular disease. An interactive version of this graphic is available at https://public.flourish.studio/visualisation/15136586/
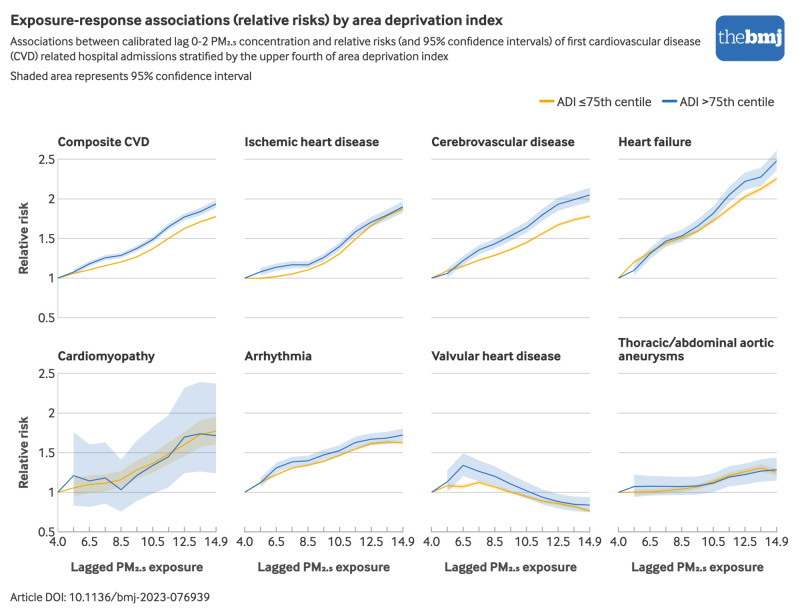
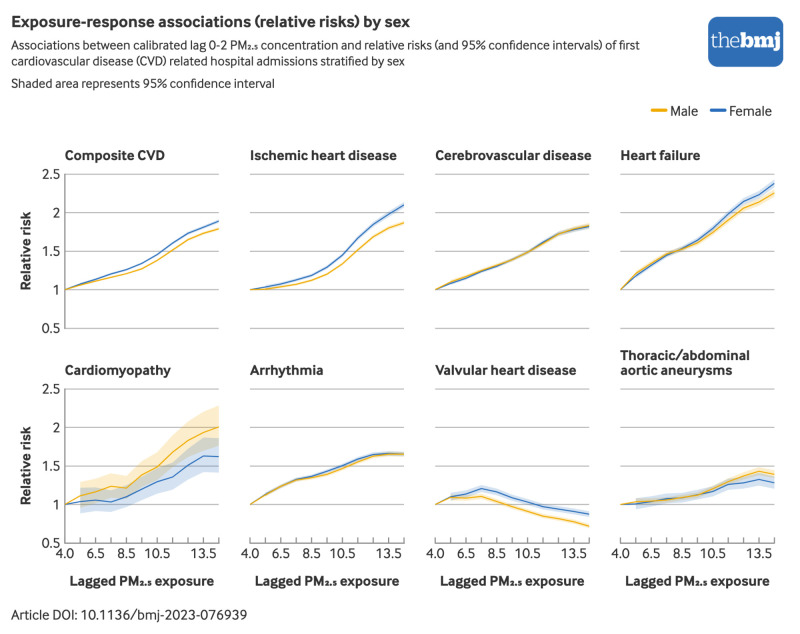
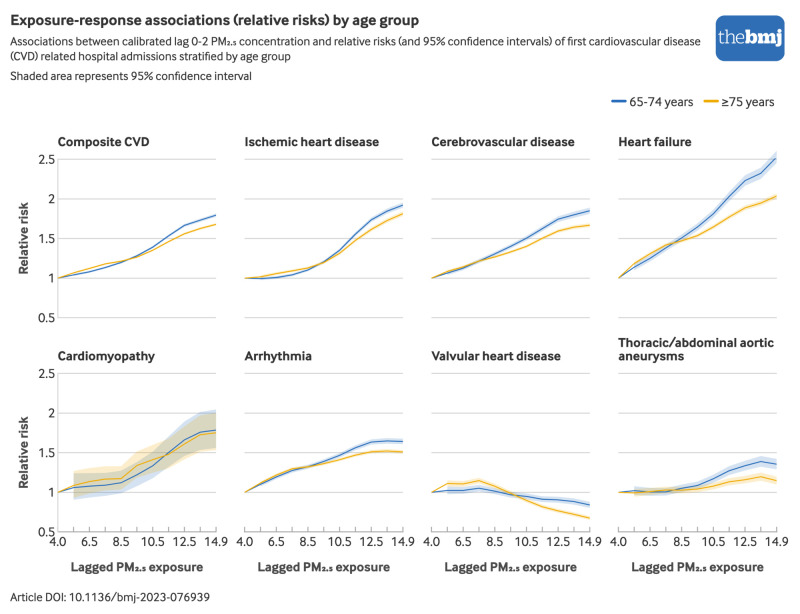
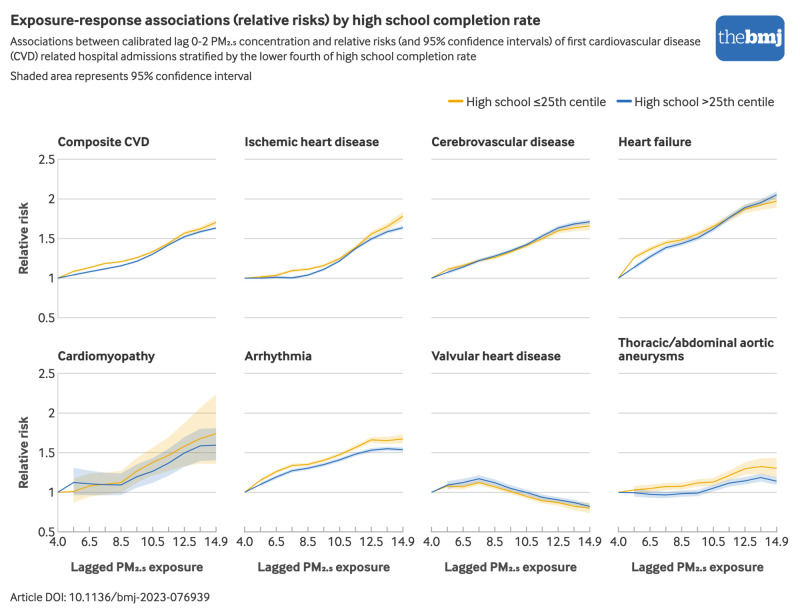
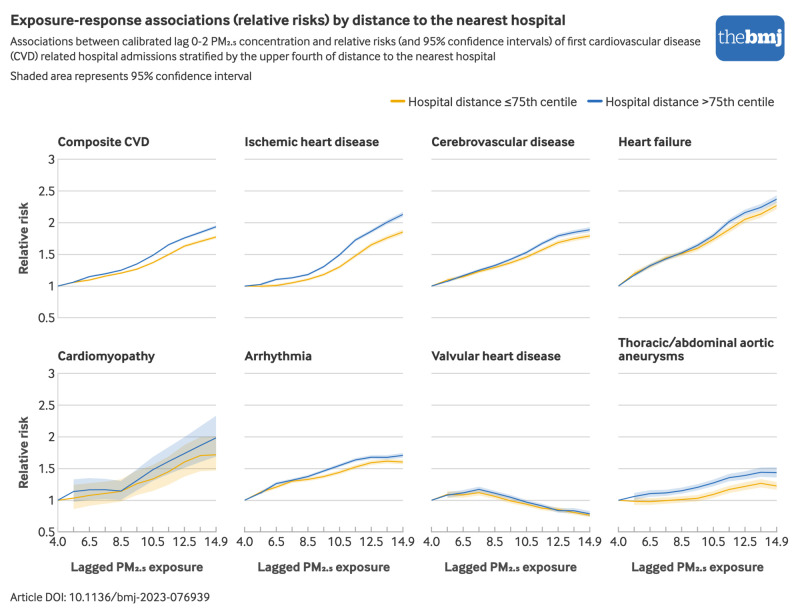
Figure 6, figure 7, figure 8, figure 9, and figure 10 show the estimated exposure-response associations between exposure to lag 0-2 PM2.5 level and relative risks of first CVD related hospital admissions from subgroup analyses. Female beneficiaries exhibited a higher risk for composite CVD, ischemic heart disease, and heart failure, whereas their risk of cardiomyopathy was lower (fig 6). Younger beneficiaries aged 65 to 74 years experienced a greater risk of hospital admission for composite CVD and most individual CVD subtypes (fig 7). Beneficiaries who lived in zip codes with lower rates of high school completion (≤25th centile), longer distance to hospital (>75th centile), or higher deprivation level (area deprivation index >75th centile) experienced higher risk for most outcomes (fig 8, fig 9, and fig 10). The supplementary material shows the numerical results.
Fig 6.
Exposure-response associations between exposure to calibrated lag 0-2 PM2.5 level and relative risks of first cardiovascular disease related hospital admissions stratified by sex. CVD=cardiovascular disease. An interactive version of this graphic is available at https://public.flourish.studio/visualisation/15136893/
Fig 7.
Exposure-response associations between exposure to calibrated lag 0-2 PM2.5 level and relative risks of first cardiovascular disease related hospital admissions stratified by age group. CVD=cardiovascular disease. An interactive version of this graphic is available at https://public.flourish.studio/visualisation/15138435/
Fig 8.
Exposure-response associations between exposure to calibrated lag 0-2 PM2.5 level and relative risks of first cardiovascular disease related hospital admissions stratified by the lower fourth of high school completion rate. CVD=cardiovascular disease. An interactive version of this graphic is available at https://public.flourish.studio/visualisation/15138885/
Fig 9.
Exposure-response associations between exposure to calibrated lag 0-2 PM2.5 level and relative risks of first cardiovascular disease related hospital admissions stratified by the upper fourth of distance to the nearest hospital. CVD=cardiovascular disease. An interactive version of this graphic is available at https://public.flourish.studio/visualisation/15176513/
Fig 10.
Exposure-response associations between exposure to calibrated lag 0-2 PM2.5 level and relative risks of first cardiovascular disease related hospital admissions stratified by the upper fourth of area deprivation index. This index measures the level of disadvantage in a zip code, based on national centile rankings from 1 to 100. A ranking of 100 represents the highest degree of disadvantage. CVD=cardiovascular disease. An interactive version of this graphic is available at https://public.flourish.studio/visualisation/16485923/
Discussion
In this cohort study of 59 million Medicare beneficiaries across the contiguous US, we found that three year average exposure to PM2.5 was associated with increased relative risks of a first hospital admission for ischemic heart disease, cerebrovascular disease, heart failure, cardiomyopathy, arrhythmia, and thoracic and abdominal aortic aneurysms. For the composite CVD outcome, the exposure-response curve monotonically increased, suggesting that no safe threshold exists for overall cardiovascular health; compared with the lowest exposure interval between 0 and 5 µg/m3, the risk of hospital admission was already raised at exposures between 5 and 6 µg/m3 and increased by 1.29 times at exposures between 9 and 10 µg/m3. This latter range encompassed the national average of 9.7 µg/m3 and is being evaluated by the US Environmental Protection Agency for the upcoming National Ambient Air Quality Standards.18 On an absolute scale, the risk of hospital admission for composite CVD increased from 2.59% with exposures ≤5 µg/m3 to 3.35% at exposures between 9 and 10 µg/m3; ischemic heart disease, cerebrovascular disease, heart failure, and arrhythmia presented considerable increases in absolute risk of hospital admission associated with PM2.5, in comparison with other CVD subtypes. These results were crucial for informing targeted interventions to specifically mitigate the adverse impacts of PM2.5 on these conditions. In the single year lagged models, the effect of PM2.5 persisted at least for three years after exposure, suggesting a long lasting impact of PM2.5 on cardiovascular health. It also implied that the benefits of policies to reduce PM2.5 would be realized immediately after implementation and would continue to accrue for years. Overall, our findings highlighted important benefits that could be attained through adherence to the newly published WHO air quality guideline of ≤5 µg/m3.36 Our study is timely, considering the ongoing review of the US national standards.18 Nevertheless, the upcoming US standard, proposed to be between 9 and 10 µg/m3, is still considerably higher than the 5 µg/m3 set by WHO, and not sufficient for the protection of public health.
Although PM2.5 has been recognized as a primary environmental risk factor for CVD, its specific impact on different CVD subtypes, as well as the exposure-response associations, remained largely unquantified.7 Moreover, studies correcting for exposure measurement error, assessing absolute effects, and using causal methods, are limited or non-existent. In this cohort study, we estimated exposure-response associations between chronic exposure to PM2.5 and risks of first hospital admission for seven major CVD subtypes, as well as the composite of those subtypes. We developed a causal framework that allowed confounders to have different impacts in different exposure ranges, thereby strengthening the validity of the associations between chronic exposure to PM2.5 and CVD outcomes. To reduce the bias in exposure-response estimations from errors in measuring those exposures, we implemented two strategies: in the first we employed a regression calibration approach to refine our spatiotemporally resolved PM2.5 exposure estimates, and in the second we incorporated the uncertainty of exposure estimates into exposure-response estimations by assigning greater weights to exposures with less uncertainty, thus improving the overall accuracy of health effect estimates.
Comparison with other studies
The exposure-response estimations for ischemic heart disease and cerebrovascular disease were similar on both relative and absolute scales, possibly as a result of the shared underlying pathophysiological mechanisms involving atherosclerosis and thromboembolism.37 This finding aligned with a recent review,6 which reported highly comparable associations between long term exposure to PM2.5 and mortality for ischemic heart disease and cerebrovascular diseases (23% and 24% increased risk, respectively, for each 10 µg/m3 increase in long term exposure to PM2.5). Building upon previous studies showing positive associations between chronic exposure to PM2.5 and risks for heart failure and arrhythmia,3 8 9 38 the results on our absolute scale show that these are among the most susceptible CVD subtypes to develop in people exposed to PM2.5. For arrhythmia specifically, a subtype analysis suggested that people with atrial fibrillation and other subtypes of arrhythmia were susceptible to chronic exposure to PM2.5 (see supplementary fig S1). Given the high prevalence, substantial healthcare costs, impact on daily activities, and influence on mortality, heart failure and arrhythmia emerge as major public health concerns.39 Thus, alongside ischemic heart disease and cerebrovascular disease, which are the leading causes of cardiovascular mortality, it is crucial to emphasize heart failure and arrhythmia as primary targets for population level interventions to mitigate the adverse effects of air pollution on cardiovascular health.
Consistent with the findings of a multiethnic study,40 we found an ambiguous association between PM2.5 and valvular heart disease, suggesting that PM2.5 might play a less important role than other primary risk factors such as genetics, infections, and other cardiovascular conditions.41 The ambiguous association could also result from data variability. When these subtypes were assessed in more detail, this unclear association appeared to be driven by aortic valve disease (see supplementary fig S2). PM2.5 was, however, clearly not associated with mitral valve disease, suggesting that the pollutant might be more specifically associated with the calcification of aortic valve rather than with valvular calcification in general.42 The positive association between PM2.5 and tricuspid and pulmonary valve diseases suggested that a longer follow-up period might be needed to better understand the associations of PM2.5 with mitral valve disease and aortic valve disease, since the left side of the heart has greater flow and calcium deposition may take longer to build up.
In subgroup analyses, we found that older beneficiaries were consistently less susceptible to PM2.5 for all outcomes, which was consistent with the findings of several studies.14 24 25 43 This may potentially be explained by older aged people having lower average body mass index, which may be associated with decreased vulnerability to cardiovascular events.44 Another plausible explanation is that beneficiaries susceptible to PM2.5 might have experienced their first hospital admission when young. Consequently, they were not included in the older group.45 Our findings on sex differences varied across CVD subtypes, consistent with the mixed results reported by others.6 25 26
At the neighborhood level, we found a higher risk of hospital admission associated with PM2.5 for beneficiaries living in zip codes with lower rates of high school completion, longer distance to the nearest hospital, or greater neighborhood deprivation. Consistent with four studies,10 11 12 13 these identified differences in susceptibility highlight factors that may further contribute to inequalities in the impact of air pollution, in addition to inequalities in exposure.46 Longer distance to the nearest hospital is indicative of limited access to healthcare services, which is particularly relevant in the context of cardiovascular related hospital admission. Indeed, timely and effective outpatient care plays a vital role in minimizing the risk of hospital admission for cardiovascular conditions.47 Greater neighborhood deprivation and lower education attainment characterize various social, economic, and environmental factors that can contribute to increased susceptibility to the impact of air pollution. These factors include poverty, poorly maintained walkways, access to parks, shopping areas, and neighborhood organizations, as well as substandard quality of housing.35
Strengths and limitations of this study
Our study has several strengths. First, we addressed a central concern of exposure measurement error that was pervasive in large scale studies using spatiotemporally resolved air pollution predictions.16 Although some methods for estimating uncertainty of exposure have been developed and integrated into health effect estimates, most existing studies have not accounted for this uncertainty.48 In the present study, we developed a regression calibration approach to improve the accuracy of exposure measures. We used this calibration approach and further estimated the variability of exposure estimates as a measure of uncertainty, and we incorporated this uncertainty into our exposure-response estimations to reduce bias in health effect estimates from exposure error. Specifically, we assigned lower weights to strata associated with exposure measures with higher uncertainty—thereby these strata contributed less to the overall effect estimates. Another strength was the categorization of continuous exposure for inverse probability weight estimation, improving the robustness against outliers. Estimating inverse probability weight for continuous exposures can be challenging as excessively large or small weights for outliers need to be avoided.20 This approach also relaxed the strong assumptions of distribution form and homoscedasticity inherent in continuous exposures.49 Further, the causal approach fitted separate propensity score models for each PM2.5 exposure interval, allowing the confounders to have different impacts in different exposure ranges and thus reducing confounding bias. Finally, we provided absolute effect estimates of PM2.5 on risks of hospital admission for CVD subtypes. The results could inform targeted interventions to mitigate the adverse impacts of PM2.5 on ischemic heart disease, cerebrovascular disease, heart failure, and arrhythmia, as risks from these conditions appeared to be higher compared with other CVD subtypes.
This study has some limitations. First, owing to restricted available data sources, we were unable to account for individual level risk factors such as body mass index and smoking for cardiovascular related hospital admissions. However, ambient air pollution levels in neighborhoods are unlikely to be substantially influenced by individual covariates. This is because, for example, neighborhoods with higher levels of poverty and population density may also be neighborhoods with higher air pollution levels. In other words, ambient air pollution levels are spatially patterned in neighborhoods based on neighborhood level characteristics. If people with low incomes were to move to high income neighborhoods, they would receive an ambient level of exposure associated with characteristics of the high income neighborhood rather than their own individual characteristics. Hence, only neighborhood level covariates are likely confounders, which we have controlled for. Supporting this argument, we performed a sensitivity analysis that excluded all individual level covariates (sex, race/ethnicity, age, enrollment status in Medicaid), and found that the results remained highly consistent with our main analysis (see supplementary fig S3). Second, our framework did not account for unobserved confounders, particularly those at the neighborhood level, which could potentially influence the findings. Third, the exposure assessment was still subject to measurement error because zip code was the finest geographic unit available to match PM2.5 with each beneficiary, rather than individual residential address. A recent simulation study suggested that performing the analysis at a finer spatial resolution may result in larger effect estimates.16 Fourth, the generalizability of our findings was constrained by the demographic profile of the Medicare population and the study period spanning 2000-16. Consequently, it is unclear whether observed associations would persist in younger populations or in the context of more recent years. Nonetheless, the rate of cardiovascular related hospital admissions has been relatively stable and declining,50 and since we have accounted for temporal change in our analysis, the effect estimates are likely to have remained consistent.
Conclusions
Among Medicare beneficiaries across the contiguous US, chronic exposure to PM2.5 was associated with increased relative risks of a first hospital admission for ischemic heart disease, cerebrovascular disease, heart failure, cardiomyopathy, arrhythmia, and thoracic and abdominal aortic aneurysms. The exposure-response curve for the composite of the CVD subtypes monotonically increased, suggesting no safe threshold exists for overall cardiovascular health and that substantial benefits could be attained through adherence to WHO’s air quality guideline. On an absolute scale, the risks of ischemic heart disease, cerebrovascular disease, heart failure, and arrhythmia in association with PM2.5 were considerable, underscoring the need for targeted interventions to mitigate the adverse impacts on these conditions. The cardiovascular effects persisted for at least three years after exposure to PM2.5. Susceptibility varied by age, educational attainment, access to healthcare services, and overall deprivation level of the neighborhood.
What is already known on this topic
Fine particulate matter (PM2.5) is a key air pollutant and is recognized as a primary environmental risk factor for cardiovascular disease (CVD)
Chronic exposures to PM2.5, lasting one year or more, pose a much greater risk to cardiovascular health than short term exposures spanning only a few days
Specific exposure-response associations between chronic exposure to PM2.5 and risks of hospital admission with major CVD subtypes remained largely unquantified
What this study adds
The exposure-response curve for the composite of CVD subtypes monotonically increased, suggesting that no safe threshold exists for overall cardiovascular health, and substantial benefits could be attained through adherence to the World Health Organization’s air quality guideline
Risks for ischemic heart disease, cerebrovascular disease, heart failure, and arrhythmia increased substantially in association with PM2.5, underscoring the need for targeted interventions to mitigate the adverse impacts on these conditions
Susceptibility to cardiovascular related hospital admission in association with PM2.5 varied by age, educational attainment, access to healthcare services, and overall deprivation level of the neighborhood
Web extra.
Extra material supplied by authors
Supplementary information: Methodology for calibration of PM2.5 exposure, tables S1-S11, and figures S1-S3
Contributors: YW contributed to idea formulation, study design, data preparation, data analysis, data interpretation, and writing of the manuscript. YF contributed to data preparation, data analysis, writing of the manuscript, and review of the manuscript. MDY, KY, EC, AS, XQ, and AAP contributed to data preparation and review of the manuscript. BAC, FD, and JDS contributed to idea formulation, study design, and review of the manuscript. All authors provided approval of the version to be submitted. YW is the guarantor. The corresponding author attests that all listed authors meet authorship criteria and that no others meeting the criteria have been omitted.
Funding: This study was supported by grants from the National Institutes of Health (R01ES032418, R01MD012769, R01ES028033, R01AG060232, R01ES030616, R01AG066793, R01MD016054, P30ES000002) and a grant from the Alfred P Sloan Foundation (G-2020-13946). The funders had no role in considering the study design or in the collection, analysis, interpretation of data, writing of the report, or decision to submit the article for publication.
Competing interests: All authors have completed the ICMJE uniform disclosure form at www.icmje.org/disclosure-of-interest/ and declare: support from the National Institutes of Health (NIH) and Alfred P Sloan Foundation for the submitted work. FD reports funding from NIH and Alfred P Sloan Foundation; JDS reports funding from NIH. All other authors declare no support from any organization for the submitted work; no financial relationships with any organizations that might have an interest in the submitted work in the previous three years, no other relationships or activities that could appear to have influenced the submitted work.
The lead author (the manuscript’s guarantor) affirms that the manuscript is an honest, accurate, and transparent account of the study being reported; that no important aspects of the study have been omitted; and that any discrepancies from the study as planned (and, if relevant, registered) have been explained.
Dissemination to participants and related patient and public communities: Findings from this study will be disseminated to relevant groups, such as the American Association of Retired Persons and Association of Mature American Citizens. We will also share the findings with the general public through various channels, such as the Office of Communications at Harvard T.H. Chan School of Public Health, Harvard Gazette, mainstream media outlets, and social media platforms. Additionally, this work will be presented at leading international scientific gatherings, such as the annual meetings of the International Society for Environmental Epidemiology and the Society for Epidemiologic Research, allowing for further discussion and engagement within the scientific community.
Provenance and peer review: Not commissioned; externally peer reviewed.
Ethics statements
Ethical approval
This study was approved by the institutional review board at the Harvard T.H. Chan School of Public Health and was exempt from informed consent requirements as a study of previously collected administrative data.
Data availability statement
The Medicare data are available upon request to the Centers for Medicare and Medicaid Services. The originally predicted, grid level PM2.5 data are publicly available at https://doi.org/10.7927/0rvr-4538. The calibrated, grid level and zip code level PM2.5 data are available from the corresponding author on reasonable request. The grid level ozone data are publicly available at https://doi.org/10.7927/a4mb-4t86. The grid level nitrogen dioxide data are publicly available at https://doi.org/10.7927/f8eh-5864. The zip code level ozone and nitrogen dioxide data are publicly available at https://doi.org/10.7927/9yp5-hz11. Data availability that relates to predictors in the PM2.5 modeling and calibration can be referred to Di et al.21 Other covariate data are publicly available with sources described in the manuscript.
References
- 1. Burnett R, Chen H, Szyszkowicz M, et al. Global estimates of mortality associated with long-term exposure to outdoor fine particulate matter. Proc Natl Acad Sci U S A 2018;115:9592-7. 10.1073/pnas.1803222115. [DOI] [PMC free article] [PubMed] [Google Scholar]
- 2. Brook RD, Rajagopalan S, Pope CA, 3rd, et al. American Heart Association Council on Epidemiology and Prevention, Council on the Kidney in Cardiovascular Disease, and Council on Nutrition, Physical Activity and Metabolism . Particulate matter air pollution and cardiovascular disease: An update to the scientific statement from the American Heart Association. Circulation 2010;121:2331-78. 10.1161/CIR.0b013e3181dbece1. [DOI] [PubMed] [Google Scholar]
- 3. Dominici F, Peng RD, Bell ML, et al. Fine particulate air pollution and hospital admission for cardiovascular and respiratory diseases. JAMA 2006;295:1127-34. 10.1001/jama.295.10.1127. [DOI] [PMC free article] [PubMed] [Google Scholar]
- 4. Danesh Yazdi M, Wei Y, Di Q, et al. The effect of long-term exposure to air pollution and seasonal temperature on hospital admissions with cardiovascular and respiratory disease in the United States: A difference-in-differences analysis. Sci Total Environ 2022;843:156855. 10.1016/j.scitotenv.2022.156855. [DOI] [PMC free article] [PubMed] [Google Scholar]
- 5. Hayes RB, Lim C, Zhang Y, et al. PM2.5 air pollution and cause-specific cardiovascular disease mortality. Int J Epidemiol 2020;49:25-35. 10.1093/ije/dyz114. [DOI] [PMC free article] [PubMed] [Google Scholar]
- 6. Alexeeff SE, Liao NS, Liu X, Van Den Eeden SK, Sidney S. Long-Term PM2.5 Exposure and Risks of Ischemic Heart Disease and Stroke Events: Review and Meta-Analysis. J Am Heart Assoc 2021;10:e016890. 10.1161/JAHA.120.016890. [DOI] [PMC free article] [PubMed] [Google Scholar]
- 7. Konduracka E, Rostoff P. Links between chronic exposure to outdoor air pollution and cardiovascular diseases: a review. Environ Chem Lett 2022;20:2971-88. 10.1007/s10311-022-01450-9. [DOI] [PMC free article] [PubMed] [Google Scholar]
- 8. Wellenius GA, Schwartz J, Mittleman MA. Particulate air pollution and hospital admissions for congestive heart failure in seven United States cities. Am J Cardiol 2006;97:404-8. 10.1016/j.amjcard.2005.08.061. [DOI] [PubMed] [Google Scholar]
- 9. Zanobetti A, Franklin M, Koutrakis P, Schwartz J. Fine particulate air pollution and its components in association with cause-specific emergency admissions. Environ Health 2009;8:58. 10.1186/1476-069X-8-58. [DOI] [PMC free article] [PubMed] [Google Scholar]
- 10. Yuan S, Wang J, Jiang Q, et al. Long-term exposure to PM2.5 and stroke: A systematic review and meta-analysis of cohort studies. Environ Res 2019;177:108587. 10.1016/j.envres.2019.108587. [DOI] [PubMed] [Google Scholar]
- 11. Kim H, Kim J, Kim S, et al. Cardiovascular Effects of Long-Term Exposure to Air Pollution: A Population-Based Study With 900 845 Person-Years of Follow-up. J Am Heart Assoc 2017;6:e007170. 10.1161/JAHA.117.007170. [DOI] [PMC free article] [PubMed] [Google Scholar]
- 12. Chen S-Y, Wu C-F, Lee J-H, et al. Associations between Long-Term Air Pollutant Exposures and Blood Pressure in Elderly Residents of Taipei City: A Cross-Sectional Study. Environ Health Perspect 2015;123:779-84. 10.1289/ehp.1408771. [DOI] [PMC free article] [PubMed] [Google Scholar]
- 13. Perez L, Wolf K, Hennig F, et al. Air pollution and atherosclerosis: a cross-sectional analysis of four European cohort studies in the ESCAPE study. Environ Health Perspect 2015;123:597-605. 10.1289/ehp.1307711. [DOI] [PMC free article] [PubMed] [Google Scholar]
- 14. Alexeeff SE, Deosaransingh K, Van Den Eeden S, Schwartz J, Liao NS, Sidney S. Association of Long-term Exposure to Particulate Air Pollution With Cardiovascular Events in California. JAMA Netw Open 2023;6:e230561. 10.1001/jamanetworkopen.2023.0561. [DOI] [PMC free article] [PubMed] [Google Scholar]
- 15. Hamer M, O’Donovan G, Stamatakis E. Association between physical activity and sub-types of cardiovascular disease death causes in a general population cohort. Eur J Epidemiol 2019;34:483-7. 10.1007/s10654-018-0460-2. [DOI] [PMC free article] [PubMed] [Google Scholar]
- 16. Wei Y, Qiu X, Yazdi MD, et al. The Impact of Exposure Measurement Error on the Estimated Concentration-Response Relationship between Long-Term Exposure to PM2.5 and Mortality. Environ Health Perspect 2022;130:77006. 10.1289/EHP10389. [DOI] [PMC free article] [PubMed] [Google Scholar]
- 17. Frey HC, Adams PJ, Adgate JL, et al. Independent Particulate Matter Review Panel . The Need for a Tighter Particulate-Matter Air-Quality Standard. N Engl J Med 2020;383:680-3. 10.1056/NEJMsb2011009. [DOI] [PubMed] [Google Scholar]
- 18.US Environmental Protection Agency. Reconsideration of the National Ambient Air Quality Standards for Particulate Matter. 2023:5558-5719. https://www.federalregister.gov/documents/2023/01/27/2023-00269/reconsideration-of-the-national-ambient-air-quality-standards-for-particulate-matter
- 19. Wei Y, Danesh Yazdi M, Ma T, et al. Additive effects of 10-year exposures to PM2.5 and NO2 and primary cancer incidence in American older adults. Environ Epidemiol 2023;7:e265. https://journals.lww.com/environepidem/fulltext/2023/08000/additive_effects_of_10_year_exposures_to_pm2_5_and.12.aspx. 10.1097/EE9.0000000000000265 [DOI] [PMC free article] [PubMed] [Google Scholar]
- 20. Wei Y, Yazdi MD, Di Q, et al. Emulating causal dose-response relations between air pollutants and mortality in the Medicare population. Environ Health 2021;20:53. 10.1186/s12940-021-00742-x. [DOI] [PMC free article] [PubMed] [Google Scholar]
- 21. Di Q, Amini H, Shi L, et al. An ensemble-based model of PM2.5 concentration across the contiguous United States with high spatiotemporal resolution. Environ Int 2019;130:104909. 10.1016/j.envint.2019.104909. [DOI] [PMC free article] [PubMed] [Google Scholar]
- 22. Feng Y, Wei Y, Coull BA, Schwartz JD. Measurement error correction for ambient PM2.5 exposure using stratified regression calibration: Effects on all-cause mortality. Environ Res 2023;216:114792. 10.1016/j.envres.2022.114792. [DOI] [PMC free article] [PubMed] [Google Scholar]
- 23.Wei Y, Xing X, Shtein A, et al. Daily and Annual PM2.5, O3, and NO2 Concentrations at ZIP Codes for the Contiguous U.S., 2000-2016, v1.0. Palisades, New York: NASA Socioeconomic Data and Applications Center (SEDAC); 2022. https://sedac.ciesin.columbia.edu/data/set/aqdh-pm2-5-o3-no2-concentrations-zipcode-contiguous-us-2000-2016
- 24. Wong CM, Lai HK, Tsang H, et al. Satellite-Based Estimates of Long-Term Exposure to Fine Particles and Association with Mortality in Elderly Hong Kong Residents. Environ Health Perspect 2015;123:1167-72. 10.1289/ehp.1408264. [DOI] [PMC free article] [PubMed] [Google Scholar]
- 25. Bai L, Shin S, Burnett RT, et al. Exposure to ambient air pollution and the incidence of congestive heart failure and acute myocardial infarction: A population-based study of 5.1 million Canadian adults living in Ontario. Environ Int 2019;132:105004. 10.1016/j.envint.2019.105004. [DOI] [PubMed] [Google Scholar]
- 26. Danesh Yazdi M, Wang Y, Di Q, et al. Long-Term Association of Air Pollution and Hospital Admissions Among Medicare Participants Using a Doubly Robust Additive Model. Circulation 2021;143:1584-96. 10.1161/CIRCULATIONAHA.120.050252 [DOI] [PMC free article] [PubMed] [Google Scholar]
- 27. United States Census Bureau . 2000. Summary File 3. https://www.census.gov/data/datasets/2000/dec/summary-file-3.html
- 28.United States Census Bureau. 2010 Census Demographic Profile Summary File. https://www.census.gov/data/datasets/2010/dec/demographic-profile-with-geos.html
- 29.Centers for Disease Control and Prevention. Behavioral Risk Factor Surveillance System. BRFSS 2013 Survey Data and Documentation. CDC, 2013. https://www.cdc.gov/brfss/annual_data/annual_2013.html
- 30. Cronenwett JL, Birkmeyer JD. The Dartmouth Atlas of Vascular Health Care. Cardiovasc Surg 2000;8:409-10. https://www.ncbi.nlm.nih.gov/pubmed/11184739. [PubMed] [Google Scholar]
- 31.Esri. Esri Data & Maps 10. An Esri White Paper. Redlands, CA: 2010. http://downloads.esri.com/support/whitepapers/ao_/Esri_Data_and_Maps_10.pdf.
- 32.Di Q, Wei Y, Shtein A, et al. Daily and Annual NO2 Concentrations for the Contiguous United States, 1-km Grids, v1 (2000-2016). Palisades, New York: NASA Socioeconomic Data and Applications Center (SEDAC); 2022 https://sedac.ciesin.columbia.edu/data/set/aqdh-no2-concentrations-contiguous-us-1-km-2000-2016.
- 33.Requia WJ, Wei Y, Shtein A, et al. Daily 8-Hour Maximum and Annual O3 Concentrations for the Contiguous United States, 1-km Grids, v1 (2000-2016). Palisades, New York: NASA Socioeconomic Data and Applications Center (SEDAC); 2021. https://sedac.ciesin.columbia.edu/data/set/aqdh-o3-concentrations-contiguous-us-1-km-2000-2016.
- 34. Schwartz J, Wei Y, Dominici F, Yazdi MD. Effects of low-level air pollution exposures on hospital admission for myocardial infarction using multiple causal models. Environ Res 2023;232:116203. 10.1016/j.envres.2023.116203. [DOI] [PMC free article] [PubMed] [Google Scholar]
- 35.2015 Area Deprivation Index. University of Wisconsin School of Medicine and Public Health. https://www.neighborhoodatlas.medicine.wisc.edu/.
- 36. Burki T. WHO introduces ambitious new air quality guidelines. Lancet 2021;398:1117. 10.1016/S0140-6736(21)02126-7 [DOI] [PubMed] [Google Scholar]
- 37. Hartley A, Marshall DC, Salciccioli JD, Sikkel MB, Maruthappu M, Shalhoub J. Trends in Mortality From Ischemic Heart Disease and Cerebrovascular Disease in Europe: 1980 to 2009. Circulation 2016;133:1916-26. 10.1161/CIRCULATIONAHA.115.018931. [DOI] [PubMed] [Google Scholar]
- 38.Zhang S, Lu W, Wei Z, Zhang H. Air Pollution and Cardiac Arrhythmias: From Epidemiological and Clinical Evidences to Cellular Electrophysiological Mechanisms. Frontiers in Cardiovascular Medicine 2021;8. [Review.] https://www.frontiersin.org/articles/10.3389/fcvm.2021.736151. [DOI] [PMC free article] [PubMed]
- 39. Lee KC, Sturgeon D, Lipsitz S, Weissman JS, Mitchell S, Cooper Z. Mortality and Health Care Utilization Among Medicare Patients Undergoing Emergency General Surgery vs Those With Acute Medical Conditions. JAMA Surg 2020;155:216-23. 10.1001/jamasurg.2019.5087. [DOI] [PMC free article] [PubMed] [Google Scholar]
- 40. Tibuakuu M, Jones MR, Navas-Acien A, et al. Exposure to ambient air pollution and calcification of the mitral annulus and aortic valve: the multi-ethnic study of atherosclerosis (MESA). Environ Health 2017;16:133. 10.1186/s12940-017-0346-x. [DOI] [PMC free article] [PubMed] [Google Scholar]
- 41. Nazarzadeh M, Pinho-Gomes A-C, Smith Byrne K, et al. Systolic Blood Pressure and Risk of Valvular Heart Disease: A Mendelian Randomization Study. JAMA Cardiol 2019;4:788-95. 10.1001/jamacardio.2019.2202. [DOI] [PMC free article] [PubMed] [Google Scholar]
- 42. Hamirani YS, Nasir K, Blumenthal RS, et al. Relation of mitral annular calcium and coronary calcium (from the Multi-Ethnic Study of Atherosclerosis [MESA]). Am J Cardiol 2011;107:1291-4. 10.1016/j.amjcard.2011.01.005. [DOI] [PubMed] [Google Scholar]
- 43. Kaufman JD, Adar SD, Barr RG, et al. Association between air pollution and coronary artery calcification within six metropolitan areas in the USA (the Multi-Ethnic Study of Atherosclerosis and Air Pollution): a longitudinal cohort study. Lancet 2016;388:696-704. 10.1016/S0140-6736(16)00378-0. [DOI] [PMC free article] [PubMed] [Google Scholar]
- 44. Eriksson J, Forsén T, Osmond C, Barker D. Obesity from cradle to grave. Int J Obes Relat Metab Disord 2003;27:722-7. 10.1038/sj.ijo.0802278 [DOI] [PubMed] [Google Scholar]
- 45. Brown DM, Picciotto S, Costello S, et al. The Healthy Worker Survivor Effect: Target Parameters and Target Populations. Curr Environ Health Rep 2017;4:364-72. 10.1007/s40572-017-0156-x. [DOI] [PMC free article] [PubMed] [Google Scholar]
- 46. Jbaily A, Zhou X, Liu J, et al. Air pollution exposure disparities across US population and income groups. Nature 2022;601:228-33. 10.1038/s41586-021-04190-y. [DOI] [PMC free article] [PubMed] [Google Scholar]
- 47. Khera A, Baum SJ, Gluckman TJ, et al. Continuity of care and outpatient management for patients with and at high risk for cardiovascular disease during the COVID-19 pandemic: A scientific statement from the American Society for Preventive Cardiology. Am J Prev Cardiol 2020;1:100009. 10.1016/j.ajpc.2020.100009. [DOI] [PMC free article] [PubMed] [Google Scholar]
- 48. Comess S, Chang HH, Warren JL. A Bayesian framework for incorporating exposure uncertainty into health analyses with application to air pollution and stillbirth. Biostatistics 2023;25:20-39. 10.1093/biostatistics/kxac034. [DOI] [PMC free article] [PubMed] [Google Scholar]
- 49. Naimi AI, Moodie EE, Auger N, Kaufman JS. Constructing inverse probability weights for continuous exposures: a comparison of methods. Epidemiology 2014;25:292-9. 10.1097/EDE.0000000000000053. [DOI] [PubMed] [Google Scholar]
- 50. Honigberg MC, Patel RB, Pandey A, et al. Trends in Hospitalizations for Heart Failure and Ischemic Heart Disease Among US Adults With Diabetes. JAMA Cardiol 2021;6:354-7. 10.1001/jamacardio.2020.5921. [DOI] [PMC free article] [PubMed] [Google Scholar]
Associated Data
This section collects any data citations, data availability statements, or supplementary materials included in this article.
Supplementary Materials
Supplementary information: Methodology for calibration of PM2.5 exposure, tables S1-S11, and figures S1-S3
Data Availability Statement
The Medicare data are available upon request to the Centers for Medicare and Medicaid Services. The originally predicted, grid level PM2.5 data are publicly available at https://doi.org/10.7927/0rvr-4538. The calibrated, grid level and zip code level PM2.5 data are available from the corresponding author on reasonable request. The grid level ozone data are publicly available at https://doi.org/10.7927/a4mb-4t86. The grid level nitrogen dioxide data are publicly available at https://doi.org/10.7927/f8eh-5864. The zip code level ozone and nitrogen dioxide data are publicly available at https://doi.org/10.7927/9yp5-hz11. Data availability that relates to predictors in the PM2.5 modeling and calibration can be referred to Di et al.21 Other covariate data are publicly available with sources described in the manuscript.


