Abstract
A FLIP device gives cross-sectional area along the length of the esophagus and one pressure measurement, both as a function of time. Deducing mechanical properties of the esophagus including wall material properties, contraction strength, and wall relaxation from these data are a challenging inverse problem. Knowing mechanical properties can change how clinical decisions are made because of its potential for in-vivo mechanistic insights. To obtain such information, we conducted a parametric study to identify peristaltic regimes by using a 1D model of peristaltic flow through an elastic tube closed on both ends and also applied it to interpret clinical data. The results gave insightful information about the effect of tube stiffness, fluid/bolus density and contraction strength on the resulting esophagus shape through quantitive representations of the peristaltic regimes. Our analysis also revealed the mechanics of the opening of the contraction area as a function of bolus flow resistance. Lastly, we concluded that peristaltic driven flow displays three modes of peristaltic geometries, but all physiologically relevant flows fall into two peristaltic regimes characterized by a tight contraction.
Keywords: Esophagus, Elastic tube flow, Peristalsis, Reduced-order model, Fluid–structure interaction
1. Introduction
The esophagus is a tubular organ that connects between the mouth and the stomach (Mittal 2016). A healthy functioning esophagus transports swallowed material towards the stomach by a peristaltic contraction wave which leads to an increase in pressure distal of contraction (Regan et al. 2012; Jain et al. 2019). Understanding this peristaltic behavior and deducing the mechanical properties of the esophagus can change how clinical decisions are made. Being able to quantify the parameters that define a healthy swallow can contribute to the process of classifying and diagnosing esophageal disease progression. Common esophageal disorders include gastroesophageal reflux disease (GERD), achalasia and eosinophilic esophagitis (EoE) (Aziz et al. 2016). One tool that is used today to determine the state of the esophagus is the functional lumen imaging probe (FLIP) (Jain et al. 2019; Carlson et al. 2015). The FLIP is composed of a flexible catheter enclosed by a bag. It is placed within the esophageal lumen and records the esophagus wall response to the filling of the FLIP bag. When the bag volume increases, it activates distention-induced contractions of the esophagus wall (Regan et al. 2012). The FLIP records the esophagus cross-sectional area at different locations and one distal pressure measurement as a function of time. However, deducing the mechanical properties from FLIP data is a complicated inverse problem.
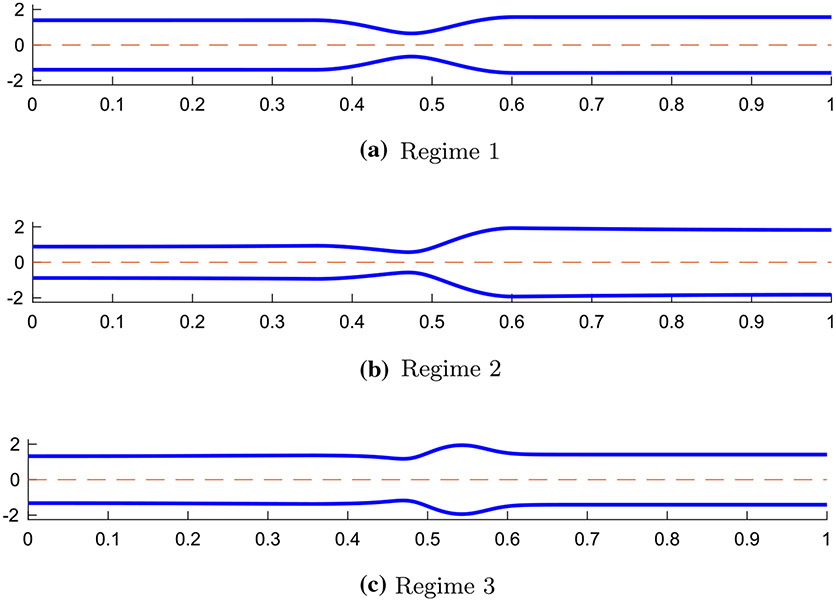
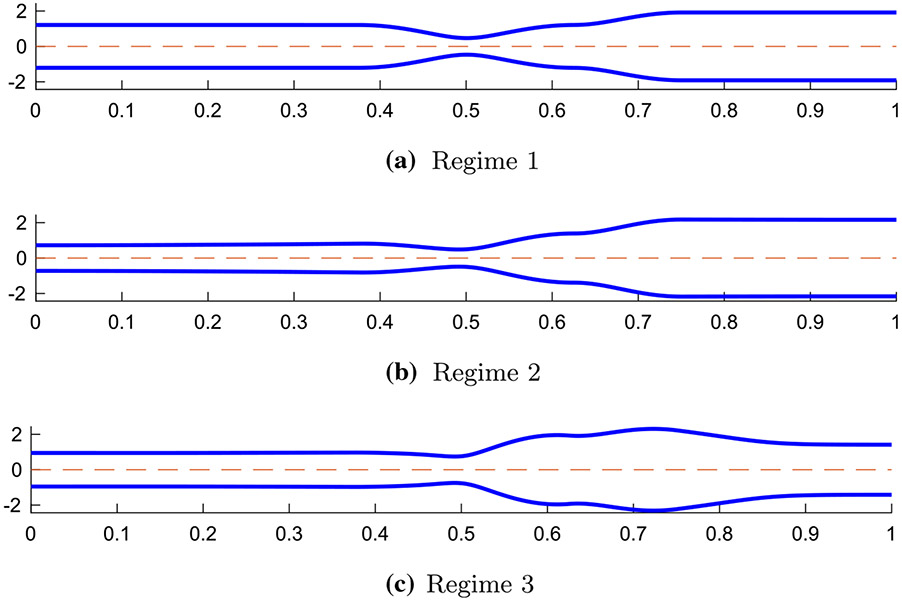
Extensive studies were conducted to better understand peristaltic flow through a tubular geometry (Jaffrin and Shapiro 1971; Fung and Yih 1968; Burns and Parkes 1967; Latham 1966; Abo-Elkhair et al. 2021; Bhatti and Abdelsalam 2021). However, limited work was done to study peristaltic flow through an elastic tube closed on both ends. In a study by Acharya et al. (2021), a 1D model of a peristaltic flow through an elastic closed tube was developed in order to investigate the relationship between tube stiffness, fluid viscosity, peristaltic contraction strength, internal pressure in the bag, and the resulting tube geometry. The model intended to imitate a flow inside a FLIP device located in the esophagus. Three peristaltic regimes were identified based on the resulting shape of the elastic tube which helped to better understand the different elements of peristaltic flow (Acharya et al. 2021). The geometries of the three regimes are presented in Fig. 1. As concluded by Acharya et al. (2021), in the process of moving from peristaltic regime 1 to 3, the viscosity is increased such that it creates a competition between the force from the wall of the tube and the resistance to the flow.
Fig. 1.
Tube geometries of the three physiologically relevant peristaltic regimes identified by Acharya et al. (2021). The shapes were captured from three different simulations at a single time instance in the contractile cycle
The separation into regimes can be a useful tool in clinical practice as it allows us to differentiate between effective and ineffective distention-induced peristalsis. In regime 1, presented in Fig. 1a, the tube wall is relatively stiff while the fluid viscosity is low. In this case, as the peristaltic wave travels down the deformable tube, the fluid at the contracted section moves in opposite direction to the traveling wave (Jaffrin and Shapiro 1971). The traveling contraction remains contracted, and the cross-sectional areas proximal and distal of the contraction are close to each other in value. In regime 2, presented in Fig. 1b, flow resistance is high and the tube wall distal of contraction expands so that the peristaltic contraction wave carries the fluid forward. This regime is considered most effective in pushing fluid forward. Lastly, peristaltic regime 3, presented in Fig. 1c, is an ineffective contractile cycle since the contraction opens which allows retrograde flow. This is a result of the inflation of the cross-sectional area downstream which makes it harder for the peristaltic contraction to move forward in its original contracted form (Takagi and Balmforth 2011; Acharya et al. 2021).
The peristaltic regimes discussed in Acharya et al. (2021) were identified qualitatively, based on the geometry of the tube. In this work, we aimed to develop a metric which allows us to quantify and distinguish the different regimes numerically, and therefore, get a deeper understanding of the reasons behind their formation. Moreover, through the proposed mathematical representations of the regimes, we explained the physics behind the transition between peristaltic regimes 2 and 3 and obtained insightful information on the leading parameters that cause this transition. Lastly, we applied the proposed metric to clinical FLIP data to learn about their peristaltic behaviors and identify their peristaltic regimes.
2. Problem formulation , numerical solution
2.1. Governing equations in 1D
The problem considers a 1D peristaltic flow of an incompressible, viscous, newtonian fluid through an elastic tube closed on both ends. The mass conservation equation is
| (1) |
and the momentum conservation equation is
| (2) |
Here, is the tube cross-sectional area, is the fluid velocity (averaged at each cross-sectional area), is fluid density, is the pressure inside the tube, and is friction due to drag. These 1D forms of the continuity and the momentum conservation equations were derived by Ottesen (2003) and have been widely used to describe valveless pumping (Acharya et al. 2021; Manopoulos et al. 2006; Bringley et al. 2008).
In addition, a linear, constitutive relation between pressure and the cross-sectional area of the tube is introduced, such that
| (3) |
where is tube stiffness and is the undeformed reference area (or rest area) representing the cross-sectional area of the tube when . The pressure term on the left hand side of Eq. (3) represents the difference between the pressure inside and outside the tube, such that . Since the pressure outside of the tube is assumed to be the reference pressure (zero), , we can express the pressure inside the tube in terms of area, such that
| (4) |
A derivation of this linear relation is available in Whittaker et al. (2010), and it has been verified experimentally by Kwiatek et al. (2011).
The esophagus transports fluid through a peristaltic contraction wave which is modeled to be sinusoidal with time. Simultaneously, the esophagus wall distal of contraction relaxes, making the wall more compliant at that region. The relaxation segment travels sinusoidally with time distal of contraction (Mittal 2016; Abrahao Jr et al. 2011). Therefore, in order to mimic the contraction and relaxation of the muscle fibers of the esophagus, an activation term is introduced (Acharya et al. 2021; Ottesen 2003; Manopoulos et al. 2006; Bringley et al. 2008), which is responsible for the changes in the reference area of the tube wall, such that
| (5) |
This approach is commonly used when the external activation pressure at a specific location varies sinusoidally with time. Contraction is associated with the reduction of the tube area implying , and relaxation is associated with increase in the tube area implying . For , neither contraction nor relaxation are present. The expression for and its values are elaborated upon in Sect. 2.2.
2.1.1. Non-dimensionalizing dynamic equations
To obtain a numerical solution for the peristaltic driven flow inside a closed, deformable tube, Eqs. (1), (2) and (5) were non-dimetionalized as proposed by Acharya et al. (2021) using
| (6) |
Here, is the speed of the peristaltic wave, is the length of the tube, and , , , , and are non-dimensional variables of area, time, velocity, pressure, and position, respectively. The purpose of this step is to reduce the number of independent variables. Moreover, non-dimensionalization is convenient for a parametric study of the problem. The non-dimensional form of Eqs. (1) and (2), are
| (7) |
| (8) |
respectively, where
| (9) |
Note that the friction term is a function of both the cross-sectional area of the tube and fluid velocity. Assuming a parabolic flow inside the tube, the term is approximated as . Therefore, the non-dimensional variable can be written as where respectively, where
| (10) |
Plugging this into Eq. 8 we obtain
| (11) |
The non-dimensional form of Eq. (5), is
| (12) |
Notice that this non-dimensional equation for pressure includes the term on the right hand side, which does not appear in the dimensional form of the equation. This term is added in order to regularize the system of equations which helps stabilizing the numerical solution (Acharya et al. 2021; Wang et al. 2014). This term is also known as the damping term, which is kept small in order to approximate the original the pressure-area equation. The damping term’s dimensional form is , where is the damping coefficient. Therefore, .
Lastly, we can reduce our system into two equations by substituting the non-dimensional pressure Eq. (12) into the non-dimensional momentum Eq. (11) to obtain
| (13) |
where is equal to the product of and .
2.2. Peristaltic wave input and active relaxation
As previously mentioned, is the activation term introduced in the constitutive equation for pressure to resemble the contraction and relaxation of the esophagus’ muscles. This term is responsible for the changes in the reference cross-sectional area of the tube wall as the wave travels in time along the length of the tube. The pattern used for is based on clinical study on esophageal peristalsis (Goyal and Chaudhury 2008; Crist et al. 1984). Recall that contraction is associated with the reduction of the tube reference area and relaxation is associated with increase in the tube reference area. In order to implement these processes in the model, the activation term is defined by a step-wise wave function (Acharya et al. 2021; Ottesen 2003; Manopoulos et al. 2006; Bringley et al. 2008) of the form
| (14) |
where is the non-dimensional width of the peristaltic wave defined by , with denoting the dimensional contraction width, and represents the width of the wave connecting between the contraction and relaxation. Note that the non-dimensional wave speed is 1.0 since, as in Acharya et al. (2021), the velocity scale was chosen to be the same as the speed of the peristaltic wave.
Figure 2 presents a plot of the activation function at a time instant, which helps to visualize Eq. (14). As concluded by Abrahao Jr et al. (2011), active relaxation is observed only distal of contraction. Therefore, proximal of contraction (location 2), , implying that there is no active contraction or relaxation at that location. Distal of contraction (location 1), implying that there is active relaxation. The values of examined in this work are 1.0, 2.5, and 5.0, which were chosen based on the results obtained by Halder et al. (2021). At location , is the smallest, which represents the point on the tube where the contraction is strongest. The value of at location is noted at , and is called the contraction strength. The smaller the value of , the tighter the contraction. The physiologically relevant values of that are considered in this work have been proposed by Acharya et al. (2021), and are 0.05, 0.10, 0.15, and 0.20. Note that the smaller the value of , the tighter the contraction and the better the peristaltic wave is in pushing fluid forward.
Fig. 2.
A plot of the peristaltic activation function from Eq. (14) along the tube length at a time instant. Contraction occurs when and relaxation occurs when
2.3. Boundary conditions
After identifying and non-dimensionalizing the system of equations that define the problem of interest, and stating the activation forces that drive the flow, one needs to formulate boundary conditions in order to solve for the non-dimensional area and velocity . When in Eq. (12) is equal to zero, is equal to zero, and the system of equations is hyperbolic (Acharya et al. 2021). This allows only one boundary condition for and one for . However, recall that the tube is closed on both ends, and the volume inside the tube remains constant. Therefore, the boundary conditions for the velocity is defined at both ends such that
| (15) |
which is independent of the value of (Acharya et al. 2021).
In order to define boundary conditions for which are consistent with the ones defined for , the conditions defined in Eq. (15) were applied on the non-dimensional momentum Eq. (11) to obtain . Then, the partial derivative of the non-dimensional pressure Eq. (12) was taken with respect to to obtain
| (16) |
Since goes to 0, a Neumann boundary condition for the non-dimensional area is obtained, such that
| (17) |
The value of is constant at the boundary, hence the boundary condition for is simplified to
| (18) |
Note that, as elaborated upon by Acharya et al. (2021), even in the case where is not equal to zero, the effects due to this damping at the boundary is negligible.
2.4. Numerical implementation
Now that the dynamic problem is set, one needs to solve the system of Eqs. (7) and (13) with the boundary conditions in Eqs. (15) and (18) to obtain the non-dimensional cross-sectional area and velocity . The initial conditions for the velocity and cross-sectional area are
| (19) |
A smoothing term is added to the right-hand side of the non-dimensional continuity equation in (7) in order to reduce solving time by a faster convergence, such that
| (20) |
This system was then solved using the MATLAB pdepe function. More details about the computational technique and validation of the solution is available in Acharya et al. (2021).
Each simulation has a unique combination of the parameters defined in Sects. 2.1.1 and 2.2, and are listed in Table 1. As described by Acharya et al. (2021), and is shown later in this writing, varying there parameters, and particularly , , and , is equivalent to changing tube wall stiffness, wave speed, contraction strength, fluid density, and fluid viscosity. The values for these parameters are prescribed as follows. and cover a large range to account for all possible phenomena. Typical clinical values are generally small (order 1) and large (order 103). However, cases with high and small values are included to captures scenarios where viscous effects are not negligible. Note that there is no difference in the results for or 100, hence represents experimental case. The contraction width is determined by scaling a typical value of the width of the traveling contraction and the EGJ by the FLIP length. Maximum contraction strength is assigned based on the results in Halder et al. (2021). The values for the relaxation strength ( and ) is discussed in Sect. 2.2. The value for the initial cross-sectional area, depends on the constant volume of the bag, such that , where is bag volume.
Table 1.
List of non-dimensional parameters
| Symbol | Values | Meaning |
|---|---|---|
| 100–10,000 | Dimensionless strength of viscous effects (inverse of Reynolds number) | |
| 100–10,000 | Dimensionless rigidity of the elastic tube (inverse of Cauchy number) | |
| 0.05–0.2 | Peristaltic contraction strength | |
| 1, 2.5, 5 | Relaxation strength distal of contraction | |
| 1 | Relaxation strength proximal of contraction | |
| 0.25 | Width of peristaltic wave | |
| 0.25 | Width of the wave connecting between the contraction and relaxation | |
| 1.25–2.0 | Constant area that depends on the volume of the bag |
3. Reduced-order model
As an approximation, we also chose to study a simplified, reduced-order model of our dynamic problem by looking at the solution from the frame of reference of the traveling contraction wave at a specific point in time, . The selected time instance is taken when the traveling contraction wave is located exactly at the center of the tube length. Half tube length is preferred so that the end effects are minimal and the approximation, discussed next, is a better one. In the chosen frame of reference and time instance, we assume that a fully developed flow goes from location 1 to location 2, as shown in Fig. 3. Note that in the frame of reference of the lab, the peristaltic contraction wave travels at a constant speed , in the opposite direction to the one shown in Fig. 3, as it attempts to push the fluid towards the distal end of the tube (on the right). Therefore, throughout this paper, upstream refers to location 2 and downstream refers to location 1.
Fig. 3.
The geometry corresponding to the reduced-order model
For the fully developed flow configuration in Fig. 3, the continuity and momentum are
| (21) |
| (22) |
where is flow rate. The pressure Eq. (5) is only a function of displacement given by
| (23) |
We can further simplify by plugging Eq. (23) into Eq. (22) and integrating from point 1 to point 2 on Fig. 3 which yields
| (24) |
where and are the relaxation factor at location 1 and 2, respectively. Note that the reference area at any location on the tube is defined as . Therefore, and are the tube’s reference areas at locations 1 and 2, denoted by and , respectively.
The non-dimensional form of Eq. (24) is
| (25) |
where
| (26) |
given that and . Lastly, we want to represent the cross-sectional area at the contraction (location in Fig. 3) in terms of non-dimensional parameters. Since the contraction is located at point , the cross-sectional area at , denoted by , is the smallest cross-sectional area of the tube. When analyzing results we will use two different non-dimensionalizations of
| (27) |
where is the peristaltic contraction strength. The variable is an intermediate non-dimensional variable for the contraction cross-sectional area, defined as , where is the reference cross-sectional area of the tube at the strongest part of the contraction.
The non-dimensional parameters in Eqs. (26) and (27) are related to the non-dimensional parameters of the dynamic equations. Recall that , therefore
| (28) |
where is the location on the tube. Moreover, the stiffness parameter of the reduced-order model can be expressed in terms of (Eq. 9), the stiffness parameter of the dynamic system, such that
| (29) |
The viscous parameter (Eq. 10) maps onto the friction parameter . Since there is an integral in the definition of , its value depends on the shape of the elastic tube. In other words, there is no closed form, easy transformation between the two. However, it is possible to use the numerical solution of the 1D dynamic model and deduce the value of , which is related to the viscosity of the fluid. To solve for , Eq. (25) is rearranged such that
| (30) |
Both non-dimensional parameters and can be calculated from the solution of the 1D dynamic model as discussed above. If no relaxation is implemented then and
| (31) |
Notice from the expression for in Eq. (26), that the stiffness coefficient of the tube is in the denominator, meaning that for a flow going through an elastic tube with very high stiffness, tends to zero. Hence, when the tube stiffness is sufficiently high, Eq. (30) can be approximated by a linear relation between the friction parameter and the non-dimensional upstream area , such that
| (32) |
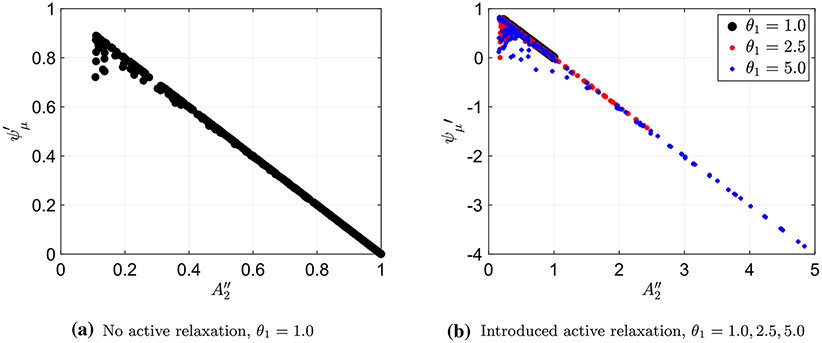
Using numerical solutions of the 1D dynamic model and Eqs. (26) and (30), the non-dimensional area parameter and the friction coefficient were calculated and then plotted, as presented in Fig. 4. Each point on the plots in the figure represents a single peristaltic contraction simulation, where each simulation encloses a different combination of the problem parameters, which include , , and . Figure 4a displays the friction parameter as a function of non-dimensional cross-sectional area upstream (area 2) when no relaxation is implemented . Figure 4b displays the same plot using three different data sets, each with a different relaxation strength, (, 2.5, and 5.0), where the different strengths are distinguished by a different color and shape. As the figure shows, the simulation results are mostly consistent with the linear relation presented in Eq. (32), with some outliers in each plot. The outliers, as expected, correspond to cases where the stiffness is not very high, introducing the nonlinearity in the relation. This linear relation is insightful since it provides a simple expression of friction in terms of cross-sectional area. Moreover, this relation is applicable to all three peristaltic regimes which presents a common property among all three resulting geometries. It is shown to be particularly useful in understanding and classifying the transition between regimes, as discussed in Sect. 4.
Fig. 4.
Plotting the friction coefficient and non-dimensional area parameter to show their linear correlation
4. Results and discussion
In the peristaltic regime investigation by Acharya et al. (2021), the peristaltic regime types were classified qualitatively, based on the resulting tube geometry, and these shapes were explained based on the problem’s physical parameters. In this work, we aim to take this study one step forward by finding mathematical expressions to quantify and distinguish the different regimes numerically, and therefore, get a deeper understanding into the reasons behind their formation. Moreover, when relaxation is introduced, we find that the regime classification based solely on geometric shapes is not possible. Relaxation was not considered () in the prior work by Acharya et al. (2021). Therefore, here we seek a quantitative basis for regime classification. In addition, by defining the different peristaltic regimes analytically, we explain the transition between regimes 2 and 3 both quantitatively as well as qualitatively.
4.1. Identification and mechanics of different peristaltic regimes
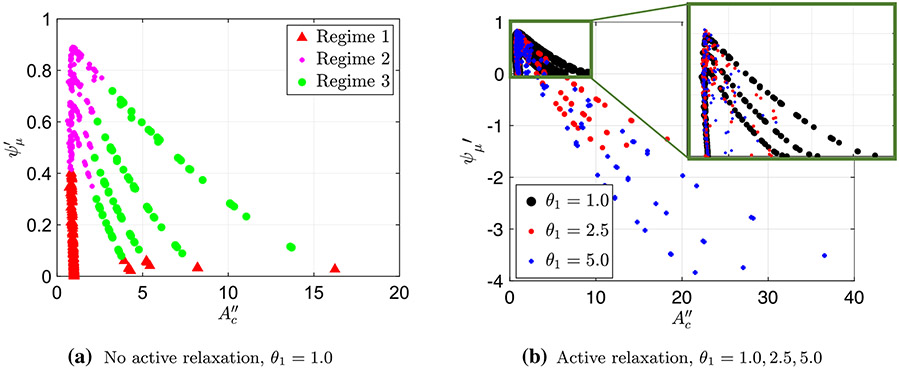
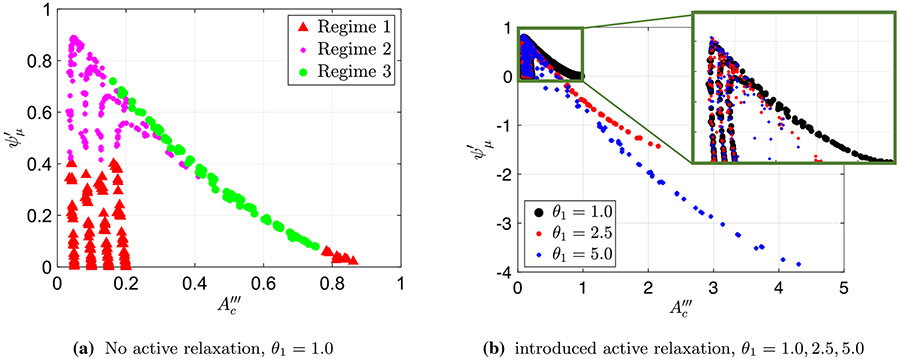
When looking at the geometries of the different peristaltic contractions obtained by the simulations’ results without active relaxation (as shown in Fig. 1), one can see that for peristaltic regimes 1 and 2, the cross-sectional area at location is much smaller than the cross-sectional areas at locations 1 and 2. In other words, the contraction is tight. On the other hand, in peristaltic regime 3, the contraction cross-sectional area is not as tight, and the cross-sectional areas at locations and 2 seem to be of the same order of magnitude. Therefore, we hypothesize that the transition between peristaltic regimes 2 and 3 should be a process in which the contraction is relatively weak and the corresponding cross-sectional area opens. Moreover, Acharya et al. (2021) concluded that the process of moving from peristaltic regime 1 to 3 is a direct result of an increase in viscosity. Hence, in the search for mathematical relations that characterize the different peristaltic regimes, we examine the role of friction in opening the contraction. To do so, we explore two different scalings’ relations between friction and contraction area. The first, presented in Fig. 5, displays the friction parameter defined in Eq. (30) as a function of the non-dimensional contraction area parameter defined in Eq. (27). The second, presented in Fig. 6, displays the friction parameter as a function of the non-dimensional contraction area parameter defined in Eq. (27).
Fig. 5.
The friction parameter plotted as a function of the non-dimensional contraction area parameter
Fig. 6.
The friction parameter was plotted as a function of the non-dimensional contraction area parameter
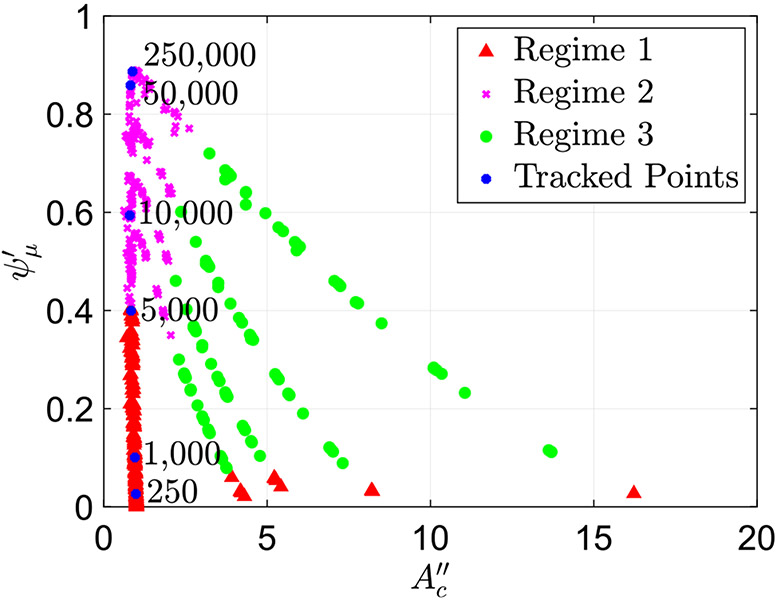
Figure 5a presents a plot of (Eq. 30) as a function of (Eq. 27) for the simulations where no relaxation was present distal of the contraction . In this figure, the peristaltic regime type of each case, as identified based on the shape of the tube, is marked in a different color and shape. By doing so, the plot reveals a clear separation between the three regimes, allowing us to determine the regime type based on the values of and , without looking at the tube’s geometry. As the figure shows, in this scaling, two clear patterns emerge. First, the simulation cases classified as regimes 1 and 2 fall on top of each other, creating a vertical line at a distinct value of . Second, the cases classified as regime 3 form four distinct lines. Similarly, Fig. 5b presents a plot of the friction parameter as a function of for three different data sets, each with a different relaxation strength, , 2.5, and 5.0, where the different strengths are distinguished by a different color and shape. By looking at this plot, it is clear that it displays the same pattern as observed in Fig. 5a (vertical line at for regimes 1 and 2 and distinct lines for regime 3).
Noticing that all three data sets display a similar trend reveals a quantitative separation into peristaltic regimes that is independent of relaxation. Recall that when we implement active relaxation to the model, the resulting geometries of the tubes do not follow the previously defined classifications of regime since they have different shapes. Therefore, we did not have a way to characterize them into a certain regime. However, since the pattern from Fig. 5a repeats in b, we can conclude that contractile cycles that lie on the vertical line are regimes 1 and 2, and the cases which lie right of this line are regime 3. Figure 7 displays the shapes of the three peristaltic regimes when relaxation is introduced as indicated by Fig. 5b.
Fig. 7.
Tube geometry of the three peristaltic regimes in a FLIP device when there is relaxation distal of contraction. The separation into three regimes was done based on the observations similar to those in Fig. 5
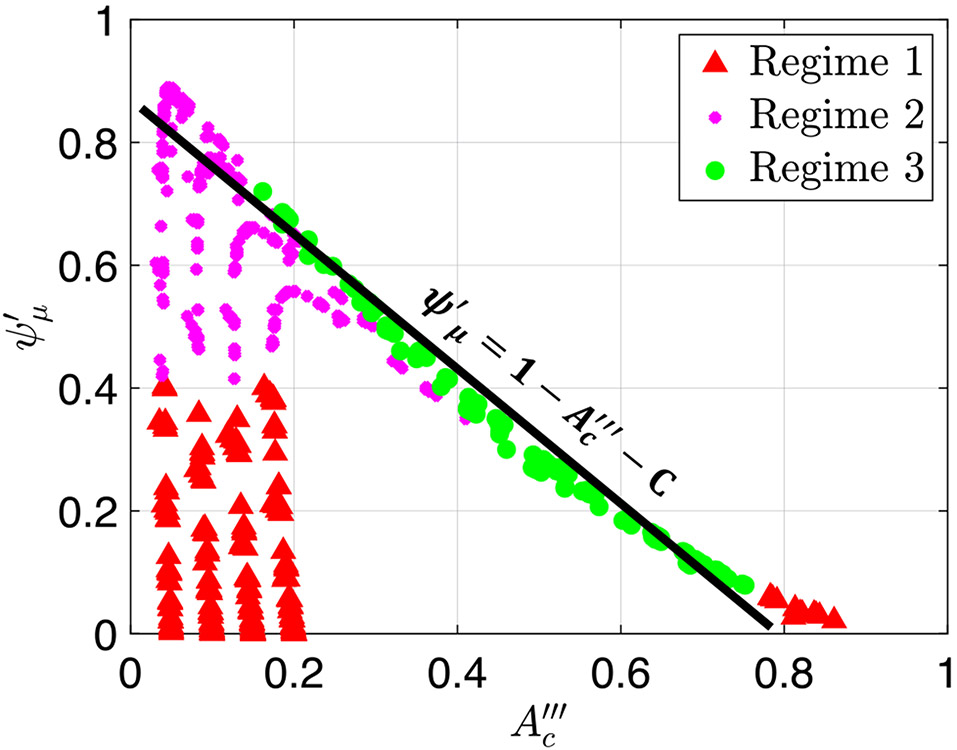
Figure 6a presents a plot of the friction parameter (Eq. 30) as a function of (Eq. 27) for the simulations where no relaxation was present distal of contraction . As in Fig. 5a, the peristaltic regime type of each case, as identified based on the shape of the tube, is marked in a different color and shape. Different than the scaling used in Fig. 5, in this scaling cases marked as peristaltic regime 3 merge into a single curve which is linear in leading order approximation. Moreover, the cases identified as peristaltic regimes 1 and 2 do not form a single vertical line but rather form four distinct vertical lines, each corresponds to a distinct value of , 0.10, 0.15, and 0.20. Again, by identifying the regimes on this plot, we can see the separation between the three regimes, which provides us an additional way of determining the regime type quantitatively, this time based on the values of and .
Figure 6b presents a plot of as a function of of three different data sets, each with a different relaxation strength, , 2.5, and 5.0, where the different strengths are distinguished by a different color and shape. As the figure shows, three distinct vertical lines emerge at , 0.15, and 0.20, as well as a linear curve. These two trends are shared by all three data sets, which reveals a quantitative separation into peristaltic regimes that is independent of relaxation. Therefore, we can conclude that contractile cycles that fall on the vertical lines at , 0.15, and 0.20 are regimes 1 and 2, and the cases which lie on the linear curve are regime 3.
4.1.1. Peristaltic regimes 1, 2
The observation that the cases classified as peristaltic regimes 1 and 2 form a single vertical line in Fig. 5 at allows us to derive an analytic expression that characterizes these regimes and holds independent of the relaxation parameter. In Eq. 27, we defined , which implies that
| (33) |
and therefore
| (34) |
Equation (34) reveals a direct relation between the cross-sectional area at the contraction and downstream cross-sectional area in the physical space for peristaltic regimes 1 and 2. The reason for this relation will be discussed later below.
The relation in (34) is also observed in the scaling used in Fig. 6. The four values of which correspond to the four vertical lines of regime 1 and 2 in Fig. 6a are equivalent to the four contraction strengths, , examined in this work. Therefore, for regimes 1 and 2,
| (35) |
Plugging the definition of from Eqs. (27) into (35) results in the same relation presented in Eq. (34). Note that for the simulations with active relaxation , the contraction strengths that were considered are , 0.15, and 0.20 and did not include , which explains why we only see three vertical lines in Fig. 6b.
The relation presented in Eq. (34) helps to explain why the contractile cycle cases classified as regimes 1 and 2 all fall on the same vertical line in Fig. 5. Imagine a case of an elastic tube that is empty and therefore not pressurized. The cross-sectional area of the unfilled tube is uniform and equal to the undeformed reference area (also known as rest area), . When applying a contraction of strength at location on the deformable, unpressurised tube, (simply squeezing the tube at point ), the area at location must satisfy . Next consider that the tube is starting to fill up with liquid. Consequently, the reference area will grow and the pressure will increase. As denoted in the linear tube law in Eq. (5), the ratio can be used to quantify the amount of filling because it helps us to understand the change in pressure. In the static case, the pressure is uniform throughout the tube length, and therefore
| (36) |
which can be simplified to
| (37) |
and further rearranged to Eq. (34). This shows that although the solutions considered in this analysis are of dynamic processes, contractile cycles classified as regimes 1 and 2 are very close to the static solution. In other words, the equation implies that the inertia effects of these cases are very small, so that they all fall on the same vertical line.
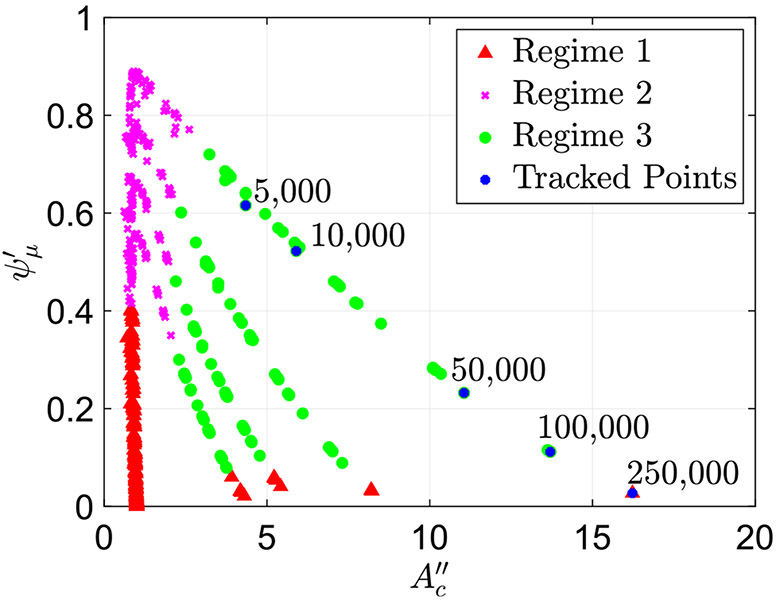
One of the key characteristics of peristaltic regimes 1 and 2 is that the contraction remains tight. In other words, the cross-sectional area at location remains small and close to . This has been concluded by observing all the cases classified at peristaltic regimes 1 and 2. This is in contrast to the contraction in peristaltic regime 3, which opens, as discussed in Sect. 4.1.2. Additionally, as expected, in regimes 1 and 2, when the fluid viscosity increases, the friction parameter (flow resistance) increases. To confirm this, we track six cases classified as peristaltic regimes 1 and 2, all with the same wall stiffness and contraction strength . The only parameter differentiating these cases is the value of , the non-dimensional parameter which includes fluid viscosity defined in Eq. (10). We observe that as the viscosity increases, the friction parameter increases. Figure 8 presents the plot in Fig. 5a with the six points identified, marked in blue and their corresponding values. The figure shows that even as the viscosity increases the contraction cross-sectional area parameter remains the same. Thus, the resistance to the flow increases at higher viscosity, which in turn causes an increase in .
Fig. 8.
Plot of the friction parameter as a function of with six highlighted cases with the same and and changing . The value of in each case is written on the plot. The plot shows how in peristaltic regimes 1 and 2, friction parameter increases as fluid viscosity parameter increases
Note that in this work, we combined regimes 1 and 2 because in both cases, the contraction does not open and . However, there is a difference between the two regimes. In both Figs. 5 and 6, transition between regimes 1 and 2 occurs at . This is because of the threshold defined by Acharya et al. (2021), in which regime 2 occurs when is significantly smaller (40% smaller) than . Using this threshold and the definition of from Eq. (26), regime 2 occurs when
| (38) |
where is some multiplication factor determined empirically. The LHS of Eq. (38) represents viscous resistance, and the RHS represents elastic forces. Hence, regime 1 and 2 transition occurs when viscous resistance is greater than the energy required to deform the wall.
The flow resistance also depends on the wave speed which also impacts which regime is observed (regime 1 or regime 2). In the context of our non-dimensional parameters of the dynamic problem, regime 1 is associated with higher values of (Eq. 9) and lower values of (Eq. 10), whereas regime 2 is associated with the opposite relation. Hence, if we want to convert a given regime 1 contractile cycle into regime 2, we need to increase and decrease . If fluid viscosity and tube stiffness are to remain constant, we can increase to obtain this conversion.
4.1.2. Peristaltic regime 3
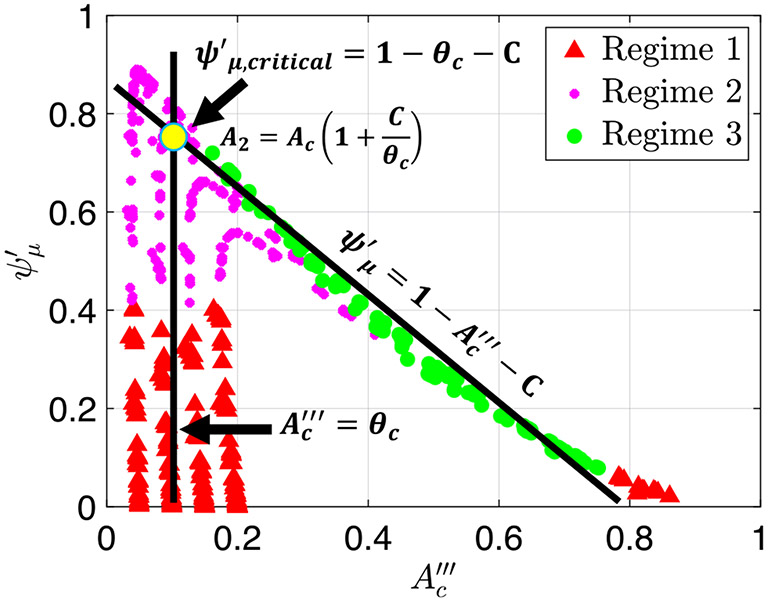
Consider the line constructed for cases marked as regime 3 in both plots in Fig. 6. To the leading order goes as , such that
| (39) |
This simple linear relation expresses friction in terms of contraction area, that is unique to cases classified as peristaltic regime 3. Most importantly, this expression, together with Fig. 6, show that increasing the cross-sectional area at the contraction is related to decrease in friction. was determined to be approximately equal to 0.2 based on Fig. 9.
Fig. 9.
Plot of the friction parameter as a function of alongside the line . This plot uses the output data from the simulations where there is no relaxation,
In order to make the expression in Eq. (39) useful in differentiating between the peristaltic regimes, we want to find a relation between the area parameters that is unique to cases classified as regime 3. To do so, we utilize the derived linear relation in Eq. (32), which applies to all three peristaltic regimes and Eq. 39, such that, for peristaltic regime 3,
| (40) |
Plugging in the definitions of and from Eqs. (27) and (26), respectively, into Eq. (40), we obtain a relation between the contraction area and the area upstream in the physical space, that is unique to peristaltic regime 3, such that
| (41) |
Since in this work there is no active relaxation at location 2, and
| (42) |
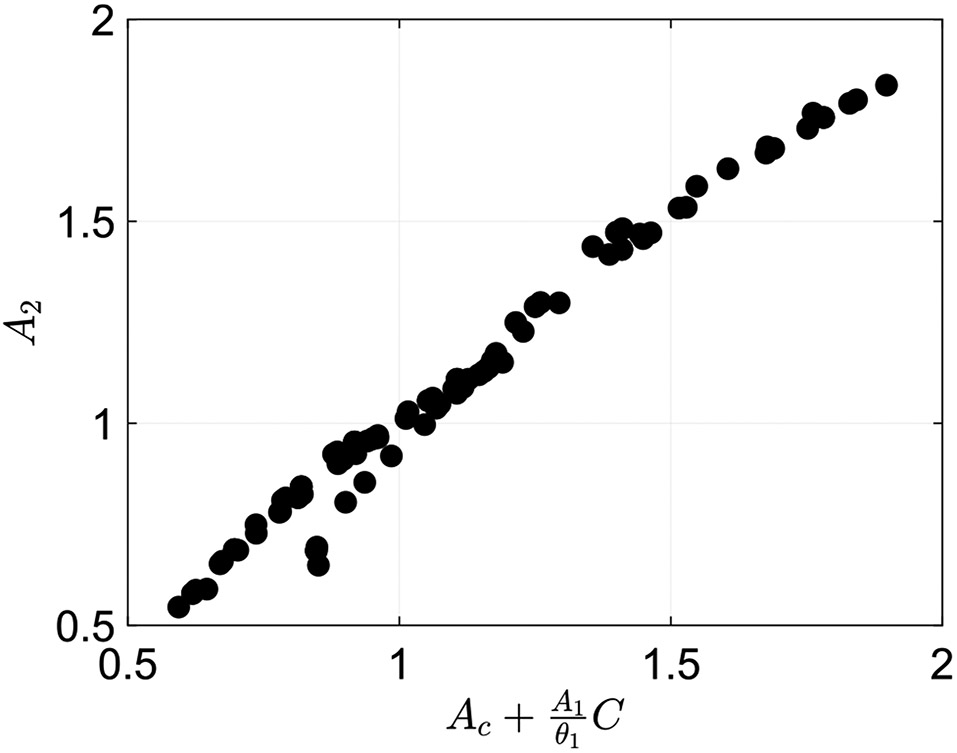
This relation tells us that in the cases classified as regime 3, the cross-sectional area at the location of the contraction is the same order as the area upstream, yet is still smaller. Note that we verified this relation by plotting as a function of for the cases classified as regime 3, as presented in Fig. 10. As this figure shows, the data formed an approximate line of slope 1, which implies that there is almost an exact correlation between the two. This does not hold for cases classified as peristaltic regimes 1 and 2.
Fig. 10.
Plot of the actual cross-sectional area at location 2 as a function of the calculated cross-sectional area at location 2 from Eq. (42) for cases classified as peristaltic regime 3. This plot shows an approximate linear line of slope 1, meaning that the model and data match well
Contrary to peristaltic regimes 1 and 2, one of the key characteristics of peristaltic regime 3 is that the cross-sectional area at the contraction opens, allowing fluid to go through. Specifically, what sets peristaltic regime 3 apart from peristaltic regimes 1 and 2 is that as the fluid viscosity (and consequently ) increases, the friction parameter decreases. We concluded this based on simulation data. Figure 11 presents the plot in Fig. 5a with examined cases marked in blue and their corresponding values. The figure shows that as viscosity increases, the cross-sectional area of the contraction increases, which leads to a decrease in flow resistance, as also shown in Eq. 39. This observation makes physical sense. The contraction wave must travel, which cannot happen if fluid resistance distal of contraction is high. Therefore, while increasing fluid viscosity increases fluid resistance distal of contraction, the contraction compensates for that by opening, allowing fluid to flow upstream such that friction is reduced.
Fig. 11.
Plot of the friction parameter as a function of with five highlighted cases with the same and and changing . The value of in each case is written on the plot. The plot shows how in peristaltic regimes 3, friction parameter decreases as fluid viscosity parameter increases
4.1.3. Transition between peristaltic regimes 2 and 3
As previously discussed, understanding the transition process between peristaltic regimes and its causes can help in better understanding what causes a swallow to move from an effective to an ineffective region. In the previous sections, we revealed analytical relations between cross-sectional area parameters at different locations on the elastic tube. The expression in Eq. (34) holds for peristaltic regimes 1 and 2 but not 3, whereas the expression in Eq. (42) holds only for peristaltic regime 3. Therefore, we concluded that we can use these analytical expressions to differentiate between peristaltic regimes 1 and 2 to peristaltic regime 3 quantitatively rather than qualitatively. Moreover, these relations provided reasoning beyond tube shape to the peristaltic regime classifications. In this section, we utilize these in order to explain the physical significance of the transition point and what causes the transition to occur. We derive mathematical expressions to identify and quantify the transition point between peristaltic regimes 2 and 3. Lastly, we identify the leading parameters that cause the transition between the two peristaltic regimes.
The key physical characteristics of peristaltic regimes 1 and 2 are tight contraction and that the friction parameter grows with the increase in fluid viscosity parameter . On the other hand, peristaltic regime 3 is characterized by opening of the contraction area and that the friction parameter decreases with an increase in fluid viscosity parameter. Therefore, the transition between peristaltic regime 2 and 3 must be the region in which the contraction area starts opening and the friction parameter is maximum. Cases classified as peristaltic regime 2, right before the transition, have high fluid resistance parameter but the contraction remains tight (i.e. with a small opening). As the fluid resistance keeps increasing, fluid starts accumulating distal of contraction (at location 1), until the resistance is so high, forcing the cross-sectional area at the contraction to open and allow fluid to go through. This opening reduces the overall friction to the flow, leading to regime 3 geometry.
Since peristaltic regimes 2 and 3 have different analytical expressions associated with them (Eqs. 34 and 42), respectively), the transition is identified at the point where both expressions hold. To find this expression, rearrange Eq. (34) such that
| (43) |
then plug into Eq. (42) to obtain
| (44) |
Equation (44) represents the mathematical expression that only holds for contractile cycles in the transition between regimes 2 and 3. Since is a constant, the expression reveals that during transition, the cross-sectional area at location 2 is proportional to the cross-sectional area at location .
Knowing the maximum friction value before the transition helps us to quantify the point of transition between peristaltic regime 2 to 3. Moreover, it allows us to identify the leading parameters that control the transition. The transition occurs at point on the graphs in Fig. 6, where is the maximum friction value before transitioning into peristaltic regime 3. The larger the value of , the more resistance the contraction can withstand before opening and transitioning into regime 3. We can determine the location of this point on the graphs by finding the intersection of the lines in Eqs. (35) and (39) as shown in Fig. 12, such that and
| (45) |
Fig. 12.
Plot of the friction parameter as a function of with the two lines in Eqs. (35) and (39)
Equation (45) reveals that the point of transition between peristaltic regime 2 to 3 depends on the contraction strength. In addition, it tells us that the smaller the value of , the larger the resistance needs to be in order to open the contraction.
Notice from Fig. 6a that the transition into peristaltic regime 3 occurs at a higher value of when is small. In other words, the smaller is in regimes 1 and 2, the higher the resistance needs to be in order to open the area at location . Since in regimes 1 and 2, this observation aligns with the analytical expression in Eq. (45), where smaller contraction strength corresponds with larger . The smaller the value of , the tighter the contraction, and therefore, the harder it is to open. Hence, for a tighter contraction, more pressure needs to build up in the tube (caused by greater resistance to flow) in order for it to open. Consequently, a higher resistance parameter value is needed at transition.
Figure 6 provides a view into the physical processes and factors that go into the transition between the peristaltic regimes. It clearly displays the relation between fluid viscosity, contraction strength, and the role they play in the transition process. In peristaltic regimes 1 and 2, goes from 0 to some critical value where the transition occurs. This increase in fluid resistance is a result of the increase in fluid viscosity. In this regime, the contraction remains tight and effective in pushing the fluid forward. At the critical point, marked in Fig. 12, the pressure build up due to high fluid resistance through the contraction is so high that the contraction is forced to open. This allows the fluid to go through the contraction more easily. The opening of the contraction (geometric change) decreases the friction parameter.
Wall stiffness also plays a role in the transition. As tube wall gets stiffer, it requires higher pressure to start opening the contraction area. High pressure builds up at the contraction if the fluid viscosity is greater. Thus, the parameter is greater for stiffer walls at the point of transition to regime 3. This is elaborated next.
Figure 13 displays three vs plots, each highlighting a different set of data in blue. Figure 13a highlights contractile cycle simulations with wall stiffness and contraction strength , and changing fluid viscosity parameter, . Figure 13b shows similar results but for and Fig. 13c for . The value of in each simulation is written next to the data point. Note that, since the value of is the same for all three sets, the value of the friction parameter at the transition is the same, regardless of wall stiffness. This is not surprising since captures the balance between passive elastic and viscous forces (see Eq. 26). Consequently, when stiffness is low, the transition occurs at a much lower value of fluid viscosity parameter than when the wall stiffness is high .
Fig. 13.
Three plots of the friction parameter as a function of , each with a different set of highlighted simulations. Each set shares contractile cycle simulations with the same contraction strength and wall stiffness, with changing fluid resistance parameter
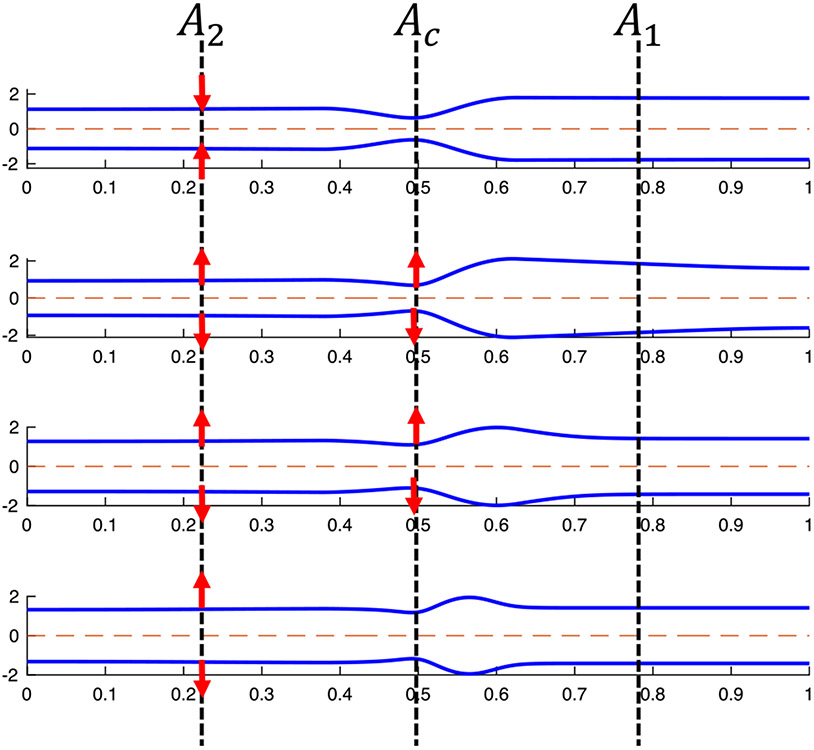
In addition to expressing the transition from peristaltic regime 2 to peristaltic regime 3 analytically, we examine the shape of the tube during this process, which gives us additional insight into its physical progression. Figure 14 presents the tube geometry of four different contractile cycles at one snapshot in time, taken when the peristaltic contraction wave is located at the center of the tube. The four cases are in consecutive order on the vs. plot in Fig. 6a. The tube shape at the top of the figure is classified as regime 2, the bottom shape as regime 3, and the middle two are transition cases. As the figure shows, the transition begins when the cross-sectional area starts decreasing until it reaches the same order of magnitude as the cross-sectional area at the contraction . At this point, as the figure shows, fluid has accumulated distal to the contraction. Beyond transition, the cross-sectional area at the contraction starts growing, allowing more fluid to go upstream and consequently increasing the cross-sectional area at location 2. Lastly, in the tube geometry at the bottom, the contraction is fully open, presenting regime 3 geometry.
Fig. 14.
Tube geometry at transition
Note that the contraction opens in regime 2 at the end of the contractile cycle (after contraction wave traveled 80% of the tube length). Hence, cases originally classified as peristaltic regime 2 transition into regime 3. We can explain this observation based on the mechanics revealed in this section. When the volume in the bag at the distal end of the tube exceeds its capacity and the pressure in that segment increases until sufficiently high, it causes the contraction to open to allow retrograde flow. Therefore, in our work, we identified regimes at 50% of the tube length. In regime 1, opening of the contraction is not needed since sufficient retrograde flow takes place throughout the cycle.
4.2. Application to clinical data
In order to examine the application of this study to clinical practice, we use FLIP readings of 56 subjects, including both controls and patients, to calculate (Eq. 30) and (Eq. 27). The FLIP data were collected between November 2012 and October 2018 at the Esophageal Center of Northwestern, using a 16-cm FLIP (EndoFLIP® EF-322N; Medtronic, Inc, Shoreview, MN) (Acharya et al. 2020; Carlson et al. 2021). The patient population includes randomly chosen achalasia (n = 9), GERD (n = 13), systemic sclerosis (SSc; n = 5), and eosinophilic esophagitis (EoE; n = 5) patients. In addition, 24, randomly chosen, asymptomatic volunteers (controls) are included. Additional details on the clinical procedure and cohort selection are available in Acharya et al. (2020), Carlson et al. (2021), Lin et al. (2013) and Carlson et al. (2016). From each FLIP reading, we can extract several peristaltic cycles for each subject (Carlson et al. 2015). A single contractile cycle is identified by a transient decrease in the luminal diameter of at least 3 cm and distinct forward-moving contractions covering at least 6cm along the esophagus length (Acharya et al. 2020; Carlson et al. 2021). Since the analysis requires a clear peristaltic contraction wave, non-peristalsis subjects are eliminated. A lack of peristalsis is common among some esophageal disorders such as achalasia (Aziz et al. 2016; Roman et al. 2011; Adler and Romero 2001). Therefore, a total of 103 different FLIP distention-induced contractions are used in this work, extracted from 34 subjects.
Cross-sectional area values at locations 1, 2, and are direct FLIP readings, and , , and are calculated as proposed by Halder et al. (2021). These values are taken at a snapshot in time where the traveling contraction wave has traveled about half of the esophagus length, as shown in Fig. 15. The fluid properties are density kg/m3 and viscosity Pa · s (Kou et al. 2015). The wave speed cm/s as obtained by calculating the distance traveled by contraction wave over time (Kou et al. 2015; Li et al. 1994). Lastly, the ratio is calculated using the tube law relation in Eq. (5) (Halder et al. 2021). Given this information, the parameters of interest is calculated. Note that is calculated based on its definition in Eq. (30). However, the non-dimensional stiffness parameter defined in Eq. (26) tends to zero for all clinical cases and therefore, the approximate form of presented in Eq. (32) holds for clinical data.
Fig. 15.
Esophagus wall shape of a control at a single time instance (Acharya et al. 2020; Lin et al. 2013; Carlson et al. 2016). The cross sectional data were captures using a FLIP device
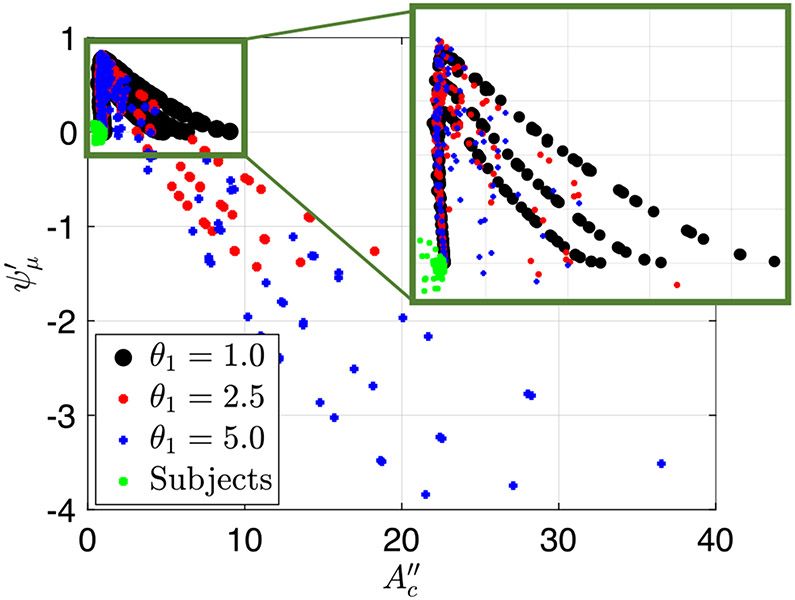
Figure 16 presents a plot of the friction parameter as a function of for both simulation and clinical FLIP contractile cycles. Each point on the plot represents a single peristaltic contraction. As the figure shows, all the clinical cases lay on the vertical line, implying that they are in the regime 1 and 2 region. The outliers, which are clinical cases that lay left of the vertical line, all have small which makes them more error prone. Therefore, although they are slightly off of the vertical line, they display regime 1 and 2 geometry, and can be classified as such. Moreover, note that some of the clinical cases have relatively large , such that the throat diameter looks big and can be mistaken for peristaltic regime 3. However, through this quantitative method of determining the regime, these cases are classified as regimes 1 and 2.
Fig. 16.
The friction parameter plotted as a function of the non-dimensional contraction area parameter for both simulation and clinical FLIP contractile cycles
Based mostly on qualitative observation of the esophagus shape and quantitative values of , one can speculate that the clinical distention-induced peristalsis considered in this study display regime 1. This is not surprising since the esophagus wall is stiff and the fluid used in FLIP testing has low viscosity (saline), which are two characteristics of regime 1. However, regime 2 characteristics have been observed by practitioners during data collection procedures, which has not been formally reported. In some scenarios, one actually feels the esophageal contraction pulling the catheter into the stomach. This work proposes an explanation for this observation. It is because the contraction is tight and fast, so that the retrograde flow is limited. In extreme cases, where peristalsis is pathologically strong, it can pull the FLIP bag out of the physician’s hand. In this case, the contraction is so strong that it will not convert to regime 3 at the end of the contractile cycle. Instead, the contraction remains tight, pulling the FLIP bag towards the stomach instead of allowing retrograde flow.
No clinical case lies in the regime 3 region. Therefore, we concluded that although peristaltic flows have three regimes of pumping in general, physiological flows display only regimes 1 and 2. An interesting question is, why are physiological cases so far removed from regime 3? Two hypotheses are worth considering. The first hypothesis concerns the evolutionary disadvantage of peristaltic regime 3. Regime 3 implies hardship of transport due to the fact that the contraction opens and is no longer effective in pushing fluid forward. Animals cannot survive without an effective peristalsis which transports swallowed material from the mouth to the stomach. Therefore, peristaltic regime 3 does not align with the healthy function and core purpose of the esophagus, which is to transport swallowed material through a peristaltic contraction of the muscle.
The second hypothesis concerns fluid properties. As discussed in Sect. 4.1.3, moving into the regime 3 region requires an increase in fluid viscosity. Therefore, in order to see a physiological example in regime 3 range, one needs to consider more viscous fluids. However, what fluid viscosity causes a healthy control to tip into regime 3? To answer this question, we first obtained that for clinical data , , and . Figure 13b follows cases with similar and values. As the figure shows, given these values of and , the transition into peristaltic regime 3 takes place at . Based on the definition of , the kinematic viscosity of the fluid needs to be about 25,000 – 50,000 times that of water (i.e. 25,000 – 50,000 cP) for regime 3 to occur. The exact viscosity of chewed material is hard to determine due to the large variety of mastication and eating patterns. Therefore, studies often use texture of a puree or pudding (Matsuo et al. 2013; Glassburn and Deem 1998; Clavé et al. 2008; Nicosia 2012; CLAVé et al. 2006; Repin et al. 2018), which have kinematic viscosity of cP (Clavé et al. 2008; Qasem et al. 2017; Lim and Narsimhan 2006; Kay et al. 2017); much lower than 25,000 – 50,000 cP (Nicosia 2012; Repin et al. 2018; Lim and Narsimhan 2006). Hence, it is highly unlikely to obtain peristaltic regime 3 in subjects who display intact peristalsis. Nevertheless, examining clinical data collected using a higher viscosity fluids or solid food might help test this analysis further in future studies. In case regime 3 is observed for solid foods, it could act as an early indicator for insufficient peristalsis.
Note that some disease and disorder groups such as achalasia involve lack of esophageal peristalsis to some extent (Aziz et al. 2016; Roman et al. 2011; Adler and Romero 2001). Since obtaining (Eq. 30) and (Eq. 27) requires a visible traveling peristaltic contraction, subjects without an identified contraction are classified as non-peristaltic cases and therefore are not included in the subject cohort above. Recall that regime 3 is characterized by opening of the contraction. Hence, it is plausible that in some cases, the peristaltic contraction is so weak that it opens easily, which appear in FLIP reading as nonexistent. As Fig. 6 suggests, distention-induced peristalsis with contraction strength larger than about 0.7 – 0.8 always result in peristaltic regime 3 geometry, independent of the fluid resistance or wall parameters. The largest value of the contraction strength recorded in peristaltic cases is 0.5.
5. Concluding remarks
Acharya et al. (2021) examined the different elements of peristaltic flow by simulating a 1D peristaltic flow through an elastic tube closed on both ends. They qualitatively identified three modes of peristaltic geometries presented in Fig. 1 (Acharya et al. 2021). In this work, we aimed to take (Acharya et al. 2021) results a step forward and quantify the different peristaltic geometries. Doing so allows us to differentiate the peristaltic regimes from one another and identify the parameters that control the flow. More importantly, identifying and characterizing the transition from regime 2 to 3 can provide insightful clinical information about the process of transitioning from an effective to an ineffective distention-induced peristalsis.
Moreover, in this work, we extended (Acharya et al. 2021) 1D model by introducing a relaxation parameter to the flow. The relaxation was implemented distal to the contraction and traveled sinusoidally with the contraction wave. This parameter provides a more realistic representation of flow inside an esophagus. The simulation results with relaxation displayed slightly different shapes than the ones identified by Acharya et al. (2021) and therefore, the previously used qualitative classification of peristaltic regime type, based on the tube’s geometry did not hold. Hence, a qualitative method was needed.
As an approximation, we chose to study a simplified, reduced-order model of our dynamic problem by looking at the solution from the frame of reference of the traveling contraction wave at a specific point in time. In this frame, we derived a non-dimensional friction parameter (Eq. 30) and two scalings for the cross-sectional area of the contraction and (Eq. 27), which were plotted in two separate Figs. 5 and 6. These plots helped us to extract the following conclusions. First, in peristaltic regimes 1 (Fig. 1a) and 2 (Fig. 1b), the inertia effects are very small such that the dynamic solution is very close to the static solution. In the regimes 1 and 2 region, the peristaltic contraction is tight and is mostly effective in pushing fluid forward. Because the contraction does not open, an increase in fluid viscosity leads to an increase in fluid resistance. Second, for peristaltic regime 3 (Fig. 1c), the relation between fluid viscosity and flow resistance is opposite. The results show that in regime 3, the contraction is open, meaning that any attempt of increasing flow friction by increasing viscosity is countered by an increase in the cross-sectional area of the contraction, which results in decrease of flow resistance. In regime 3, the contraction opens such that fluid flow easily across the contraction.
Lastly, we concluded that the transition process is identified as the region in which the characteristics of both peristaltic regimes 2 and 3 hold, and it can be determined quantitatively based on a critical friction value. Cases classified as peristaltic regime 2, right before the transition, have high fluid resistance parameter but the contraction remains tight. At this stage, fluid has accumulated distal to the contraction and friction forces are high. When the fluid resistance is too high, such that the contraction wave cannot continue moving forward, the contraction cross-sectional area opens, allowing more fluid to go through it, which eventually results in regime 3 configuration. We also observed that although the transition point is determined by a variety of factors, it can be quantified by solely using the peristaltic contraction strength, such that a tighter contraction results in a later transition.
In the last step of the study, we applied the proposed metric to clinical FLIP data of both control and patient populations which exhibit peristalsis. It was found that all clinical readings fall into the regime 1 and 2 region, which implies that they all have sufficient peristaltic contraction strength. Therefore, we concluded that physiological flows fall in peristaltic regimes 1 and 2. The reason for this is unclear. However, we proposed two possible hypotheses which may explain this observation. The first hypothesis concerns the evolutionally disadvantage of regime 3, since it implies insufficient ability to push food. The second hypothesis concerns fluid viscosity. FLIP data are based on aline solution. Perhaps regime 3 would be observed with solid or semi-solid food. Given the reported values of esophagus stiffness and peristaltic contraction strength, the viscosity of the fluid would need to be about 25,000–50,000 times the viscosity of water in order to observe regime 3. We also note that the subject population only included individuals who exhibit clear peristalsis and excluded non-peristalsis individuals. Lack of peristalsis is a common trait among disease and disorder groups such as achalasia (Aziz et al. 2016; Roman et al. 2011; Adler and Romero 2001). Therefore, it remains unclear whether non-peristalsis individuals fall within the regime 3 classification. This aspect is left unanswered in this study and should be addressed in future work. If non-peristalsis individuals in fact exhibit regime 3 configuration, the proposed method could be investigated as a potential diagnostic tool which differentiates between healthy and unhealthy swallows.
Funding
This work was funded by the by Public Health Service Grants R01-DK079902 and P01-DK117824, and National Science Foundation Grants OAC 1450374 and OAC 1931372. Their support is greatly appreciated.
List of symbols
Tube cross-sectional area (−)
Cross-sectional area distal of contraction (−)
Non-dimensional cross-sectional area distal of contraction ()
Cross-sectional area proximal of contraction (−)
Non-dimensional cross-sectional area proximal of contraction ()
Second non-dimensional cross-sectional area proximal of contraction ()
Cross-sectional area at the contraction (−)
Non-dimensional cross-sectional area at the contraction ()
Second non-dimensional cross-sectional area at the contraction ()
Third non-dimensional cross-sectional area at the contraction ()
Undeformed reference area (or rest area) (−)
Speed of the peristaltic wave (−)
Friction due to drag ()
Tube stiffness (−)
Tube length (−)
Pressure inside the tube (−)
Non-dimensional pressure inside the tube (−)
Flow rate (−)
Non-dimensional fluid velocity (averaged at each cross-sectional area) (−)
Fluid velocity (averaged at each cross-sectional area) (−)
Width of peristaltic wave (−)
Width of the wave connecting between the contraction and relaxation (−)
Non-dimensional tube cross-sectional area (−)
Constant area that depends on the volume of the bag () (−)
Dimensionless strength of viscous effects (inverse of Reynolds number) ()
Activation function (−)
Relaxation strength distal of contraction (−)
Relaxation strength proximal of contraction (−)
Peristaltic contraction strength at the contraction (−)
Fluid viscosity (−)
Stiffness parameter of the reduced-order model ()
Fluid density (−)
Dimensionless rigidity of the elastic tube (inverse of Cauchy number) ()
Friction parameter ()
Footnotes
Conflict of interest Peter J. Kahrilas, and John E. Pandolfino hold shared intellectual property rights and ownership surrounding FLIP panometry systems, methods, and apparatus with Medtronic Inc. Dustin A. Carlson: Medtronic (Speaking, Consulting). Wenjun Kou: Crospon, Inc. (Consulting). Peter J. Kahrilas: Ironwood (Consulting), Reckitt (Consulting), Johnson & Johnson (Consulting). John E. Pandolfino: Crospon, Inc (stock options), Given Imaging (Consultant, Grant, Speaking), Sandhill Scientific (Consulting, Speaking), Takeda (Speaking), Astra Zeneca (Speaking), Medtronic (Speaking, Consulting), Torax (Speaking, Consulting), Ironwood (Consulting), Impleo (Grant). G. Elisha, S. Halder, S. Acharya, N.A. Patankar: None
References
- Abo-Elkhair RE, Bhatti MM, Mekheimer KS (2021) Magnetic force effects on peristaltic transport of hybrid bio-nanofluid (aucu nanoparticles) with moderate Reynolds number: an expanding horizon. Int Commun Heat Mass Transf 123:105228. 10.1016/j.icheatmasstransfer.2021.105228 [DOI] [Google Scholar]
- Abrahao L Jr, Bhargava V, Babaei A, Ho A, Mittal RK (2011) Swallow induces a peristaltic wave of distension that marches in front of the peristaltic wave of contraction. Neurogastroenterol Motil 23(3):e110–201. 10.1111/j.1365-2982.2010.01624.x [DOI] [PubMed] [Google Scholar]
- Acharya S, Halder S, Carlson DA, Kou W, Kahrilas PJ, Pandolfino JE, Patankar NA (2020) Assessment of esophageal body peristaltic work using functional lumen imaging probe panometry. Am J Physiol Gastrointest Liver Physiol. 10.1152/ajpgi.00324.2020 [DOI] [PMC free article] [PubMed] [Google Scholar]
- Acharya S, Kou W, Halder S, Carlson DA, Kahrilas PJ, Pandolfino JE, Patankar NA (2021) Pumping patterns and work done during peristalsis in finite-length elastic tubes. J Biomech Eng. 10.1115/1.4050284 [DOI] [PMC free article] [PubMed] [Google Scholar]
- Adler DG, Romero Y (2001) Primary esophageal motility disorders. Mayo Clin Proc 76(2):195–200. 10.4065/76.2.195 [DOI] [PubMed] [Google Scholar]
- Aziz Q, Fass R, Gyawali CP, Miwa H, Pandolfino JE, Zerbib F (2016) Esophageal disorders. Gastroenterology 150(6):1368–1379. 10.1053/j.gastro.2016.02.012 [DOI] [PubMed] [Google Scholar]
- Bhatti MM, Abdelsalam Sara I (2021) Bio-inspired peristaltic propulsion of hybrid nanofluid flow with tantalum (ta) and gold (au) nanoparticles under magnetic effects. Waves Random Complex Med. 10.1080/17455030.2021.1998728 [DOI] [Google Scholar]
- Bringley TT, Childress S, Vandenberghe N, Zhang J (2008) An experimental investigation and a simple model of a valveless pump. Phys Fluids 20(3):033602. 10.1063/1.2890790 [DOI] [Google Scholar]
- Burns JC, Parkes T (1967) Peristaltic motion. J Fluid Mech 29(4):731–743. 10.1017/S0022112067001156 [DOI] [Google Scholar]
- Carlson DA, Lin Z, Kahrilas PJ, Sternbach J, Donnan EN, Friesen L, Listernick Z, Mogni B, Pandolfino JE (2015) The functional lumen imaging probe detects esophageal contractility not observed with manometry in patients with achalasia. Gastroenterology 149(7):1742–1751. 10.1053/j.gastro.2015.08.005 [DOI] [PMC free article] [PubMed] [Google Scholar]
- Carlson DA, Kahrilas PJ, Lin Z, Hirano I, Gonsalves N, Listernick Z, Ritter K, Tye M, Ponds FA, Wong I, Pandolfino JE (2016) Evaluation of esophageal motility utilizing the functional lumen imaging probe. Am J Gastroenterol 111(12):1726–1735. 10.1038/ajg.2016.454 [DOI] [PMC free article] [PubMed] [Google Scholar]
- Carlson DA, Gyawali CP, Khan A, Yadlapati CJ, Chokshi RV, Clarke JO, Garza JM, Jain AS, Katz P, Konda V, Lynch K, Schnoll-Sussman FH, Spechler SJ, Vela MF, Prescott JE, Baumann AJ, Donnan EN, Kou Wenjun, Kahrilas PJ, Pandolfino JE (2021) Classifying esophageal motility by flip panometry: a study of 722 subjects with manometry. Am J Gastroenterol. 10.14309/ajg.0000000000001532 [DOI] [PMC free article] [PubMed] [Google Scholar]
- Clav é P, DeKraa M, Arreola V, Girvent M, Farré R, Palomera E, Serra-Prat M (2006) The effect of bolus viscosity on swallowing function in neurogenic dysphagia. Aliment Pharmacol Therap 24(9):1385–1394. 10.1007/PL00009575 [DOI] [PubMed] [Google Scholar]
- Clavé P, Arreola V, Romea M, Medina L, Palomera E, Serra-Prat M (2008) Accuracy of the volume-viscosity swallow test for clinical screening of oropharyngeal dysphagia and aspiration. Clin Nutr 27(6):806–815. 10.1016/j.clnu.2008.06.011 [DOI] [PubMed] [Google Scholar]
- Crist J, Gidda JS, Goyal RK (1984) Intramural mechanism of esophageal peristalsis: roles of cholinergic and noncholinergic nerves. Proc Natl Acad Sci USA 81(11):3595–3599. 10.1073/pnas.81.11.3595 [DOI] [PMC free article] [PubMed] [Google Scholar]
- Fung YC, Yih CS (1968) Peristaltic transport. J Appl Mech 35(4):669–675. 10.1115/1.3601290 [DOI] [Google Scholar]
- Glassburn DL, Deem JF (1998) Thickener viscosity in dysphagia management: variability among speech-language pathologists. Dysphagia 13(4):218–222. 10.1007/PL00009575 [DOI] [PubMed] [Google Scholar]
- Goyal RK, Chaudhury A (2008) Physiology of normal esophageal motility. J Clin Gastroenterol 42(5):610–619. 10.1097/MCG.0b013e31816b444d [DOI] [PMC free article] [PubMed] [Google Scholar]
- Sourav H, Shashank A, Wenjun K, Kahrilas Peter J, Pandolfino John E, Patankar Neelesh A (2021) Mechanics informed fluoroscopy of esophageal transport. Biomech Model Mechanobiol. 10.1007/s10237 [DOI] [PMC free article] [PubMed] [Google Scholar]
- Jaffrin MY, Shapiro AH (1971) Peristaltic pumping. Annu Rev Fluid Mech 3(1):13–37. 10.1146/annurev.fl.03.010171.000305 [DOI] [Google Scholar]
- Jain AS, Carlson DA, Triggs J, Tye M, Kou W, Campagna R, Hungness E, Kim D, Kahrilas PJ, Pandolfino JE (2019) Esophagogastric junction distensibility on functional lumen imaging probe topography predicts treatment response in achalasia–anatomy matters. Am J Gastroenterol 114(9):1455–1463. 10.14309/ajg.0000000000000137 [DOI] [PMC free article] [PubMed] [Google Scholar]
- Kay BA, Trigatti K, MacNeil MB, Klingel SL, Repin N, Douglas Goff H, Wright AJ, Duncan AM (2017) Pudding products enriched with yellow mustard mucilage, fenugreek gum or flaxseed mucilage and matched for simulated intestinal viscosity significantly reduce postprandial peak glucose and insulin in adults at risk for type 2 diabetes. J Funct Foods 37:603–611. 10.1016/j.jff.2017.08.017 [DOI] [Google Scholar]
- Kou W, Pandolfino JE, Kahrilas PJ, Patankar NA (2015) Simulation studies of circular muscle contraction, longitudinal muscle shortening, and their coordination in esophageal transport. Am J Physiol Gastrointest Liver Physiol 309(4):G238–G247. 10.1152/ajpgi.00058.2015 [DOI] [PMC free article] [PubMed] [Google Scholar]
- Kwiatek MA, Hirano I, Kahrilas PJ, Rothe J, Luger D, Pandolfino JE (2011) Mechanical properties of the esophagus in eosinophilic esophagitis. Gastroenterology 140(1):82–90. 10.1053/j.gastro.2010.09.037 [DOI] [PMC free article] [PubMed] [Google Scholar]
- Latham TW (1966) Fluid motions in a peristaltic pump. Ph.D, thesis, Massachusetts Institute of Technology [Google Scholar]
- Li M, Brasseur JG, Dodds WJ (1994) Analyses of normal and abnormal esophageal transport using computer simulations. Am J Physiol Gastroint Liver Physiol 266(4):525–543. 10.1152/ajpgi.1994.266.4.G525 [DOI] [PubMed] [Google Scholar]
- Lim HS, Narsimhan G (2006) Pasting and rheological behavior of soy protein-based pudding. Food Sci Technol 39(4):344–350. 10.1016/j.lwt.2005.02.016 [DOI] [Google Scholar]
- Lin Z, Kahrilas PJ, Xiao Y, Nicodeme F, Gonsalves N, Hirano I, Pandolfino JE (2013) Functional luminal imaging probe topography: an improved method for characterizing esophageal distensibility in eosinophilic esophagitis. Ther Adv Gastroenterol 6(2):97–107. 10.1177/1756283X12470017 [DOI] [PMC free article] [PubMed] [Google Scholar]
- Manopoulos CG, Mathioulakis DS, Tsangaris SG (2006) One-dimensional model of valveless pumping in a closed loop and a numerical solution. Phys Fluids 18(1):017106. 10.1063/1.2165780 [DOI] [Google Scholar]
- Matsuo K, Kawase S, Wakimoto N, Iwatani K, Masuda Y, Ogasawara T (2013) Effect of viscosity on food transport and swallow initiation during eating of two-phase food in normal young adults: a pilot study. Dysphagia 28(1):63–68. 10.1007/s00455-012-9413-1 [DOI] [PubMed] [Google Scholar]
- Mittal RK (2016) Regulation and dysregulation of esophageal peristalsis by the integrated function of circular and longitudinal muscle layers in health and disease. Am J Physiol Gastroint Liver Physiol 311(3):G431–G443. 10.1152/ajpgi.00182.2016 [DOI] [PMC free article] [PubMed] [Google Scholar]
- Nicosia MA (2012) Theoretical estimation of shear rate during the oral phase of swallowing: effect of partial slip. J Texture Stud 44(2):132–139. 10.1111/jtxs.12005 [DOI] [Google Scholar]
- Ottesen JT (2003) Valveless pumping in a fluid-filled closed elastic tube-system: one-dimensional theory with experimental validation. J Math Biol 46(4):309–332. 10.1007/s00285-002-0179-1 [DOI] [PubMed] [Google Scholar]
- Qasem AAA, Alamri MS, Mohamed AA, Hussain S, Mahmood K, Ibraheem MA (2017) High soluble-fiber pudding: formulation, processing, texture and sensory properties. J Food Process Preserv 41(3):e12931. 10.1111/jfpp.12931 [DOI] [Google Scholar]
- Regan J, Walshe M, Rommel N, Tack J, McMahon BP (2012) New measures of upper esophageal sphincter distensibility and opening patterns during swallowing in healthy subjects using EndoFLIP®. Neurogastroenterol Motil 25(1):e25–e34. 10.1111/nmo.12041 [DOI] [PubMed] [Google Scholar]
- Repin N, Cui SW, Goff HD (2018) Rheological behavior of dietary fibre in simulated small intestinal conditions. Food Hydrocoll 76:216–225. 10.1016/j.foodhyd.2016.10.033 [DOI] [Google Scholar]
- Roman S, Lin Z, Kwiatek MA, Pandolfino JE, Kahrilas PJ (2011) Weak peristalsis in esophageal pressure topography: classification and association with dysphagia. Am J Gastroenterol 106(6):349–356. 10.1038/ajg.2010.384 [DOI] [PMC free article] [PubMed] [Google Scholar]
- Takagi D, Balmforth NJ (2011) Peristaltic pumping of viscous fluid in an elastic tube. J Fluid Mech 672:196–218. 10.1017/s0022112010005914 [DOI] [Google Scholar]
- Wang X, Fullana J-M, Lagrée P-Y (2014) Verification and comparison of four numerical schemes for a 1d viscoelastic blood flow model. Comput Methods Biomech Biomed Eng 18(15):1704–1725. 10.1080/10255842.2014.948428 [DOI] [PubMed] [Google Scholar]
- Whittaker RJ, Heil M, Jensen OE, Waters SL (2010) A rational derivation of a tube law from shell theory. Q J Mech Appl Math 63(4):465–496. 10.1093/qjmam/hbq020 [DOI] [Google Scholar]


