Abstract
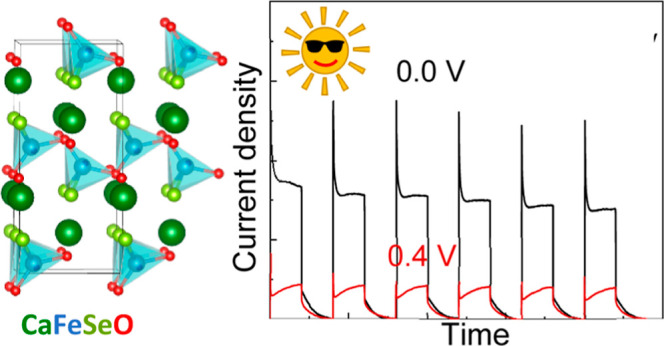
We report here the results of an experimental investigation of the electronic properties and photocurrent responses of the CaFeOQ and La2O2Fe2OQ2 phases and a computational study of the electronic structure of polar CaFeOSe. We find that both CaFeOQ (Q = S and Se) have band gaps and conduction band edge positions compatible with light-driven photocatalytic water splitting, although the oxysulfide suffers from degradation due to the oxidation of Fe2+ sites. The higher O/Q ratio in the Fe2+ coordination environment in CaFeOSe increases its stability without increasing the band gap beyond the visible range. The photocurrent CaFeOSe shows fast electron–hole separation, consistent with calculated carrier effective masses. These results suggest that these iron oxychalcogenides warrant further study to optimize their stability and morphology for photocatalytic and other photoactive applications.
Short abstract
Iron oxychalcogenides are investigated for photoactivity. Our experimental work (including photocurrent and photocatalysis measurements) is complemented by DFT studies to demonstrate the potential of iron oxychalcogenides for photoactive behavior. In particular, the polar oxyselenide CaFeSeO is experimentally shown to have fast electron−hole separation and migration, consistent with the low values calculated for electron and hole effective masses.
1. Introduction
Water splitting photocatalysis reactions have the potential to generate hydrogen in a clean and sustainable way if they can be carried out under solar irradiation. However, this imposes constraints on the magnitude of the photocatalyst’s band gap of 1.23–3.00 eV and the band edge positions [conduction band minimum (CBM) is more negative band than the reduction potential of H2O/H2 (0 V); valence band maximum (VBM) is more positive than the oxidation potential of O2/H2O (1.23 V)].1 Despite being stable and often straightforward to synthesize, many oxide photocatalysts have band gaps that are too large for excitation by visible light [e.g., TiO2 (3 eV)2 and ZnO (3.2 eV3)]. On the other hand, although sulfides typically have smaller band gaps, they are often unstable (suffering sulfur self-oxidation) in the catalysis reaction conditions.4
One strategy to design new photocatalysts for water splitting under visible light is to consider mixed-anion materials,5 and the ability to reduce the band gap by replacing some oxide ions by softer chalcogenide ions (e.g., S2– and Se2–) has motivated research into oxychalcogenides for photocatalytic applications. Several p block oxychalcogenides (e.g., Sr6Cd2Sb6O7Q10 (Q = S, Se)6,7 and LaOInS28,9) and d0 transition metal oxychalcogenides (Sm2Ti2S2O510 and Y2Ti2O5S211) have shown promising properties for photocatalytic applications. In an effort to widen the landscape of transition metal oxychalcogenides for photoactive behavior (including photocatalysis and photovoltaicity),12−14 we investigated some Fe2+ (d6) oxychalcogenides to assess their potential for photoactivity, including light-driven water splitting photocatalysis. The quaternary oxychalcogenides CaFeOQ adopt layered crystal structures with heteroleptic Fe2+ coordination environments and with their polar crystal structures (suggested to enhance electron–hole separation and photocatalytic performance),15−17 seemed promising candidates for photoelectrochemical reactions.
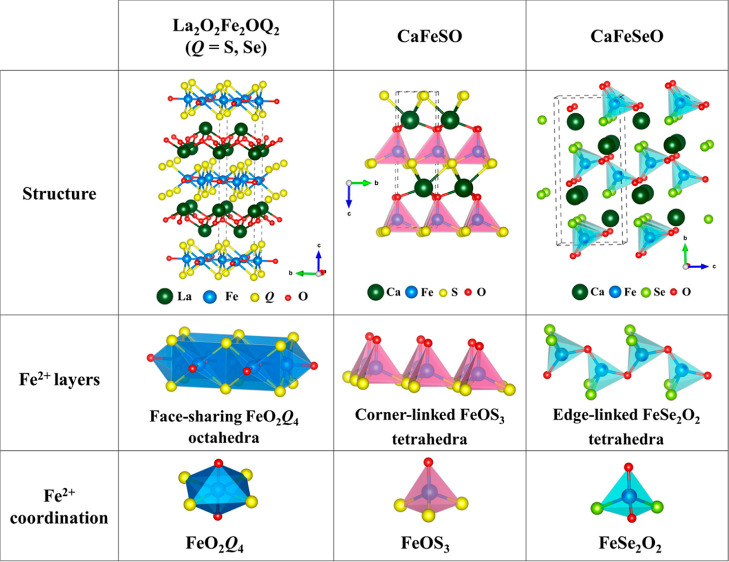
CaFeOS crystallizes in a polar, noncentrosymmetric structure of P63mc symmetry. Its layered structure consists of alternating layers of Ca2+ ions and corner-linked FeOS3 tetrahedra (Figure 1).18−20 These heteroleptic polar units are packed with their dipoles parallel to the hexagonal axis, isostructural with CaZnOS.21,22 The photovoltaic activity proposed23 for this semiconductor may suggest some promise for photocatalysis. The related oxyselenide CaFeSeO adopts a different structure, composed of puckered layers of corner-linked FeO2Se2 tetrahedra separated by layers of Ca2+ ions (Figure 1).24,25 Two polymorphs are known, which differ in the orientation of the polar FeO2Se2 units: a polar polymorph of Cmc21 symmetry with in-plane polarization25 and a nonpolar centrosymmetric polymorph of Pmcn symmetry.24 CaFeOSe is a strongly correlated semiconductor, and the nonpolar polymorph is reported to have an indirect band gap of 1.8 eV.24 Our attempts to prepare samples of the nonpolar Pmcn polymorph were successful, and so the nonpolar La2O2Fe2OQ2 phases were used for comparison. They also adopt layered crystal structures but with quite different Fe2+ coordination, consisting of face-shared FeO2Q4 octahedra with 180° Fe–O–Fe connectivity.26 These Mott-insulating phases have narrow band gaps.27 This comparison between CaFeOQ and La2O2Fe2OQ2 phases allows an investigation of the impact of the oxychalcogenide environment around Fe2+ cations on the band dispersion and therefore carrier effective masses and mobilities, which are key features for designing photoactive functional materials.
Figure 1.
Overview of the crystal structures, Fe2+ layers, and coordination environments for La2O2Fe2OQ2 and CaFeOQ (Q = S and Se) phases.
We report here the results of optical and photocurrent measurements on CaFeOQ and La2O2Fe2OQ2 phases and a density functional theory (DFT) calculation of the electronic structure of polar CaFeOSe and its charge carrier effective masses. A photocurrent response was measured for all materials, although the oxysulfide CaFeOS suffers from degradation. The photocurrent response for CaFeSeO indicated fast electron–hole separation, and recombination and transfer rates were calculated for this oxyselenide. Further studies on CaFeOQ (Q = S or Se) materials to optimize their stability would be interesting for potential photocatalytic materials.
2. Methods
La2O2Fe2OQ2 and CaFeOQ (Q = S and Se) were prepared by solid–state reactions in evacuated, sealed quartz tubes. Reagents were stored and manipulated in an argon-filled glovebox. For La2O2Fe2OQ2 (Q = S and Se) (0.5 g) analogues, La2O3, Fe, and S/Se in the molar ratio 2:2.1:2 were used, and the heat treatment consisted of heating to 400 °C (1.5 °C/min) for 12 h and then heating to 600 °C (0.5 °C/min) and then 850 °C for 12 h. For CaFeOQ (Q = S and Se) (0.5 g) analogues, a mixture of the precursors CaO, Fe, and Se/S in the molar ratio 1:1.05:1 was used. The heat treatment consisted of heating to 750 °C at a rate of 5 °C/min for 60 h before quenching the sample for the oxyselenide and heating to 950 °C (0.5 °C/min) for 24 h for the oxysulfide.
X-ray powder diffraction (XRPD) data were collected on a Bruker D8 A25 diffractometer equipped with a Lynxeye XET linear detector (Cu Kα) in Bragg–Brentano geometry at room temperature with a 1 s counting time and 0.02° step angle. Rietveld refinements using XRPD data were carried out using FullProf software.28 The background, sample height, lattice parameters, peak profiles, atomic positions, and atomic displacement parameters were refined. Vesta software29 was used to visualize the crystal structure.
The reflectance of the CaFeOQ samples was measured from 200 to 900 nm by using a PerkinElmer Lambda 650 spectrophotometer. Diffuse-reflectance UV–visible spectroscopy was used to investigate the magnitude and nature of the band gap of all four phases. After measuring the reflectance vs wavelength, the Kubelka–Munk function30 was used to analyze the reflectance data. A Tauc plot [F(R)hυ]1/n vs [hυ] (where hυ is the photon energy and n is the type of transition exponent) was used to determine the optical bandgap.31
Photocurrent measurements were performed by using an Autolab PGSTAT204 (Metrohm) electrochemical device coupled to a LED module (LED driver kit, Metrohm). The LEDs (450, 470, 505, 530, 590, and 627 nm with low spectral dispersion) were calibrated using a photodiode to determine the density of the luminous flux received by the sample. The photoelectrochemical measurements were performed in a standard three-electrode Magnetic Mount Photoelectrochemical Cell (Redox.me), including Ag/AgCl and Pt wire as reference electrodes and counter electrodes, respectively. The cell allows standardized illumination over 1 cm2 by the rear face of the working electrode. The working electrode consisted of the photocatalyst powder dispersed in PVDF (polyvinylidene fluoride) binder (in a 2:1 ratio), which was later deposited on an ITO/glass substrate (Delta Technologies Ltd.) using the drop casting technique.32 The electrolyte employed is an aqueous 0.1 M sodium sulfate (Na2SO4) solution. Mott–Schottky tests were used to determine flat band potentials.33,34 Depending on the slope of 1/C2 vs applied potential, the flat band potential Efb relative to a Ag/AgCl reference electrode or the reversible hydrogen electrode (RHE) can be estimated: ERHE = EAg/AgCl + EAg/AgCl0 + 0.059.pH; where EAg/AgCl vs SHE0 is the potential of the Ag/AgCl reference electrode with respect to the standard hydrogen electrode (SHE) at 195 mV and the pH of the used electrolyte (5.6 for 0.1 M of Na2SO4).
The electronic properties of the noncentrosymmetric CaFeOSe oxyselenide were investigated using DFT. Calculations were carried out by employing the projector-augmented-wave (PAW) method35,36 encoded in the Vienna ab initio simulation package (VASP)37 and the generalized gradient approximation (GGA) of Perdew–Burke–Ernzerhof (PBE)38 for the exchange–correlation functionals. To account for the strong electronic correlation associated with the Fe 3d states, the GGA plus on-site repulsion U (GGA + U) method was employed39 with Ueff = 4 eV in an antiferromagnetic configuration.40 A plane-wave cutoff energy of 550 eV and a threshold of self-consistent-field energy convergence of 10–6 eV were used with k̇-point meshes (13 × 4 × 8) in the irreducible Brillouin zone. It converged with residual Hellman-Feynman forces on the atoms smaller than 0.03 eV Å–1 and led to a good match with the experimental structure, i.e., within a reasonable error expected for the GGA method. The relaxed structure was used for calculations of the electronic structure and the charge carrier’s effective masses. The effmass software was used in order to deal with the spin-polarized band structure of the CaFeOSe phase.41
3. Results
Polycrystalline samples of La2O2Fe2OQ2 and CaFeOQ (Q = S and Se) were prepared, and XRPD was used to monitor synthesis reactions. Rietveld analysis (Supporting Information) confirmed the successful preparation of the four phases. Only the noncentrosymmetric, polar polymorph (Cmc21 symmetry) of CaFeSeO was prepared; attempts to prepare the nonpolar phase were not successful.
3.1. Optical Measurements
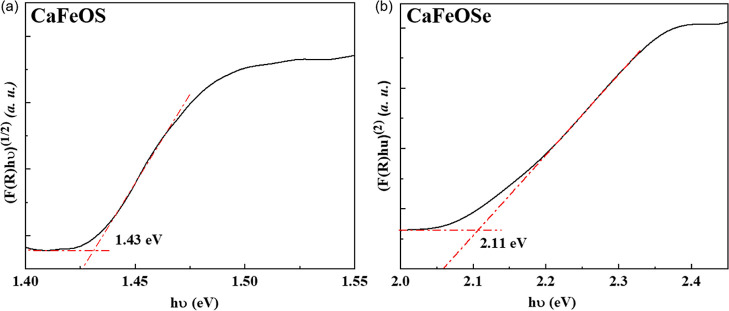
The band gaps of La2O2Fe2OQ2 (Q = S and Se) are too small to be measured optically, but reported electrical measurements suggest electronic band gaps of 0.19–0.24 eV.27 CaFeOS is reported to be an indirect bandgap semiconductor,23 while our DFT calculations (see below) indicate that the polar CaFeSeO has a direct gap. Tauc plots31 (with n = 2 and n = 1/2 for CaFeSO and CaFeSeO, respectively) from our diffuse reflectance measurements (after Kubelka–Munk analysis30) suggest optical bandgaps of 1.43(1) eV and 2.11(1) eV for CaFeOS and CaFeOSe, respectively (Figure 2). These values are consistent with the literature reports (1.1623 and 1.8 eV,24 respectively) and are within the energy range of the solar spectrum (1.23–3.1 eV).
Figure 2.
Tauc plots to determine the experimental optical bandgaps for (a) CaFeOS and (b) CaFeOSe.
In addition to the magnitude of the band gap, the band edge positions of the photoactive materials must also be consistent with the redox reactions of water. The band edge positions were estimated using an empirical method based on Mullikan electronegativities (see Supporting Information), and those for CaFeOQ (Q = S and Se) were found to be compatible with photocathodic water splitting reactions.
3.2. Mott–Schottky Tests
Mott–Schottky
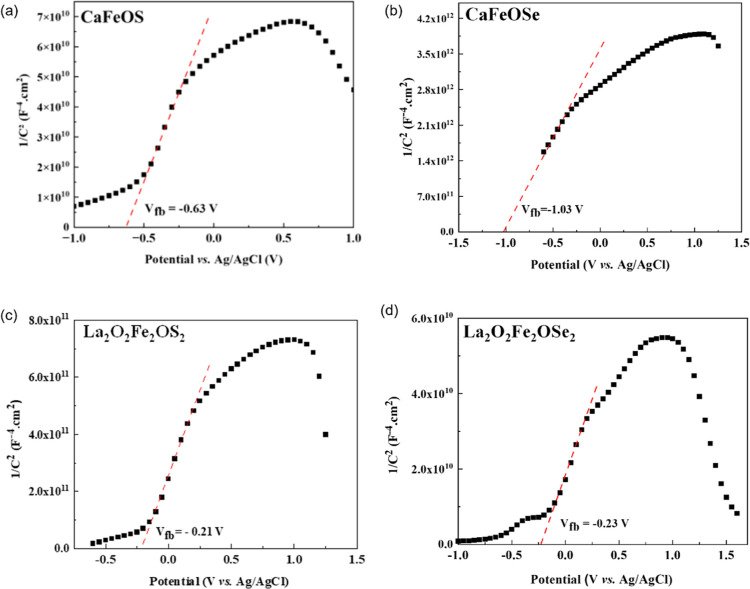
tests were performed for CaFeOQ and La2O2Fe2OQ2 (Q = S and Se) at 1 kHz, and zero bias voltage to investigate
the conduction type, carrier concentration, flat-band potential Efb, and plots are shown in Figure 3. The positive slope of  with applied potential
confirms the n-type
nature of these semiconductors. The x axis intercept
can be used to determine the flat-band potential with respect to the
RHE or a Ag/AgCl reference electrodes (Table 1). These flat-band potentials are close
to the CBM42 and are consistent with our
empirical calculations (Supporting Information) and suggest the potential of the CaFeOQ materials
for solar water splitting reactions.
Figure 3.
Mott–Schottky plot for (a) CaFeOS, (b) CaFeOSe, (c) La2O2Fe2OS2, and (d) La2O2Fe2OSe2 deposited on ITO/glass performed at 1 kHz and Vbias = 0 V.
Table 1. Flat Band Position vs Ag/AgCl and vs RHE.
| composition | flat band potential (V) vs |
|
|---|---|---|
| Ag/AgCl | RHE | |
| CaFeOS | –0.63(1) | –0.105(1) |
| CaFeOSe | –1.03(1) | –0.505(1) |
| La2O2Fe2OS2 | –0.21(1) | 0.315(1) |
| La2O2Fe2OSe2 | –0.23(1) | 0.295(1) |
3.3. Photocurrent Response
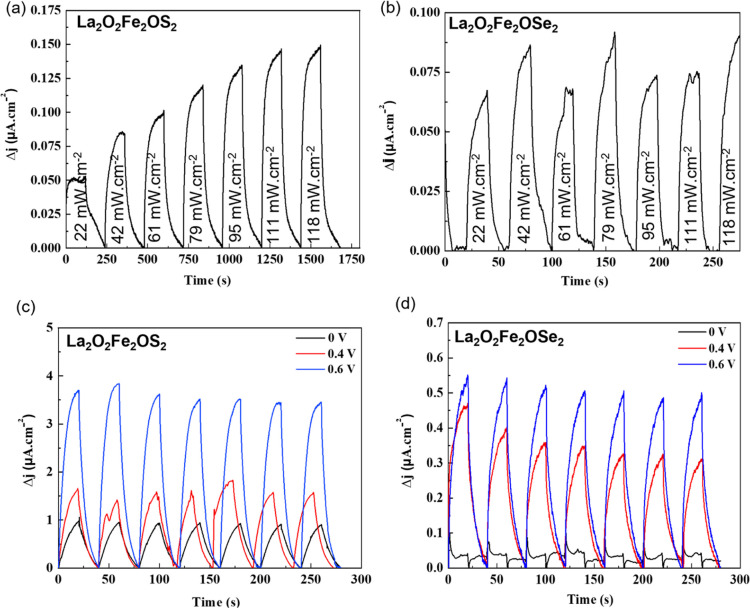
The greatest photocurrent response (Δj = jillum – jdark, where jillum and jdark represent the current density under illumination and darkness) was observed for irradiation with 450 nm light for CaFeSeO [with 470 nm light for La2O2Fe2OQ2 (see Supporting Information)], and so 450 nm light was used for on/off cycles of 20 s to measure the transient photocurrent responses (Figures 4 and 7).
Figure 4.
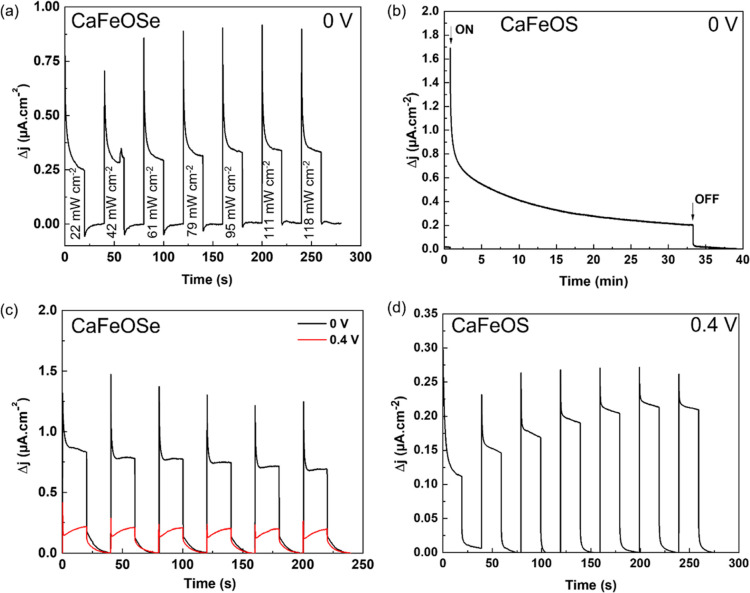
Photocurrent measurements for CaFeSeO: (a) shows transient photocurrent response under several light power densities (450 nm excitation) (Vbias = 0 V); (b) shows the variation in current density for CaFeOS (Vbias = 0 V) for >30 min exposure time to solar light excitation; (c) shows transient photocurrent response under solar illumination (100 mW cm–2) for Vbias = 0 and 0.4 V of CaFeOSe; and (d) shows transient photocurrent response under several light power densities (450 nm excitation) for CaFeSeO with Vbias = 0.4 V.
Figure 7.
Transient photocurrent response under a 450 nm excitation of (a) La2O2Fe2OS2 and (b) La2O2Fe2OSe2 and under solar illumination (100 mW cm–2) for Vbias = 0, 0.4, and 0.6 V of (c) La2O2Fe2OS2 and (d) La2O2Fe2OSe2.
CaFeSeO showed a fairly high photocurrent response (up to 0.9 μA cm–2 for a power density of 118 mW cm–2) even at Vbias = 0 V (Figure 4a). The transient photocurrent response shows a spike (charge accumulation at the surface) followed by a decay toward a stable state corresponding to the steady state where the carriers are successfully transferred without undergoing recombination. However, this stable state does not seem to be reached after 20 s of measurement. To verify this, a measurement was carried out over a longer period (Figure 4b), where we observe that this transient state gradually decreases and does not stabilize after 30 min. This evolution could indicate slow kinetics in the establishment of the stationary state, with progressive recombination of electron–hole pairs within the material or a photocorrosion of the electrode (chemical degradation at the interface of the film or progressive dissolution in the electrolyte). The first hypothesis, of slow kinetics, seems more likely because the intensity of the photocurrent remains relatively stable after several ON/OFF cycles under solar irradiation (Figure 4c). Additionally, trap states in the photoconductor can play an important role in extending the lifetime of photogenerated carriers. Thus, the long decay may be due to intrinsic defects (such as impurities, vacancies, or interstitial ions), which induce energy levels in the band gap.43,44 The recombination phenomena are quite rapid, but if the semiconductor contains traps, the establishment of the steady state can be slower with the presence of shallow traps (close to band edges) or even slower with the presence of deep traps (close to the middle of the band gap).45 For an applied bias potential of 0.4 V, the behavior evolves with a lower peak height (Figure 4d), indicating a decrease in the recombination rate.
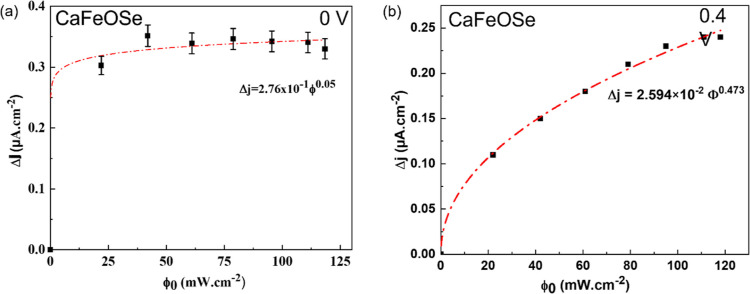
In addition, the photocurrent response of CaFeSeO was found to increase as a function of the power density of light (Figure 5). This behavior could be fitted by a classical power law.46 For Vbias = 0 V and Δj = 2.76 × 10⁻¹(2)Φ0.05(2), the low exponent from this fitting indicates that a saturation regime is quickly reached after 20 s of measurement. Thus, increased illumination power cannot effectively increase the photogain.47 (The slow recombination kinetics described above are not taken into account in this case because the steady state is not reached.) For Vbias = 0.4 V, the power law follows a more usual evolution with Δj = 2.59 × 10⁻²(2)Φ0.47(2), indicating faster detrapping with the application of a bias voltage.
Figure 5.
Evolution of the photocurrent density for CaFeOSe with the power density of light under a 450 nm excitation for (a) Vbias = 0 V and (b) Vbias = 0.4 V.
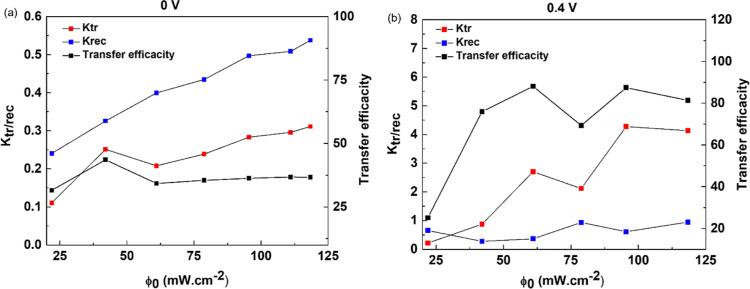
The characteristic shape of the photocurrent response observed for CaFeSeO (Figure 4a) indicates the fast separation of charge carriers (the peak results from the surface being loaded with charge carriers), followed by the system reaching an equilibrium between charge recombination and charge transfer (the decay from the spike to the plateau at steady state).48 The exponential decrease in the photocurrent from the peak to the plateau can be fitted using a model proposed by Parkinson et al.49 to give values for the transfer and recombination rate constants (Figure 6). For Vbias = 0 V, krec increases monotonically (krec = 0.24 to 0.55 min–1 for 21 to 118 mW cm–2) with an increase in ϕ0 indicating that the recombination of electrons and holes is favored under high light power density (as described for WO3 photoanodes).50 The transfer rate remains lower than the recombination rate, leading to a transfer efficiency of 40%. In contrast, for Vbias = 0.4 V, the transfer rate is greater than the recombination rate (the recombination rate remains stable at around krec = 0.5 min–1) giving an improvement in transfer efficiency of up to 80% (Figure 6b). These rate constants for Vbias = 0.4 V calculated for CaFeSeO are noticeably higher than those measured recently for Sr6Cd2Sb6S10O7 (ktr = 0.25 min–1 and krec = 0.08 min–1).6 The application of potential therefore promotes the transfer of charge at the interface.
Figure 6.
Evolution of the recombination and transfer rate constants ktr and krec with intensity of light alongside the transfer efficacity ηk by intensity light of CaFeOSe at (a) 0 and (b) 0.4 V.
The transient photocurrent response of CaFeSeO under solar illumination (simulated using a 150 W xenon lamp with an AM 1.5G filter, 100 mW cm–2) was also measured for Vbias = 0 and 0.4 V for on/off cycles of 20 s (Figure 4c). Apart from the good reproducibility of the measurements over the different cycles, two behaviors are observed. First, for Vbias = 0 V with high photocurrents (1.45 μA cm–2), the steady state is not reached within the measurement time. Second, for Vbias = 0.4 V, a more stable but lower photocurrent (0.35 μA cm–2) is measured.
For CaFeSO, no photocurrent response was detected for Vbias = 0.0 V. It is necessary to apply a voltage of 0.6 V in order to observe less stable and much weaker photocurrents [∼40 nA cm–2 for a power density of 111 mW cm–2 (450 nm), see Supporting Information] compared with the oxyselenide analogue, demonstrating poor performance of this material. Furthermore, for higher potentials, the response is erratic until it completely disappears, indicating strong photocorrosion of the film. This could result from some degradation of the CaFeSO film, particularly under the higher bias voltage of Vbias = 0.6 V. Linear sweep measurements (see Supporting Information) give evidence of an oxidation reaction for the sample-electrolyte system, likely indicating that some oxidation of Fe2+ in the sample occurs.
Similar photocurrent response measurements for La2O2Fe2OQ2 showed a stable photocurrent (up to 0.15 μA cm–2) for Q = S (Figure 7a), and the study of the transient photocurrent response over a longer time (see Supporting Information) shows good stability with only a very slight decrease over >30 min. An unstable and lower (up to 0.08 μA cm–2) photocurrent was measured for Q = Se (Figure 7b). The transient current has slower kinetics for the oxyselenide phase, as demonstrated by the faster exponential growth for the oxysulfide (Figure 7c,d). The transient photocurrent responses were also measured for La2O2Fe2OQ2 under solar illumination (simulated using a 150 W xenon lamp with an AM 1.5G filter and 100 mW cm–2) for Vbias = 0, 0.4, and 0.6 V (Figure 7c,d). As expected, the measured photocurrent increased with increasing Vbias, although a slight decrease in photocurrent with time was observed under the applied voltage, possibly indicating some photocorrosion (chemical degradation or dissolution of the electrode in the electrolyte), which seems to be more significant for La2O2Fe2OSe2. The evolution of the photocurrent response with power density was also measured for La2O2Fe2OS2 (see Supporting Information) and showed behavior consistent with a much high exponent (0.60(2)) than that determined for CaFeOSe (Figure 4d), indicating fewer traps for La2O2Fe2OS2 than for the other oxychalcogenides discussed here. This evolution of the photocurrent according to the luminous flux indicates the potential of La2O2Fe2OS2 for photodetector applications.
3.4. Electronic Structure
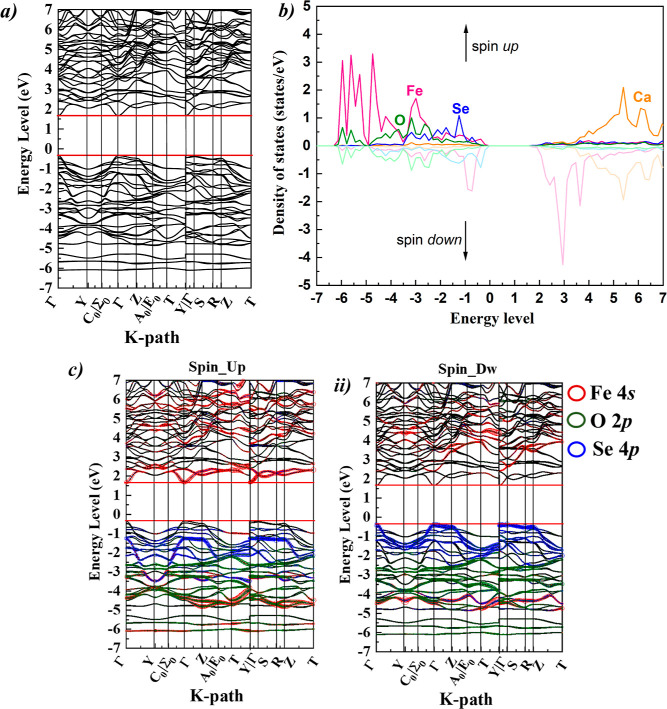
The band structure and projected density of states (PDOS) were calculated for the polar polymorph of CaFeOSe studied here (Figure 8), for comparison with the electronic structures reported for CaFeOS and for La2O2Fe2OQ2.27 Our calculations suggest a direct band gap of 2.08 eV for the polar polymorph of CaFeOSe (consistent with our optical measurements, Figure 2), in contrast to the indirect nature reported for the nonpolar polymorph.24 The Fe 3d states dominate the bottom of the conduction band and also hybridize with the O 2p and Se 3p states to form the top of the valence band (Figure 8b). This is comparable with the PDOS reported for the nonpolar polymorph of CaFeOSe,24 and qualitatively similar to that reported for CaFeOS.23 Analysis of the fat band of the Fe orbitals and of their PDOS (spin up and down) in Figure 8b,c indicates a high spin state.
Figure 8.
DFT calculations of the noncentrosymmetric (Cmc21) polymorph of CaFeOSe with (a) electronic band structure, (b) PDOS, and (c) fat bands showing the Fe 3d states in (i) spin up and (ii) spin down.
The band dispersions can provide insight into the carrier mobilities. Different dispersions at the CBM and VBM suggest different mobilities of the electrons and holes. The lowest electron effective mass me* = 0.342(3) m0 was found for the electrons in the conduction band for the Γ → S direction (i.e., within the layers), while the hole effective mass was heavier (mh* = 3.616(3) m0) along this direction. This indicates a high intralayer mobility for the electrons (me* < 0.5 m0) and lower mobility for the holes. This is consistent with computational work suggesting that having s orbital character at the CBM (the Fe 4s contribution to the spin-up channel, Figure 8c) can give low effective masses.51
4. Discussion
The iron oxychalcogenides investigated here share common features, including their layered crystal structures (Figure 1) and the mixed-anion coordination environments of Fe2+ cations (FeO2Q4 for La2O2Fe2OQ2, FeOS3 for CaFeOS, and FeSe2O2 for CaFeOSe). These features allow us to explore structure–property relationships in the context of photocatalysis for this family of materials.
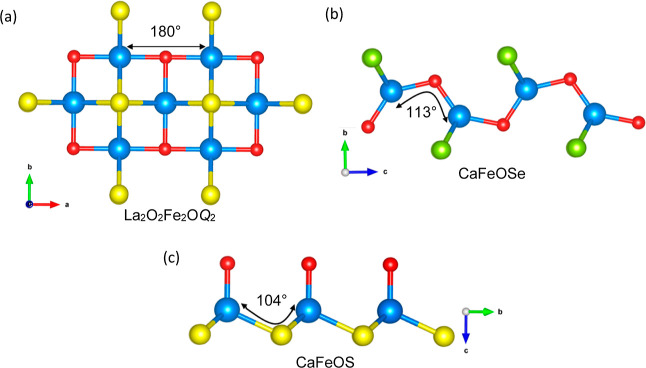
Both CaFeSeO and CaFeSO have band gaps well-matched to the solar spectrum (1.43(1) and 2.11(1) eV for Q = S and Se, respectively, Figure 2). This contrasts with the Fe2+ oxide CaFeO2 (composed of puckered FeO4 square planar units) with a much larger band gap of ∼2.7 eV.52−54 DFT studies on CaFeOQ (Q = S and Se) suggest that the VBM and CBM are predominantly composed of Fe 3d states but with significant hybridization with Q np states,23,24 presumably contributing to the wider bands and the reduced band gap in these oxychalcogenides. The reduction in bandgap for CaFeOS compared with CaFeOSe is likely due to the increased ratio of chalcogenide to oxide in the pseudotetrahedral Fe coordination environment (FeS3O units in the oxysulfide compared with FeSe2O2 units in the oxyselenide)55 and the effect of chemical pressure with the smaller sulfide anion.56 The much smaller bandgaps for La2O2Fe2OQ2 reflect the different Fe environments and connectivity in these Mott insulators: the 180° Fe–O–Fe bond angles (Figure 9) give better orbital overlap and more dispersed bands, contributing to the small band gaps in these materials.27 This contrasts with CaFeOQ phases with 113° Fe–O –Fe and 104° Fe–S–Fe bond angles connecting Fe-centered tetrahedra for Q = Se and S, respectively, giving flatter bands and wider band gaps (Figure 823).
Figure 9.
Representation of the M-O/Q-M bond angles in (a) La2O2Fe2OQ2 (Q = S and Se), (b) CaFeOSe, and (c) CaFeOS.
Both La2O2Fe2OQ2 and CaFeOQ (Q = S and Se) phases generated reproducible photocurrents under solar irradiation and over the whole visible spectrum range. The spike observed in the transient photocurrent response for CaFeSeO indicates fast carrier generation (e––h+ separation), then the establishment of a steady state with a balance between transfer and recombination phenomena, notably at the surface of the sample (Figure 4). It has been shown that an internal field due to a polar crystal structure (e.g., in ferroelectrics) minimizes charge carrier recombination and instead favors transfer at the interfaces.57 Both CaFeSeO and CaFeSO samples studied in this work adopt polar crystal structures (of Cmc21 and P63mc symmetries, respectively)18,25 and are composed of polar units (FeO2Se2 and FeOS3 pseudotetrahedra), in contrast to the centrosymmetric, nonpolar structures of La2O2Fe2OQ2 (I4/mmm symmetry) with slower kinetics. It is not clear whether a dipole across the photoactive cation or a polar axis in the crystal structure would have the greater effect of enhancing e––h+ separation. Comparison with LaGaS2O (with a nonpolar structure of Pbcm symmetry but composed of polar GaO2S2 units),58 which shows a qualitatively similar photocurrent response with fast e––h+ separation,59 suggests that the local polarity of the photoactive units might be more significant than the overall polarity of the crystal structure. Similar studies on the nonpolar polymorph of CaFeSeO24 would be interesting to confirm this. It is interesting that a higher photocurrent was observed for CaFeOSe with Vbias = 0.0 V (1.45 μA cm–2) compared with Vbias = 0.4 V (0.35 μA cm–2). This could be explained by some film degradation in the applied voltage. Further investigations are needed to understand this behavior.
The very different photochemical behavior of CaFeOSe and CaFeOS (Figure 4 and Supporting Information) results from the oxidative degradation of CaFeOS (at Vbias = 0.6 V). This illustrates that the stability of the photoactive oxychalcogenide is an important challenge to overcome in developing this family of materials. Lower oxidation states and coordination numbers can often be stabilized in oxychalcogenides compared with typical oxides,60 but this can leave the transition metal susceptible to oxidation, depending on the conditions. The greater stability of CaFeOSe here might be due to the greater concentration of electronegative oxide ions in the FeO2Se2 units stabilizing the Fe2+ cation compared with the FeOS3 units in CaFeOS. It has been reported that holes in d bands of transition metal dichalcogenides might react quite differently to holes in p bands of p block chalcogenides,61 suggesting that further research might be needed to understand the different stabilities of p block vs transition metal oxychalcogenides in conditions for photoelectrochemical reactions. Related to this, the surface morphology of these samples could also play a key role in their performance and stability. Surface states (associated with dangling bonds at surfaces exposed to the electrolyte) can be detrimental to performance, acting as charge recombination centers62 or conversely under appropriate irradiation, they can act as electron donors, giving a photocurrent response.63 Studies on the surface morphology and modification (as carried out with ferrites)64,65 would be useful to optimize the stability and performance of CaFeOSe.
5. Conclusions
The structural and physical properties of four iron-based oxychalcogenides, La2O2Fe2OQ2 and CaFeOQ (Q = S and Se), were investigated by exploring their photoelectrochemical and electronic characteristics to determine their potential as photocatalysts. The optical band gaps of CaFeOQ (Eg = 1.43(1) and 2.11(1) eV for Q = S and Se, respectively) and conduction band edge positions were found to be suitable for half reactions in visible light as photocathodes. The band gaps of Mott-insulating La2O2Fe2OQ2 (Q = S and Se) were too small for photocatalytic activity. The transient photocurrent response of CaFeOSe shows spikes (Figure 4), indicating very efficient electron–hole separation and migration, consistent with effective masses calculated by DFT. The O/Q ratio in the Fe2+ coordination environment in CaFeOSe to give O-linked FeO2Se2 tetrahedra seems to reflect a balance between stabilizing the Fe2+ cation (in contrast to CaFeOS, which was oxidized by the electrolyte) and reducing the band gap to match the visible spectrum. Further work to investigate the role of mixed-anion environments in tuning the band gap, stability, and polarity of coordination environments and the balance between these for optimal performance would give important insights for designing new photoactive materials, including photocatalysts with activity under solar irradiation.
Acknowledgments
The I-Site (ULNE), University of Lille, and University of Kent are thanked for Cotutelle funding (S.A.B.). Durham University is thanked for hosting research visits. Dr. Donna Arnold is thanked for helpful discussions. This study was supported by the French government through the Programme Investissement d’Avenir (I-SITE ULNE/ANR-16-IDEX-0004 ULNE) managed by the Agence Nationale de la Recherche (Project ANION-COMBO). X-ray diffractometers are funded by Region NPDC, FEDER, CNRS, and MESR. The regional computational cluster supported by Lille University, CPER Nord-Pas-de Calais/CRDER, France Grille CNRS, and FEDER is thanked for providing computational resources. DIM 1: “energy efficiency” of UArtois is thanked for its help in photocurrent measurements.
Supporting Information Available
The Supporting Information is available free of charge at https://pubs.acs.org/doi/10.1021/acs.inorgchem.3c03672.
Rietveld refinement details of La2O2Fe2OQ2 and CaFeOQ (Q = S and Se) using room temperature XRPD data; band edges positions; and electrochemical additional measurements (PDF)
Author Present Address
¶ Nantes Université, CNRS, Institut des Matériaux de Nantes Jean Rouxel, IMN, F-44000, France
The authors declare no competing financial interest.
Supplementary Material
References
- Kong D.; Zheng Y.; Kobielusz M.; Wang Y.; Bai Z.; Macyk W.; Wang X.; Tang J. Recent advances in visible light-driven water oxidation and reduction in suspension systems. Mater. Today 2018, 21 (8), 897–924. 10.1016/j.mattod.2018.04.009. [DOI] [Google Scholar]
- Hashimoto K.; Irie H.; Fujishima A. TiO2 Photocatalysis: A Historical Overview and Future Prospects. Jpn. J. Appl. Phys. 2005, 44 (12R), 8269. 10.1143/JJAP.44.8269. [DOI] [Google Scholar]
- Maruska H. P.; Ghosh A. K. Photocatalytic decomposition of water at semiconductor electrodes. Sol. Energy 1978, 20 (6), 443–458. 10.1016/0038-092X(78)90061-0. [DOI] [Google Scholar]
- Scheer R.; Walter T.; Schock H. W.; Fearheiley M. L.; Lewerenz H. J. CuInS2 based thin film solar cell with 10.2% efficiency. Appl. Phys. Lett. 1993, 63 (24), 3294–3296. 10.1063/1.110786. [DOI] [Google Scholar]
- Maeda K.; Domen K. New Non-Oxide Photocatalysts Designed for Overall Water Splitting under Visible Light. J. Phys. Chem. C 2007, 111 (22), 7851–7861. 10.1021/jp070911w. [DOI] [Google Scholar]
- Al Bacha S.; Saitzek S.; McCabe E. E.; Kabbour H. Photocatalytic and Photocurrent Responses to Visible Light of the Lone-Pair-Based Oxysulfide Sr6Cd2Sb6S10O7. Inorg. Chem. 2022, 61, 18611–18621. 10.1021/acs.inorgchem.2c03040. [DOI] [PubMed] [Google Scholar]
- Wang R.; Wang F.; Zhang X.; Feng X.; Zhao C.; Bu K.; Zhang Z.; Zhai T.; Huang F. Improved Polarization in the Sr6Cd2Sb6O7Se10 Oxyselenide through Design of Lateral Sublattices for Efficient Photoelectric Conversion. Angew. Chem., Int. Ed. 2022, 61 (33), e202206816 10.1002/anie.202206816. [DOI] [PubMed] [Google Scholar]
- Miura A.; Oshima T.; Maeda K.; Mizuguchi Y.; Moriyoshi C.; Kuroiwa Y.; Meng Y.; Wen X.-D.; Nagao M.; Higuchi M.; Tadanaga K. Synthesis, structure and photocatalytic activity of layered LaOInS2. J. Mater. Chem. A 2017, 5 (27), 14270–14277. 10.1039/C7TA04440B. [DOI] [Google Scholar]
- Kabbour H.; Sayede A.; Saitzek S.; Lefevre G.; Cario L.; Trentesaux M.; Roussel P. Structure of the water-splitting photocatalyst oxysulfide alpha-LaOInS2 and ab initio prediction of new polymorphs. Chem. Commun. 2020, 56 (11), 1645–1648. 10.1039/C9CC09797J. [DOI] [PubMed] [Google Scholar]
- Ishikawa A.; Takata T.; Kondo J. N.; Hara M.; Kobayashi H.; Domen K. Oxysulfide Sm2Ti2S2O5 as a stable photocatalyst for water oxidation and reduction under visible light irradiation (lambda ≤ 650 nm). J. Am. Chem. Soc. 2002, 124 (45), 13547–13553. 10.1021/ja0269643. [DOI] [PubMed] [Google Scholar]
- Wang Q.; Nakabayashi M.; Hisatomi T.; Sun S.; Akiyama S.; Wang Z.; Pan Z.; Xiao X.; Watanabe T.; Yamada T.; Shibata N.; Takata T.; Domen K. Oxysulfide photocatalyst for visible-light-driven overall water splitting. Nat. Mater. 2019, 18 (8), 827–832. 10.1038/s41563-019-0399-z. [DOI] [PubMed] [Google Scholar]
- Tiwari R. P. Visible-Light-Activated Enhanced Shift Current Bulk Photovoltaic Effect in Lead-Free Oxychalcogenide Perovskites: Emergence of Fully Inorganic Photovoltaic Materials. J. Phys. Chem. C 2022, 126 (25), 10258–10265. 10.1021/acs.jpcc.2c01848. [DOI] [Google Scholar]
- Park H.; Alharbi F. H.; Sanvito S.; Tabet N.; El-Mellouhi F. Searching for Photoactive Polymorphs of CsNbQ3 (Q = O, S, Se, Te) with Enhanced Optical Properties and Intrinsic Thermodynamic Stabilities. J. Phys. Chem. C 2018, 122 (16), 8814–8821. 10.1021/acs.jpcc.8b01787. [DOI] [Google Scholar]
- Park H.; Alharbi F. H.; Sanvito S.; Tabet N.; El-Mellouhi F. Elucidating the Impact of Chalcogen Content on the Photovoltaic Properties of Oxychalcogenide Perovkskites: NaMO3-xQx (M = Nb, Ta; Q = S, Se, Te). ChemPhysChem 2018, 19 (6), 703–714. 10.1002/cphc.201701206. [DOI] [PubMed] [Google Scholar]
- Dong X.-D.; Zhang Y.-M.; Zhao Z.-Y. Role of the Polar Electric Field in Bismuth Oxyhalides for Photocatalytic Water Splitting. Inorg. Chem. 2021, 60 (12), 8461–8474. 10.1021/acs.inorgchem.0c03220. [DOI] [PubMed] [Google Scholar]
- Lou Z.; Wang P.; Huang B.; Dai Y.; Qin X.; Zhang X.; Wang Z.; Liu Y. Enhancing Charge Separation in Photocatalysts with Internal Polar Electric Fields. ChemPhotoChem 2017, 1 (5), 136–147. 10.1002/cptc.201600057. [DOI] [Google Scholar]
- Vonrüti N.; Aschauer U. Band-gap engineering in AB(OxS1-x)3 perovskite oxysulfides: a route to strongly polar materials for photocatalytic water splitting. J. Mater. Chem. A 2019, 7 (26), 15741–15748. 10.1039/C9TA03116B. [DOI] [Google Scholar]
- Jin S. F.; Huang Q.; Lin Z. P.; Li Z. L.; Wu X. Z.; Ying T. P.; Wang G.; Chen X. L. Two-dimensional magnetic correlations and partial long-range order in geometrically frustrated CaOFeS with triangle lattice of Fe ions. Phys. Rev. B 2015, 91 (9), 094420. 10.1103/PhysRevB.91.094420. [DOI] [Google Scholar]
- Delacotte C.; Pérez O.; Pautrat A.; Berthebaud D.; Hébert S.; Suard E.; Pelloquin D.; Maignan A. Magnetodielectric Effect in Crystals of the Noncentrosymmetric CaOFeS at Low Temperature. Inorg. Chem. 2015, 54 (13), 6560–6565. 10.1021/acs.inorgchem.5b00879. [DOI] [PubMed] [Google Scholar]
- Selivanov E. N.; Chumarev V. M.; Gulyaeva R. I.; Mar’evich V. P.; Vershinin A. D.; Pankratov A. A.; Korepanova E. S. Composition, Structure, and Thermal Expansion of Ca3Fe4S3O6 and CaFeSO. Inorg. Mater. 2004, 40 (8), 845–850. 10.1023/B:INMA.0000037931.30753.56. [DOI] [Google Scholar]
- Sambrook T.; Smura C. F.; Clarke S. J.; Ok K. M.; Halasyamani P. S. Structure and Physical Properties of the Polar Oxysulfide CaZnOS. Inorg. Chem. 2007, 46 (7), 2571–2574. 10.1021/ic062120z. [DOI] [PubMed] [Google Scholar]
- Petrova S. A.; Mar’evich V. P.; Zakharov R. G.; Selivanov E. N.; Chumarev V. M.; Udoeva L. Y. Crystal Structure of Zinc Calcium Oxysulfide. Dokl. Chem. 2003, 393 (1–3), 255–258. 10.1023/B:DOCH.0000003458.35866.40. [DOI] [Google Scholar]
- Zhang Y.; Lin L.; Zhang J.-J.; Huang X.; An M.; Dong S. Exchange striction driven magnetodielectric effect and potential photovoltaic effect in polar CaOFeS. Phys. Rev. Mater. 2017, 1 (3), 034406. 10.1103/PhysRevMaterials.1.034406. [DOI] [Google Scholar]
- Han F.; Wang D.; Malliakas C. D.; Sturza M.; Chung D. Y.; Wan X.; Kanatzidis M. G. (CaO)(FeSe): A Layered Wide-Gap Oxychalcogenide Semiconductor. Chem. Mater. 2015, 27 (16), 5695–5701. 10.1021/acs.chemmater.5b02164. [DOI] [Google Scholar]
- Cassidy S. J.; Batuk M.; Batuk D.; Hadermann J.; Woodruff D. N.; Thompson A. L.; Clarke S. J. Complex Microstructure and Magnetism in Polymorphic CaFeSeO. Inorg. Chem. 2016, 55 (20), 10714–10726. 10.1021/acs.inorgchem.6b01951. [DOI] [PubMed] [Google Scholar]
- Mayer J. M.; Schneemeyer L. F.; Siegrist T.; Waszczak J. V.; Van Dover B. New Layered Iron-Lanthanum-Oxide-Sulfide and -Selenide Phases: Fe2La2O3E2(E = S,Se). Angew. Chem., Int. Ed. 1992, 31 (12), 1645–1647. 10.1002/anie.199216451. [DOI] [Google Scholar]
- Zhu J.-X.; Yu R.; Wang H.; Zhao L. L.; Jones M. D.; Dai J.; Abrahams E.; Morosan E.; Fang M.; Si Q. Band Narrowing and Mott Localization in Iron Oxychalcogenides La2O2Fe2O(S, Se)2. Phys. Rev. Lett. 2010, 104 (21), 216405. 10.1103/PhysRevLett.104.216405. [DOI] [PubMed] [Google Scholar]
- Rodriguez-Carvajal J.A Program for Rietveld Refinement and Profile Matching Analysis of Complex Powder Diffraction Patterns; Laboratoire Léon Brillouin (CEA-CNRS), 1991. [Google Scholar]
- Momma K.; Izumi F. VESTA 3 for three-dimensional visualization of crystal, volumetric and morphology data. J. Appl. Crystallogr. 2011, 44, 1272–1276. 10.1107/S0021889811038970. [DOI] [Google Scholar]
- Kubelka P.; Munk F. Ein Beitrag zur Optik der Farbanstriche. Z. Techn. Phys. 1931, 12, 593–601. [Google Scholar]
- Tauc J.; Grigorovici R.; Vancu A. Optical Properties and Electronic Structure of Amorphous Germanium. Phys. Status Solidi B 1966, 15 (2), 627–637. 10.1002/pssb.19660150224. [DOI] [Google Scholar]
- Mentré O.; Juárez-Rosete M. A.; Saitzek S.; Aguilar-Maldonado C.; Colmont M.; Arévalo-López Á. M. S = 1/2 Chain in BiVO3F: Spin Dimers versus Photoanodic Properties. J. Am. Chem. Soc. 2021, 143 (18), 6942–6951. 10.1021/jacs.1c00621. [DOI] [PubMed] [Google Scholar]
- Leroy S.; Blach J.-F.; Huvé M.; Léger B.; Kania N.; Henninot J.-F.; Ponchel A.; Saitzek S. Photocatalytic and sonophotocatalytic degradation of rhodamine B by nano-sized La2Ti2O7 oxides synthesized with sol-gel method. J. Photochem. Photobiol., A 2020, 401, 112767. 10.1016/j.jphotochem.2020.112767. [DOI] [Google Scholar]
- Gelderman K.; Lee L.; Donne S. W. Flat-Band Potential of a Semiconductor: Using the Mott-Schottky Equation. J. Chem. Educ. 2007, 84 (4), 685. 10.1021/ed084p685. [DOI] [Google Scholar]
- Kresse G.; Joubert D. From ultrasoft pseudopotentials to the projector augmented-wave method. Phys. Rev. B 1999, 59 (3), 1758–1775. 10.1103/PhysRevB.59.1758. [DOI] [Google Scholar]
- Blöchl P. E. Projector augmented-wave method. Phys. Rev. B 1994, 50 (24), 17953–17979. 10.1103/PhysRevB.50.17953. [DOI] [PubMed] [Google Scholar]
- Sun G.; Kürti J.; Rajczy P.; Kertesz M.; Hafner J.; Kresse G. Performance of the Vienna ab initio simulation package (VASP) in chemical applications. J. Mol. Struct.: THEOCHEM 2003, 624 (1–3), 37–45. 10.1016/S0166-1280(02)00733-9. [DOI] [Google Scholar]
- Perdew J. P.; Burke K.; Ernzerhof M. Generalized Gradient Approximation Made Simple. Phys. Rev. Lett. 1996, 77 (18), 3865–3868. 10.1103/PhysRevLett.77.3865. [DOI] [PubMed] [Google Scholar]
- Dudarev S. L.; Botton G. A.; Savrasov S. Y.; Humphreys C. J.; Sutton A. P. Electron-energy-loss spectra and the structural stability of nickel oxide: An LSDA+U study. Phys. Rev. B 1998, 57 (3), 1505–1509. 10.1103/PhysRevB.57.1505. [DOI] [Google Scholar]
- Lai K. T.; Komarek A. C.; Fernández-Díaz M. T.; Chang P.-S.; Huh S.; Rosner H.; Kuo C.-Y.; Hu Z.; Pi T.-W.; Adler P.; Ksenofontov V.; Tjeng L. H.; Valldor M. Canted Antiferromagnetism on Rectangular Layers of Fe2+ in Polymorphic CaFeSeO. Inorg. Chem. 2017, 56 (8), 4271–4279. 10.1021/acs.inorgchem.6b02098. [DOI] [PubMed] [Google Scholar]
- D Whalley L. effmass: an effective mass package. J. Open Source Softw. 2018, 3, 797. 10.21105/joss.00797. [DOI] [Google Scholar]
- Lin L.; Lin J. M.; Wu J. H.; Hao S. C.; Lan Z. Photovoltage enhancement of dye sensitised solar cells by using ZnO modified TiO2 electrode. Mater. Res. Innovations 2010, 14 (5), 370–374. 10.1179/143307510X12820854748791. [DOI] [Google Scholar]
- Hou Y.; Mei Z.; Du X. Semiconductor ultraviolet photodetectors based on ZnO and MgxZn1-xO. J. Phys. D: Appl. Phys. 2014, 47 (28), 283001. 10.1088/0022-3727/47/28/283001. [DOI] [Google Scholar]
- Murphy T. E.; Moazzami K.; Phillips J. D. Trap-related photoconductivity in ZnO epilayers. J. Electron. Mater. 2006, 35 (4), 543–549. 10.1007/s11664-006-0097-x. [DOI] [Google Scholar]
- Jiang J.; Ling C.; Xu T.; Wang W.; Niu X.; Zafar A.; Yan Z.; Wang X.; You Y.; Sun L.; Lu J.; Wang J.; Ni Z. Defect Engineering for Modulating the Trap States in 2D Photoconductors. Adv. Mater. 2018, 30 (40), 1804332. 10.1002/adma.201804332. [DOI] [PubMed] [Google Scholar]
- Shaikh S. K.; Inamdar S. I.; Ganbavle V. V.; Rajpure K. Y. Chemical bath deposited ZnO thin film based UV photoconductive detector. J. Alloys Compd. 2016, 664, 242–249. 10.1016/j.jallcom.2015.12.226. [DOI] [Google Scholar]
- Zhao Q.; Wang W.; Carrascoso-Plana F.; Jie W.; Wang T.; Castellanos-Gomez A.; Frisenda R. The role of traps in the photocurrent generation mechanism in thin InSe photodetectors. Mater. Horiz. 2020, 7 (1), 252–262. 10.1039/C9MH01020C. [DOI] [Google Scholar]
- Leroy S.Etude des propriétés photocatalytiques et photoélectriques du dititanate de lanthane (La2Ti2O7) à structure pérovskite en feuillets et son utilisation dans des hétérojonctions tout oxyde pour la conversion d’énergie; Universite d’Artois, 2020. [Google Scholar]
- Parkinson B.; Turner J.; Peter L.; Lewis N.; Sivula K.; Domen K.; Bard A. J.; Fiechter S.; Collazo R.; Hannappel T.. The Potential Contribution of Photoelectrochemistry in the Global Energy Future. In Photoelectrochemical Water Splitting Materials, Processes and Architectures; Lewerenze H.-J., Peter L., Eds.; RSC, 2013; Vol. 9. [Google Scholar]
- Amano F.; Koga S. Influence of light intensity on the steady-state kinetics in tungsten trioxide particulate photoanode studied by intensity-modulated photocurrent spectroscopy. J. Electroanal. Chem. 2020, 860, 113891. 10.1016/j.jelechem.2020.113891. [DOI] [Google Scholar]
- Hautier G.; Miglio A.; Waroquiers D.; Rignanese G.-M.; Gonze X. How Does Chemistry Influence Electron Effective Mass in Oxides? A High-Throughput Computational Analysis. Chem. Mater. 2014, 26 (19), 5447–5458. 10.1021/cm404079a. [DOI] [Google Scholar]
- Ju S.; Cai T.-Y. Magnetic and optical anomalies in infinite-layer iron oxide CaFeO2 and BaFeO2: A density functional theory investigation. J. Appl. Phys. 2009, 106 (9), 093903. 10.1063/1.3238271. [DOI] [Google Scholar]
- Tassel C.; Pruneda J. M.; Hayashi N.; Watanabe T.; Kitada A.; Tsujimoto Y.; Kageyama H.; Yoshimura K.; Takano M.; Nishi M.; Ohoyama K.; Mizumaki M.; Kawamura N.; Íñiguez J.; Canadell E. CaFeO2: A New Type of Layered Structure with Iron in a Distorted Square Planar Coordination. J. Am. Chem. Soc. 2009, 131 (1), 221–229. 10.1021/ja8072269. [DOI] [PubMed] [Google Scholar]
- Gupta M. K.; Mittal R.; Chaplot S. L.; Tassel C.; Kageyama H.; Tomiyasu K.; Taylor J. Phonons and stability of infinite-layer iron oxides SrFeO2 and CaFeO2. Solid State Commun. 2016, 241, 43–55. 10.1016/j.ssc.2016.05.010. [DOI] [Google Scholar]
- Kageyama H.; Hayashi K.; Maeda K.; Attfield J. P.; Hiroi Z.; Rondinelli J. M.; Poeppelmeier K. R. Expanding frontiers in materials chemistry and physics with multiple anions. Nat. Commun. 2018, 9, 772. 10.1038/s41467-018-02838-4. [DOI] [PMC free article] [PubMed] [Google Scholar]
- Almoussawi B.; Kageyama H.; Roussel P.; Kabbour H. Versatile Interplay of Chalcogenide and Dichalcogenide Anions in the Thiovanadate Ba7S(VS3O)2(S2)3 and Its Selenide Derivatives: Elaboration and DFT Meta-GGA Study. ACS Org. Inorg. Au 2023, 3 (3), 158–170. 10.1021/acsorginorgau.3c00006. [DOI] [PMC free article] [PubMed] [Google Scholar]
- Yu L.; Wang L.; Dou Y.; Zhang Y.; Li P.; Li J.; Wei W. Recent Advances in Ferroelectric Materials-Based Photoelectrochemical Reaction. Nanomaterials 2022, 12 (17), 3026. 10.3390/nano12173026. [DOI] [PMC free article] [PubMed] [Google Scholar]
- Jaulmes S. Oxysulfure de gallium et de lanthane LaGaOS2. Acta Crystallogr., Sect. B 1978, 34 (8), 2610–2612. 10.1107/S0567740878008705. [DOI] [Google Scholar]
- Ogisu K.; Ishikawa A.; Shimodaira Y.; Takata T.; Kobayashi H.; Domen K. Electronic Band Structures and Photochemical Properties of La-Ga-based Oxysulfides. J. Phys. Chem. C 2008, 112 (31), 11978–11984. 10.1021/jp802153t. [DOI] [Google Scholar]
- Clarke S. J.; Adamson P.; Herkelrath S. J. C.; Rutt O. J.; Parker D. R.; Pitcher M. J.; Smura C. F. Structures, Physical Properties, and Chemistry of Layered Oxychalcogenides and Oxypnictides. Inorg. Chem. 2008, 47 (19), 8473–8486. 10.1021/ic8009964. [DOI] [PubMed] [Google Scholar]
- Tributsch H. Hole Reactions from d-Energy Bands of Layer Type Group VI Transition Metal Dichalcogenides: New Perspectives for Electrochemical Solar Energy Conversion. J. Electrochem. Soc. 1978, 125 (7), 1086–1093. 10.1149/1.2131625. [DOI] [Google Scholar]
- Kam K. K.; Parkinson B. A. Detailed photocurrent spectroscopy of the semiconducting group VIB transition metal dichalcogenides. J. Phys. Chem. 1982, 86 (4), 463–467. 10.1021/j100393a010. [DOI] [Google Scholar]
- Hamilton J. W. J.; Byrne J. A.; McCullagh C.; Dunlop P. S. M. Electrochemical Investigation of Doped Titanium Dioxide. Int. J. Photoenergy 2008, 2008, 1–8. 10.1155/2008/631597. [DOI] [Google Scholar]
- Wang Y.; Huang J.; Wang L.; She H.; Wang Q. Research progress of ferrite materials for photoelectrochemical water splitting. Chin. J. Struct. Chem. 2022, 41, 2201054–2201068. 10.14102/j.cnki.0254-5861.2021-0020. [DOI] [Google Scholar]
- Wang L.; Zhang J.; Li Y.; Shi Y.; Huang J.; Mei Q.; Wang L.; Ding F.; Bai B.; Wang Q. Heterostructured CoFe1.5Cr0.5S3O/COFs/BiVO4 photoanode boosts charge extraction for efficient photoelectrochemical water splitting. Appl. Catal., B 2023, 336, 122921. 10.1016/j.apcatb.2023.122921. [DOI] [Google Scholar]
Associated Data
This section collects any data citations, data availability statements, or supplementary materials included in this article.


