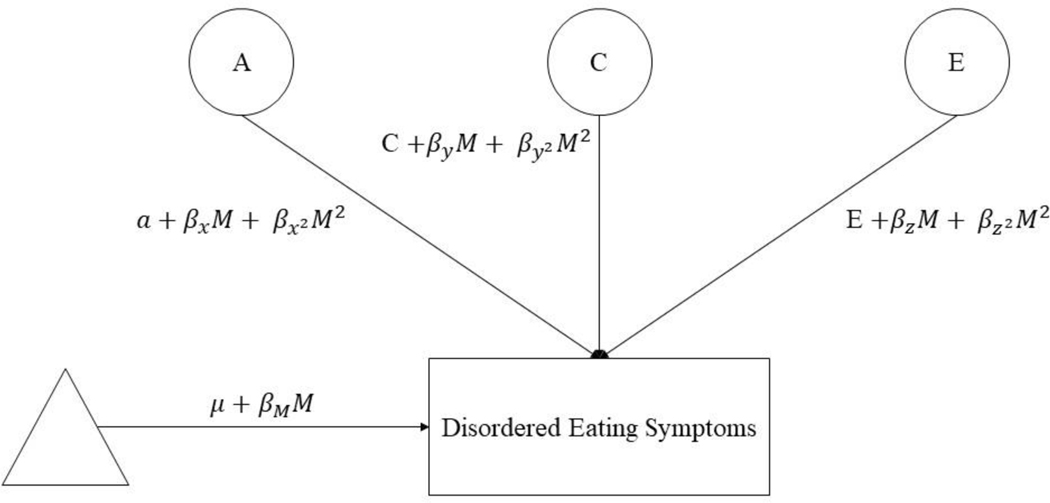
Figure 1. Path Diagram for the Full Twin Moderation Model for One Twin Only.
A = additive genetic effects; c = shared environmental effects; e = nonshared environmental effects; M = moderator (i.e., estradiol levels); triangle = mean for MEBS total score or weight/shape concerns factor score; phenotypic regression coefficient; a, c, and e = paths or intercepts; , , = linear moderators; , , = quadratic moderators.

