

ABSTRACT
Propanethiol (PT) is a hazardous pollutant that poses risks to both the environment and human well-being. Pseudomonas putida S-1 has been identified as a microorganism capable of utilizing PT as its sole carbon source. However, the metabolic pathway responsible for PT degradation in P. putida S-1 has remained poorly understood, impeding its optimization and practical application. In this study, we investigated the catabolic network involved in PT desulfurization with P. putida S-1 and identified key gene modules crucial to this process. Notably, propanethiol oxidoreductase (PTO) catalyzes the initial degradation of PT, a pivotal step for P. putida S-1’s survival on PT. PTO facilitates the oxidation of PT, resulting H2S, H2O2, and propionaldehyde (PA). Catalase-peroxidase catalyzes the conversion of H2O2 to oxygen and water, while PA undergoes gradual conversion to Succinyl-CoA, which is subsequently utilized in the tricarboxylic acid cycle. H2S is digested in a comprehensive desulfurization network where sulfide-quinone oxidoreductase (SQOR) predominantly converts it to sulfane sulfur. The transcriptome analysis suggests that sulfur can be finally converted to sulfite or sulfate and exported out of the cell. The PT degradation capacity of P. putida S-1 was enhanced by increasing the transcription level of PTO and SQOR genes in vivo.
IMPORTANCE
This work investigated the PT catabolism pathway in Pseudomonas putida S-1, a microorganism capable of utilizing PT as the sole carbon source. Critical genes that control the initiation of PT degradation were identified and characterized, such as pto and sqor. By increasing the transcription level of pto and sqor genes in vivo, we have successfully enhanced the PT degradation efficiency and growth rate of P. putida S-1. This work does not only reveal a unique PT degradation pathway but also highlights the potential of enhancing the microbial desulfurization process in the bioremediation of thiol-contaminated environment.
KEYWORDS: propanethiol, bioremediation, biodegradation, genetic engineering, GMC oxidoreductase, protein engineering
INTRODUCTION
Volatile organic sulfur compounds (VOSCs) are a group of toxic and malodorous organic reduced sulfur compounds, including mercaptan, thioether, and thiophenol (1). They are detected globally in various settings, such as sewage treatment plants, chemical plants, and waste landfills, and contribute greatly to air pollution, global warming, and photochemical haze (2–6). Propanethiol (PT) is a specific type of VOSC widely used in the production of valuable chemical products, including pesticides like sulprofos and ethoprophos. However, direct exposure to high concentrations of PT can be lethal and can cause nausea, vomiting, and appetite loss (7, 8).
Various approaches have been developed to address the removal of thiols from the environment, including adsorption, UV oxidation, condensation, oxidation, and biodegradation (8–12). While physical/chemical methods are effective, they often suffer from drawbacks such as limited cost efficiency, high-energy consumption, and potential secondary pollution. In contrast, biodegradation is widely regarded as the most suitable method for thiol treatment due to its notable advantages, including high efficiency, low cost, and minimal environmental impact (13).
An increasing number of microorganism strains with the capacity to degrade thiols have been isolated, and their degradation effects exhibit a high degree of substrate specificity. For instance, Paenibacillus polymyxa CZ05, obtained from activated sludge, has shown a remarkable 99.5% degradation efficiency for methanethiol (MT) by (14). Staphylococci sp. SH6, identified in wastewater sources, can completely transform 3-mM 1-dodecanethiol within a span of 3 days (15). Brevibacillus agri CAT37, isolated from a phosphate factory, displays tolerance toward and degradation ability for complex thiols with long side chains, such as decanethiol and dodecanethiol (16). Lysinibacillus sphaericus RG-1, derived from sludge, exhibits complete removal of ethanethiol within 96 h (17).
Multiple studies have delved into the catabolic mechanism of VOSCs in microorganisms. For instance, Boden et al. proposed a catabolism pathway of dimethylsulfide (DMS) in the Methylophaga thiooxidans strain. The degradation of DMS involved a cascade of enzymes, including corrinoid demethylase, DMS methyltransferase, and MT oxidoreductase (18). In this microorganism, thiols acted as intermediates in the catabolic process rather than serving as the sole carbon source. To directly address thiol removal via biodegradation, we isolated a highly efficient bacterial strain, Pseudomonas putida S-1, which exhibits exceptional proficiency in degrading PT. In a biotrickling filter system, this strain was able to remove 86% of PT (100 mg/m3) within 12 h (19–21). While these findings highlight the potential of Pseudomonas putida S-1 for PT remediation, the specific metabolic pathways governing PT degradation remained unclear. This knowledge gap currently poses limitations on the further utilization and modification of this strain.
In this study, we investigated the PT catabolic mechanism in Pseudomonas putida S-1, with a particular focus on the initial desulfurization step. Our findings revealed the crucial role of propanethiol oxidoreductase (PTO), an enzyme belonging to the glucose-methanol-choline (GMC) oxidoreductase superfamily and dependent on flavin adenine dinucleotide. PTO was identified as the key controller in the initiation of PT degradation, without which P. putida S-1 could not utilize PT as the sole carbon source. PTO (S1GL003403) converts PT to H2S, H2O2 and propionaldehyde (PA), and increasing its expression in vivo has promoted the PT degradation efficiency of P. putida S-1. The generated H2S was catalyzed to sulfane sulfur by sulfide-quinone oxidoreductase (SQOR, S1GL003435 and S1GL000007). This is the predominant second step of PT desulfurization by P. putida S-1 without which the strain almost lost its PT degradation capacity. Gene S1GL003435 seems to be the primary sqor gene, and increasing its transcription level further enhanced the PT degradation efficiency and S-1 growth rate.
RESULTS
Characteristics of PT degradation by P. putida S-1
To evaluate the exact PT degradation efficiency of P. putida S-1, it was cultivated in a mineral medium with propanethiol as the sole carbon source (MM-PT) at a temperature of 30°C. At an inoculum concentration of 2%, P. putida S-1 was able to completely degrade PT at a concentration of 100 mg/L within 24 h, resulting in a cellular biomass of 65 mg/L (Fig. 1A and B). However, it was observed that high concentrations of PT had a toxic effect on strain S-1, leading to a decrease in its growth rate as the PT concentration increased. At a PT concentration of 400 mg/L, the growth of this strain was completely inhibited, and it was unable to degrade PT (Fig. 1A and B).
Fig 1.

Characterization of Pseudomonas putida S-1. Cell growth curve of P. putida S-1 (A) and PT degradation curve (B) in MM-PT with varying initial PT concentrations. Data are presented as the mean ± standard deviation (n = 3).
Genome and transcriptome analysis of P. putida S-1
To study the catabolic mechanism of PT in Pseudomonas putida S-1, whole-genome sequencing was first performed using Illumina and PacBio technologies. This resulted in the assembly of a 5.93-Mb circular genome with a G + C content of 64.88%. A total of 5,430 genes were annotated within this genome, including 65 tRNA and 19 rRNA genes. Then, the transcriptome profile of P. putida S-1 grown in either PT or glucose (Glc) was compared to identify differentially expressed genes that are potentially involved in PT metabolism. The transcriptome analysis revealed 321 upregulated and 844 downregulated genes in response to PT induction (Fig. S1A). These genes are involved in the physiological processes of the strain such as biological regulation, cell growth, and cell reproductivity (Fig. S1C). We have employed reverse transcription quantitative PCR (RT-qPCR) to further analyze the transcription level of 12 genes annotated as enzymes potentially involved in sulfur catabolism such as sulfite dehydrogenase (SDH) (S1GL003452), DNA sulfur modification protein (S1GL003498), and sulfurtransferase (S1GL000496) (Fig. 2A). Unlike the other 10 genes, the expression of genes S1GL003435 and S1GL003445 surged when strain P. putida S-1 was growing in the MM-PT (Fig. 2A).
Fig 2.

The identification and characterization of SQOR genes. (A) Relative transcription levels of putatively functional genes in P. putida S-1 when inoculated in MM-PT and mineral medium with glucose as the sole carbon source. (B) PT degradation efficiency (solid lines with filled markers) and cell growth rate (dashed lines with empty markers) of P. putida S-1 with different genetic modifications. Strain S1-wild type (WT) is the wild-type P. putida S-1. Strains S1-Δ3435, S1-Δ0007, S1-Δ3435r, or S1-Δ3435Δ0007 are P. putida S-1 with gene knockout of 3435, 0007, the first 432 bp on gene 3435, or both genes 3435 and 0007. (C) Catalytic assay of purified proteins 0007, 3435, and trc_3435 (3435 with the first 144 residues deleted) with the supplementation of flavin adenine dinucleotide and CoQ1, analyzed using the classic Michaelis-Menten equation. (D) Relative transcription levels of gene 3403, 3435, or 0007 in P. putida S-1 with different gene knockouts; the legends marked are the same as those in panel C. Data are presented as the mean ± SD (n = 3). For comparision, the student’s t-test (*p<0.05, ***p<0.001) was used.
Gene S1GL003435 is crucial to PT desulfurization
Based on the gene annotation, S1GL003445 is a methanesulfonate monooxygenase that converts methanesulfonate and oxygen to formaldehyde and sulfite with a consumption of NADH to produce NAD+. Although it seems to participate in the catabolism process of PT, the deletion of S1GL003445 from P. putida S-1 did not consistently change either the growth rate of mutant strain S-1Δ3445 or the PT degradation rate. This suggests that gene S1GL003445 is not indispensable to the PT catabolism of P. putida S-1.
In contrast to gene S1GL003445, the deletion of gene S1GL003435 has largely compromised the growth rate of P. putida S-1, as well as the PT degradation rate (Fig. 2B; Fig. S2A). Gene annotation suggested that this gene encodes an SQOR that oxidizes sulfide to sulfane sulfur with a conversion of quinone to quinol. Blastp was used to search for similar proteins with the amino acid sequence of protein S1GL003435 (3435 for short) as the template. The top hits were NAD(P)/flavin adenine dinucleotide (FAD)-dependent oxidoreductases, and the most homogeneous sulfide-quinone oxidoreductase (Uniprot ID: A0A4Q7LQ53) was from Leptothrix mobilis (sequence identity 61. 8%). These two proteins are very similar to each other; the sequence alignment between them is shown in Fig. S7B. In general, SQOR contains non-covalently bound FAD and catalyzes the two-electron oxidization of sulfide with quinone as an electron acceptor. The sequence identity of 3435 protein and another annotated SQOR (B7JBP8) from Acidithiobacillus ferrooxidans is 57.2%. As was reported previously, with cyanide, sulfite, or glutathione being the sulfane acceptor, the final reaction product of SQOR catalyzing sulfide could be thiocyanate, thiosulfate, or S-sulfanylglutathione (GSSH) (22, 23). As 3435 and the characterized SQOR share conserved amino acid residues in the active site, they might be conducting a similar function (Fig. S7B and C).
To verify the function of protein 3435, it was heterogeneously expressed in Escherichia coli BL21 (DE3). While the E. coli BL21 (DE3) inoculated in lysogeny broth (LB) generated H2S and stained the lead acetate tips, the isopropyl β-D-1-thiogalactopyranoside (IPTG)-induced E. coli BL21 (DE3)-pET28a-3435 did not turn the tips brown (Fig. S2B). The protein 3435 was further purified with HisTrap and characterized with sulfide as substrate. The purified 3435 protein could degrade sulfide with a Km value of 5.9 mM and a Vmax of 151.1 µM/min at the presence of FAD and CoQ1 (Fig. 2C). It is worth noticing that the protein sequence of 3435 is approximately 140 residues longer than the characterized SQOR proteins (Fig. S7). Thus, we tried to investigate the role of the first 144 residues of 3435 by producing a truncated version of 3435 (trc_3435). The purified trc_3435 protein degraded sulfide with a Km of 2.3 mM and a Vmax of 72.2 µM/min. Although the Km of trc_3435 was smaller than the WT, its Vmax was also reduced (Fig. 2C). The protein model of 3435 generated by the online server named Alphafold2 suggested that the first 144 residues would be most likely to form a highly flexible loop. The predicted loop sequence was subjected to a search in the conserved domain database, and no known homologs were found. Although this region was predicted to be just a flexible loop, its presence altered the catalytic activity of protein 3435 in vitro (Fig. 2C). The sequence of the N-terminal 144 residues on 3435 does not align well with the currently characterized SOQRs; it is still possible that these residues are not included in the transcription of gene 3435. After the initial 432 bp on gene 3435 was knocked out, the resultant mutant Δ3435r did not exhibit significant differences of sulfide degradation when compared to the WT (Fig. S2D), suggesting that the initial 144 residues on 3435 might not be the critical motif accounted for the sulfide degradation.
Gene S1GL000007 complements the sulfide metabolism in P. putida S-1
When gene S1GL003435 was deleted, the resultant mutant strain P. putida S-1Δ3435 still exhibited a moderate ability to grow in MM-PT and degrade PT (Fig. 2B). This suggests the presence of other genes that encode isozymes which could compensate for the loss of the deleted 3435 gene. Thus, we searched for SQOR protein sequences in the genome of P. putida S-1 (NCBI No: NZ_CP074676) by using the characterized SQOR (Q9Y6N5) as template. The search led to the identification of a protein encoded by gene S1GL000007 (0007 for short) that is highly similar to 3435 with an identity of over 70%, except for the initial 144 residues on 3435 (Fig. S7H). The mutant P. putida S-1 strain with S1GL000007 knockout also manifested impaired sulfide degradation effects (Fig. 2B). The purified protein 0007 has manifested sulfide degradation capacity with a Km of 1.9 mM and a Vmax of 80.1 µM/min (Fig. 2C). The mutant P. putida S-1 strain Δ3435Δ0007 with both S1GL000007 and S1GL003435 knockouts has almost lost the ability to degrade PT or grow with PT as the sole carbon source (Fig. 2B; Fig. S2D). This suggested that gene S1GL000007 complements the function of S1GL003435 in the PT degradation pathway, and they dictate a crucial step in PT metabolism in P. putida S-1.
The transcription level of genes S1GL003435 and S1GL000007 was compared among P. putida S-1 strains wild type, Δ0007, Δ3435, and Δ3435r (Fig. 2D). Interestingly, the results showed that when compared to the WT, the transcription level of gene S1GL003435 has significantly increased in mutant Δ0007. This could mean that the enhanced expression of the gene compensated for the deletion of gene S1GL000007. On the other hand, the transcription of gene S1GL000007 decreased in the absence of gene S1GL003435. As genes S1GL000007 and S1GL003435 work cooperatively to convert sulfide, the decreased expression of both genes directly impaired the growth of P. putida S-1, as well as the PT degradation capacity. We speculate that the first 144 residues on protein 3435 might exert regulatory effects on the expression of genes S1GL000007 and S1GL003435. However, the mutant P. putida S-1 Δ3435r, in which the first 144 residues on protein 3435 were deleted, did not manifest any differential phenotypes or transcriptional consequences (Fig. 2D).
Revealing the initial step of PT desulfurization by P. putida S-1
As the reactant of SQOR protein, hydrogen sulfide was observed to be emitted during the consumption of PT by P. putida S-1, suggesting a strong upstream genetic module that transfers the sulfur from PT to H2S. To unravel the missing link between PT and H2S, a further analysis was conducted on the differential metabolome and transcriptome profiles of P. putida S-1 grown in MM-PT and mineral medium with glucose as the sole carbon source (MM-Glc). The metabolites collected from P. putida S-1 cells grown in MM-PT were more abundant than those in MM-Glc (Fig. S1D; Table S3). Among the various metabolic pathways analyzed, the synthesis and degradation of ketone bodies exhibited the highest degree of difference in metabolites (with highest pathway impact value). Furthermore, the top three pathways whose metabolites were found to be significantly upregulated [−log(P)] were aminoacyl-tRNA biosynthesis, cysteine and methionine metabolism, and the ATP-binding cassette (ABC) transporter system (Fig. S1B). These results suggest the PT metabolism to be a comprehensive process including energy transfer, trans-membrane transport, and the synthesis and degradation of sulfur-containing amino acids. Although the metabolomic analysis showed that the ABC transporter system was enhanced when P. putida S-1 cells were inoculated in MM-PT, there is no direct evidence showing the participation of transporters in the absorption of PT.
Along with the 10 potential genes isolated from the sulfur metabolome analysis, 7 upregulated hypothetical protein genes were characterized to evaluate their participation in PT degradation (Table S4). With 16S rRNA as the internal reference, the reverse transcription quantitative PCR (RT-qPCR) results indicate that only the expression of gene S1GL003403 (3403 for short) was highly induced by PT (Fig. 3A). Although genome sequencing annotation was not able to assign protein 3403 to any specific type, the Blastp of 3403 against the NCBI database has suggested that it shares the highest similarity with proteins from the GMC oxidoreductase superfamily, a large and diverse family of FAD flavoprotein oxidoreductases that catalyze the oxidization of numerous substrates (14, 16, 24). A 5-hydroxymethylfurfural oxidase (HMFO) that oxidizes phenylmethanethiol to produce sulfide and benzaldehyde from Methylovorus sp. strain MP688 (25) shares about 30% identity with protein 3403. HMFO is a FAD-dependent enzyme containing a FAD-binding domain and a substrate-binding domain. HMFO contains an active site of histidine 467 and a residue that participated in the non-covalent binding of FAD (valine 101) (25). The protein sequences of HMFO and 3403 in these residues are conserved (Fig. S7A).
Fig 3.
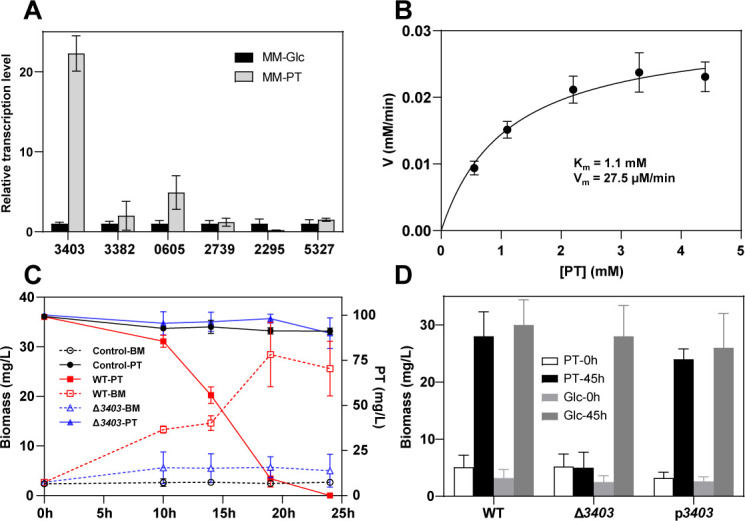
The identification and characterization of the PTO gene. (A) Analysis of the relative transcription levels of hypothetical protein genes in P. putida S-1 when inoculated in MM-PT and MM-Glc media. (B) Catalytic assay of purified protein 3403 with the supplementation of FAD, fitted with the Michaelis-Menten equation. The Km of protein 3403 catalyzing PT was 1.1 mM, and the Vmax was 27.5 µM/min. (C) Analysis of PT degradation (solid lines with filled markers) and cell growth curve (dashed lines with empty markers) of P. putida S-1. Control is phosphate-buffered saline buffer. WT is wild-type P. putida S-1, and Δ3403 is P. putida S-1 with 3403 knockouts. (D) Comparison of the biomass of P. putida S-1 with different genetic modifications in either PT or Glc medium after 45 h of inoculation. The p3403 strain is the mutant strain Δ3403 supplemented with the recombinant plasmid pBBR1MCS2-3403. Data are presented as the mean ± SD (n = 3).
Protein 3403 was heterogeneously expressed in E. coli BL21 (DE3), and the enzymatic activity of purified 3403 was assayed. The result showed that protein 3403 could catalyze PT with a Km of 1.1 mM and a Vmax of 27.5 µM/min at 30°C (Fig. 3B; Fig. S3). When the proposed active site of PTO, His439, was mutagenized to Ala, the activity of protein 3403 was largely compromised, endorsing the participation of His439 in the degradation of PT.
Since FAD could be non-covalently bound to enzymes and the purified PTO protein was colorless, the interaction between FAD and PTO should also be non-covalent. The molecular docking between the FAD molecule and the PTO structure model suggested that their binding should be spontaneous with a docking affinity of −7.4 kcal/mol. Subsequently, the PT molecule was docked into this complex with a docking affinity of −2.7 kcal/mol. A direct hydrogen bond was observed between the docked PT molecule and His439, which functions as both the active site and the hydrogen bond acceptor for the substrate SH group (Fig. S4).
When gene S1GL003403 was knocked out from the genome of P. putida S-1, the strain lost its ability to utilize PT and grow in the MM-PT (Fig. 3C). The time course of PT degradation also showed that the mutant strain P. putida S-1 Δ3403 completely lost its ability to utilize PT as the sole carbon source, manifesting the indispensability of 3403 (Fig. 3C). When both wild-type and P. putida S-1 Δ3403 were inoculated in MM-Glc medium, no growth difference was observed between the two, manifesting the exclusive participation of gene S1GL003403 on PT-based metabolism (Fig. 3D). The biomass of wild-type P. putida S-1 reached approximately 25 mg/L, while the mutant P. putida S-1 Δ3403 did not grow in MM-PT. When mutant strain Δ3403 was complemented via the transformation of a plasmid pBBR1MCS2 expressing gene 3403, the resultant strain Δ3403/pBBR1MCS2-3403 (p3403 for short) recovered the capacity to degrade PT and grow in MM-PT and (Fig. 3D). Gene S1GL003403 does not seem to be affected by the sqor genes since neither gene knockout did not affect the transcription of it (Fig. 2D).
Enhancing the PT degradation capacity of P. putida S-1
Based on the investigation of the PT catabolism of P. putida S-1, we tried to improve its PT degradation capacity by increasing the expression level of the critical genes involved. We first tried introducing additional gene S1GL003403 to P. putida S-1 on plasmids pH101 or pBBR1MCS5. The S-1 mutants that contained recombinant plasmids, however, failed to manifest better performance in either cell growth or PT degradation (Fig. 4A and B). P. putida S-1 containing recombinant pHG101 plasmid even manifested slower growth and PT degradation rate. This might be due to the growth pressure brought by the extraneous plasmid. Then, we tried to duplicate the copy number of gene S1GL003403 in the genome of P. putida S-1. Gene 3403 with its promoter was inserted into the non-coding region between genes 3375 and 3376; the engineered strain is named S-1:3403. The growth rate, as well as the PT degradation efficiency of S-1:3403, was significantly higher than the WT (Fig. 4C and D). The overexpression of gene S1GL003403 was endorsed by the transcriptional analysis conducted by the RT-PCR. Approximately, the transcription level of gene S1GL003403 in strain S-1:3403 increased by twofold compared to the WT.
Fig 4.

Physiological effects of overexpressing gene 3403 in P. putida S-1. PT degradation (A) and growth (B) curves of P. putida S-1 with corresponding recombinant plasmids. Control is phosphate-buffered saline buffer. WT is wild-type strain S-1. S1/pHG101 is P. putida S-1 with empty pHG101. S-1/pHG101-3403 is P. putida S-1 with pHG101-3403. S1/pBR1MCS5 is P. putida S-1 with empty pBR1MCS5. S-1/pBR1MCS5-3403 is P. putida S-1 with pBR1MCS5-3403. (C) PT degradation and cell growth (D) curves of P. putida S-1 WT and S-1:3403 in liquid culture of MM-PT. S-1:3403 is the engineered P. putida S-1 with gene 3403 inserted in the non-coding region of its genome. Data are presented as the mean ± SD (n = 3).
As the PT degradation performance of P. putida S-1 can be improved by enhancing the expression of the pto gene S1GL003403, we further tried modifying P. putida S-1 by increasing the expression of sqor genes S1GL003435 and S1GL000007. Since the most upregulated genes in P. putida S-1 was S1GL002621 when the stain was inoculated in MM-PT, we substituted the promoter of gene 3435 with the promoter of gene 2621 in the engineered strain S-1:3403. The results showed that the transcription of gene 3435 was significantly enhanced in the resultant mutant S-1:3403Δp3435:p2621 (Fig. 5A). Likewise, a significantly increase in transcription of gene 3435 was also observed in mutant S-1:3403Δp3435:p3403 with the substitution of promoter of 3435 to the promoter of 3403 (Fig. 5A).
Fig 5.

Effects of modulating the transcription level of sqor genes in P. putida S-1 on sulfide degradation efficiency. (A) Relative transcriptional level of genes 0007 and 3435 of different S-1 mutants. (B) The residual sulfide concentration after a 100-min treatment with different S-1 mutants. Data are presented as the mean ± SD (n = 3). (C) The picture of lead acetate tips in the bottles containing PT treated by P. putida S-1 with different genome modifications. Control means phosphate-buffered saline buffer. S-1:3403:p3435 is S-1:3403 with the promoter of gene 3435 inserted in the non-coding region between genes 0006 and 0007. S-1:3403Δp3435:p2621 is S-1:3403 with a substitution of the promoter of 3435 by the promoter of 2621. S-1:3403Δp3435:p3403 is S-1:3403 with a substitution of the promoter of 3435 by the promoter of 3403. For comparision, the student’s t-test (*p<0.05, **p<0.01) was used.
The genome sequencing result of P. putida S-1 suggests that genes 0006 (persulfide dioxygenase, PDO) and 0007 are transcribed in the same direction. The region between them is only 39 bp long, and there is no detectable promoter within the region. This indicates that the expression of genes 0006 and 0007 is under the regulation of the same promoter. Thus, we tried to increase the transcription of gene 0007 by inserting a promoter into the non-coding region between genes 0007 and 0006. The promoter of gene 3435 was selected as this gene encodes an isozyme of 0007, and it plays a crucial role in the growth of P. putida S-1 in MM-PT. Surprisingly, the mutant S-1:3403:p3435 with this promoter insertion manifested a decline of transcription of gene 0007 (Fig. 5A). It is also worth noting that the transcription of gene 0007 was also enhanced in both mutants S-1:3403Δp3435:p3403 and S-1:3403Δp3435:p2621.
We next tested the sulfide degradation capacity of the engineered P. putida S-1 strains. The results were mostly in accordance with the transcriptional analysis (Fig. 5B). The sulfide degradation rate of mutant S-1:3403:p3435 was lower than mutant S-1:3403 when the transcription of gene 0007 was weakened and the transcription of gene 3435 was kept the same. The sulfide degradation rate of mutant S-1:3403Δp3435:p3403 was higher than mutant S-1:3403 with the increase of transcription of gene 3435 (Fig. 5A and B). When the S-1 mutants were used to degrade PT, the lead acetate tips indicated that mutant S-1:3403:p3435 emitted more hydrogen sulfide than mutant S-1:3403, and mutant S-1:3403Δp3435:p3403 emitted the least H2S (Fig. 5C). These results showed that enhancing the transcription of gene 3435 could increase the PT degradation capacity and release less H2S.
We designed another S-1 mutant with the insertion of gene 3435 with its promoter between genes 3414 and 3415 (mutant S1:3403:3435) and compared its PT degradation capacity with mutants S-1:3403, S-1: 3403Δp3435:p2621, and S-1:3403Δp3435:p3403. The gene modifications on these mutants are shown in Fig. 6C. The results showed that mutant S1:3403:3435 manifested the highest PT degradation rate and growth rate in MM-PT (Fig. 6). Although the transcription of gene 3435 was increased in strains S-1: 3403Δp3435:p2621 and S-1:3403Δp3435:p3403, their PT degradation capacity was obviously impaired (Fig. 6A), and their final biomass was less than both mutants S-1:3403 and S1:3403:3435 (Fig. 6B).
Fig 6.

Effects of increasing the transcription level of 3435 genes in P. putida S-1 on PT degradation efficiency (A) and cell growth rate (B). The cartoon representative (C) shows that S1:3403:3435 is S-1:3403 with an insertion of gene 3435 in P. putida S-1 genome between genes 3414 and 3415. S-1:3403, S-1: 3403Δp3435:p2621, and S-1:3403Δp3435:p3403 are labeled as those in Fig. 5. The black arrows point to the gene modification made on the genome of P. putida S-1. Data are presented as the mean ± SD (n = 3).
DISCUSSION
VOSC degradation micrograms are often highly substrate specific. Previously reported studies of thiol biodegradation mainly focused on the degradation of methanethiol; a detailed characterization of the comprehensive catabolism pathway, however, has not been conducted (26–30). This study provides insights into the fine-tuned propanethiol catabolic mechanism network in Pseudomonas putida S-1 and identified critical gene modules accounting for the initiation of PT desulfurization. Based on the experimental observations made, the PT catabolism in P. putida S-1 was initiated by PTO (S1GL003403), and the reaction products H2O2, H2S, and propionaldehyde were then catalyzed by SQOR (S1GL000007 and S1GL003435) and the genes downstream. In the BRENDA Enzyme Databse (https://www.brenda-enzymes.org/index.php), oxidases with thiol as the substrates are categorized into two groups, thiol oxidase (EC 1.8.3.2) and methanethiol oxidase (MTO) (EC 1.8.3.4). Thiol oxidase converts thiols to the corresponding thioether, while MTO is restricted to one substrate, methanethiol. For example, the first MTO enzyme reported was isolated from the bacterium Hyphomicrobium sp. VS, and the Km value of this protein is around 0.3 µM (31). The MTO from human beings catalyzes methanethiol to sulfide in a similar mechanism and has an apparent Km of 1.8 nM, and this low Km value could be contributing to the prevention of methanethiol toxicity in the human body (30). Although these MTO enzymes catalyze methanethiol to sulfide with relatively high efficiency, their substrate spectrum is narrow. Propanethiol, for example, could not be catalyzed by them. The substrate specificity of PTO exhibits a high degree of selectivity. It was observed that the bacterium P. putida S-1, from which PTO was isolated, was unable to thrive solely on MT as a carbon source (19). If PTO were capable of degrading MT, one would expect the bacterium to utilize the resulting products as a nutritional source. The limited range of substrates for MTO or PTO implies that oxidases acting on thiols as substrates are likely to display pronounced substrate specificity. The discovery of PTO addresses a significant gap in the existing enzyme repertoire, suggesting its potential application in the bioremediation of PT pollution.
After the initial desulfurization step, SQOR genes S1GL000007 and S1GL003435 conduct the conversion of H2S to sulfane sulfur, GSSH, or thiosulfate (Fig. S8). Whole-genome sequencing has also annotated three genes potentially encoded for cysteine synthase that can catalyze sulfide to cysteine, but all of them were downregulated under PT induction (Table S5). Considering cysteine was reported to form reactive oxygen species during oxidization that can damage DNA and lead to mutations or cell death (32, 33), the generation of cysteine might not be the key step for sulfur circulation in P. putida S-1, although cysteine could serve as the carbon source for the bacteria. GSSH, the product of SQOR, could be oxidized by PDO to sulfite (34), which could be oxidized to sulfate naturally or by SDH, and some of these genes (e.g., S1GL000006) were upregulated in P. putida S-1 with PT induction (Table S5). Sulfate could be transported out of P. putida S-1 through a sulfite exporter (TAUE) or reduced to sulfide by sulfite reductase (SRD). As PT exhibits limited solubility in water, it could form disulfide in the environment and enter the cell. Unlike tauE, the only srd gene was significantly downregulated in P. putida S-1 (Table S5). Sulfite can be converted to thiosulfate by a thiosulfate sulfurtransferase, and thiosulfate can be further transferred to tetrathionate. However, the SfnB family sulfur acquisition oxidoreductase (SFNB) that catalyzes this reaction was largely downregulated, suggesting tetrathionate is not a favorable metabolite during PT catabolism. Propionaldehyde generated by PTO could be converted to propionate by aldehyde dehydrogenase. The propionate is converted to propionyl-coenzyme A (CoA) by propionate CoA-transferase. Finally, propionyl-CoA is catalyzed to succinyl-CoA by propionyl-CoA:succinyl-CoA transferase and enters the tricarboxylic acid cycle (Fig. S8).
In conclusion, the critical gene modules S1GL003403 (pto) and S1GL003435 (sqor) were successfully found to be responsible for the initial catabolism process of the PT catabolism pathway in Pseudomonas putida S-1. When increasing the transcription level of pto and sqor genes, PT degradation capacity of P. putida S-1 can be significantly enhanced. These findings put new insight of and suggest more strategy to enhance the microbial desulfurization process.
MATERIALS AND METHODS
Chemicals and media
Propanethiol (99% purity) was purchased from J&K Scientific. The regular LB medium contained yeast extract (5.0 g/L), tryptone (10.0 g/L), and NaCl (10.0 g/L). Mineral medium (MM) contained Na2HPO4∙12H2O (4.5 g/L), KH2PO4 (1.0 g/L), NH4Cl (1.5 g/L), MgCl2∙6H2O (0.43 g/L), CaCl2 (0.02 g/L), and 1 µL of trace element stock solution. The trace element stock solution contained FeCl2 (10.0 g/L), CoCl2·6H2O (0.2 g/L), Na2MoO4·2H2O (0.2 g/L), H3BO3 (0.14 g/L), MnCl2 (0.1 g/L), and ZnCl2 (1.0 g/L). These media were autoclaved at 115°C for 30 min. Propanethiol MM medium (MM-PT) was MM with 0.12 ‰ PT (vol/vol). Glucose MM medium (MM-Glc) was MM with 4-g/L glucose (for metabolome analysis), or 100-mg/L glucose (for transcriptome analysis).
Strains and plasmids
Strain Pseudomonas putida S-1 was originally isolated from active sludge and grew at 30°C and 180 rpm for PT degradation. Strain E. coli DH5α was used as host for plasmid construction. Strain E. coli BL21 (DE3) was used as host for protein expression. The auxotroph strain E. coli WM3064 was used for genome editing, and it was cultivated in LB with a supplementation of 2,6-diaminopimelic acid (57 mg/L).
Plasmid pET28a (+) (KanR) was used for the heterogeneous expression of genes 3403, 3435, and 0007. The plasmid pK18mobsacB (mob + KanR) was used for gene knockout and knockin on strain S-1 strain. Plasmid pBBR1MCS-2 (KmR) was used to complement strain S-1 Δ3403, generating complemented strain S-1 Δ3403 p3403. Plasmids pBBR1MCS-5 (GmR) and pHG101 (KmR) were used for the overexpression of gene 3403 in strain S-1.
Metabolome analysis
Strain S-1 was inoculated into either MM-PT or MM-Glc medium. Cells from each medium were harvested and subjected to liquid chromatography-mass spectrometry (LC-MS) analysis conducted by Mingke Biotechnology (Hangzhou) Co., Ltd. The steps were as follows. Samples of 5.0–21.3 mg were lysed through the wash, shaking, repeated freeze-thaw, and grinding. After centrifugal drying, the cell lysate was dissolved in a 2-chlorophenyl alanine (4 PPM) methanol solution. The dissolved lysate was filtered through a 0.22-µm membrane before being subjected to LC-MS. The chromatographic conditions of LC-MS were as follows: an ACQUITY UPLC HSS T3 1.8 µm (2.1 × 150 mm) column was used for gradient elution with an automatic sampler at 8°C, a flow rate of 0.25 mL/min, a column temperature of 40°C, and a sample volume of 2 µL. Gradient elution of analytes was carried out with 0.1% formic acid in water (C) and 0.1% formic acid in acetonitrile (D), or 5-mM ammonium formate in water (A) and acetonitrile (B) at a flow rate of 0.25 mL/min. An increasing linear gradient of solvent B (vol/vol) was applied as follows: 0–1 min, 2% B/D; 1–9 min, 2%–50% B/D; 9–12 min, 50%–98% B/D; 12.0–13.5 min, 98% B/D; 13.5–14.0 min, 98%–2% B/D; 14–20 min, 2% D.
The mass spectrum conditions were as follows. An electrospray ion source was used at both positive and negative ion ionization modes. The positive ion spray voltage was 3.50 kV and the negative ion spray voltage was 2.50 kV. The sheath gas was 30 Arb and the auxiliary gas was 10 Arb. The capillary temperature was 325°C, and a full scan was performed at a resolution of 60,000 with a scanning range of 81–1,000 m/z. The secondary cleavage was performed with a high-energy C-trap dissociation cell. The collision voltage was 30 eV. Simultaneously, the unnecessary tandem mass spectrometry information was removed by the dynamic elimination program. Software Proteowizard was used to analyze and identify metabolites obtained from it. The enzymes potentially related to the metabolism of PT and glucose were screened through the Kyoto Encyclopedia of Genes and Genomes database.
Transcriptome analysis
Strain S-1 was inoculated in MM-PT and MM-Glc media, respectively. Cell pellets were harvested for transcriptomic analysis (RNA-seq was completed by Mingke Biotechnology (Hangzhou) Co., Ltd.). The specific steps were as follows: RNA (5 µg) was extracted and amplified by using the RNAprep Pure Cell/Bacteria Klt kit. Hiseq sequencing platform was used for 2 × 150 bp sequencing, and Rockhopper software was used for biological analysis. Biological triplicates were performed to obtain the P value of the gene expression differences between MM-Glc and MM-PT media. Afterward, functional annotation of transcriptome data was completed through multiple sequence alignments, and candidate genes were preliminarily identified.
RT-qPCR
After activation, the wild-type strain S-1 was inoculated into MM-PT or MM-Glc medium, respectively. Total RNA of the cells were extracted during exponential stage with guanidine thiocyanate cesium chloride super centrifugation. After removing the genomic gDNA,the mRNA was reversely transcribed into cDNA using HiScript II qRT SuperMix for the qPCR kit. With the 16S rRNA gene as an internal reference and cDNA of reverse transcription product as a template, ChamQ SYBR qPCR Master Mix was used to conduct fluorescence quantitative PCR. All the primers used in the RT-qPCR experiments are listed in Table S1. The expression level of genes in the MM-PT was used as the experimental group, and the expression level of genes in the MM-Glc medium was used as the control group. Each group of experiments was set up in three parallels, and the original data were analyzed by the 2−ΔΔCt method.
Gene knockout and gene insertion
Both the knockout and knockin of DNA fragments (genes 3403, 3435, 0007, and their promoters) described in this work were conducted by using the double-exchanged homologous recombination strategy. The primers used in this section are listed in Tables S1 and S2. With the knockout of gene 3403 as an example, the steps are described as follows: first, primer pairs 3403-UF/3403-UR and 3403-DF/3403-DR were used to amplify the upper and lower homologous arm sequences of 3403 gene (including restriction sites HindIII and BamHI). Both this DNA segment and plasmid pK18mobsacB were digested by restriction enzyme HindIII and BamHI. HiFi reaction was used to recombine DNA segments U, D, and linearized pK18mobsacB, and the product was transformed into E.coli DH5α by heat shock. The miniprepped recombinant plasmid was transformed into E. coli WM3064 by heat shock. The recombinant cell E. coli WM3064 that contained the plasmid pK18mobsacB-3403UD was used as the donor to infect the wild-type S-1 with a ratio of 3:1 on LB plate (Kan 50 µM). The recombinant was selected and verified through colony PCR by using primers 3403 F and 3403 R. Colonies that contain both U-3404-D and U-D DNA segments were isolated and inoculated on LB plate containing 15% sucrose to screen for the S-1 strains on which gene 3403 was knocked out of the genome.
Construction of complementary strains
The pBBR1MCS2 plasmid was used to construct the complementing plasmid containing gene 3403, and the primers used are shown in Table S1. The recombinant plasmid pBBR1MCS2-3403 was transformed into strain S-1 by using electroporation. The settings were as follows: the voltage was 1.7 kV; the resistance was 200 Ω; and the capacitance was 25 µF. The resultant mixture was incubated for 3 h and then spread on the LB (Kan) plate. The single colonies were selected for PCR verification. All the primers are listed in Table S1.
Strain S-1 inoculation
The inoculation of strain S-1 with different genetic features was performed as follows. A single colony of strain S-1 was picked up from an LB plate and inoculated in 20-mL LB for 12 h (30°C and 180 rpm). Afterward, 1-mL broth was harvested with centrifugation at 3,000 × g for 5 min. The cell pellets were washed twice in 1-mL sterile water, and the cell resuspension was used as inoculum (2%) for MM-PT or MM-Glc medium in the sealed serum bottles. For biomass of strain S-1, dry cell weight (DCW) was measured using a standard curve between DCW and OD600, which was measured by a spectrophotometer.
Protein expression and purification
Gene 3403 was incroporated into the pET28 plasmid between restriction sites EcoRI and HindIII. The recombinant plasmid was transformed into E. coli BL21 (DE3) by heat shock. The recombinant cells were induced with 0.1-mM IPTG at 20°C overnight for protein expression. Afterward, the cells were harvested with centrifugation (4,000 × g, 20 min). The cell pellets were washed and resuspended in phosphate-buffered saline (PBS) buffer (137.9-mM NaCl, 2.7-mM KCl, 10-mM Na2HPO4, 26.3-mM KH2PO4, pH 7.0) and lysed with ultra-sonication. The cell lysate was clarified with centrifugation (10,000 × g, 30 min) at 4°C. The supernatant was supplemented with 20-mM imidazole before being loaded on a 5-mL HisTrap gravity column (Bio-Rad, USA) preequilibrated by PBS with 20-mM imidazole (buffer A). The loaded proteins were washed with buffer A for four column volumes (CVs) and eluted with PBS buffer containing 250-mM imidazole (buffer B). The eluted protein was exchanged to PBS buffer by using desalting column to remove the high-concentration imidazole.
Genes 3435, 0007, and truncated 3435 (trc_3435) are expressed in E. coli BL21 (DE3) similarly to gene 3403. The steps for the purification of the proteins are as follows: cells were harvested by centrifugation (5,000 × g, 10 min), and the resuspended cell pellets in PBS buffer were lysed through ultra-sonication. The lysate was clarified with centrifugation (12,000 × g, 20 min) and supplemented with 1% n-dodecyl-B-D-maltoside (DDM) for membrane protein extraction. After inoculation at 4°C for 16 h, 20-mM imidazole was added to the membrane extract, and the mixture was loaded into a Histrap preequilibrated by buffer A with 0.025% DDM (buffer C). The protein on column was washed with buffer C for 6 CV and eluted by buffer B containing 0.025% DDM (buffer D). The eluted protein was exchanged to PBS with 0.025% DDM (buffer E) with desalting column. The purified protein was used immediately or stored at −80°C with 10% (wt/vol) glycerol for future use. The concentration of protein was measured by using the DC protein assay (Bio-Rad).
Enzyme activity assays
Steady-state kinetics of PTO and SQOR was analyzed according to the classic Michaelis-Menten equation. The protein concentration of PTO and SQOR was diluted to 100 µM for catalytic reaction. The concentration of FAD and CoQ1 was also set to 100 µM. The catalytic reactions were conducted at certain substrate concentrations, and the initial rate was calculated for generation of MM plot. The data collected was fitted by using the software Graph Pad Prism version 8.
Characterization of PTO
Certain amount of PT was added into 10-mL PBS buffer in a sealed 50-mL test bottle that contained cell-free extracts or purified PTO enzyme. A system without a catalyst was set as a negative control. The reaction system was incubated at 30°C and tested subsequently.
Gas chromatography was utilized to quantitatively measure the residual PT with a gas chromatography (GC) (FPD-2014) headspace injection. GC conditions were as follows: RTX-1 column was used; H2 was used as mobile phase; the temperature was raised to 230°C; and PT content was detected at this temperature. GC (Agilent 7890A) was used for qualitative detection. The conditions were as follows: HP-VRX column was used as mobile phase in helium gas (flow rate was 1 mL/min); the inlet temperature was 200°C; the initial temperature was 40°C/min to 100°C, 8°C/min to 200°C .
The generated H2S by PTO was detected by using lead acetate test paper (13). The lead acetate can react with H2S to generate PbS (black color) attached to the test paper Specifically, lead acetate test paper moistened with deionized water was fixed on the top of the test tube and sealed with a rubber plug.
The hydrogen peroxide (H2O2) generated from the reaction was qualitatively detected by using the H2O2 test strips (1–100 mg/L) purchased from Lohand Biological. Specifically, 10 µL of the reaction mixture was aliquoted and applied to the H2O2 test strips. The test strip turned blue at the presence of H2O2.
The generated propionaldehyde was identified by using GC (Agilent 7890A) coupled with mass spectrometry (MS; Agilent 5973, Santa Clara, CA, USA). An HP-VRX column was used on the GC with helium as the mobile phase (flow rate 1 mL/min). The inlet temperature was set at 200°C. The initial temperature of the heating program increased from 40°C to 100°C in 15 min. After a 3-min incubation, it increased to 200°C at a rate of 8°C/min. The MS parameters were customized as follows. The interface temperature was set at 280°C. The electron-ion source temperature was at 250°C. The electron impact energy was 70 eV. The m/z range was set from 15 to 105 at the full-scan mode, and the qualitative analysis was conducted on selective ion monitoring.
Characterization of SQOR
The consumption rate of sulfide was used to measure the activity of purified SOQR proteins: 0007, 3435, and truncated 3435 (trc_3435). The concentration of sulfide was measured spectrophotometrically as a colloidal solution of copper sulfide (35). To make a standard curve, Na2S of certain concentration (10.0, 5.0, 2.5, 1.25, 0.625, 0.3125, and 0.15625 mM) was mixed with sulfide buffer solution containing 5-mM CuSO4 and 50-mM HCl with a ratio of 1:8. The absorption of the mixture was measured with spectrophotometer at OD480. Purified SQOR protein was incubated with sulfide of different concentrations (pH 8.0) at 30°C to calculate for the initial reaction rate.
Molecular simulation
A BLASTp search was performed on the National Center for Biotechnology Information database (36). Multiple sequence alignment was employed on the online server, CLUSTAL Omega (37). The protein model of PTO was built by using the Iterative Threading ASSEmbly Refinement online server (38–40). The molecular docking was performed on the software AutoDock Vina (41). Pictures related to protein structure were generated on the software Pymol.
ACKNOWLEDGMENTS
This work was financially supported by the National Natural Science Foundation of China (no. 21938012, 31970104), the National Key Research and Development Program of China (2021YFA0909500), and the Basic Public Welfare Research Program of Zhejiang Province (LQ23C010003).
Conceptualization, supervision, project administration, manuscript review, editing, and funding acquisition: W.Z., J.C., and P.Q. Experiment design and conduct, Data analysis, Manuscript drafting and editing: P.Q., L.N., Y.T., J.C., R.Z., J.C., G.C., Q.Y., and T.Z. Bioinformatic analysis and methodology: P.Q., L.N., R.Z., and Y.T. All authors read and agreed on the published version of the manuscript.
Contributor Information
Jianmeng Chen, Email: jchen@zjut.edu.cn.
Weihong Zhong, Email: whzhong@zjut.edu.cn.
Ning-Yi Zhou, Shanghai Jiao Tong University, Shanghai, China.
DATA AVAILABILITY
The RNA-seq data is available in the Sequence Read Archive system with accession ID of PRJNA1052609. The genomic sequence of strain S-1 archived in GenBank could be accessible with accession number CP074676.1. All data and materials supporting this study are included in the text.
SUPPLEMENTAL MATERIAL
The following material is available online at https://doi.org/10.1128/aem.01959-23.
Supplemental figures and tables.
ASM does not own the copyrights to Supplemental Material that may be linked to, or accessed through, an article. The authors have granted ASM a non-exclusive, world-wide license to publish the Supplemental Material files. Please contact the corresponding author directly for reuse.
REFERENCES
- 1. Wu T, Wang X, Li D, Yi Z. 2010. Emission of volatile organic sulfur compounds (VOSCs) during aerobic decomposition of food wastes. Atmospheric Environment 44:5065–5071. doi: 10.1016/j.atmosenv.2010.09.019 [DOI] [Google Scholar]
- 2. Jana S, Sarkar U. 2018. Alkaline functionalization of granular activated carbon for the removal of volatile organo sulphur compounds (VOSCs) generated in sewage treatment plants. J Environ Chem Eng 6:3510–3519. doi: 10.1016/j.jece.2018.05.022 [DOI] [Google Scholar]
- 3. van den Bosch PLF, de Graaff M, Fortuny-Picornell M, van Leerdam RC, Janssen AJH. 2009. Inhibition of microbiological sulfide oxidation by methanethiol and dimethyl polysulfides at natron-alkaline conditions. Appl Microbiol Biotechnol 83:579–587. doi: 10.1007/s00253-009-1951-6 [DOI] [PMC free article] [PubMed] [Google Scholar]
- 4. Emerson CW, Rajagopal R. 2004. Measuring toxic emissions from landfills using sequential screening. Comput Environ Urban Syst 28:265–284. doi: 10.1016/S0198-9715(03)00022-X [DOI] [Google Scholar]
- 5. Chasteen TG, Bentley R. 2004. Volatile organic sulfur compounds of environmental interest: dimethyl sulfide and methanethiol. J Chem Educ 81:1524. doi: 10.1021/ed081p1524 [DOI] [PubMed] [Google Scholar]
- 6. Li Q, Tang Z, Zhang J, Hu J, Chen J, Chen D. 2022. “Simultaneous biodegradation of dimethyl sulfide and 1-propanethiol by Pseudomonas putida S-1 and Alcaligenes sp. SY1: "Lag" cause, reduction, and kinetics exploration”. Environ Sci Pollut Res Int 29:48638–48647. doi: 10.1007/s11356-022-19306-8 [DOI] [PubMed] [Google Scholar]
- 7. Chen G, Feng H, Xi W, Xu J, Pan S, Qian Z. 2019. Thiol–ene click reaction-induced fluorescence enhancement by altering the radiative rate for assaying butyrylcholinesterase activity. Analyst 144:559–566. doi: 10.1039/c8an01808a [DOI] [PubMed] [Google Scholar]
- 8. Al‐Degs YS, El‐Sheikh AH, Al Bakain RZ, Newman AP, Al‐Ghouti MA. 2016. Conventional and upcoming sulfur‐cleaning technologies for petroleum fuel: a review. Energy Tech 4:679–699. doi: 10.1002/ente.201500475 [DOI] [Google Scholar]
- 9. Smet E, Lens P, Langenhove HV. 1998. HV: treatment of waste gases contaminated with odorous sulfur compounds. Crit Rev Environ Sci Technol 28:89–117. doi: 10.1080/10643389891254179 [DOI] [Google Scholar]
- 10. Montebello AM, Fernández M, Almenglo F, Ramírez M, Cantero D, Baeza M, Gabriel D. 2012. Simultaneous methylmercaptan and hydrogen sulfide removal in the desulfurization of biogas in aerobic and anoxic biotrickling filters. Chem Eng J 200–202:237–246. doi: 10.1016/j.cej.2012.06.043 [DOI] [Google Scholar]
- 11. Demeestere K, Dewulf J, Ohno T, Salgado PH, Van Langenhove H. 2005. Visible light mediated photocatalytic degradation of gaseous trichloroethylene and dimethyl sulfide on modified titanium dioxide. App Catal B: Environ 61:140–149. doi: 10.1016/j.apcatb.2005.04.017 [DOI] [Google Scholar]
- 12. Lin Y-H, Hsueh H-T, Chang C-W, Chu H. 2016. Chu H: the visible light-driven photodegradation of dimethyl sulfide on S-doped TiO2: characterization, kinetics, and reaction pathways. App Catal B: Environ 199:1–10. doi: 10.1016/j.apcatb.2016.06.024 [DOI] [Google Scholar]
- 13. Chen XG, Geng AL, Yan R, Gould WD, Ng YL, Liang DT. 2004. Isolation and characterization of sulphur-oxidizing Thiomonas sp. and its potential application in biological deodorization. Lett Appl Microbiol 39:495–503. doi: 10.1111/j.1472-765X.2004.01615.x [DOI] [PubMed] [Google Scholar]
- 14. Zhang C, Zhang W, Xu J. 2013. Isolation and identification of methanethiol-utilizing bacterium CZ05 and its application in bio-trickling filter of biogas. Bioresour Technol 150:338–343. doi: 10.1016/j.biortech.2013.10.024 [DOI] [PubMed] [Google Scholar]
- 15. Chebbi A, Jaoua H, Loukil S, Mhiri N, Ammar N, Sayadi S, Chamkha M. 2016. Biodegradation of malodorous mercaptans by a novel Staphylococcus capitis strain isolated from gas-washing wastewaters of the tunisian chemical group. Int. J Environ Sci Technol 13:571–580. doi: 10.1007/s13762-015-0897-8 [DOI] [Google Scholar]
- 16. Chebbi A, Mhiri N, Rezgui F, Ammar N, Maalej A, Sayadi S, Chamkha M. 2015. Biodegradation of malodorous thiols by a Brevibacillus sp. strain isolated from a tunisian phosphate factory. FEMS Microbiol Lett 362:14. doi: 10.1093/femsle/fnv097 [DOI] [PubMed] [Google Scholar]
- 17. Wan S, Li G, An T, Guo B, Sun L, Zu L, Ren A. 2010. Biodegradation of ethanethiol in aqueous medium by a new Lysinibacillus sphaericus strain RG-1 isolated from activated sludge. Biodegradation 21:1057–1066. doi: 10.1007/s10532-010-9366-8 [DOI] [PubMed] [Google Scholar]
- 18. Boden R, Kelly DP, Murrell JC, Schäfer H. 2010. Oxidation of dimethylsulfide to tetrathionate by Methylophaga thiooxidans sp. nov.: a new link in the sulfur cycle. Environ Microbiol 12:2688–2699. doi: 10.1111/j.1462-2920.2010.02238.x [DOI] [PubMed] [Google Scholar]
- 19. Chen DZ, Sun YM, Han LM, Chen J, Ye JX, Chen JM. 2016. A newly isolated Pseudomonas putida S-1 strain for batch-mode-propanethiol degradation and continuous treatment of propanethiol-containing waste gas. J Hazard Mater 302:232–240. doi: 10.1016/j.jhazmat.2015.09.063 [DOI] [PubMed] [Google Scholar]
- 20. Chen DZ, Zhao XY, Miao XP, Chen J, Ye JX, Cheng ZW, Zhang SH, Chen JM. 2018. A solid composite microbial inoculant for the simultaneous removal of volatile organic sulfide compounds: preparation, characterization, and its bioaugmentation of a biotrickling filter. J Hazard Mater 342:589–596. doi: 10.1016/j.jhazmat.2017.08.079 [DOI] [PubMed] [Google Scholar]
- 21. Sun Y, Qiu J, Chen D, Ye J, Chen J. 2016. Characterization of the novel dimethyl sulfide-degrading bacterium Alcaligenes sp. SY1 and its biochemical degradation pathway. J Hazard Mater 304:543–552. doi: 10.1016/j.jhazmat.2015.11.006 [DOI] [PubMed] [Google Scholar]
- 22. Jackson MR, Melideo SL, Jorns MS. 2012. Human sulfide:quinone oxidoreductase catalyzes the first step in hydrogen sulfide metabolism and produces a sulfane sulfur metabolite. Biochemistry 51:6804–6815. doi: 10.1021/bi300778t [DOI] [PubMed] [Google Scholar]
- 23. Landry AP, Ballou DP, Banerjee R. 2018. Modulation of catalytic promiscuity during hydrogen sulfide oxidation. ACS Chem Biol 13:1651–1658. doi: 10.1021/acschembio.8b00258 [DOI] [PMC free article] [PubMed] [Google Scholar]
- 24. Chebbi A, Jaoua H, Loukil S, Mhiri N, Ammar N, Sayadi S, Chamkha M. 2016. Biodegradation of malodorous mercaptans by a novel Staphylococcus capitis strain isolated from gas-washing wastewaters of the tunisian chemical group. Int J Environ Sci Technol 13:571–580. doi: 10.1007/s13762-015-0897-8 [DOI] [Google Scholar]
- 25. Dijkman WP, Fraaije MW. 2014. Discovery and characterization of a 5-hydroxymethylfurfural oxidase from Methylovorus SP. strain MP688. Appl Environ Microbiol 80:1082–1090. doi: 10.1128/AEM.03740-13 [DOI] [PMC free article] [PubMed] [Google Scholar]
- 26. Gould WD, Kanagawa T. 1992. Purification and properties of methyl Mercaptan oxidase from Thiobacillus thioparus TK-m. J Gen Microbiol 138:217–221. doi: 10.1099/00221287-138-1-217 [DOI] [Google Scholar]
- 27. Kim S-J, Shin H-J, Kim Y-C, Lee D-S, Yang J-W. 2000. Isolation and purification of methyl mercaptan oxidase from Rhodococcus rhodochrous for mercaptan detection. Biotechnol. Bioprocess Eng. 5:465–468. doi: 10.1007/BF02931949 [DOI] [Google Scholar]
- 28. Lee H-H, Kim S-J, Shin H-J, Park J-Y, Yang J-W. 2002. Purification and characterization of methyl mercaptan oxidase from Thiobacillus Thioparus for mercaptan detection. Biotechnol. Bioprocess Eng. 7:375–379. doi: 10.1007/BF02933525 [DOI] [Google Scholar]
- 29. Suylen GMH, Large PJ, Van Dijken JP, Kuenen JG. 1987. Methyl Mercaptan oxidase, a key enzyme in the metabolism of methylated sulphur compounds by Hyphomicrobium EG. Microbiology 133:2989–2997. doi: 10.1099/00221287-133-11-2989 [DOI] [Google Scholar]
- 30. Pol A, Renkema GH, Tangerman A, Winkel EG, Engelke UF, de Brouwer APM, Lloyd KC, Araiza RS, van den Heuvel L, Omran H, Olbrich H, Oude Elberink M, Gilissen C, Rodenburg RJ, Sass JO, Schwab KO, Schäfer H, Venselaar H, Sequeira JS, Op den Camp HJM, Wevers RA. 2018. Mutations in SELENBP1, encoding a novel human methanethiol oxidase, cause extraoral halitosis. Nat Genet 50:120–129. doi: 10.1038/s41588-017-0006-7 [DOI] [PMC free article] [PubMed] [Google Scholar]
- 31. Eyice Ö, Myronova N, Pol A, Carrión O, Todd JD, Smith TJ, Gurman SJ, Cuthbertson A, Mazard S, Mennink-Kersten MA, Bugg TD, Andersson KK, Johnston AW, Op den Camp HJ, Schäfer H. 2018. Bacterial SBP56 identified as a cu-dependent methanethiol oxidase widely distributed in the biosphere. ISME J 12:145–160. doi: 10.1038/ismej.2017.148 [DOI] [PMC free article] [PubMed] [Google Scholar]
- 32. Howpay Manage SA, Fleming AM, Chen H-N, Burrows CJ. 2022. Burrows CJ: cysteine oxidation to sulfenic acid in Ape1 AIDS G-quadruplex binding while compromising DNA repair. ACS Chem Biol 17:2583–2594. doi: 10.1021/acschembio.2c00511 [DOI] [PMC free article] [PubMed] [Google Scholar]
- 33. Park S, Imlay JA. 2003. High levels of intracellular cysteine promote oxidative DNA damage by driving the Fenton reaction. J Bacteriol 185:1942–1950. doi: 10.1128/JB.185.6.1942-1950.2003 [DOI] [PMC free article] [PubMed] [Google Scholar]
- 34. Xin Y, Gao R, Cui F, Lü C, Liu H, Liu H, Xia Y, Xun L. 2020. The heterotrophic bacterium Cupriavidus pinatubonensis JMP134 oxidizes sulfide to sulfate with thiosulfate as a key intermediate. Appl Environ Microbiol 86:22. doi: 10.1128/AEM.01835-20 [DOI] [PMC free article] [PubMed] [Google Scholar]
- 35. Cord-Ruwisch R. 1985. Cord-Ruwisch R: a quick method for the determination of dissolved and precipitated Sulfides in cultures of sulfate-reducing bacteria. Journal of Microbiological Methods 4:33–36. doi: 10.1016/0167-7012(85)90005-3 [DOI] [Google Scholar]
- 36. Johnson M, Zaretskaya I, Raytselis Y, Merezhuk Y, McGinnis S, Madden TL. 2008. NCBI BLAST: a better web interface. Nucleic Acids Res 36:W5–9. doi: 10.1093/nar/gkn201 [DOI] [PMC free article] [PubMed] [Google Scholar]
- 37. Sievers F, Higgins DG. 2014. Clustal Omega. Curr Protoc Bioinformatics 48:3. doi: 10.1002/0471250953.bi0313s48 [DOI] [PubMed] [Google Scholar]
- 38. Roy A, Kucukural A, Zhang Y. 2010. I-TASSER: A unified platform for automated protein structure and function prediction. Nat Protoc 5:725–738. doi: 10.1038/nprot.2010.5 [DOI] [PMC free article] [PubMed] [Google Scholar]
- 39. Yang J, Yan R, Roy A, Xu D, Poisson J, Zhang Y. 2015. The I-TASSER suite: Protein structure and function prediction. Nat Methods 12:7–8. doi: 10.1038/nmeth.3213 [DOI] [PMC free article] [PubMed] [Google Scholar]
- 40. Zhang Y. 2008. I-TASSER server for protein 3d structure prediction. BMC Bioinformatics 9:1–8. doi: 10.1186/1471-2105-9-40 [DOI] [PMC free article] [PubMed] [Google Scholar]
- 41. Eberhardt J, Santos-Martins D, Tillack AF, Forli S. 2021. Autodock vina 1.2.0: New docking methods, expanded force field, and python bindings. J Chem Inf Model 61:3891–3898. doi: 10.1021/acs.jcim.1c00203 [DOI] [PMC free article] [PubMed] [Google Scholar]
Associated Data
This section collects any data citations, data availability statements, or supplementary materials included in this article.
Supplementary Materials
Supplemental figures and tables.
Data Availability Statement
The RNA-seq data is available in the Sequence Read Archive system with accession ID of PRJNA1052609. The genomic sequence of strain S-1 archived in GenBank could be accessible with accession number CP074676.1. All data and materials supporting this study are included in the text.