

ABSTRACT
Polymetallic exposure causes complex toxicity to microorganisms. In this study, we investigated the responses of Escherichia coli under co-existence of cadmium (Cd) and lead (Pb), primarily based on biochemical analysis and RNA sequencing. Cd completely inhibited bacterial growth at a concentration of 2.41 mmol/L, with its removal rate as low as <10%. In contrast, the Pb removal rate was >95% under equimolar sole Pb stress. In addition, the Raman analysis confirmed the loss of proteins for the bacterial cells. Under the co-existence of Cd and Pb, the Cd toxicity to E. coli was alleviated. Meanwhile, the biosorption of Pb cations was more intense during the competitive sorption with Cd. Transmission electron microscopy images showed that a few cells were elongated during incubation, i.e., the average cellular length increased from 1.535 ± 0.407 to 1.845 ± 0.620 µm. Moreover, NanoSIMS imaging showed that the intracellular distribution of Cd and Pb was coupled with sulfur. Genes regulating sulfate transporter were also upregulated to promote sulfate assimilation. Then, the subsequent production of biogenic sulfide and sulfur-containing amino acids was enhanced. Although this strategy based on S enrichment could resist the polymetallic stress, not all related genes were induced to upregulate under sole Cd stress. Therefore, the S metabolism might remodel the microbial resistance to variable occurrence of heavy metals. Furthermore, the competitive sorption (in contrast to sole Cd stress) could prevent microbial cells from strong Cd toxicity.
IMPORTANCE
Microbial tolerance and resistance to heavy metals have been widely studied under stress of single metals. However, the polymetallic exposure seems to prevail in the environment. Though microbial resistance can alleviate the effects of exogenous stress, the taxonomic or functional response to polymetallic exposure is still not fully understood. We determined the strong cytotoxicity of cadmium (Cd) on growth, and cell elongation would be driven by Cd stress. The addition of appropriate lead (Pb) showed a stimulating effect on microbial bioactivity. Meanwhile, the biosorption of Pb was more intense during co-existence of Pb and Cd. Our work also revealed the spatial coupling of intracellular S and Cd/Pb. In particular, the S assimilation was promoted by Pb stress. This work elucidated the microbial responses to polymetallic exposure and may provide new insights into the antagonistic function during metal stresses.
KEYWORDS: Escherichia coli, Cd, Pb, transcriptomic profiling, NanoSIMS
INTRODUCTION
Cadmium (Cd) and lead (Pb) are priority heavy metal (HM) pollutants (1, 2). In particular, polymetallic exposure has been widely reported in soil, water, and atmosphere (3–5). Cd and Pb are the most common co-existed metals. Microorganisms are usually exposed in their environment to resist HM stress (6, 7). Their tolerance and resistance to HMs not only are the driving force for metal speciation but are also tightly involved in biogeochemical cycling of metals (8, 9).
Cd and Pb usually show many similar chemical properties in the environment (10). Their polarized cations tend to form covalent bonds with S (sulfur) and N (nitrogen) electron donors (11, 12). Due to insufficient binding sites in the intracellular region, toxic effects would be associated with free Cd(II) and Pb(II) cations in cytoplasm (13–15). Then, the accumulation of HM cations causes an increase of reactive oxygen species (ROS), which is detrimental to many microbial cells (16, 17). Furthermore, these cations would replace the essential metals in biomolecules, causing enzyme inactivation, protein denaturation, nucleic acid damage, and membrane rupture (18–20). These, ultimately, cause the degradation or even lysis of microbial cells.
Cadmium usually shows a higher cytotoxicity than Pb (21–23). For example, it has been proposed that the minimal inhibitory concentration (MIC) of Pb(II) was 400 to 600 mg/L for Escherichia coli strains, whereas the value was as low as 20–40 mg/L for Cd(II) (24). Furthermore, the toxicity of Cd could be alleviated after Pb addition (25, 26). The antagonism of the binary stress (co-existence of Pb and Cd) was based on the assumption that the two types of cations have similar mechanisms of toxicity, hence inducing competition for available sites of sorption (27, 28). The alleviated toxicity after Cd addition due to such competition has been reported in luminescent bacteria (29). This competition for sorption sites would induce complicated microbial resistance via variable physiological responses (30, 31).
Stress is an evolutionary driving force, leading to the establishment of tolerance and resistance mechanisms of microorganisms. Then, it allows microbial cells to restore homeostasis (32). For exogenous HMs, organic compounds would be secreted to extracellular region as HM-capturing molecules (e.g., organic acids, siderophores, and glutathione) (33–37). Moreover, macromolecular substances in biofilm systems would act as a platform for HM accumulation, e.g., the extracellular polymeric substances (EPS) secreted by microorganisms (38–40). Extracellular bioaccumulation driven by these highly active sites is carried out by necrotic or living cells (15, 41, 42). In response to the intracellular accumulation of free HMs, the functional proteins and chelators would also be synthesized for intracellular sequestration (43–45).
The S functional groups of metallothionein residues bind Cd(II) and Pb(II), preventing the free cations from reaching toxic levels (46, 47). Meanwhile, the abundance of functional genes usually shows a significant decrease with adverse effects on C and N utilization under HM stresses (48–50). Both S enrichment and gene manipulation of sulfur metabolism would enhance HM-tolerating capacity, especially for Cd (51–53). Therefore, the S metabolism could be tightly involved in microbial resistance to HM stresses. However, dynamic responses of cellular S metabolism under single and binary stresses of Cd and Pb are still not fully understood.
In this study, E. coli was applied to investigate the influences of Cd and Pb binary stress on bacterial resistance to HM toxicity. Cell growth, HM removal rates, cell morphology, subcellular distribution of HMs, and transcriptomic responses were analyzed.
MATERIALS AND METHODS
Bacterial cultivation
The E. coli strain (DH5α) was applied in this study. It was incubated in LB medium (5 g yeast extract, 10 g tryptone, 10 g NaCl, and 20 g agar per 1 L medium). After incubation in LB medium (in the dark for 2 d), a single colony was inoculated into liquid medium (without agar). The liquid medium was incubated in the dark at 37°C on orbital shaker at 180 rpm. Then, the biomass was analyzed during exponential growth phase.
The solid powders of Cd(NO3)2·4H2O (Sigma Aldrich Inc.) and Pb(NO3)2 (Xilong Scientific Ltd.) were used to adjust the concentrations of Cd and Pb in liquid medium. CK (control check, without HM), CdT (addition of Cd), PbT (addition of Pb), and PbCd (addition of both Cd and Pb) treatments were prepared. For the HM removal, 1-mL bacterial suspensions at exponential phrase were added to 100 mL liquid medium in 250-mL Erlenmeyer flasks. The Cd and Pb concentrations were both set as 2.41 mmol/L. Then, these flasks were incubated at 37°C under 180 rpm shaking for 12, 24, 36, 48, 60, 72, 96, 120, and 144 h. All the treatments had six replicates.
The E. coli growth was monitored by measuring the absorbance at 600 nm, using a ultraviolet-visible spectrophotometer (UVmini-1240, Shimadzu, Japan). All the cell suspensions were diluted appropriately so that the optical density value (OD600) could fall between 0.1 and 0.5. The liquid LB media added with corresponding concentrations of HM were prepared to subtract the background. The results were monitored values multiplied by the dilution factor.
The concentrations of SO42− in the medium were measured using a Wanyi IC-6000 ion chromatography (Anhui, China) equipped with a conductivity detector and an SI-55 4E anion exchange column (250 mm × 4.0 mm, 5 µm).
Removal of Cd and Pb
After incubation, the culture was centrifugated (3,000 × g for 6 min) and the supernatant solutions were filtered through 0.22 µm polyethersulfone membrane. The final concentrations of Cd and Pb were determined using an Agilent 700 series ICP-OES instrument. Standard solutions of Cd and Pb were 0, 10, 20, 40, 50, and 100 mg/L. The R square values of the calibration curves > 0.995. The removal rates of Cd and Pb were calculated based on the ICP results. The removal rate was calculated based on Equation (1):
| (1) |
where C0 is the initial concentration of HMs (mg/L) and Cf is the final concentration of HMs (mg/L).
Morphological and biochemical analyses
To investigate the distribution of Cd and Pb, TEM-EDS (Transmission Electron Microscopy Energy Dispersive Spectroscopy) and NanoSIMS (nano-scale secondary ion mass spectrometry) analyses were conducted. E. coli cells in the PbCd treatment were prepared and embedded with fresh resin for TEM (48, 96, and 144 h) analysis following our previous protocol (37). To reveal HM distribution in E. coli cells under binary stress, the cells after 96 h incubation were selected for NanoSIMS analysis.
For TEM analysis, 60–80 nm of ultrathin sections was cut on an Ultramicrotome Leica EM UC7 microtome mounted with a diamond cutter (Daitonme, Ultra 45°). Some samples were stained with uranyl acetate and lead citrate to obtain highquality images, while others were unstrained to avoid the disruption to Cd and Pb signals detected by energy dispersive spectrometer (EDS). For strained sections, TEM was performed by the Hitachi HT7700 system. For unstrained sections, TEM was performed by the FEI Tecnai G2 F20 system equipped with EDS.
For NanoSIMS (CAMECA NanoSIMS 50 L, France) analysis, 400 nm of semithin sections were cut, coated with Pt, and mounted on a silicon wafer. Pre-sputtering using a high primary beam current was conducted to remove surface contaminants. Secondary ions of 12C14N, 32S, 114Cd16O, and 208Pb16O were detected simultaneously using a Cs+ primary ion probe. The ion images were acquired using a dwell time of 1–3 ms/pixel, 256 × 256 pixels, and one cycle. For the sample, three regions were analyzed to obtain a reliable data basis for the calculation of the fate of 12C14N. The evaluated regions of interest (ROIs) were chosen according to the distribution of the 12C14N secondary ions as a cellular indicator. The threshold of the 12C14N intensity was used to generate the ROIs for cellular areas and non-cellular areas. While the matrix data of ROIs were applied to define the cellular and non-cellular S, Cd, and Pb signals, the matrix data of cellular and non-cellular S were overlapped with the data of Cd and Pb to determine the matching or non-matching rows of the ion distribution on the surface (54, 55).
For the investigation of the surficial biochemical components and morphological change, the cells were studied by Raman imaging and scanning electron microscopy (RISE) system. The RISE system (WITech, Germany) consists of an Alpha 300 confocal Raman microscope combined with an SEM (TESCAN-VEGA3). Both SEM and light microscopy (LM) images were acquired. E. coli cells applied for RISE were prepared following our previous protocol (56). The spectral region of 0–4500 cm−1 was recorded using a 488-nm laser (3 mW with 30 × 4 s scans). The spectra on the E. coli cells collected from CK and PbT treatments were averaged from five spectra, then normalized, and background subtracted using Origin 2023. The areas of Raman peaks were calculated using the peak fitting routine available in the WITech Project 5 software. The long axis length of E. coli cells was measured by ImageJ (1.54d), and the length was averaged based on >70 E. coli cells.
Transcriptomic analysis
Physiological responses under HM exposure are regulated with gene expression. E. coli cells with four metal exposure patterns (i.e., CK, CdT, PbT, and PbCd) were prepared for the RNA sequencing (RNA-Seq) analysis. Three independent repeated experiments were conducted for all the treatments. The concentration of 0.241 mmol/L was set for the CdT treatment to avoid the excessive stress under 2.41 mmol/L. With the binary stress of Cd and Pb, the cultures were collected after 0, 48, and 96 h incubation (denoted asPbCd0h, PbCd48h, and PbCd96h). Then, the bacterial cells were separated and stored at −80°C. RNA preparation, library construction, and sequencing were carried out via a commercially available service (BGI, Wuhan, China).
A total of 18 samples were tested with an average yield of 3.37G data per sample. The average alignment ratio of the sample comparison genome was 94.71%, and a total of 4,139 genes were detected. Raw reads for RNA sequencing were estimated by FastQC and trimmed to remove adapters and filter low-quality reads with SOAPnuke (v1.5.2). Then, HISAT2 (v2.0.4) was applied to align clean reads to the genome of Escherichia coli str. K-12 substr. MG1655. Bowtie2 (v2.2.5) was used to map the clean reads to the reference gene sequence (transcriptome) and then used RSEM (v1.2.8) to calculate the gene expression level of each sample. Differentially expressed genes (DEGs) were estimated using Deseq2 [q-value (adjusted P-value) ≤ 0.05] (56, 57). The KEGG pathway-based enrichment analysis was applied for the biological functions of genes.
RESULTS
Culture growth and HM removal rate
The OD600 value arrived at the maximum of 3.8 at 36 h in the CK treatment (Fig. 1A). The OD600 values were almost under the detection line for the CdT treatment (Fig. 1B), which indicated the strong toxicity of Cd. In the PbT, the maximum OD600 value was 5.4 at 60 h (Fig. 1C). Compared with CK, the growth curve of the PbT exhibited a lower slope during the exponential phase and showed higher OD600 values after 60 h. In addition, under the co-existence of Cd and Pb, E. coli demonstrated significantly higher activity than under sole Cd stress (see Fig. 1B vs. Fig. 1D). Furthermore, the initial concentration of sulfate in the medium was 1.62 mmol/L. After 48 h incubation, the concentration of sulfate decreased to 0.95 mmol/L in CK treatment, while to ~0.75 mmol/L with HM stress (Table S1).
Fig 1.
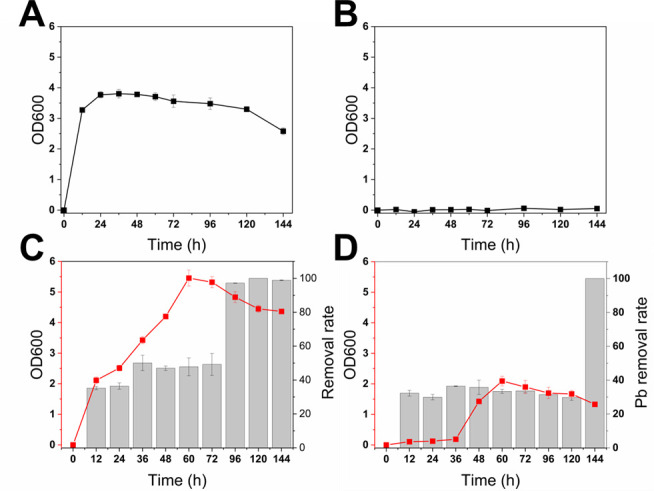
Physiological properties of E. coli cultures. Growth curves of E. coli cell density measured by OD600. (A) Growth curve of E. coli in the CK treatments. (B) Growth curve of E. coli in the CdT treatments. (C) Growth curve of E. coli and Pb removal rate in the PbT treatments. (D) Growth curve of E. coli and Pb removal rate in the PbCd treatments.
The HM removal rate has no evident change during 144 h incubation under sole Cd stress. In the PbT, the Pb removal rate increased from 12 h to 36 h, and it decreased slightly from 36 h to 72 h with a maximum of 50% (Fig. 1C). Then, the removal rates of Pb increased dramatically to >95% after 96 h. Under the co-existence of Cd and Pb, the removal rates ranged from 29% to 36% for Pb and 17% to 25% for Cd (from 12 to 120 h) as shown in Fig. 1D and Fig. S1. After 144 h inoculation, the removal rate of Pb increased dramatically to nearly 100%, while that of Cd was decreased to ~10%.
Morphology and sorption of HM by E. coli cells
The representative TEM and SEM images of the E. coli cells exposed to binary stress are investigated. A few E. coli cells were shown to be elongated after 48 h incubation under either TEM or SEM imaging (Fig. 2A ; Fig. S2 and S3). In addition, the average long axis length is 1.535, 1.932, 1.576, and 1.845 µm for the rod cell in CK, CdT, PbT, and PbCd treatments (based on SEM imaging), respectively. The maximum length is 2.707, 6.754, 3.174, and 4.766 µm for the rod cells in CK, CdT, PbT, and PbCd treatments (Fig. S3; Table S2). In addition, if the average length of the top 10% cells in CK treatment was set as the threshold, the percentages of elongated cells would be 4.00%, 21.62%, 4.04%, and 16.09% for CK, CdT, PbT, and PbCd treatments (Fig. S3; Table S2). However, limited elongated cells were observed during 96 to 144 h incubation (Fig. 2B and C). In addition, the lysed cell was observed to maintain its cellular framework, whereas the cytoplasm had flowed out in several cells (Fig. 3D). After 144 h, deformed and lysed cells were commonly present under TEM imaging (Fig. 2C). Extracellular HM particles were also observed after 96 h (Fig. 2B).
Fig 2.

TEM images of E. coli cells incubated for (A) 48 h, (B) 96 h, and (C) 144 h in the PbCd treatments.
Fig 3.
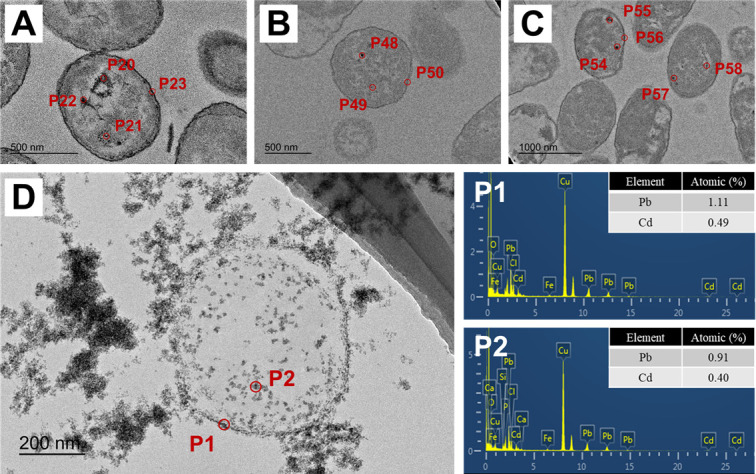
TEM images with EDS analysis on the sections of the E. coli cells in the PbCd treatment. (A–C) The typical EDS spots on the membrane and within the cytoplasm. (D) TEM image of a typical lysed cell (EDS spots on P1 and P2).
TEM-EDS was applied to investigate the HM nanoparticles on the cell membrane and within the cytoplasm (Fig. 3). A total of 58 EDS spots were performed, with that the spots on the cell membrane and within the cytoplasm were selected for analysis (see Table 1). At stages of 48, 96, and 144 h incubation, the Cd and Pb signals on the cell membrane were under the detection line (Table 1). The weak intracellular HM signals were determined after 48 h incubation. However, with the increase of exposure time, the concentration of intracellular HMs was significantly elevated (Table 1). The EDS results in Fig. 3D confirmed that the lysed cells could also fix dense HM nanoparticles (primarily Pb cations).
TABLE 1.
EDS results of the spots on the membrane and cytoplasm (shown as atomic percentages). E. coli cells were incubated for 48 h, 96 h, and 144 h in the PbCd treatmentsa
| 48 h | 96 h | 144 h | |||||||
|---|---|---|---|---|---|---|---|---|---|
| Pb | Cd | Pb | Cd | Pb | Cd | ||||
| On the membrane | M1 | 0.09 | 0.06 | M6 | ND | 0.07 | M11 | ND | 0.09 |
| M2 | ND | 0.01 | M7 | ND | ND | M12 | ND | 0.07 | |
| M3 | ND | ND | M8 | ND | ND | M13 | ND | 0.05 | |
| M4 | ND | ND | M9 | ND | ND | M14 | ND | ND | |
| M5 | ND | 0.01 | M10 | ND | ND | M15 | ND | ND | |
| Within the cytoplasm | C1 | 0.02 | 0.02 | C13 | 0.43 | 0.55 | C19 | 0.05 | 0.38 |
| C2 | 0.01 | 0.01 | C14 | 0.11 | 0.11 | C20 | ND | 0.19 | |
| C3 | 0.01 | 0.01 | C15 | 0.05 | 0.09 | C21 | ND | 0.18 | |
| C4 | ND | 0.02 | C16 | 0.07 | 0.07 | C22 | ND | 0.13 | |
| C5 | ND | 0.02 | C17 | ND | 0.12 | C23 | ND | 0.08 | |
| C6 | ND | 0.02 | C18 | ND | 0.07 | C24 | ND | 0.08 | |
| C7 | ND | 0.02 | C25 | ND | 0.08 | ||||
| C8 | ND | 0.01 | C26 | ND | 0.08 | ||||
| C9 | ND | 0.01 | C27 | ND | ND | ||||
| C10 | ND | ND | C28 | ND | ND | ||||
| C11 | ND | ND | |||||||
| C12 | ND | ND | |||||||
ND denotes under the detection line.
Raman spectra on single cells
The Raman spectra on the cells cultivated with or without Pb stress were shown in Fig. 4. The data showed two broad peaks at ~1,340 and ~1,584 cm−1. Deconvolution of those two spectral features provided peaks at ~1,340, ~1,455, and ~1,585 cm−1 (Fig. 4D and E). The ~1,340 and ~1,455 cm−1 peaks were assigned to C–H signals in proteins (58), while the Raman peak at 1,585 cm−1 was the indicator of nucleic acids (59). The ratios (by area) of 1,340/1,585 cm−1 and 1,455/1,585 cm−1 peaks were 0.182 and 0.862 in the CK treatment, while 0.135 and 0.702 in the PbT treatment. These suggested the decline of the abundance of cellular proteins. For the PbT, the FWHM (full widths at half maximum) of the ~1,340, ~1,455, and ~1,585 cm−1 bands were wider than those in the spectrum of CK (Table 2), which indicated a greater degree of atomic disorder on the cell surface. The Raman analysis on the samples collected from the treatments with Cd addition showed high fluorescence, which did not allow accurate analysis (Fig. S4).
Fig 4.
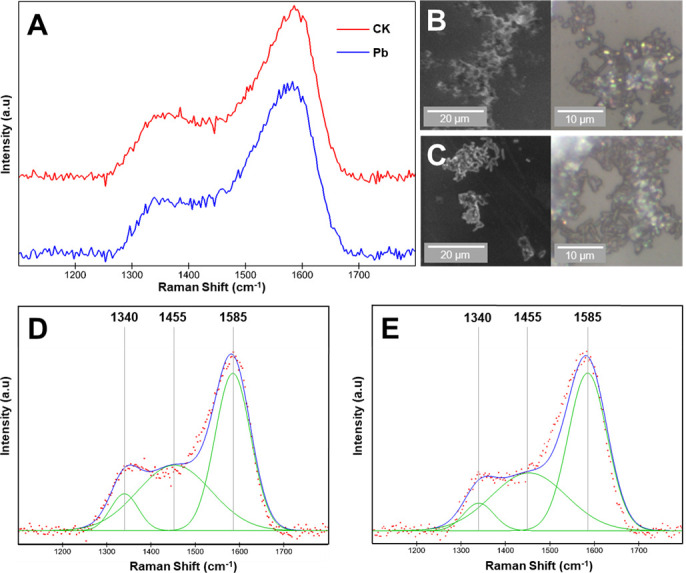
Raman spectra and imaging on the same E. coli cells. (A) Raman spectra on the bacterial cells collected from CK and PbT treatments. Each spectrum was averaged from five spectra. (B) The E. coli cells from CK treatment under SEM (left) and LM (right) modes. (C) The E. coli cells from the PbT treatment under SEM (left) and LM (right) modes. (D) Peak fitting of the Raman spectra on the E. coli cells from CK treatment. (E) Peak fitting of the Raman spectra on the E. coli cells from PbT treatment.
TABLE 2.
Full widths at half maximum (FWHM) of 1,340, 1,455, and 1,585 cm−1 fitted peaks of Raman spectra in E. coli cells for the CK and PbT. Ratios (by area) of 1,340/1,585 cm−1 and 1,455/1,585 cm−1 peaks indicate the relative abundance of different components
| Peak position (cm−1) | CK | PbT | |
|---|---|---|---|
| FWHM | 1,340 | 73.57 | 80.06 |
| 1,455 | 195.86 | 197.80 | |
| 1,585 | 94.72 | 103.38 | |
| Ratio (by area) in to the 1,585 cm−1 | 1,340 | 0.182 | 0.135 |
| 1,455 | 0.862 | 0.702 |
NanoSIMS analysis
The NanoSIMS images of 12C14N depicted the location and morphology of E. coli cells (Fig. 5A, E and I). The 12C14N and 32S signals of non-cellular areas illustrated the appearance of extracellular organic matters, which may be effluent from lysed cells or eluted extracellular organic compounds (such as exoenzyme, EPS, and necrotic biomass). The NanoSIMS analysis also presented the distribution of 114Cd16O and 208Pb16O, with no evident aggregates observed (Fig. 5C, D, G, H, K and L). The quantitative difference between Cd and Pb was not reflected by NanoSIMS analysis because of their similar chemical properties. Based on the ROIs for cellular areas and non-cellular areas, we confirmed that most 114Cd16O and 208Pb16O were closely coupled with 32S in extracellular regions (see Table 3). Although relatively weak 114Cd16O and 208Pb16O was observed on cellular areas, they all also overlapped with 32S in all analyzed regions.
Fig 5.

NanoSIMS imaging on the E. coli cells incubated for 96 h in the PbCd treatment. Secondary ions of (A, E, and I) 12C14N, (B, F, and J) 32S, (C, G, and K) 114Cd16O, and (D, H, and L) 208Pb16O were analyzed.
TABLE 3.
Quantification of exposed two-dimensional areas visible by NanoSIMS
| Clustered 114Cd16O covered by 32S % | Clustered 208Pb16O covered by 32S % | |||
|---|---|---|---|---|
| Non-cellular areas | Cellular areas | Non-cellular areas | Cellular areas | |
| Region 1 | 81.09 | 100.00 | 85.41 | 100.00 |
| Region 2 | 78.62 | 100.00 | 88.74 | 100.00 |
| Region 3 | 77.44 | 100.00 | 87.13 | 100.00 |
Transcriptomic responses
There were 3,774 co-expressed genes within all the treatments (i.e., CK, CdT, PbT, and PbCd) (Fig. S5). To reveal key gene clusters involved in E. coli resistance to Cd and Pb, four comparison groups (i.e., CdT vs. CK, PbT vs. CK, PbCd48h vs. PbCd0h, and PbCd96h vs. PbCd0h comparison) were selected for transcription profiling analysis. Among the intersection of DEGs within all the groups, the KEGG enrichment showed that the sulfur metabolism was one of the top 20 enriched pathways (Fig. S5; Table S3). Moreover, the sulfur metabolism was significantly enhanced in the KEGG enrichment of the co-expressed genes in all the treatments.
The key gene cluster was selected based on the KEGG enrichment. As shown in Fig. 6A, the sulfate transport system and the assimilatory sulfate reduction are involved in this process. Active transport system of extracellular sulfate contains two ATP-binding cassette transporters (CysP, CysU, CysW, CysA, and Sbp) (60). In the assimilatory sulfate reduction, the intracellular sulfate is converted to APS by sulfate adenylyltransferase (CysN and CysD), then to PAPS by adenylylsulfate kinase (CysC), to sulfite by phosphoadenylyl-sulfate reductase (CysH), and eventually to sulfide by assimilatory sulfite reductase (CysJ and CysI) (61–63). The expression of these key genes was all upregulated in the treatments with Pb addition, with respect to the Ck treatment. In contrast, only part of key genes was upregulated in the CdT vs. CK comparison. In particular, the Sbp encoding a substrate-binding protein was downregulated in the CdT treatment. Furthermore, the key gene cluster was significantly upregulated with Log2 (fold change) > 1 in both PbCd48h vs. PbCd0h and PbCd96h vs. PbCd0h comparison.
Fig 6.

Key genes of sulfur metabolism that responds to exogenous stress in E. coli. (A) The pathway of assimilatory sulfate reduction. The metabolic pathways, related enzymes, and genes are indicated. The pathway was adapted from the KEGG pathway 00920 (sulfur metabolism). APS, adenylyl sulfate; PAPS, 3′-phosphoadenylyl sulfate. (B) The heatmap illustrates the fold change of gene expression (Sbp, CysP, CysU, CysW, CysA, CysN, CyD, CyC, CyH, CyJ, and CyI) in all samples exposed to HMs based on RNA-Seq.
DISCUSSION
The Cd caused extremely low growth of the cells at an appropriate concentration (2.41 mmol/L), whereas the cells maintained typical growth under the same initial concentration of Pb (Fig. 1A and B). This is due to the fact that microorganisms usually show a lower tolerance to Cd(II) than to Pb(II) (22, 26). Cd has a low electronegativity and ionic radius, which could be bound to negatively charged groups, e.g., cyanide and carboxyl in organic matters (64). Then, the enzyme would be inactivated and ROS elimination would be disturbed (1, 2). In addition, the covalent bonding index of Cd(II) is close to that of Fe(II) (11). Subsequently, Cd would be involved in Fe-S clusters to accelerate the intracellular Fenton reaction. Therefore, Cd exposure could cause apoptosis in the short term of incubation. The S metabolism might work as an active part of the microbial responses to Cd stress. In contrast, under sole Pb stress, E. coli could maintain intracellular homeostasis. This process also accompanied the offset of protein loss on the cells (Table 2), which would further alleviate the HM toxicity.
The morphological evidences showed that the cells under the co-existence of Pb and Cd would swell at the early stage of growth (Fig. 2A; Fig S1). The size of microbial cells was enlarged to decrease surface/volume ratio, which would help cells to temporarily minimize exogenous stress (to reduce the bioaccumulation in a specific area) (65, 66). The addition of Cd significantly promoted cell elongation (from ~4% to >15% level), which was consistent with our previous study of Cd stress (22). However, this morphological change was an expedient pathway of HM tolerance, i.e., limited elongated cells were identified and more lysed cells were observed at subsequent stage of growth.
The removal and bioaccumulation of HM by E. coli cells indicated dynamic competition under the co-existence of Cd and Pb. In the PbCd treatment, the maximum Cd removal rates were <25%, significantly lower than those of Pb (>98%). In contrast, Pb accumulation was intensified during incubation. This was because competitive sorption with Pb prevented the occupation of the available sites for Cd, which protected the cells from the strong Cd stress. Under sole Pb stress, Raman analysis confirmed the cellular loss of proteins (Table 2). The cells might release the proteins to capture free HMs, which also explains that the Pb removal rate in PbT cultures could reach a high level. Meanwhile, the key gene cluster was shown to be upregulated in both the PbT and PbCd treatments (Fig. 6B). With altered transcription levels and more bacterial cells in PbT cultures, S compounds were synthesized and enriched for HM sequestration (see Fig. 1C and D). The HM accumulation onto increasing necrotic cells would drive the removal of residual Pb. Therefore, the Pb removal of PbT treatment reached the highest rate earlier than in the PbCd treatment.
The expression of the key gene cluster resulted in the rapid uptake of sulfate and enhancement of the assimilatory pathway. The metal stress significantly decreased S concentrations (Table S1). Furthermore, the valence state of S was reduced from +6 in sulfate to −2 in sulfide, and cellular HMs and S were spatially overlapping based on NanoSIMS results (Table 3). There evidences might indicate the biosynthesis of S-containing amino acids rather than direct excretion of sulfide. For downstream genes, the uptake of sulfates results in their conversion to sulfides and subsequently to S-containing amino acids (methionine and cysteine) (Fig. 6A). The newly assimilated sulfides would further react with free HM cations to form metal sulfide precipitates (67, 68). The additional sorption sites for HMs include cysteine- and methionine-containing free proteins and polypeptides in the cytoplasm. Therefore, biosynthetic S compounds fundamentally contributed to HM sequestration (based on NanoSIMS, TEM-EDS, and RNA-Seq results). Moreover, the production and consumption of S compounds, especially the Fe-S clusters as versatile cofactors, are an important process to replace damaged biomolecules and restore the cellular homeostasis (69, 70).
The regulation of those DEGs was different in HM exposure patterns (Fig. 6B). Although Cd is considered as a robust modulator of the ubiquitination process in the sulfur metabolism, only some sulfur metabolism genes responded to sole Cd stress (71). In contrast, all key genes were upregulated in treatments with Pb addition. Pb was a better modulator to positively regulate the sulfur metabolism than Cd. Thus, after 96 h incubation, the concentration of sulfate increased to ~1.01 mmol/L in CdT treatment, while kept ~0.75 mmol/L in PbT and PbCd treatments. Therefore, Pb addition would enhance microbial resistance to exogenous Cd by remodeling of the sulfur metabolism in E. coli. Together with the changes of the S concentration, we observed that the correlation between the expression of the key gene cluster resulted in the rapid uptake of sulfate.
The tolerance and resistance mechanisms would be different between bacteria and fungi. The E. coli cell showed a lower sorption capacity for Cd compared with Pb, in agreement with our previous fungal studies (25, 72). EPS are critical components for immobilization of extracellular HM. The EPS yield (per cell) of bacterial cells is usually lower than that of fungi (31, 73). Furthermore, based on NanoSIMS imaging, no intense aggregation of heavy metal was observed in the E. coli sample, whereas it was evident the cellular region of fungal (74). It might be ascribed to that bacteria have not evolved membrane compartmentalization as eukaryote, which impedes their ability to accumulate and transport HM via intracellular organs (30, 75). From the genetic view, gene clusters encoding metal transporter and energy metabolism of eukaryotes show a different regulatory pattern from E. coli in response to HM stress (76, 77). Eukaryotic organisms tend to develop a complex metal transporter system for metal homeostasis. Therefore, biogenic sulfur-containing compounds might contribute more to the bacterial immobilization of HMs, and HM accumulation on the membrane system is relatively weak.
Highlights
Cd(II) cations induced strong cytotoxicity on growth of E. coli cells.
Addition of appropriate Pb(II) showed a stimulating effect on microbial bioactivity.
Spatial coupling of intracellular S and metals was confirmed by NanoSIMS.
The biosorption of Pb was more intense with addition of Cd.
Sulfur assimilation of E. coli was promoted by polymetallic stress.
ACKNOWLEDGMENTS
This work was supported by the National Key R&D Program of China (2022YFF0800304, 2023YFC3707600), Opening Fund of the State Key Laboratory of Environmental Geochemistry (SKLEG2023208), and Key Laboratory of Eco-geochemistry, Ministry of Natural Resources (No. ZSDHJJ202201). We would like to thank Ms. Jiani Chen for the assistance of the TEM analysis.
Contributor Information
Zhen Li, Email: lizhen@njau.edu.cn.
John R. Spear, Colorado School of Mines, Golden, Colorado, USA
SUPPLEMENTAL MATERIAL
The following material is available online at https://doi.org/10.1128/aem.01453-23.
Table S1 (The concentrations of SO42- in the medium in CK, CdT [0.241 mmol/L], PbT, and PbCd treatments), Table S2 (Quantification of cell elongation), Table S3 (KEGG enrichment analysis of DEGs in four comparison groups [top 20 enriched pathways]), Figure S1 (Growth curve of E. coli and Cd removal rate in the PbCd treatments), Figure S2 (TEM images of E. coli cells), Figure S3 (SEM images of E. coli cells incubated for 48 h in CK, CdT [0.241 mmol/L], PbT, and PbCd treatments), Figure S4 (Raman spectra on the E. coli cells collected from CK, PbT, CdT [0.241 mmol/L], and PbCd treatments), and Figure S5 (Characterization of the transcriptome dataset).
ASM does not own the copyrights to Supplemental Material that may be linked to, or accessed through, an article. The authors have granted ASM a non-exclusive, world-wide license to publish the Supplemental Material files. Please contact the corresponding author directly for reuse.
REFERENCES
- 1. Etesami H. 2018. Bacterial mediated alleviation of heavy metal stress and decreased accumulation of metals in plant tissues: mechanisms and future prospects. Ecotoxicol Environ Saf 147:175–191. doi: 10.1016/j.ecoenv.2017.08.032 [DOI] [PubMed] [Google Scholar]
- 2. Rahman Z, Singh VP. 2019. The relative impact of toxic heavy metals (THMs), (arsenic (As), cadmium (Cd), chromium (Cr)(VI), mercury (Hg), and lead (Pb)) on the total environment: an overview. Environ Monit Assess 191:419. doi: 10.1007/s10661-019-7528-7 [DOI] [PubMed] [Google Scholar]
- 3. Mercier G, Chartier M, Couillard D, Blais JF. 1999. Decontamination of fly ash and used lime from municipal waste incinerator using Thiobacillus ferrooxidans. Environ Manage 24:517–528. doi: 10.1007/s002679900251 [DOI] [PubMed] [Google Scholar]
- 4. Abba ZA, Yahaya S, Ahmad SA, Ramírez-Moreno N, Yusuf I, Bayero University Kano . 2020. Bioremediation of heavy metals by melanised and non-melanised feathers and heavy metal resistant feather-degrading bacteria. Rev Mex Ing Quim 19:243–252. doi: 10.24275/rmiq/Bio1551 [DOI] [Google Scholar]
- 5. Jin YY, Luan YN, Ning YC, Wang LY. 2018. Effects and mechanisms of microbial remediation of heavy metals in soil: a critical review. Applied Sciences 8:1336. doi: 10.3390/app8081336 [DOI] [Google Scholar]
- 6. Li GL, Zhou CH, Fiore S, Yu WH. 2019. Interactions between microorganisms and clay minerals: new insights and broader applications. Applied Clay Science 177:91–113. doi: 10.1016/j.clay.2019.04.025 [DOI] [Google Scholar]
- 7. Gadd GM. 2004. Microbial influence on metal mobility and application for bioremediation. Geoderma 122:109–119. doi: 10.1016/j.geoderma.2004.01.002 [DOI] [Google Scholar]
- 8. He J, Yang W, Li H, Xu L, Ni X, Tan B, Zhao Y, Wu F, Gomory D. 2015. Forest gaps inhibit Foliar litter PB and CD release in winter and inhibit PB and CD accumulation in growing season in an alpine forest. PLoS ONE 10:e0131528. doi: 10.1371/journal.pone.0131528 [DOI] [PMC free article] [PubMed] [Google Scholar]
- 9. Geisen S, Wall DH, van der Putten WH. 2019. Challenges and opportunities for soil biodiversity in the anthropocene. Curr Biol 29:R1036–R1044. doi: 10.1016/j.cub.2019.08.007 [DOI] [PubMed] [Google Scholar]
- 10. Desjardins K, Khadra M, Caron A, Ponton DE, Rosabal M, Amyot M. 2022. Significance of chemical affinity on metal subcellular distribution in yellow perch (Perca flavescens) livers from Lake Saint-Pierre (QUEBEC, Canada). Environ Pollut 312:120077. doi: 10.1016/j.envpol.2022.120077 [DOI] [PubMed] [Google Scholar]
- 11. Duffus JH. 2002. "Heavy metals" a meaningless term? (IUPAC Technical Report) 74:793–807. doi: 10.1351/pac200274050793 [DOI] [Google Scholar]
- 12. Nieboer E, Richardson DHS. 1980. The replacement of the nondescript term ‘heavy metals’ by a biologically and chemically significant classification of metal ions. Environmental Pollution Series B, Chemical and Physical 1:3–26. doi: 10.1016/0143-148X(80)90017-8 [DOI] [Google Scholar]
- 13. Price NM, Morel FMM. 1990. Cadmium and cobalt substitution for zinc in a marine diatom. Nature 344:658–660. doi: 10.1038/344658a0 [DOI] [Google Scholar]
- 14. Jaishankar M, Tseten T, Anbalagan N, Mathew BB, Beeregowda KN. 2014. Toxicity, mechanism and health effects of some heavy metals. Interdiscip Toxicol 7:60–72. doi: 10.2478/intox-2014-0009 [DOI] [PMC free article] [PubMed] [Google Scholar]
- 15. Ayangbenro AS, Babalola OO. 2017. A new strategy for heavy metal polluted environments: a review of microbial biosorbents. Int J Environ Res Public Health 14:94. doi: 10.3390/ijerph14010094 [DOI] [PMC free article] [PubMed] [Google Scholar]
- 16. Nies DH. 1999. Microbial heavy-metal resistance. Appl Microbiol Biotechnol 51:730–750. doi: 10.1007/s002530051457 [DOI] [PubMed] [Google Scholar]
- 17. Trevors JT, Stratton GW, Gadd GM. 1986. Cadmium transport, resistance, and toxicity in bacteria, algae, and fungi. Can J Microbiol 32:447–464. doi: 10.1139/m86-085 [DOI] [PubMed] [Google Scholar]
- 18. Flora SJS, Mittal M, Mehta A. 2008. Heavy metal induced oxidative stress & its possible reversal by chelation therapy. Indian J Med Res 128:501–523. [PubMed] [Google Scholar]
- 19. Lund BO, Miller DM, Woods JS. 1993. Studies on Hg(II)-induced H2O2 formation and oxidative stress in vivo and in vitro in rat kidney mitochondria. Biochem Pharmacol 45:2017–2024. doi: 10.1016/0006-2952(93)90012-l [DOI] [PubMed] [Google Scholar]
- 20. Rajendran P, Muthukrishnan J, Gunasekaran P. 2003. Microbes in heavy metal remediation. Indian J Exp Biol 41:935–944. [PubMed] [Google Scholar]
- 21. Hattori H. 1992. Influence of heavy-metals on soil microbial activities. Soil Science and Plant Nutrition 38:93–100. doi: 10.1080/00380768.1992.10416956 [DOI] [Google Scholar]
- 22. Jiang ZQ, Jiang L, Zhang L, Su M, Tian D, Wang T, Sun YL, Nong Y, Hu SJ, Wang SM, Li Z. 2020. Contrasting the Pb (II) and Cd (II) tolerance of Enterobacter sp. via its cellular stress responses. Environ Microbiol 22:1507–1516. doi: 10.1111/1462-2920.14719 [DOI] [PubMed] [Google Scholar]
- 23. You S-J, Tsai Y-P, Huang R-Y. 2009. Effect of heavy metals on nitrification performance in different activated sludge processes. J Hazard Mater 165:987–994. doi: 10.1016/j.jhazmat.2008.10.112 [DOI] [PubMed] [Google Scholar]
- 24. Bhardwaj R, Gupta A, Garg JK. 2018. Impact of heavy metals on inhibitory concentration of Escherichia coli-a case study of river Yamuna system, Delhi, India. Environ Monit Assess 190:674. doi: 10.1007/s10661-018-7061-0 [DOI] [PubMed] [Google Scholar]
- 25. Qiu JJ, Song XW, Li SS, Zhu BH, Chen YT, Zhang L, Li Z. 2021. Experimental and modeling studies of competitive Pb (II) and Cd (II) bioaccumulation by Aspergillus niger. Appl Microbiol Biotechnol 105:6477–6488. doi: 10.1007/s00253-021-11497-3 [DOI] [PubMed] [Google Scholar]
- 26. Wang T, Zhang L, Li SS, Meng LZ, Su M, Wang ZJ, Nong Y, Sun YL, Wang SM, Li Z. 2022. Weakened CD toxicity to fungi under coexistence of Pb in solution. J Hazard Mater 426:127984. doi: 10.1016/j.jhazmat.2021.127984 [DOI] [PubMed] [Google Scholar]
- 27. Zheng Z, Zhou P, Wu Z. 2001. New advances in research of combined pollution. Ying Yong Sheng Tai Xue Bao 12:469–473. [PubMed] [Google Scholar]
- 28. Mendoza-Cózatl DG, Rangel-González E, Moreno-Sánchez R. 2006. Simultaneous Cd2+, Zn2+, and Pb2+ uptake and accumulation by photosynthetic Euglena gracilis. Arch Environ Contam Toxicol 51:521–528. doi: 10.1007/s00244-005-0207-4 [DOI] [PubMed] [Google Scholar]
- 29. Fulladosa E, Murat JC, Villaescusa I. 2005. Study on the toxicity of binary equitoxic mixtures of metals using the luminescent bacteria Vibrio fischeri as a biological target. Chemosphere 58:551–557. doi: 10.1016/j.chemosphere.2004.08.007 [DOI] [PubMed] [Google Scholar]
- 30. Jiang ZQ, Wang T, Sun YL, Nong Y, Tang LY, Gu TT, Wang SM, Li Z. 2020. Application of Pb(II) to probe the physiological responses of fungal intracellular vesicles. Ecotoxicol Environ Saf 194:110441. doi: 10.1016/j.ecoenv.2020.110441 [DOI] [PubMed] [Google Scholar]
- 31. Li J, Jiang Z, Chen S, Wang T, Jiang L, Wang M, Wang S, Li Z. 2019. Biochemical changes of polysaccharides and proteins within EPS under Pb(II) stress in Rhodotorula mucilaginosa. Ecotoxicology and Environmental Safety 174:484–490. doi: 10.1016/j.ecoenv.2019.03.004 [DOI] [PubMed] [Google Scholar]
- 32. Ilic D, Magnussen HM, Tirard M. 2022. Stress- regulation of SUMO conjugation and of other ubiquitin- like modifiers. Semin Cell Dev Biol 132:38–50. doi: 10.1016/j.semcdb.2021.12.010 [DOI] [PubMed] [Google Scholar]
- 33. Helbig K, Bleuel C, Krauss GJ, Nies DH. 2008. Glutathione and transition-metal homeostasis in Escherichia coli. J Bacteriol 190:5431–5438. doi: 10.1128/JB.00271-08 [DOI] [PMC free article] [PubMed] [Google Scholar]
- 34. Delalande O, Desvaux H, Godat E, Valleix A, Junot C, Labarre J, Boulard Y. 2010. Cadmium-glutathione solution structures provide new insights into heavy metal detoxification. FEBS J 277:5086–5096. doi: 10.1111/j.1742-4658.2010.07913.x [DOI] [PubMed] [Google Scholar]
- 35. Chaturvedi KS, Hung CS, Crowley JR, Stapleton AE, Henderson JP. 2012. The siderophore yersiniabactin binds copper to protect pathogens during infection. Nat Chem Biol 8:731–736. doi: 10.1038/nchembio.1020 [DOI] [PMC free article] [PubMed] [Google Scholar]
- 36. Sharma R, Bhardwaj R, Gautam V, Kohli SK, Kaur P, Bali RS, Saini P, Thukral AK, Arora S, Vig AP. 2018. Microbial siderophores in metal detoxification and therapeutics: recent prospective and applications, p 337–350. In Egamberdieva D, Ahmad P (ed), Plant Microbiome: Stress response. Vol. 5. [Google Scholar]
- 37. Tian D, Jiang Z, Jiang L, Su M, Feng Z, Zhang L, Wang S, Li Z, Hu S. 2019. A new insight into lead (II) tolerance of environmental fungi based on a study of Aspergillus niger and Penicillium oxalicum. Environ Microbiol 21:471–479. doi: 10.1111/1462-2920.14478 [DOI] [PubMed] [Google Scholar]
- 38. Eboigbodin KE, Biggs CA. 2008. Characterization of the extracellular polymeric substances produced by Escherichia coli using infrared spectroscopic, proteomic, and aggregation studies. Biomacromolecules 9:686–695. doi: 10.1021/bm701043c [DOI] [PubMed] [Google Scholar]
- 39. Sheng G-P, Xu J, Luo H-W, Li W-W, Li W-H, Yu H-Q, Xie Z, Wei S-Q, Hu F-C. 2013. Thermodynamic analysis on the binding of heavy metals onto extracellular polymeric substances (EPS) of activated sludge. Water Res 47:607–614. doi: 10.1016/j.watres.2012.10.037 [DOI] [PubMed] [Google Scholar]
- 40. Jang A, Kim SM, Kim SY, Lee SG, Kim IS. 2001. Effect of heavy metals (Cu, Pb, and Ni) on the compositions of EPS in biofilms. Water Sci Technol 43:41–48. [PubMed] [Google Scholar]
- 41. Fomina M, Gadd GM. 2014. Biosorption: current perspectives on concept, definition and application. Bioresour Technol 160:3–14. doi: 10.1016/j.biortech.2013.12.102 [DOI] [PubMed] [Google Scholar]
- 42. Fashola MO, Ngole-Jeme VM, Babalola OO. 2016. Heavy metal pollution from gold mines: environmental effects and bacterial strategies for resistance. Int J Environ Res Public Health 13:1047. doi: 10.3390/ijerph13111047 [DOI] [PMC free article] [PubMed] [Google Scholar]
- 43. Manara A, DalCorso G, Baliardini C, Farinati S, Cecconi D, Furini A. 2012. Pseudomonas putida response to cadmium: changes in membrane and cytosolic proteome. J Proteome Res 11:4169–4179. doi: 10.1021/pr300281f [DOI] [PubMed] [Google Scholar]
- 44. Guo XX, Shi DJ, Ru BG. 1996. Metallothionein and its studying trends in cyanobacterium. Progress in Biochemistry and Biophysics 23:237–239. [Google Scholar]
- 45. Dermont G, Bergeron M, Mercier G, Richer-Laflèche M. 2008. Soil washing for metal removal: a review of physical/chemical technologies and field applications. J Hazard Mater 152:1–31. doi: 10.1016/j.jhazmat.2007.10.043 [DOI] [PubMed] [Google Scholar]
- 46. Khazaeli MB, Mitra RS. 1981. Cadmium-binding component in Escherichia coli during accommodation to low levels of this ion. Appl Environ Microbiol 41:46–50. doi: 10.1128/aem.41.1.46-50.1981 [DOI] [PMC free article] [PubMed] [Google Scholar]
- 47. Jan AT, Azam M, Ali A, Haq QMR. 2014. Prospects for exploiting bacteria for bioremediation of metal pollution. Critical Reviews in Environmental Science and Technology 44:519–560. doi: 10.1080/10643389.2012.728811 [DOI] [Google Scholar]
- 48. Xu Y, Seshadri B, Bolan N, Sarkar B, Ok YS, Zhang W, Rumpel C, Sparks D, Farrell M, Hall T, Dong Z. 2019. Microbial functional diversity and carbon use feedback in soils as affected by heavy metals. Environ Int 125:478–488. doi: 10.1016/j.envint.2019.01.071 [DOI] [PubMed] [Google Scholar]
- 49. Kapoor V, Li X, Elk M, Chandran K, Impellitteri CA, Santo Domingo JW. 2015. Impact of heavy metals on transcriptional and physiological activity of Nitrifying bacteria. Environ Sci Technol 49:13454–13462. doi: 10.1021/acs.est.5b02748 [DOI] [PubMed] [Google Scholar]
- 50. Kizildag N. 2021. Determination of the effects of copper (Cu) and lead (Pb). Heavy metals on soil carbon and nitrogen mineralizations. Sains Malaysiana 50:2957–2964. doi: 10.17576/jsm-2021-5010-10 [DOI] [Google Scholar]
- 51. Dede G, Ozdemir S. 2016. Effects of elemental sulphur on heavy metal uptake by plants growing on municipal sewage sludge. J Environ Manage 166:103–108. doi: 10.1016/j.jenvman.2015.10.015 [DOI] [PubMed] [Google Scholar]
- 52. Wang M, Wang L, Shi H, Liu Y, Chen S. 2021. Soil bacteria, genes, and metabolites stimulated during sulfur cycling and cadmium mobilization under sodium sulfate stress. Environ Res 201:111599. doi: 10.1016/j.envres.2021.111599 [DOI] [PubMed] [Google Scholar]
- 53. Liu J, Zhu N, Zhang Y, Ren T, Shao C, Shi R, Li X, Ju M, Ma T, Yu Q. 2021. Transcription profiling-guided remodeling of sulfur metabolism in synthetic bacteria for efficiently capturing heavy metals. J Hazard Mater 403:123638. doi: 10.1016/j.jhazmat.2020.123638 [DOI] [PubMed] [Google Scholar]
- 54. Vogel C, Mueller CW, Höschen C, Buegger F, Heister K, Schulz S, Schloter M, Kögel-Knabner I. 2014. Submicron structures provide preferential spots for carbon and nitrogen sequestration in soils. Nat Commun 5:2947. doi: 10.1038/ncomms3947 [DOI] [PMC free article] [PubMed] [Google Scholar]
- 55. Du H, Huang Q, Zhou M, Tie B, Lei M, Wei X, Liu X, Yang Y. 2018. Sorption of Cu(II) by al hydroxide organo–mineral coprecipitates: microcalorimetry and nanosims observations. Chem Geol 499:165–171. doi: 10.1016/j.chemgeo.2018.09.026 [DOI] [Google Scholar]
- 56. Wang Z, Zhang Y, Jiang L, Qiu J, Gao Y, Gu T, Li Z. 2022. Responses of Rhodotorula mucilaginosa under Pb(II) stress: carotenoid production and budding. Environ Microbiol 24:678–688. doi: 10.1111/1462-2920.15603 [DOI] [PubMed] [Google Scholar]
- 57. Love MI, Huber W, Anders S. 2014. Moderated estimation of fold change and dispersion for RNA-Seq data with DESeq2. Genome Biol 15:550. doi: 10.1186/s13059-014-0550-8 [DOI] [PMC free article] [PubMed] [Google Scholar]
- 58. Noothalapati H, Sasaki T, Kaino T, Kawamukai M, Ando M, Hamaguchi H-O, Yamamoto T. 2016. Label-free chemical imaging of fungal spore walls by Raman microscopy and multivariate curve resolution analysis. Sci Rep 6:27789. doi: 10.1038/srep27789 [DOI] [PMC free article] [PubMed] [Google Scholar]
- 59. Prakash S, Timir T.. 2022. Advanced Spectroscopic Methods to Study Biomolecular Structure and Dynamics doi: 10.1016/C2021-0-01551-0. Elsevier United Kingdom. [DOI] [Google Scholar]
- 60. Sirko A, Hryniewicz M, Hulanicka D, Böck A. 1990. Sulfate and thiosulfate transport in Escherichia coli K-12: nucleotide sequence and expression of the cysTWAM gene cluster. J Bacteriol 172:3351–3357. doi: 10.1128/jb.172.6.3351-3357.1990 [DOI] [PMC free article] [PubMed] [Google Scholar]
- 61. Leyh TS, Vogt TF, Suo Y. 1992. The DNA sequence of the sulfate activation locus from Escherichia coli K-12. J Biol Chem 267:10405–10410. [PubMed] [Google Scholar]
- 62. Bick JA, Dennis JJ, Zylstra GJ, Nowack J, Leustek T. 2000. Identification of a new class of 5'-Adenylylsulfate (APS) reductases from sulfate-assimilating bacteria. J Bacteriol 182:135–142. doi: 10.1128/JB.182.1.135-142.2000 [DOI] [PMC free article] [PubMed] [Google Scholar]
- 63. Ostrowski J, Wu JY, Rueger DC, Miller BE, Siegel LM, Kredich NM. 1989. Characterization of the cysJIH regions of Salmonella typhimurium and Escherichia coli B: DNA sequences of cysI and cysH and a model for the siroheme-Fe4S4 active center of sulfite reductase hemoprotein based on amino acid homology with spinach nitrite reductase. J Biol Chem 264:15726–15737. [PubMed] [Google Scholar]
- 64. Kalmykova Y, Strömvall A-M, Steenari B-M. 2008. Adsorption of Cd, Cu, Ni, Pb and Zn on Sphagnum peat from solutions with low metal concentrations. J Hazard Mater 152:885–891. doi: 10.1016/j.jhazmat.2007.07.062 [DOI] [PubMed] [Google Scholar]
- 65. Chakravarty RB, Manna S, Ghosh KA, Banerjee PC. 2007. Morphological changes in an Acidocella strain in response to heavy metal stress. Research J of Microbiology 2:742–748. doi: 10.3923/jm.2007.742.748 [DOI] [Google Scholar]
- 66. Neumann G, Veeranagouda Y, Karegoudar TB, Sahin O, Mäusezahl I, Kabelitz N, Kappelmeyer U, Heipieper HJ. 2005. Cells of Pseudomonas putida and enterobacter sp. adapt to toxic organic compounds by increasing their size. Extremophiles 9:163–168. doi: 10.1007/s00792-005-0431-x [DOI] [PubMed] [Google Scholar]
- 67. Li Y, Zhao Q, Liu M, Guo J, Xia J, Wang J, Qiu Y, Zou J, He W, Jiang F. 2023. Treatment and remediation of metal-contaminated water and groundwater in mining areas by biological sulfidogenic processes: a review. J Hazard Mater 443:130377. doi: 10.1016/j.jhazmat.2022.130377 [DOI] [PubMed] [Google Scholar]
- 68. Xing S-C, Mi J-D, Chen J-Y, Xiao L, Wu Y-B, Liang JB, Zhang L-H, Liao X-D. 2019. The metabolism and morphology mutation response of probiotic Bacillus coagulans for lead stress. Sci Total Environ 693:133490. doi: 10.1016/j.scitotenv.2019.07.296 [DOI] [PubMed] [Google Scholar]
- 69. Bao P, Li G-X, Sun G-X, Xu Y-Y, Meharg AA, Zhu Y-G. 2018. The role of sulfate-reducing prokaryotes in the coupling of element biogeochemical cycling. Sci Total Environ 613:398–408. doi: 10.1016/j.scitotenv.2017.09.062 [DOI] [PubMed] [Google Scholar]
- 70. Findlay AJ. 2016. Microbial impact on polysulfide dynamics in the environment. FEMS Microbiol Lett 363:fnw103. doi: 10.1093/femsle/fnw103 [DOI] [PubMed] [Google Scholar]
- 71. Ozturk M, Metin M, Altay V, De Filippis L, Ünal BT, Khursheed A, Gul A, Hasanuzzaman M, Nahar K, Kawano T, Caparrós PG. 2021. Molecular biology of cadmium toxicity in Saccharomyces cerevisiae. Biol Trace Elem Res 199:4832–4846. doi: 10.1007/s12011-021-02584-7 [DOI] [PubMed] [Google Scholar]
- 72. Chen T, Shi Y, Peng C, Tang L, Chen Y, Wang T, Wang Z, Wang S, Li Z. 2022. Transcriptome analysis on key metabolic pathways in Rhodotorula mucilaginosa under Pb(II) stress. Appl Environ Microbiol 88:e02215-21. doi: 10.1128/aem.02215-21 [DOI] [PMC free article] [PubMed] [Google Scholar]
- 73. Sengupta D, Datta S, Biswas D. 2018. Towards a better production of bacterial exopolysaccharides by controlling genetic as well as physico-chemical parameters. Appl Microbiol Biotechnol 102:1587–1598. doi: 10.1007/s00253-018-8745-7 [DOI] [PubMed] [Google Scholar]
- 74. Pan S, Li Z, Wang J, Li X, Meng L, Chen Y, Su M, Li Z. 2022. Electron microscopic imaging and NanoSIMS investigation on physiological responses of Aspergillus niger under Pb(II) and Cd(II) stress. Front Bioeng Biotechnol 10:1096384. doi: 10.3389/fbioe.2022.1096384 [DOI] [PMC free article] [PubMed] [Google Scholar]
- 75. Richards A, Veses V, Gow NAR. 2010. Vacuole dynamics in fungi. Fungal Biology Reviews 24:93–105. doi: 10.1016/j.fbr.2010.04.002 [DOI] [Google Scholar]
- 76. Chen M, Wang L, Zheng X, Cohen M, Li X, McClure R. 2021. Cross-kingdom comparative transcriptomics reveals conserved genetic modules in response to Cadmium stress. mSystems 6:e01189-21. doi: 10.1128/mSystems.01189-21 [DOI] [PMC free article] [PubMed] [Google Scholar]
- 77. Hanikenne M, Krämer U, Demoulin V, Baurain D. 2005. A comparative inventory of metal transporters in the green alga Chlamydomonas reinhardtii and the red alga Cyanidioschizon merolae. Plant Physiol 137:428–446. doi: 10.1104/pp.104.054189 [DOI] [PMC free article] [PubMed] [Google Scholar]
Associated Data
This section collects any data citations, data availability statements, or supplementary materials included in this article.
Supplementary Materials
Table S1 (The concentrations of SO42- in the medium in CK, CdT [0.241 mmol/L], PbT, and PbCd treatments), Table S2 (Quantification of cell elongation), Table S3 (KEGG enrichment analysis of DEGs in four comparison groups [top 20 enriched pathways]), Figure S1 (Growth curve of E. coli and Cd removal rate in the PbCd treatments), Figure S2 (TEM images of E. coli cells), Figure S3 (SEM images of E. coli cells incubated for 48 h in CK, CdT [0.241 mmol/L], PbT, and PbCd treatments), Figure S4 (Raman spectra on the E. coli cells collected from CK, PbT, CdT [0.241 mmol/L], and PbCd treatments), and Figure S5 (Characterization of the transcriptome dataset).