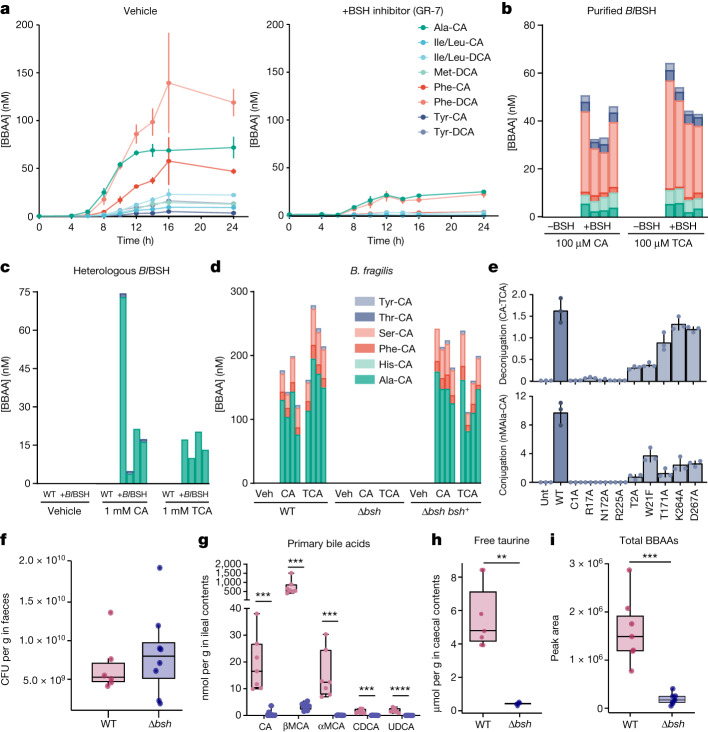
Fig. 2. Bacterial BSH has bile acid amine N-acyltransferase activity.
a, The pan-BSH inhibitor GR-7 attenuates conjugated bile acid production in B. longum NCTC 11818 cultures. Mean BBAA concentrations, quantified by targeted liquid chromatography with tandem mass spectrometry (LC–MS/MS), are shown with vertical lines indicating s.d. (n = 3 biologically independent bacterial cultures per treatment group). b, Purified BlBSH enzyme synthesizes BBAAs from 100 µM CA or TCA in vitro. c, E. coli transformed with a BlBSH expression vector produces BBAAs from 1 mM CA or TCA. d, BSH knockout in B. fragilis ablates the aminotransferase activity observed in wild-type (WT) B. fragilis NCTC 9343 with 1 mM CA or 1 mM TCA supplementation. Bars in b–d represent individual biological replicates (n = 4), with heights indicating BBAA concentrations. e, E. coli BL21(DE3) expressing mutated BlBSH at key active site residues exhibited altered deconjugation and conjugation activities. Deconjugation, indicated by the CA:TCA ratio, was assessed in M9 media with 1 mM TCA. Conjugation, measured through Ala-CA production, was evaluated in Luria–Bertani media with 1 mM TCA using LC–MS/MS. Controls included untransformed E. coli (Unt) and E. coli expressing unmutated BlBSH (WT). Bars represent mean values ± s.d. (n = 3 biologically independent bacterial cultures). f–i, Bile acid profile of germ-free C57BL/6 J mice monocolonized with B. fragilis WT or Δbsh strains (n = 7 for WT, n = 8 for Δbsh groups). CFUs per gram of B. fragilis in faeces after 7 days (f). Ileal contents primary bile acids quantified by LC–MS/MS (CA P = 2.3 × 10⁻⁴***, βMCA P = 1.3 × 10⁻⁴***, αMCA P = 3.7 × 10⁻⁴***, CDCA P = 1.1 × 10⁻⁴, UDCA P = 2.7 × 10⁻⁵****) (g). Free taurine levels in caecal contents quantified using 1H nuclear magnetic resonance (NMR) (P = 4.27 × 10⁻⁴***) (h). Sum of peak areas for all BBAAs in ileal contents measured by LC–MS/MS (P = 3.1 × 10⁻⁴***) (i). f–i, box plots depict first quartile and third quartile with median as centre and min–max values for whiskers, except for outliers calculated as data points ±1.5× interquartile range. Significant differences (P < 0.001***, P < 0.0001****) were determined by two-tailed t-tests. MCA, muricholic acid; UDCA, ursodeoxycholic acid.

