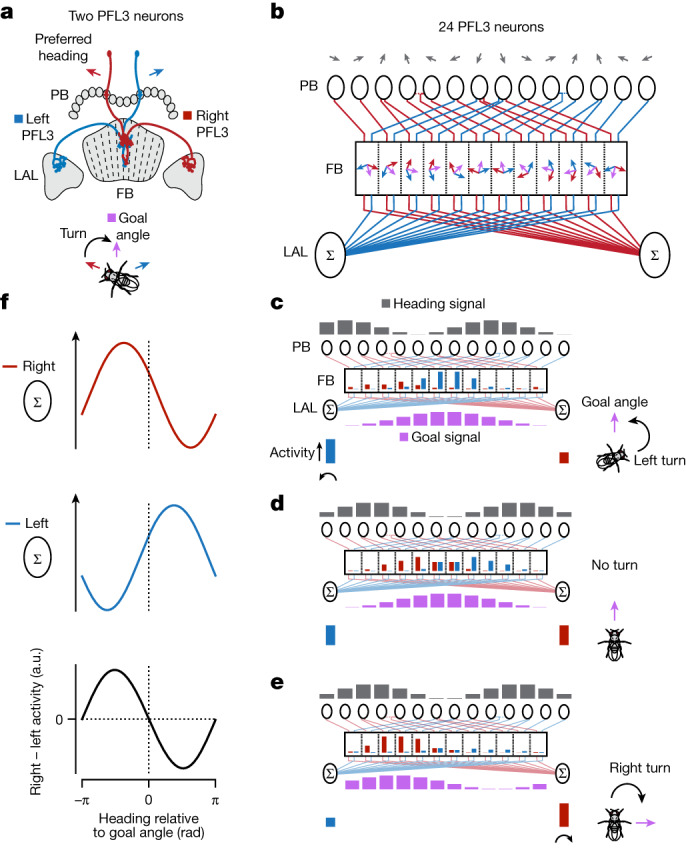
Fig. 4. Model for how PFL3 neurons compare heading and goal angles to generate a steering signal.

a, Schematic of two PFL3 neurons with offset preferred heading directions (red and blue arrows). The two cells project to a common column in the fan-shaped body. These two PFL3 cells could lead a fly to stabilize an allocentric goal angle midway between their preferred heading angles (purple arrow). b, Wiring diagram of all 24 PFL3 neurons in the fly brain13. Each grey arrow represents the preferred heading angle that a PFL3 neuron innervating a given glomerulus of the protocerebral bridge is expected to inherit from presynaptic heading-sensitive EPG and ∆7 neurons in that glomerulus (Extended Data Fig. 5a–g). Blue and red arrows represent the bridge-inherited, preferred heading angle Hpref of the left and right PFL3 neurons that innervate a given column in the fan-shaped body. Purple arrows represent each column’s preferred goal angle Gpref. c, Example heading and goal input bumps to the PFL3 population and the predicted output signal from individual PFL3 neurons and the PFL3 population. The neural signals in the schematic apply to the situation depicted by the fly on the right. Dark grey bar plots show the spatial activity pattern of the heading inputs to PFL3 cells in the bridge. The height of each bar is proportional to the cosine of the angle between the direction of the fly’s heading and the corresponding (grey) preferred heading arrow in b. Purple bar plots show the spatial activity pattern of goal (FC2) inputs to PFL3 cells in the fan-shaped body. The height of each bar is proportional to the cosine of the difference between the fly’s goal angle and the corresponding (purple) preferred goal angle of each column in b. Red and blue bar plots in the fan-shaped body represent the activity of individual PFL3 neurons, determined by a nonlinear function of their summed protocerebral bridge and fan-shaped body inputs. Red and blue bar plots below the sigma symbol indicate summed activity for left and right PFL3 neurons in the LAL. d,e, Same as c but for different heading and goal angles. f, Model-predicted, population-level activity in the right and left LAL (red and blue curves) and predicted turning signal (right-minus-left LAL activity, black curve).
