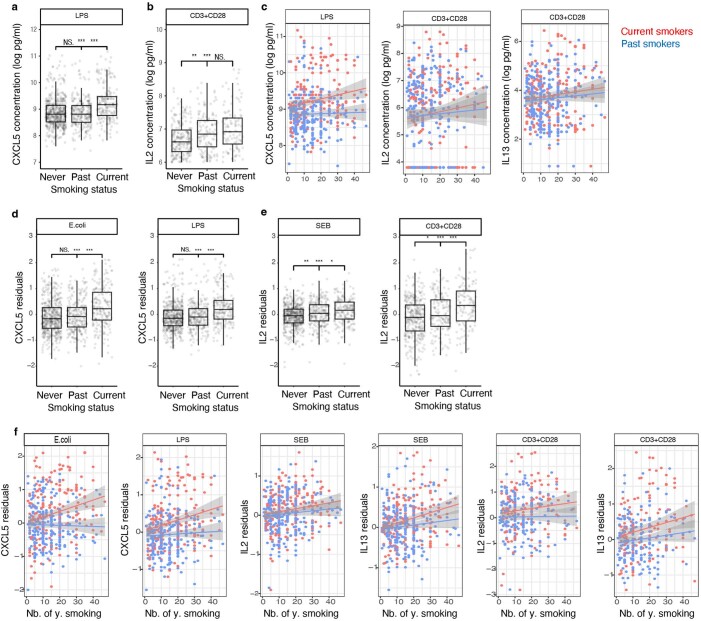
Extended Data Fig. 6. Smoking effect on innate and adaptive immune responses, represented by LPS and CD3 + CD28 stimulations respectively and same plots on residuals, after regression on age, sex and batchId.
a,b, CXCL5 concentration following LPS stimulation (a) and IL-2 concentration following anti-CD3 + CD28 stimulation (b) for never, past and current smokers. Boxplots represent n = 955 independent individuals. The centre line shows the median, hinges represent the 25th and 75th percentiles whiskers extend from the hinge to the largest or smallest value no further than 1.5 interquartile range. Significance of two-sided Wilcoxon rank sum tests adjusting for multiple comparisons is indicated with stars above the boxes on the left (between never and past smokers), in the middle (between never and current smokers) and on the right (between past and current smokers) (N.S, not significant; * P < 0.05, **P < 0.01, ***P < 0.001). P-values are from left to right, for CXCL5 in LPS: 0.74, 4.9e-13 and 4.7e-10 and for IL-2 in anti-CD3 + CD28: 3.8e-03, 2.4e-05 and 0.17. c,CXCL5 concentrations following LPS stimulation or IL-2 and IL-13 concentrations following anti-CD3 + CD28 stimulation versus numbers of years smoking for current smokers (red) or past smokers (blue). Grey areas depict the 0.95 confidence intervals of the linear regression lines. d–f, Residuals of CXCL5 following E. coli and LPS stimulations (d) or of IL-2 and IL-13 following SEB and anti-CD3 + CD28 stimulations (e) after regression on age, sex and batchId variables. Boxplots represent n = 955 independent individuals. The centre line shows the median, hinges represent the 25th and 75th percentiles, and whiskers extend from the hinge to the largest or smallest value no further than the 1.5 interquartile range.Significance of two-sided Wilcoxon Rank Sum tests adjusting for multiple comparisons is indicated with stars above the boxes on the left (between never and past smokers), in the middle (between never and current smokers) and on the right (between past and current smokers) (N.S, not significant; *P < 0.05, **P < 0.01, ***P < 0.001). P-values are from left to right, for CXCL5 in E.coli: 0.38, 7.1e-10 and 9.9e-07; for CXCL5 in LPS: 0.34, 7.5e-12 and 5.6e-08; for IL-2 in SEB: 1.4e-03,1.2e-07 and 4.2e-02 and for IL-2 in anti-CD3 + CD28: 0.026, 6.7e-09 and 9.8e-04. f, CXCL5 residuals following E.coli or LPS stimulation or IL-2 and IL-13 concentrations following SEB or anti-CD3 + CD28 stimulation versus the numbers of years smoking for current smokers (red) or past smokers (blue). Grey areas depict the 0.95 confidence intervals of the linear regression lines.

