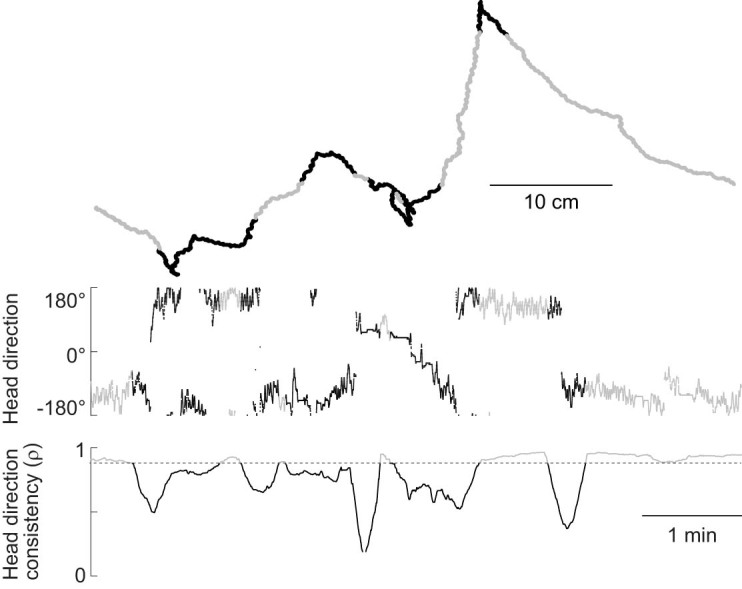
Extended Data Fig. 10. Path segmentation.

To obtain an accurate estimate of the fly’s current goal direction (θg), and thus an accurate estimate of directional error (θ - θg), we needed to identify moments when θg might switch. We reasoned that a switch in θg, would coincide with a dip in head direction consistency. Therefore, we looked for moments when p crossed a threshold value, and we broke the path into segments at those moments of threshold-crossing. This allowed us to segment a path into straight segments and to identify points where goal direction seemed to have switched. We used a threshold value of p = 0.88 because this produced results that corresponded to our visual impression of when the fly’s goal direction seemed to have changed, but we also confirmed that our conclusions are similar for a range of threshold values. Here we show an example path recorded over 10 min. Time points belonging to different segments are alternately shaded gray and black. Dotted line shows the threshold used to define these segments.
