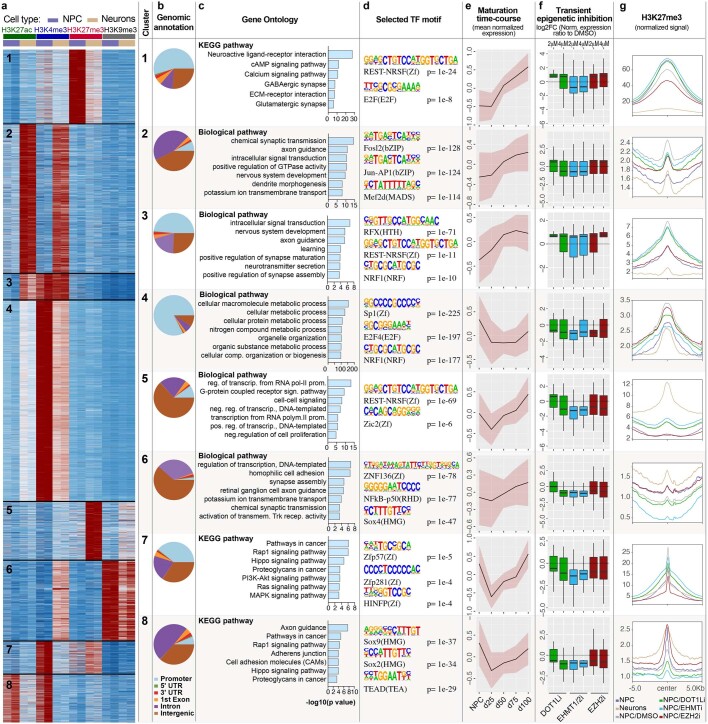
Extended Data Fig. 10. Patterns of histone post translational modifications drive the maturation of hPSC-derived neurons.
a, Unsupervised clustering of CUT&RUN peaks with differential density in H3K27ac, H3K4me4, H3K27me3 and H3K9me3 signal among NPC and neurons (n = 2 replicates/condition). b, Pie charts of CUT&RUN peaks mapped to gene promoters, introns, exons, and intergenic genomic regions for each of the cluster. c, GO for genes linked at each cluster. d, Top selected statistically significant enriched transcription factor motifs at peaks in each cluster. e, Mean normalized expression (z-transform) of differentially expressed genes during the maturation time course intersected with genes linked to each CUT&RUN cluster. Error bands are s.e.m. f, Expression of differentially expressed transcripts from (e) that were also differentially expressed in neurons derived from NPC treated with the indicated inhibitors compared to DMSO controls (data from RNAseq studies, n = 3 independent experiments). g, Normalized signal of H3K27me3 density in NPC treated with epigenetic inhibitors and untreated NPC and neurons. Pink area in (e) is s.e.m. Box plots in (f) depict the median as center bar, the boxes span 25th and 75th percentiles and whiskers are 1.5*interquartile range. Binomial test (d).

