

Summary
Differentiation is crucial for multicellularity. However, it is inherently susceptible to mutant cells that fail to differentiate. These mutants outcompete normal cells by excessive self-renewal. It remains unclear what mechanisms can resist such mutant expansion. Here, we demonstrate a solution by engineering a synthetic differentiation circuit in Escherichia coli that selects against these mutants via a biphasic fitness strategy. The circuit provides tunable production of synthetic analogs of stem, progenitor, and differentiated cells. It resists mutations by coupling differentiation to the production of an essential enzyme, thereby disadvantaging non-differentiating mutants. The circuit selected for and maintained a positive differentiation rate in long-term evolution. Surprisingly, this rate remained constant across vast changes in growth conditions. We found that transit-amplifying cells (fast-growing progenitors) underlie this environmental robustness. Our results provide insight into the stability of differentiation and demonstrate a powerful method for engineering evolutionarily stable multicellular consortia.
Keywords: synthetic biology, synthetic multicellularity, synthetic development, stem cells, differentiation, transit-amplifying cells, progenitors, stem cell niche, multicellular consortia, robustness, fitness landscape engineering
Graphical abstract
Highlights
-
•
Synthetic E. coli differentiation produces a stem-progenitor-differentiated lineage
-
•
Cell-autonomous coupling to an essential trait suppresses differentiation mutants
-
•
Fast-growing progenitors provide environmentally robust biphasic differentiation
-
•
Fitness landscape engineering guides long-term, environmentally robust behavior
Bacteria were engineered to produce analogs of stem, progenitor, and differentiated cells. Coupling differentiation to an essential trait generated a biphasic fitness landscape, suppressing mutant takeover and providing an environmentally robust differentiation rate.
Introduction
Differentiation is a fundamental multicellular trait.1,2,3,4,5,6,7,8,9 In simple organisms, cellular differentiation irreversibly produces daughter cells that have specialized function but that lose the ability to replicate.10,11 For example, the cyanobacterium Anabaena forms multicellular assemblies containing two cell types: self-renewing, stem-like vegetative cells that fix carbon and non-dividing differentiated heterocysts that fix nitrogen.10 When nitrogen is scarce, vegetative cells differentiate directly into heterocysts, which provide nitrogen for the rest of the colony. This irreversible process is accomplished genetically—by excision of genomic loci.10,12 Other examples of simple genetic differentiation, such as phase variation, are widespread in bacteria.11,13,14 In mammals, differentiation takes place not by genetic changes but by epigenetics, as in the case of hematopoiesis, which produces the various blood cell types in a multi-step, branching lineage with intermediate progenitor cells.2,3,15,16 In this work, we are inspired by the simple bacterial form of differentiation.
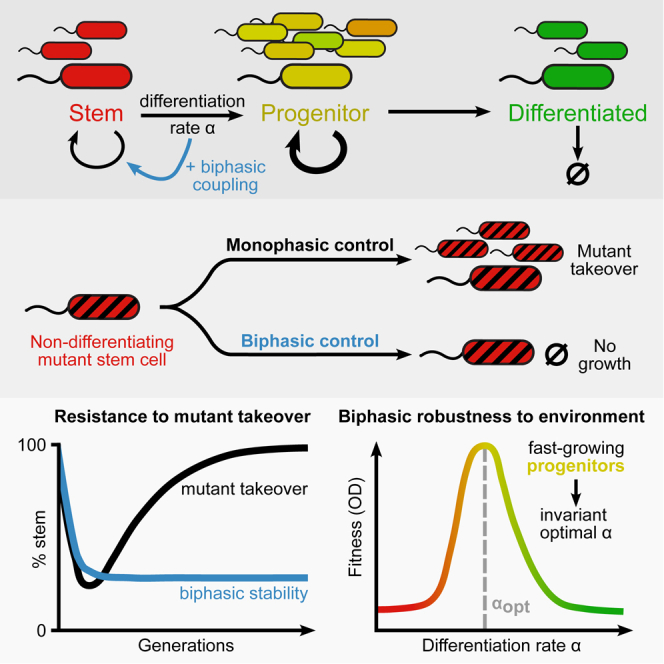
Despite its crucial importance, differentiation is inherently susceptible to loss of function. A mutant stem cell that does not differentiate has a proliferative advantage over other stem cells: it reproduces faster because more of its progeny are self-renewing.17,18,19 Such a mutant will thus outcompete properly differentiating stem cells (Figure 1A)—a process known as “mutant takeover.”17 This takeover is detrimental to the overall fitness of the organism due to a concomitant loss of appropriate cell-type ratios. For example, in certain leukemias, mutant hematopoietic stem cells with abnormally low differentiation rate outcompete non-mutant stem cells, causing a dearth of functional circulating blood cells.20,21 Mutant takeover is also a major concern in synthetic differentiation systems, which aim to produce multiple cell types for applications such as production of toxic proteins.22
Figure 1.

Synthetic differentiating E. coli with biphasic control yields a fitness curve with a non-zero optimal differentiation rate
(A) Schematic of biphasic and monophasic differentiating circuits. Stem cells (S) differentiate at a rate into differentiated cells (D) or self-renew at rate . Because D dies at a rate , while S does not, differentiation is inherently disadvantageous. In the monophasic case, zero differentiation () yields the maximum fitness. In the biphasic case, wherein stem cells reap a benefit from differentiation, a non-zero differentiation rate yields optimum fitness.
(B) Molecular detail of the biphasic differentiation circuit. Integrase, expressed in all cells, irreversibly cuts a target plasmid, removing trimethoprim resistance gene folA and simultaneously inducing the expression of the essential tryptophan-producing eznyme trpC.
(C) Population-level design of the differentiation circuit. Due to random replication and segregation of plasmids, progenitors can give rise to genetically “pure” stem cell descendants, which nonetheless inherit tryptophan and trpC in their cytoplasm. Such recently differentiated stem cells have a fitness advantage over non-differentiating, “mutant” stem cells S∗, which have no tryptophan.
(D) The circuit design has three primary experimental knobs controlled by external factors DAPG, trp, and TMP. DAPG induces the integrase expression that differentiates S to P to D. Some reversibility of P to S (dashed arrow) is possible due to random plasmid segregation (see [C]). S, P, and D growth can be tuned differentially by external trp and TMP due to their differing expression of trpC and folA.
(E) The engineered strain shows a biphasic fitness curve as a function of differentiation rate, as induced via DAPG, in low-trp (1.56 μM) high-TMP (25 ng/μL) media. Shaded areas are standard deviations across three replicates on separate days.
(F) Measurement of fraction of cut plasmids per cell at 48 h (see STAR Methods) supports the picture in (C), with progenitor states having the highest fitness. Concentrations of trp and TMP as in (E).
See also Figure S1.
Given this inherent susceptibility to mutants, there must be control mechanisms in place that prevent loss of stem cell differentiation via mutant takeover in natural systems.18 One proposed mechanism is antagonistic pleiotropy23,24: a trait (such as differentiation) that is naively disadvantageous to a cell can be stabilized by having a second essential or beneficial function. In such a case, loss of the ability to differentiate would give the mutant cell a selective disadvantage, thereby preventing mutant takeover.
Karin and Alon17 expanded the binary concept of antagonistic pleiotropy into a continuous one termed biphasic fitness (Figure 1A). In biphasic fitness, a quantitative trait such as differentiation rate increases fitness (i.e., overall proliferative capability) of the stem cell up to a point before the disadvantage takes over and fitness drops. Plotting stem cell fitness versus differentiation rate then includes both a rising phase and a falling phase (hence “biphasic”), with an optimal, non-zero differentiation rate. This is in contrast to the situation in which differentiation only reduces stem cell fitness, resulting in a monotonic dependence of fitness on differentiation rate (Figure 1A). Biphasic control has been studied in oncogenic mutants25,26,27,28,29,30 and population control circuits with no differentiation.31,32 In the context of differentiation, the concept of biphasic control has yet to be tested experimentally.
One approach to studying biphasic control of differentiation is to search for it in naturally occurring tissues. However, finding such a system can be challenging because natural biphasic regulation can be convoluted. For example, biphasic regulation can select for differentiation at early times but against differentiation at later times.24 This makes identifying natural biphasic regulation and testing its importance far from trivial. In contrast, a synthetic “build-to-understand” approach33,34 can be useful by allowing one to test the extent of mutant resistance in biphasic versus monophasic differentiation circuits in a controlled setting. One would expect the synthetic biphasic control to maintain differentiation by preventing the spread of non-differentiating stem cell mutants that arise rapidly in a monophasic circuit. A successful mutant resistance system could also be broadly applicable to evolutionary stability of synthetic circuits.35,36,37,38,39,40
Here, we engineer a synthetic differentiation circuit with intermediate progenitor states into Escherichia coli. We provided this strain with biphasic control, coupling differentiation to the expression of an essential gene. The engineered strain provides a controlled biological model to study biphasic stem cell differentiation. We use competition and evolution experiments to demonstrate the extent of mutant resistance provided by this control. Furthermore, by growing cultures in a variety of growth conditions, we probe the effect of environmental pressures on growth and differentiation rates. We find that biphasic control provides robustness to mutant takeover. Surprisingly, it is also robust to environmental changes, maintaining a nearly constant optimal differentiation rate across a wide range of conditions. We found that this environmental robustness is driven by transit-amplifying (fast-growing progenitor) states. Thus, we demonstrate that biphasic control can ensure a stable differentiation rate that is protected both from environmental variation and from mutant takeover.
Results
Biphasic circuit design based on integrase-driven differentiation
Inspired by natural differentiation in organisms such as Anabaena, we sought to design a synthetic circuit that irreversibly generates non-growing daughter cells (Figures 1B–1D). The design uses an integrase to irreversibly cut out a segment of DNA to generate differentiated cells—which are defined by the absence of this DNA segment. The excised DNA carries antibiotic resistance so that differentiated cells cannot divide in the presence of antibiotics. Biphasic fitness is introduced in the design by engineering the cutting process to induce the expression of an essential metabolic gene. Thus, losing differentiation is coupled to the loss of this essential metabolic function.
Specifically, we introduced a large serine integrase,41 A118, into E. coli via a plasmid that we call the integrase plasmid (Figure 1B). The integrase recognizes a pair of integration sites on a separate target plasmid and irreversibly removes the intervening sequence. We designed this sequence to contain a trimethoprim (TMP) resistance gene, Pseudomonadota folA. Differentiation corresponds to the action of the integrase. We define “stem cells” as those cells containing folA on uncut target plasmids and “differentiated cells” as those lacking folA. Thus, we expected that these stem cells can grow in the presence of TMP, whereas differentiated cells cannot.
To achieve biphasic control of differentiation, we engineered the cells so that the act of differentiation, namely, cutting out of the DNA segment, induces the expression of a gene that provides a fitness advantage (Figure 1B). To do so, we worked in a ΔtrpC strain auxotrophic for tryptophan (trp) and designed the target plasmid so that the integrase splices a copy of trpC in front of the pAra promoter that drives folA in uncut plasmids, thus coupling differentiation to the production of essential trp.
For this design to work, we anticipated that it would be important for the target plasmid to be present in multiple copies (Figure 1C). Multiple copies would be needed because with a single copy, stem cells would have no trpC and would not grow for lack of trp, whereas the differentiated cells would have no folA and would not grow for lack of TMP resistance. We therefore used a medium-copy (p15A) target plasmid.42 For integrase expression, we used a low-copy (pSC101) plasmid to lower the integrase-to-target ratio, aiming to generate a dynamic range of cut versus uncut plasmids as a function of integrase expression. This departs from previous synthetic uses of integrase for the generation of logic functions, which used single-copy targets with high integrase expression to avoid aberrant intermediate states.41,43,44
With a range of states (i.e., number of cut plasmids) available to cells, stemness now becomes a matter of degree rather than a binary feature—similar to sequential differentiation pathways with multiple progenitors.2,45 We thus define a “pure stem cell” as one with no cut plasmids, a “progenitor cell” as a cell with an intermediate number of cut plasmids, and a “fully differentiated cell” as a cell in which all plasmids are cut.
The biphasic design makes use of these multiple states by coupling integrase activity to the fitness of each state (Figure 1C). We expected that random replication and segregation of target plasmids into daughter cells can either increase or decrease stemness by producing cells with more or fewer uncut plasmids, respectively. This would result in a pool of stem and progenitor cells that are to some extent interchangeable, echoing state transitions in metazoan differentiation lineages.46,47
Fully differentiated cells—cells where all plasmid copies are cut—cannot return to this pool due to the irreversibility of the cutting process. These cells are thus terminally differentiated, and any remnant FolA protein inherited from progenitor parents will be diluted by cell division until growth is stopped by TMP. On the other hand, we anticipate that pure stem cells (lacking cut plasmids) will descend at some rate from progenitors. These stem cells would inherit TrpC cytoplasmically from progenitors, which would then be diluted out until further integrase activity induces trpC expression. The cytoplasmically inherited TrpC would thus provide a fitness advantage to stem cells whose recent ancestors differentiated, compared with mutant stem cells that have not differentiated for many generations due to loss of integrase function (Figure 1C).
The resulting synthetic strain, which is denoted as biphasically differentiating E. coli (BDEC), is designed to have several experimental knobs for tuning parameters (Figure 1D). Differentiation rate is driven by integrase expression, under the control of the inducer 2,4-diacetylphloroglucinol (DAPG), which releases repression by the transcription factor PhlF.41,48 The concentrations of trp and TMP in the media modulate the effectiveness of FolA and TrpC, respectively (Figures S1A–S1D). Finally, arabinose controls the overall expression of folA and trpC (Figure 1B).
Figure S1.

Monotonically increasing the integrase activity controls antagonistic effects of trpC and folA to give cell-autonomous biphasic differentiation, related to Figure 1
(A–D) Direct control of folA (A and B) and trpC (C and D) circuits and corresponding 2D input functions based on the induction of the two genes and exogenous levels of their environmental-pressure counterparts. The scale parameters and for simulation are approximately equal to the concentration that gives half-maximal growth rate at zero induction. Cultures were grown in M9 + 0.4% glucose. Values are means of 4 same-day repeats. Strains are MG1655 pDSG488 (A and B) and DSG1 pDSG467 (C and D).
(E) Fraction of uncut plasmids decreases with increased induction by DAPG in low-trp (0.25 μM), high-TMP (10 ng/μL) culture (measured after 48 h growth). Curve is a fit of the data (assuming the point at 40 μM DAPG as an outlier) to the Hill function with , , and . Points are mean ± standard error across 4–6 replicates. Band represents the standard error on the fit.
(F) The average across individual colonies of fraction cut plasmids (Figure 1F) matches the fraction cut plasmids measured in a sample of the culture pre-plating. Values are mean ± SEM across 40 colonies for the colony data and over two technical replicates (the two data points correspond to the edges of the error bars) for the bulk.
(G) Cross-feeding is not significant. Strains expressing either folA or trpC under arabinose induction (MG1655 ΔtrpC pDSG546 or pDSG550) were grown in M9 + 0.4% glucose + 0.4% arabinose + 300 mM cAMP with the specified environment (± 200 μM trp ± 100 ng/μL TMP). Strains grew to a consistent final OD in permissive environments only. Co-culture of 1:1 mixtures of the strains failed to grow in the environment requiring both gene products (−trp +TMP). Bars ± caps are mean ± standard deviation across 4 replicate cultures.
Biphasic differentiation circuit shows biphasic fitness
We constructed the BDEC circuit following the above design. To test whether the fitness of this strain is indeed biphasic, we grew it in a medium with low trp and high TMP (STAR Methods). We started with a population of pure stem cells (>97% uncut plasmids; see STAR Methods) and quantified fitness as the culture yield (measured by optical density) as a function of DAPG concentration (Figure 1E). The higher the DAPG induction, the lower the number of uncut plasmids, as expected (Figure S1E). Optical density (OD) was maximal at intermediate integrase induction (∼20 μM DAPG), irrespective of the duration of the experiment, indicating a biphasic fitness curve.
Measuring the fraction of cut plasmids in individual cells (Figures 1F and S1F; STAR Methods) shows that low induction leads to mostly pure stem cells (∼60% at 1.25 μM DAPG), high induction leads to mostly pure differentiated cells (∼60% at 160 μM DAPG), and intermediate induction leads to mostly progenitors (∼60% at 20 μM DAPG). Without induction, no growth was observed within 48 h. Similarly, a pure differentiated population (with pre-cut target plasmid) failed to grow within 48 h. Co-culture of folA-expressing cells with trpC-expressing cells also did not grow, ruling out cross-feeding of trp or resistance between stem and differentiated cells (Figure S1G). Finally, the same circuit does not grow in low-trp, high-TMP media when using a single-copy target plasmid (Figure S3), indicating the need for multiple copies of the target as expected.
Figure S3.

Circuit behavior when placing target on bacterial artificial chromosome (BAC), related to Figure 3
(A–C) Heatmaps of (A) maximum yield, (B) nonmonotonicity, and (C) optimal differentiation rate as in Figures 3C–3E when the target plasmid is replaced with a bacterial artificial chromosome (∼1 copy/cell). Note that there is no growth in low-trp, high-TMP conditions. There is a sharp transition to no growth at sub-saturating trp levels and non-zero TMP, suggesting that cells never gain the benefit of both trp production from trpC and resistance generated by folA. This supports the idea that intermediate states are needed to generate progenitor cells that express both trpC and folA. Grayed areas reflect the fact that in the indicated conditions, no peak could be discerned, precluding the calculation of an optimal differentiation rate. Data are averages over 3 replicates on separate days.
We conclude that BDEC fails to grow at low integrase induction due to lack of trp, and it fails to grow at high induction due to a lack of TMP resistance. At intermediate integrase induction, we obtain a mixture of cells with varied degrees of differentiation, as evidenced via qPCR by the presence of both cut and uncut plasmids in the resulting culture (Figure S1E) and in individual cells (Figures 1F and S1F; STAR Methods). Thus, BDEC constitutes a synthetic bacterial analog of a biphasic differentiation circuit. The stem cells can self-renew and generate progenitor cells, which irreversibly generate terminally differentiated cells that do not grow in low-trp, high-TMP conditions.
Biphasic differentiation circuit selects for a well-defined differentiation rate
In the initial experiments described above, the differentiation rate was set externally by the inducer DAPG, which determines the integrase expression level. Under these conditions, there is an optimal differentiation rate defined by an intermediate induction level that maximizes yield.
We next asked whether selection would stabilize a particular differentiation rate and whether this rate would be close to the optimal rate that we found by adjusting DAPG. For this purpose, we performed a competition experiment between 11 strains with an identical circuit but with different levels of integrase achieved by a different A118 ribosome binding site (RBS) in each strain (Figure 2A). These RBSes, selected from a library of 4,096 variants that was expected to cover ∼5 orders of magnitude in translation rate (STAR Methods; Figures S2A–S2C), were chosen to exhibit a range of integrase activity (Figure 2B).
Figure 2.

Competition of biphasic strains with different differentiation rates selects for an intermediate differentiation rate
(A) Eleven individual strains with different integrase RBSes of varying strengths each have their own biphasic fitness curve as a function of DAPG in low-trp (0.25 μM), high-TMP (10 ng/μL) media. Shifted peaks reflect optimization for different externally supplied DAPG. Shaded bands are standard deviations over 3 technical (same-day) repeats. Hue is consistent in subsequent panels to simplify comparison.
(B) The differentiation rate of all strains at a single DAPG concentration (dashed line in A, 10 μM) was quantified and ranked based on the fraction of uncut plasmids in +trp media, reflecting integrase activity. Strain 11 (starred) appears out of place in this quantification due to extremely high integrase expression that resulted in a growth defect (Figures S2D and S2E; STAR Methods).
(C) Competition was run by mixing equal concentrations of strains, diluting once per day, and sequencing the RBS region.
(D) Competing the 11 strains in −trp +TMP media shows selection for the strains with intermediate-level differentiation rate at 10 μM integrase induction.
(E) Repeating the competition in +trp +TMP media shows selection for low integrase induction.
Error bars are standard deviations across 4 independent histories. See also Figure S2. Growth conditions in (B), (D), and (E) are in high TMP (500 ng/μL). In (B) and (E), this was supplemented with 385 μM trp. In (D), initial Day 0 culture was supplemented with 0.25 μM trp (see STAR Methods).
Figure S2.

Selection and ordering of competition strains, related to Figure 2 and STAR Methods
(A) A total of 596 colonies of a randomized 6-nt RBS library were grown in −trp (0.25 μM) +TMP (10 ng/μL) conditions with 20 μM DAPG induction. Delayed logistic functions were fit to each strain to provide an estimated RBS rank (∼ 1/[lag × growth rate]).
(B) Data from (A) for twelve chosen strains that gave a range of estimated RBSes.
(C) The twelve chosen strains were grown in a range of DAPG concentrations to confirm shifted fitness peak location. The integrase plasmid of each one of these twelve was sequenced; one of the twelve (pDSG592) was determined to be a mixture of two strains and was removed from further experiments. This yielded the 11 strains used in the competition assays.
(D) Integrase activity (fraction of cut plasmids at 10 μM DAPG, from Figure 2B) plotted versus the optimal DAPG concentration providing maximum yield (from Figure 2A). This shows the starred strain as a clear outlier.
(E) Western blot of the integrase in all 11 strains at 10-μM DAPG. Although there is plenty of degradation in this western (top band in strain samples is at expected 55 kDa length), it is clear that the starred strain has by far the highest expression level. All samples were taken from mid-exponential-phase cultures with OD between 0.8 and 1.2 except the pDSG593 strain, with OD around 0.6 (implying an even higher level of expression than that was apparent in the blot). LD, Bio-Helix BLUEeye ladder. The myc-tagged parent strain (pDSG589), which has the same RBS as the BDEC strain, was included for comparison.
(F) The ranked population fraction of each competed strain in biphasic conditions (Figure 2E) after competition highly correlates with how close the optimal DAPG concentration of the strain (Figure 2C) is to the concentration (10 μM) used in the competition assay. Distance is calculated as . Population fraction rank is defined as the lowest rank for the highest population fraction.
(G and H) Figures 2D and 2E plotted versus integrase activity (∼1/fraction of cut plasmids from Figure 2B) rather than rank, with strain 11 arbitrarily given integrase activity of 1,000.
Upon induction by DAPG, these strains provided different fitness curves, each with a different optimal induction level (Figure 2A). At 10 μM DAPG, the strains showed a range of integrase activity, as measured by the fraction of uncut target plasmids (Figure 2B). We ranked the strains 1–11 according to this integrase activity. The integrase activity correlated well with peak response to DAPG, except for one outlier strain, which showed the weakest response to DAPG but medium integrase activity (Figure S2D). This strain had a noticeable growth defect in +trp media, and western blot analysis (Figure S2E) showed that this strain had very high integrase expression. We thus ranked it 11th, corresponding to the highest integrase expression.
To compete the strains, we mixed the 11 strains in equal amounts and grew them in 10 μM DAPG, low-trp, high-TMP medium over the course of several days, diluting the culture 1:100 each day (Figure 2C; STAR Methods). By sequencing the cultures, we found that the variants of intermediate rank were strongly selected for within 3 days (Figure 2D). By day 3, the strain population fractions ranked closely according to the distance of their optimal DAPG induction from 10 μM (Figure S2F). In particular, the most prevalent strains have peaks closest to 10 μM DAPG.
To compare this biphasic selection with a monophasic differentiation control, we reran the competition in high-trp, high-TMP medium, where we expect no selection against low differentiation rates, because trpC expression is superfluous in high-trp media. Indeed, we found that variants with low rank were strongly selected for within 3–4 days (Figure 2E). Plotting the population fractions in both biphasic and monophasic cases against integrase activity rather than rank supports the same conclusions (Figures S2G and S2H).
We conclude that the biphasic synthetic differentiation circuit can select for a defined differentiation rate close to the optimum. The circuit provides a selective disadvantage to variants that increase or decrease integrase expression. In particular, it provides a selective disadvantage to variants with very low integrase activity, which can be considered analogous to mutant stem cells that do not differentiate. This is in contrast to monophasic differentiation, which provides a selective advantage for decreased integrase expression.
Differentiation rate is robust to environmental pressures
The biphasic experiments described so far were performed in a single environment (medium), with low trp and high TMP (STAR Methods). We next asked how changing the environment affects the fitness curve as a function of differentiation rate (DAPG concentration) and, in particular, how it affects the optimal differentiation rate. This is a robustness question because changes in the environment alter the selective pressure on the two arms of the biphasic curve.
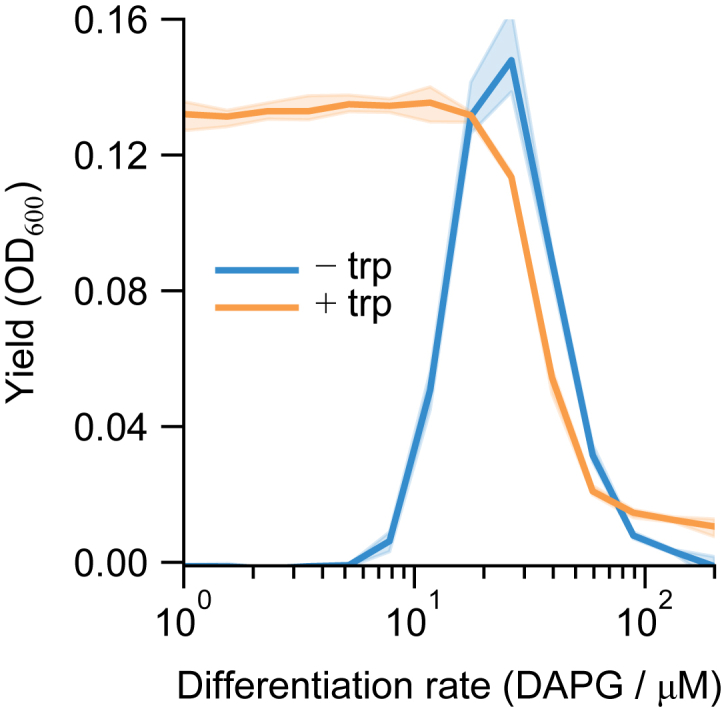
We first repeated the induction curve experiment in three additional extreme environments (Figure 3A). Without trp or TMP (−trp −TMP), the fitness curve rose monotonically with DAPG (Figure 3A, solid blue line), reflecting the fact that increasing differentiation provides increased trp production without the cost of reduced TMP resistance. With abundant trp and TMP (+trp +TMP), the fitness curve decreased approximately monotonically (Figure 3A, dashed orange line)—increased differentiation only causes loss of resistance, the abundant trp removing any selective pressure to induce trpC. With abundant trp and no TMP (+trp −TMP), the fitness function was approximately flat (Figure 3A, solid orange line), reflecting no selective pressure on the production of either trp or TMP resistance.
Figure 3.

Biphasic differentiation is robust to environmental conditions
(A) Fitness curves with approximately saturating levels of trp and/or TMP show expected monotonically increasing, monotonically decreasing, biphasic, and flat trends (−trp = 1.56 μM, +trp = 25 μM, −TMP = 0 ng/μL, +TMP = 6.25 ng/μL).
(B) Fitness curves were quantified by the peak fitness and corresponding optimal differentiation rate, as well as a measure of nonmonotonicity of the fitness curve (colors consistent with C–H).
(C–E) Heatmaps show graded responses of yield and nonmonotonicity, but nearly constant optimal differentiation rate except in the complete absence of TMP. Concentrations of trp and TMP in (A) are marked by circles in (C), with line styles corresponding to the curves in (A).
(F–H) An interchangeable-cell-type logistic growth model (STAR Methods) qualitatively reproduces the response of these three metrics. Color bars in (F)–(H) as in (C)–(E), respectively.
(I) Model median and interquartile range of optimal differentiation rate () across all trp/TMP environments as a function of model parameters. Dashed lines reference the parameter values used in (F)–(H).
Values in (A) and (C)–(E) are averages of repeats on 3 separate days. Bands in (A) are standard deviations over those repeats. See also Figures S3 and S4.
To understand how such divergent fitness curves interconvert in less extreme environments, we repeated the induction curve experiment in 36 combinations of 6 levels of trp and 6 levels of TMP, each ranging in concentration across four orders of magnitude. For each combination, we quantified the maximum yield (), optimal differentiation rate (), and nonmonotonicity of the fitness curve (), where and are the yields at 0 and 200 μM DAPG, respectively (Figure 3B). As expected, the maximum yield increased with increasing trp and decreasing TMP (Figure 3C), reflecting the decreasing selective pressures. Also as expected, nonmonotonicity increased with decreasing trp and increasing TMP (Figure 3D).
Notably, the optimal differentiation rate remained around 15.7 ± 3.9 μM DAPG (median ± interquartile range [IQR] over all environments) (Figure 3E). Indeed, the optimal differentiation rate varied by only ∼1.7-fold across environmental conditions (trp/TMP), except in complete absence of TMP. This suggests that the optimal differentiation rate in the biphasic system is robust to environmental conditions that change over four orders of magnitude.
To understand the origin of this robustness, we developed a mathematical model that describes the growing culture as logistic growth of interconverting cell types. This model includes a single-cell growth rate that is a function of the environment and the number of cut plasmids per cell, as well as the production of a differentiation-state distribution based on integrase activity and random replication and inheritance of plasmids (Figures S4A–S4C; Table S1; see STAR Methods for further details).
Figure S5.
Fitness curves of version 2.0 strain with and without trp, related to Figure 5
Fitness curves show that the approximately optimal DAPG for the biphasic case (−trp = 0.25 μM) at ∼20-μM DAPG has barely any effect on the fitness of the monophasic (+trp = 385 μM) case. To provide a fitness challenge appropriate to the monophasic case, we used 50 μM DAPG in the dynamic range of its fitness curve. Curves measured at 50 ng/μL TMP as in Figure 5. Data are mean ± standard deviation across 3 same-day repeats.
Figure S4.

Predictions of fitness curves based on single-cell growth rates and extended data on parameter sweeps, related to Figure 3
(A) Growth rate for any given cell as a function of the fraction of cut plasmids is directly calculated from Equation 5, which depends on the environmental trp () and TMP () concentrations, but not on DAPG ().
(B) Population distribution of cells with the number of cut plasmids after 40 h is simulated from the model Equation 2 for a given DAPG level (here ).
(C) Overall fitness is determined by summing the population frequency distribution (i.e., sum over distributions such as in (B) at 40 h. The fitness curve is calculated by repeating these calculations over a range of DAPG values. Fitness curves such as this are quantified in the main text by their maximum fitness, optimal differentiation rate, and nonmonotonicity. Simulations for (A)–(C) run for , , , , 5, and , with other parameters as in Table S1.
(D) Data on parameter sweeps for all three metrics in Figure 3. Each metric is normalized to its maximum value across all simulations, and then the median and interquartile range (IQR) are calculated. High values of , , , and alpha give low range (shaded bands) of optimal DAPG, while the maximum yield and nonmonotonicity are not low (which would indicate a non-growing culture or flat fitness curve, respectively). The same is true for low growth-rate “leakage” and .
The model agrees with the data qualitatively, showing the same general trends in the maximum yield, nonmonotonicity, and optimal differentiation rate across environments (Figures 3F–3H). In particular, it recapitulates the robustness of optimal differentiation rate (12.5 ± 5.2 μM DAPG median ± IQR over all environments), which remained largely constant except at low TMP levels.
To test which parameters controlled this robustness, we reran the simulations with different parameter values (Figures 3I and S4D). This is comparable to simulating a range of differentiation circuits, such as ones with a different number of progenitor states. We expected robust parameter sets to provide an intermediate optimal differentiation rate (avoiding a pure stem or fully differentiated population) that varies little across environments; we quantified these aspects of the simulation results by the median and IQR of , respectively.
We found that the optimal differentiation rate is robust as long as plasmid copy number is sufficiently high (≳10), trpC and folA expression per plasmid are strong enough to be comparable to sourcing trp or removing TMP from the environment, and “leaky” growth rates are low (Figure S4). Because these conditions have only a lower or upper bound, none require fine tuning. The simulations also indicate that the cutting rate must be faster than division, although a very high cutting rate requires very low to avoid a fully differentiated population. Thus, the model indicates robust differentiation rate as a function of environment in a manner robust to the circuit parameters.
The mathematical requirements for the environmental robustness of differentiation rate can be interpreted as a need for many progenitor states (states with different numbers of cut and uncut target plasmids). These intermediate progenitor states are transient but evade selective pressures (having both abundant trp production and TMP resistance in our system). They thus have higher growth rates than either stem or differentiated cells, analogous to transit-amplifying cells in mammalian tissues. Overly fast or slow differentiation will not produce a distribution of cell states with sufficiently large numbers of transit-amplifying cells. This suggests that a large number of transit-amplifying cells, generated through intermediate differentiation rate, provides an environmentally robust differentiation rate in biphasic differentiation cascades by temporarily ignoring environmental pressures. Indeed, in a strain with a single-copy target plasmid, the optimal DAPG level is not robust, varying over the full range of DAPG used (Figure S3).
Differentiation in the BDEC strain is moderately resistant to mutant takeover in long-term evolution experiments but fails due to a design flaw
We next asked whether the biphasic circuit is robust to spontaneous mutations that change the differentiation rate. For example, complete loss of differentiation would be analogous to cancer-like mutations that fail to differentiate. To do so, we performed evolution experiments starting with the original BDEC strain (Figure 1E) and waited for mutations to occur spontaneously. We grew the strain in −trp +TMP (10 ng/μL TMP) media with moderate integrase induction (8 μM DAPG), diluting 1:100 into fresh media approximately once per day (Figure 4A; STAR Methods). Assaying the fraction of cut plasmids by qPCR as a proxy for differentiation rate, we found no significant change in differentiation within 24 transfers, or ∼160 generations (Figure 4B). The cultures indeed appeared to approach a reproducible steady-state differentiation fraction of ∼50%. The fraction of cut plasmids matched the expectation of ∼70% uncut plasmids after 1 day (Figure 4B; compare to Figure S1E) before decreasing to ∼50% upon subsequent transfers. This suggests that through selective pressure, biphasic control maintains differentiation rate, which yields maximum fitness at ∼50% uncut plasmids (compare Figures 1E and S1E). We ended the evolution experiment after about 1 month of no obvious change in behavior.
Figure 4.

Biphasic differentiation is maintained in long-term evolution but lost under strong selective pressure due to decoupling of the biphasic control
(A) Schematic of the evolution experiment. The experiment was repeated in four independent histories (indicated by differing line styles in [B]–[D]) at 10 ng/μL TMP, supplemented in initial (Transfer 0) growth with 0.25 μM trp (see STAR Methods). Note that the difference in growth conditions compared with Figure 1 is minor (see Figure 3C).
(B) Fraction of uncut plasmids (approximate number of stem cells) in an evolved culture does not change significantly over 4 weeks (∼160 generations) at moderate integrase induction (8 μM DAPG), appearing to reach a reproducible steady-state differentiation fraction.
(C) Under high integrase induction (20 μM DAPG), the fraction of uncut plasmids approaches 1 within ∼1.5 weeks (∼45 generations) in 2 out of 4 histories, indicating a non-differentiating mutant with selective advantage.
(D) Sequencing of evolved cultures from (C) indicates mutants increasing in abundance over the ∼1.5 weeks of the high-induction experiment in 3 out of 4 independent replicates.
(E) Sequencing shows that the mutant simultaneously expresses both trpC (purple) and folA (red) via errant integrase action, which inverted (flipped) the folA and pAra promoters, while breaking the production of AraC (also present on the chromosome).
Bands in (B) and (C) are standard deviations of two technical repeats. Error bars in (D) are bootstrapped from sequence counts (STAR Methods). Line styles in (B)–(D) refer to independent histories.
We then increased the selective pressure on differentiation by repeating the experiment with higher integrase induction (20 μM DAPG). In this case, we found nearly complete loss of differentiation for 2 out of 4 cultures within 7 transfers, or ∼45 generations (Figure 4C), suggesting mutant takeover by non-differentiating clones. We ended the evolution experiment following this loss of differentiation.
To determine what mutations had occurred that disrupted differentiation, we sequenced the culture plasmids, hypothesizing that relevant mutations were most likely to occur within the circuit construct itself. We found that the two cultures with mutant takeover contained inversions that flipped a DNA segment, placing a constitutive promoter in front of trpC. The inversion matches up at one end with the integrase target site, indicating that this mutation was mediated by errant integrase activity, which can invert DNA targets with appropriately oriented target sites.41 This inversion broke the biphasic coupling between loss of folA expression and induction of trpC by allowing their simultaneous expression (Figures 4D and 4E). The inversion also broke AraC production from the plasmid, but the E. coli strain we used has genomic production of AraC, which is presumably sufficient to drive the pAra promoter in the circuit. The same mutation was found to be increasing but still at low frequency in the two repeats without complete loss of differentiation, suggesting that this sidestepping of biphasic control via decoupling is reproducible. It is plausible that this mutation could also take over the 8 μM DAPG condition if given enough time.
Improved circuit design yields a version 2.0 circuit that is highly resistant to mutant takeover
The mutations observed in Figure 4 suggest that the mutant resistance of the circuit could be improved by redesigning the circuit to avoid such constitutive expression upon inversion. We thus built a “flip-proof” version 2.0 circuit using a constitutive, unidirectional promoter instead of the AraC-pAra arabinose-inducible component that included a bidirectional promoter (Figure 5A). We termed the strain containing this new circuit BDEC version 2.0.
Figure 5.

Flip-proof BDEC version 2.0 strain is resistant to mutant takeover
(A) Schematic design as in Figure 1B of the version 2.0 circuit, showing replacement of the bidirectional promoter, which drove expression of both AraC and the target genes (trpC, folA) using a constitutive unidirectional promoter.
(B) Fraction of uncut plasmids in evolution experiment as in Figure 4 in both biphasic (−trp +50 ng/μL TMP +20 μM DAPG) and monophasic (+385 μM trp +50 ng/μL TMP +50 μM DAPG) growth conditions (see also Figure S5). The initial (Transfer 0) biphasic growth was supplemented with 0.25 μM trp (see STAR Methods).
(C) Sequencing of the cultures at transfer 13 showed that the monophasic cultures lost the entire integrase cassette. The same loss was found rarely in biphasic cultures, indicating that the mutation existed but was selected for only in monophasic conditions.
(D) Distribution of the degree of differentiation of cells in the biphasic case at several time points shows that the cultures settled into a stable distribution that lasted for the entirety of the experiment.
Error bands in (B) and error bars in (C) are standard deviations over 4 independent histories. See also Figure S5.
We ran evolution experiments with this version 2.0 strain in both −trp+TMP (biphasic) and +trp+TMP (monophasic) growth conditions (Figure 5B). We found that the monophasic evolution lost differentiation starting within 2 transfers and almost completely within 13 transfers (∼90 generations). Sequencing of the cultures from transfer 13 showed that the monophasic cultures lost the entire integrase cassette, including both phlF and A118 (Figure 5C). We ended the monophasic evolution following this mutant takeover.
In contrast, the biphasic evolution successfully resisted mutants, maintaining differentiation for at least 41 transfers (∼270 generations). This same loss of integrase cassette was found in the biphasic cultures at very low frequencies, indicating that while the mutation was possible, it was not selected for in biphasic conditions (Figure 5C).
Finally, we measured the distribution of differentiation states within the biphasic culture at several time points over the course of the evolution experiment. We found that this distribution was qualitatively unchanged even by transfer 41, showing that the differentiation lineage was stable (Figure 5D).
Discussion
We used a “build-to-understand” approach to explore whether biphasic control can protect differentiation against evolutionary and environmental pressures. We built a synthetic differentiation system in E. coli, in which an integrase irreversibly removes antibiotic resistance in stem-like and progenitor-like cells (differentiation) while simultaneously inducing the production of an essential amino acid (biphasic control). This biphasic control selected for a specific differentiation rate in competition experiments, and after the design was corrected to prevent a specific mutation that bypasses biphasic control, the circuit provided protection against mutant takeover in long-term evolution experiments. In contrast, the circuit was quickly taken over by non-differentiating mutants in conditions where the control is monophasic. Unexpectedly, the biphasic mechanism also provided a differentiation rate that was robust in the face of wide variations in growth conditions. By comparison with a mathematical model, we show that this environmental robustness is likely due to transit-amplifying (fast-growing progenitor) states that are not modulated by exogenous factors. Thus, biphasic control resists takeover by mutants that lose differentiation and maintains a steady differentiation rate across conditions.
Comparison with previous synthetic differentiation
Previous studies on synthetic differentiation have been concerned with the problem of evolutionary stability and mutant takeover.22,49 A synthetic differentiation system without a mutant resistance strategy lost differentiation due to non-differentiating mutant expansion,22 with higher differentiation rate leading to more rapid loss.
A synthetic differentiation study in yeast used a non-cell-autonomous strategy to avoid mutant takeover. This employed feedback via adhesion to differentiated daughters that secrete an essential enzyme.49 The present circuit, in contrast, is cell autonomous. It does not require feedback via secretion and thus removes the possibility of cheater mutants that benefit from, but do not share, the burden of essential enzyme production.6 Furthermore, the yeast study strategy49 depended on differentiated cells growing strictly more slowly than stem cells, a situation not standard for stem cell tissues,50,51,52 and did not include terminal differentiation. The present circuit allows for terminal differentiation and includes an entire differentiation lineage, including progenitors, which were lacking in previous studies.22,49
Our circuit also differs from previous demonstrations of synthetic biphasic control. Previous work used biphasic control for a different goal, namely, population size control,31 and found that such control prevents mutant takeover. This size-control circuit31 used feedback of secreted molecules as a quorum signal with a biphasic effect on growth. The present circuit does not require such feedback; instead, it uses a cell-autonomous linkage between differentiation activity and growth rate.
Comparison of synthetic E. coli differentiation with natural stem-based tissues
The present synthetic differentiation circuit contains some important differences compared with animal stem-based tissues. The present circuit works in suspension, whereas tissues involve tight physical and chemical interactions between cells. Mutation rates in bacteria are much higher per gene than in stem-based tissues, and bacteria can grow much faster.53 Thus, one expects mutant takeover to happen more quickly in bacteria. This makes it experimentally easier to study mutant takeover in synthetic bacterial systems.
We propose that transit-amplifying cell states in the present circuit provide a robust differentiation rate despite environmental variation. This may offer a potential role for transit-amplifying cells in the context of animal stem-based tissues, in addition to their role of amplifying cell numbers2,3 and reducing noise in cell proportions.54 Conversely, for systems that need to alter differentiation rate in response to the environment, one would expect few intermediate states because then differentiation rate would vary based on environmental pressures. This matches, for example, the cyanobacterium Anabaena, which contains no transit-amplifying states and differentiates only when nitrogen is scarce.10
Fitness landscape engineering
This work focuses on specifying fitness as a function of quantitative genetic and environmental factors, a process we term “fitness landscape engineering.” This differs from standard synthetic biology efforts to decouple circuit behavior from a cellular “chassis.”55 In fact, if one considers the biphasic differentiation circuit as a logic circuit, it encodes a simple function: replacing folA and trpC in our circuit with green and red fluorescent proteins would produce a simple BUFFER/NOT function. By connecting both outputs of this logic circuit to the cellular fitness, we obtain a fitness landscape that is biphasic with respect to a quantitative genetic trait, differentiation rate. Assessing this landscape is more complicated than assessing logic behavior and requires growing cells both short and long term in a variety of environmental conditions. Such a workflow enabled us to produce a robust differentiation circuit and discover that transit-amplifying states enable this robustness.
The concept of fitness landscape engineering expands on earlier methods of improving evolutionary robustness of synthetic gene circuits. While many circuits are designed to provide a particular behavior in specific, short-term growth conditions, there is increasing interest in generating circuits that can maintain desired behavior over evolutionary timescales,35,36,37,38,39,40 which can affect microbial cultures within days.56,57 Multiple approaches have been used to increase mutational circuit stability, including reducing expression levels,35,58 removing homology,35,58 adding overlapping reading frames with essential genes,59,60 coupling to toxin/antitoxin systems,61 and using strains with reduced recombination potential.57 A series of papers from the Balazsi group used a fitness landscape approach to study and improve the stability of a switch circuit and ultimately restore broken behavior in evolution.36,62,63
We anticipate that fitness landscape engineering could be applied to a wide range of synthetic biology applications. It would be important to include the measurement of fitness landscapes in the design-build-test cycle of applications that require careful modulation of fitness between sub-populations of cells and between different environments. Such applications include multicellular engineering,34,64,65,66,67 population control,31,56,68 and biocontainment.57,61,69 Similarly, synthetic biology approaches to antibiotic tolerance70,71 and cancer treatment72,73 require control of fitness in a strain- and environment-dependent manner and would be well informed by the careful design and testing of fitness landscapes.
The long-term protection from mutants observed in this study by the version 2.0 circuit required us to correct the design of version 1.0, which allowed an unexpected mutation to bypass biphasic control. In this mutation, the integrase flipped a DNA piece instead of excising it, placing a promoter in front of the trpC gene, thereby breaking the biphasic coupling. In version 2.0, we removed this possibility by replacing a bidirectional promoter with a unidirectional one.
In future engineering efforts, computational tools for predicting potential mutations could make fitness landscape engineering more efficient by suggesting mutationally robust designs. Complete exploration of all mutants in a fitness landscape is infeasible computationally and experimentally. However, algorithms that combine automated feature annotation with in silico evolution could significantly improve the ability to build mutant-resistant circuits.37,74,75 In the case of the mutants found here, such an algorithm would minimally need to generate inversions, predict transcription/translation rates of rearranged sequences, and provide a model of growth under given environmental conditions.
Limitations of the study
Additional studies beyond the current scope could improve our understanding of the generality of the presented synthetic circuit. The biphasic coupling is accomplished using specific pressures (trp and TMP concentrations). Rebuilding the system using genes other than folA and trpC would give a better sense of the generality of this approach. Similarly, to make the analogy to mammalian tissues and stem cells more cogent, one could build a similar differentiation system in eukaryotic cells or even stem cells by coupling native or synthetic epigenetic-based differentiation to the expression of genes with opposing effects on cell growth and replication.
Additional measurements of the present circuit could also help improve our understanding of the biphasic differentiation mechanism. Single-cell cut-fraction distributions, expression levels of folA and trpC, and growth rates are important aspects of the system that we have included in our model but are difficult to measure experimentally. Some of this information could be gained by fusing fluorescent reporters to folA and trpC and monitoring growth microscopically, but care needs to be taken to avoid changing the dynamics of the proteins themselves (see also future work below). Finally, we tested the circuit with single- and medium-copy target plasmids. Experimentally, it is difficult to precisely control a low but non-single number of copies and hence of progenitor states using the current plasmid copy-number approach. Future approaches could bypass this limitation by using orthogonal integrases that serially cut distinct target sites that are each present in a single copy.
Future work
In future work, it would be interesting to study the spatial behavior of the biphasic differentiation circuit. Natural stem cell-based tissues often have defined structures. For example, stem cells are evenly spaced among differentiated cells in the fly gut, despite drastic changes in the size of the tissue during development and starvation.76 In mammals, stem cells are localized in a colonic crypt.45 How stem cell lineages, fitness landscapes, and spatial location interact to maintain such structure could be potentially assayed using our synthetic model if grown in a structured environment.
One could also introduce population control3,56,77 into the synthetic differentiation system. In contrast to the biphasic differentiation control proposed by Karin and Alon,17 the biphasic control in this work is cell autonomous and decoupled from population feedback control. This feedback could be introduced via the induction of differentiation in stem cells by differentiated cells. The cell-autonomous nature of our biphasic control could help in preventing cheaters that fail to secrete or sense these diffusible feedback signals.56,78
More generally, it would be interesting to study other proposed population and mutant control mechanisms by engineering them into E. coli. Mechanisms such as reciprocity,79 spring-and-ceiling,80 or autoimmune surveillance of hyper-secreting mutants (ASHM)81 have precise theoretical predictions that could be assayed in controlled biological contexts via fitness landscape engineering. We thus predict that in addition to engineering evolutionarily stable multicellular consortia for synthetic biology applications, fitness landscape engineering will have wide-ranging applications in understanding natural mechanisms for controlling tissue growth in multicellular organisms.
STAR★Methods
Key resources table
| REAGENT or RESOURCE | SOURCE | IDENTIFIER |
|---|---|---|
| Antibodies | ||
| Rabbit anti-myc | Abcam | Cat#: ab9106; RRID:AB_307014 |
| HRP-conjugated goat anti-rabbit | Proteintech | Cat#: SA00001-2; RRID:AB_2722564 |
| Bacterial and virus strains | ||
| MG1655 | Coli Stock Genome Center (CGSC) | CGSC #6300 |
| DSG1 (MG1655 ΔtrpC::KanR) | This paper | N/A |
| DSG1 pDSG578, pDSG545 (“BDEC”) | This paper | N/A |
| DSG1 pDSG545 (No-integrase control for qPCR) | This paper | N/A |
| JM109 pDSG553 (Pre-cut target for qPCR) | This paper | N/A |
| DSG1 pDSG589, pDSG545 (BDEC with myc-tagged integrase) | This paper | N/A |
| DSG1 pDSG589L (RBS library with myc-tagged integrase) | This paper | N/A |
| DSG1 pDSG590, pDSG545 (competition strain 8) | This paper | N/A |
| DSG1 pDSG591, pDSG545 (competition strain 7) | This paper | N/A |
| DSG1 pDSG593, pDSG545 (competition strain 11) | This paper | N/A |
| DSG1 pDSG594, pDSG545 (competition strain 10) | This paper | N/A |
| DSG1 pDSG595, pDSG545 (competition strain 2) | This paper | N/A |
| DSG1 pDSG596, pDSG545 (competition strain 6) | This paper | N/A |
| DSG1 pDSG597, pDSG545 (competition strain 9) | This paper | N/A |
| DSG1 pDSG598, pDSG545 (competition strain 1) | This paper | N/A |
| DSG1 pDSG599, pDSG545 (competition strain 5) | This paper | N/A |
| DSG1 pDSG600, pDSG545 (competition strain 3) | This paper | N/A |
| DSG1 pDSG601, pDSG545 (competition strain 4) | This paper | N/A |
| DSG1 pDSG578, pDSG588 (BDEC version 2.0) | This paper | N/A |
| MG1655 pDSG488 (DAPG-induced folA used in input function measurements) | This paper | N/A |
| DSG1 pDSG467 (Arabinose-induced trpC used in input function measurements) | This paper | N/A |
| DSG1 pDSG546 (Arabinose-induced folA used in cross-feeding experiment) | This paper | N/A |
| DSG1 pDSG550 (Arabinose-induced trpC used in cross-feeding experiment) | This paper | N/A |
| DSG1 pDSG578, pDSG602 (BAC-target strain) | This paper | N/A |
| Chemicals, peptides, and recombinant proteins | ||
| 2,4-diacetylphloro-glucinol (DAPG) | Cayman Chemical | Cat#: 16345 |
| Critical commercial assays | ||
| Fast SYBR Green mastermix | Applied Biosystems | Cat#: 4385612 |
| MicroAmp Fast Optical 96-well reaction plate | Applied Biosystems | Cat#: 4346906 |
| MicroAmp Optical Adhesive Film | Applied Biosystems | Cat#: 4311971 |
| Mini-PROTEAN TGX precast Any kD gel | Bio-Rad | Cat#: 456-9034 |
| BLUEeye prestained protein ladder | Bio-Helix | Cat#: PM007-0500 |
| TransBlot Turbo transferpak | Bio-Rad | Cat#: 1704156 |
| SuperSignal West PicoPLUS | Thermo Fisher | Cat#: 34580 |
| Deposited data | ||
| Raw sequencing reads for competition and evolution experiments | Plasmidsaurus | SRA: PRJNA1041632 |
| Oligonucleotides | ||
| AmpR forward qPCR primer: CAACGATCAAGGCGAGTTACA | This paper | N/A |
| AmpR reverse qPCR primer: TAACACTGCGGCCAACTTAC | This paper | N/A |
| folA forward qPCR primer: TCAAGTCGTCGGTTGGTATTG | This paper | N/A |
| folA reverse qPCR primer: AAGTGCAGCCACAGGATAAA | This paper | N/A |
| Recombinant DNA | ||
| pDSG467 | This paper | GenBank: OR829911; Addgene: 214209 |
| pDSG488 | This paper | GenBank: OR829912; Addgene: 214210 |
| pDSG545 | This paper | GenBank: OR829913; Addgene: 214211 |
| pDSG546 | This paper | GenBank: OR829914; Addgene: 214212 |
| pDSG550 | This paper | GenBank: OR829915; Addgene: 214213 |
| pDSG553 | This paper | GenBank: OR829916; Addgene: 214214 |
| pDSG578 | This paper | GenBank: OR829917; Addgene: 214215 |
| pDSG588 | This paper | GenBank: OR829931; Addgene: 214216 |
| pDSG589 | This paper | GenBank: OR829918; Addgene: 214217 |
| pDSG590 | This paper | GenBank: OR829919; Addgene: 214218 |
| pDSG591 | This paper | GenBank: OR829920; Addgene: 214219 |
| pDSG593 | This paper | GenBank: OR829921; Addgene: 214220 |
| pDSG594 | This paper | GenBank: OR829922; Addgene: 214221 |
| pDSG595 | This paper | GenBank: OR829923; Addgene: 214222 |
| pDSG596 | This paper | GenBank: OR829924; Addgene: 214223 |
| pDSG597 | This paper | GenBank: OR829925; Addgene: 214224 |
| pDSG598 | This paper | GenBank: OR829926; Addgene: 214225 |
| pDSG599 | This paper | GenBank: OR829927; Addgene: 214226 |
| pDSG600 | This paper | GenBank: OR829928; Addgene: 214227 |
| pDSG601 | This paper | GenBank: OR829929; Addgene: 214228 |
| pDSG602 | This paper | GenBank: OR829930; Addgene: 214229 |
| Software and algorithms | ||
| minimap2 (v. 2.21-r1071) | Li et al.82 | https://github.com/lh3/minimap2 |
| samtools (v. 1.12) | Danecek et al.83 | https://github.com/samtools/samtools |
| seqkit (v. 2.2.0) | Shen et al.84 | https://github.com/shenwei356/seqkit/ |
| Biopython (v. 1.79) | Cock et al.85 | https://biopython.org/ |
| Pysam (v. 0.16.0.1) | N/A | https://github.com/pysam-developers/pysam |
| NanoSV (v. 1.2.4) | Cretu Stancu et al.86 | https://github.com/mroosmalen/nanosv |
| Custom analysis code | This paper | Data S1 |
Resource availability
Lead contact
Further information and requests for resources and reagents should be directed to and will be fulfilled by the lead contact, David S. Glass (david.glass@weizmann.ac.il).
Materials availability
Plasmids generated in this study have been deposited to Addgene. Strains are available upon request.
Data and code availability
-
•
Raw DNA sequencing data have been deposited at the NCBI Sequence Read Archive and are publicly available as of the date of publication. Sequence information for all plasmids has been deposited at GenBank. Accession numbers are listed in the key resources table.
-
•
All original code is included in this paper’s supplemental information.
-
•
Any additional information required to reanalyze the data reported in this paper is available from the lead contact upon request.
Experimental model and study participant details
Strains and plasmid construction
To prepare a ΔtrpC::KanR strain, the knockout region was transferred to MG1655 (CGSC #6300) from the Keio collection strain JW1254 (BW25113 ΔtrpC770::KanR) using P1 phage transduction.87 Plasmids were constructed by Genscript, and in some cases gel-purified to avoid plasmid multimers — particularly in the target plasmid — and verified by nanopore sequencing (Plasmidsaurus). Initial sequences not produced via synthesis were sourced from Addgene (Roquet et al.41) or by PCR from the MG1655 genome (trpC). To avoid A118 cutting target plasmids during strain construction, target plasmids were always transformed into strains already containing the integrase plasmid with its associated repressor, as described in Roquet et al. To verify that no target plasmids were cut during cloning, the transformed stock was sequenced and analyzed by nanopore sequencing as described below.
Growth conditions
Standard growth conditions were designed to provide a tryptophan-free baseline. Cultures were grown overnight in LB, washed 5x in M9 minimal medium (42 mM Na2HPO4, 22 mM KH2PO4, 8.5 mM NaCl, 18.5 mM NH4Cl, 2 mM MgSO4, 0.1 mM CaCl) by centrifugation at 6000 rpm in a tabletop centrifuge for 3 min and replacing the supernatant with fresh M9 each time. Starting cultures were then diluted back ∼1:500 into (unless otherwise stated) M9 + 0.4% arabinose supplemented with 50 μg/ml spectinomycin and/or 50 μg/ml ampicillin (for strains containing integrase and/or target plasmids, respectively). These cultures were supplemented with the specified concentrations of inducer (DAPG) and “environmental conditions” (trp and TMP). Many growth conditions included a low concentration of trp (<2 μM) (“low trp”) to help the cultures begin growth without trpC production (e.g., pure stem populations without any cut plasmids). The BAC strain was grown in 30 μg/ml chloramphenicol instead of spectinomycin. For short-term growth experiments, final growth cultures were prepared in 96-well assay plates by a Tecan FreedomEvo liquid handler in a final volume of 200 μl and covered with 50 μl mineral oil. Plates were then grown in incubators at 37°C shaken at 6 Hz. Every ∼30 min the plates were transferred by robotic arm to an Infinite M200Pro plate reader, which recorded the OD600. Reported OD values are background subtracted per-well against the mean of the first few timepoints. Stocks of trp, TMP, and DAPG were stored at -20°C. Long-term stocks of trp were stored at –80°C.
Method details
Library selection
An initial integrase-plasmid library (pDSG589L) was constructed by Genscript with a randomized 6-bp region within the RBS of A118, predicted by the RBS calculator88 to range in translation rates over ∼5 orders of magnitude. A C-terminal myc tag was included in this strain to assist with downstream Western analysis. Electrocompetent cells of the ΔtrpC strain were prepared by serial washing in cold water (chilled 40 mL exponential-phase cells on ice 15 min, centrifuged at 1000 g for 10 min, removed supernatant and transferred to 1.5 mL conical tube, washed 2x at 1000 g for 5 min each, resuspended in 100 μl water + 10% glycerol). The pDSG589L library was then transformed by electroporation using Bio-Rad MicroPulser with default Ec2 settings. Around 104 – 105 colonies were collected, grown for ∼2 h in LB and stored with 25% glycerol at –80°C. Before storing as glycerol stocks, a sample was prepared directly as electrocompetent cells and transformed with the target plasmid (pDSG545). A total of 576 colonies were picked and grown overnight in 1 mL LB in deep 96-well plates, washed, and grown as described above. Twelve strains were selected as described in Figures S2A–S2C. Individual integrase plasmids in each strain were collected by miniprep (Qiagen). The RBS region of each was sequenced by Sanger sequencing, revealing one “strain” (thereafter removed from future experiments) to be a mixture of two strains.
Competition
The 11 selected strains were grown overnight in LB, washed in M9 as described above, OD-normalized, and mixed in equal volumes. A sample of the mixture was stored as glycerol stock. The mixed culture was then diluted 1:100 into four 1 mL-cultures in a deep 96-well plate with M9 + arabinose + ampicillin + spectinomycin media as described above supplemented with 10 μM DAPG, 500 ng/μL TMP, and 0.25 μM trp (biphasic) or 385 μM trp (monophasic). Cultures were grown overnight covered in breathable film. Each day, a sample of overnight culture was stored as a glycerol stock. Cultures were then diluted 1:100 into fresh media on subsequent days without any additional trp. DAPG was added fresh each day to avoid degradation. Glycerol stocks were PCRed in a ∼1 kb region surrounding the RBS and sequenced using nanopore sequencing (Plasmidsaurus).
Evolution
For the evolution experiments, an overnight culture was grown and washed as described above. The washed culture was diluted 1:100 into four 1mL-cultures in M9 + arabinose + ampicillin + spectinomycin media as described above supplemented with trp, TMP, and DAPG as described in the main text. Each day, glycerol stocks were made from overnight cultures. Cultures were then diluted 1:100 into fresh media without trp. Media was stored for the duration of the experiments in 4°C without DAPG, which was added fresh each day. Once per week, the cultures were transferred every 2 days instead of every day.
Nanopore sequencing and analysis
Nanopore sequencing was performed by Plasmidsaurus. Sequences were aligned to known plasmid references using minimap2 2.21-r1071 and processed using samtools 1.12 and seqkit 2.2.0. Subsequent analysis was performed in python 3.9.7 using Bipython 1.79 and pysam 0.16.0.1. Mutations were called using NanoSV version 1.2.4. Mutation frequencies were calculated as the number of sequences supporting the called variant (output by NanoSV) divided by the sequencing depth calculated by samtools within the plasmid resistance marker. Bootstrapped errors were simulated as the standard error from 10000 repeats of drawing, with replacement, mutants from sequences where is the number of called mutants and is the sequencing depth.
qPCR
Glycerol samples were diluted 1:10 into water and mixed with Applied Biosystems Fast SYBR Green mastermix (#4385612) and 4 pmol each primer. Each sample was probed in duplicate both within folA and within AmpR (on plasmid backbone). Samples were placed in an Applied Biosystems MicroAmp Fast Optical 96-well reaction plate (#4346906), covered in MicroAmp Optical Adhesive Film (#4311971), and run on an Applied Biosystem QuantStudio 3 qPCR machine. Within each qPCR plate, samples were included of a pre-excised strain (lacking folA) and a strain with no integrase plasmid (fully uncut). Raw fraction uncut was calculated as . Reported fraction uncut plasmids were normalized for primer efficiency as .
qPCR in individual cells
After growing cultures for 48 h using the process described above, samples were OD-normalized. The culture was then serially diluted to and plated on LB + 100 μg/ml spectinomycin + 100 μg/ml ampicillin to obtain ∼50 colonies per plate. Colonies were picked (being careful to pick the entire colony to the extent possible) and resuspended in 30μL M9. The fraction uncut plasmids were then quantified using the qPCR procedure described above. A few samples resulted in values above 100% cut; we considered these to be 100% cut. For the “bulk” samples, a 50 μL sample of culture was boiled, centrifuged, and 40 μL of supernatant stored at 4°C for later use in qPCR.
Western blotting
Overnight cultures were first washed and resuspended in media as described above, using 385 μM trp and no TMP in 12 mL culture with 10 μM DAPG. Cultures were then grown to mid-exponential phase in 50 mL filter-topped tubes. Cells were collected by first centrifuging at 3000 rpm for 3 min at 4°C, removing supernatant, resuspending in 500 μL M9 in 1.5 mL tubes, centrifuging again at 13200 rpm for 1 min at 4°C in a tabletop centrifuge, and removing all supernatant. Cultures were resuspended in 100 μL M9, and a sample taken to measure OD. Samples of 45 μL were mixed with 15 μL 4x Laemelli buffer + 100 μM DTT and boiled at 95°C for 10 min. These were run on Bio-Rad Mini-PROTEAN TGX precast Any kD gels (#456-9034) along with a Bio-Helix BLUEeye prestained protein ladder (#PM007-0500) at 150 V for 30 min. The gels were transferred to blots using Bio-Rad TransBlot Turbo transferpak (#1704156) MiniFormat 0.2 μm PVDF using the 1 minigel mixed MW setting (1.3A, 25V) on the Bio-Rad Transblot Turbo. Blots were washed 3x for 10 min each in PBS, blocked for 1.5 h in PBS + 5% milk, and incubated overnight at 4°C on a tilter in rabbit anti-myc antibody (Abcam #ab9106). Blots were then washed 3x for 10 min each in PBS + 0.1% tween-20 and rinsed briefly in PBS. They were then incubated on an orbital shaker for 2 h in PBS + 5% milk + 1:10000 HRP-conjugated goat anti-rabbit antibody (Proteintech #SA00001-2). Blots were then washed again 3x in PBS + 0.1% tween-20 for 10 min each and rinsed briefly in PBS. A 1:1 mixture of the two components in SuperSignal West PicoPLUS (Thermo Fisher #34580) were dripped onto the blots and imaged using a Bio-Rad ChemiDoc MP Imaging system.
Model
The growth model is an extension of logistic growth, which is generally modeled as
| (Equation 1) |
with the concentration of a single species of bacterium, the growth rate of that bacterium, and the carrying capacity of the culture. In our model, we extend this single-species logistic growth to logistic growth of multiple interconverting cell types. We write this as:
| (Equation 2) |
where c is a vector of cell concentrations , indexed by number of cut plasmids . The carrying capacity is assumed to apply to the entire culture, and hence divides . is a diagonal matrix containing the growth rate of each species (, other entries zero). and are matrices that describe how the various species interconvert — is a stochastic matrix driving random distribution of plasmids to daughter cells during division, and determines the conversion of to via differentiation. The parameter is the maximum integrase cutting rate, and the function is an increasing Hill function of DAPG concentration with half-maximal concentration and cooperativity .
We now describe the matrices , , and in detail.
The replication/distribution matrix P
We model the random replication and segregation of plasmids by the product of two processes. In the first step, modeled by a binomial distribution, plasmids of which are cut are replicated to produce new cut plasmids and new uncut plasmids (producing a total of plasmids), with probability of replicating a cut plasmid. In the second step, modeled by a hypergeometric distribution, plasmids of which are cut are drawn without replacement from the of which are cut. All possible z are summed over, giving a probability of producing a cell with cut plasmids from a cell with cut plasmids:
| (Equation 3) |
The production of cells with x cut plasmids is then and in matrix form provides a term where .
The differentiation matrix S
To model differentiation, we note that differentiation removes and produces . Thus, the rate of change due to differentiation for is given by and in matrix form can be written as , where is defined as
| (Equation 4) |
The growth-rate matrix M
We approximate the growth rate as a product of Michaelis-Menten functions with leakage. This approximates the logic that trp and cut plasmids (trpC) increase growth rate while TMP decreases growth rate with protection provided by uncut plasmids (folA):
| (Equation 5) |
where effective tryptophan and effective TMP protection . The parameters and represent the trp and TMP concentrations, respectively, the plasmid copy number, and Michaelis-Menten coefficients providing the concentration scales. The parameters and determine the effectiveness of cut and uncut plasmids in providing tryptophan and resistance, respectively. The growth rate for each species is independent, contributing a term , and in matrix form can be written as with diagonal matrix :
| (Equation 6) |
Component form
In component form, Equation 2 can be written as:
| (Equation 7) |
Simulations
Equations were numerically integrated in Mathematica 12 using NDSolve. For the initial simulations, 62 log-spaced concentrations of TMP and trp were used, with 82 log-spaced concentrations of DAPG for each condition ranging from 0.1 to 1000 (in addition to 0). For the parameter sweeps, the same ranges were used, but with 32 different concentrations of trp and TMP, and 42 concentrations of DAPG. The values of other simulation parameters and how they were estimated from the data or literature as described in Table S1.48,89
Quantification and statistical analysis
Number of samples, definition of values (e.g., means) and error bars (e.g., standard deviations) are described in the figure captions.
Acknowledgments
The authors would like to thank H. Kim, T. Milo, V. Jayaraman, Y. Yang, M. Raz, S. Kostinski, D. Lipton, S. Miyara, J. Elkahal, J. Glass, and the Alon lab for helpful feedback and comments on the manuscript. Funding was provided by the European Research Council (ERC) under the European Union’s Horizon 2020 research and innovation program (grant agreement no. 856587) and by the Israel Science Foundation (grant agreement no. 1966/22). D.S.G. was funded as a member of the Zuckerman Postdoctoral Scholars Program. U.A. is the incumbent of the Abisch-Frenkel Professional Chair.
Author contributions
Conceptualization, D.S.G., A.B., and U.A.; methodology, D.S.G., E.V., and A.B.; investigation, D.S.G., E.V., A.B., and A.M.; visualization, D.S.G., E.V., and A.B.; funding acquisition, D.S.G., A.B., and U.A.; supervision, U.A.; writing – original draft, D.S.G. and U.A.; writing – review & editing, D.S.G., U.A., A.B., E.V., and A.M.
Declaration of interests
The authors declare no competing interests.
Published: February 5, 2024
Footnotes
Supplemental information can be found online at https://doi.org/10.1016/j.cell.2024.01.024.
Contributor Information
David S. Glass, Email: david.glass@weizmann.ac.il.
Uri Alon, Email: uri.alon@weizmann.ac.il.
Supplemental information
References
- 1.Packer J.S., Zhu Q., Huynh C., Sivaramakrishnan P., Preston E., Dueck H., Stefanik D., Tan K., Trapnell C., Kim J., et al. A lineage-resolved molecular atlas of C. elegans embryogenesis at single-cell resolution. Science. 2019;365:eaax1971. doi: 10.1126/science.aax1971. [DOI] [PMC free article] [PubMed] [Google Scholar]
- 2.Lander A.D., Gokoffski K.K., Wan F.Y.M., Nie Q., Calof A.L. Cell Lineages and the Logic of Proliferative Control. PLoS Biol. 2009;7:e15. doi: 10.1371/journal.pbio.1000015. [DOI] [PMC free article] [PubMed] [Google Scholar]
- 3.Buzi G., Lander A.D., Khammash M. Cell lineage branching as a strategy for proliferative control. BMC Biol. 2015;13:13. doi: 10.1186/s12915-015-0122-8. [DOI] [PMC free article] [PubMed] [Google Scholar]
- 4.Dao D.N., Kessin R.H., Ennis H.L. Developmental cheating and the evolutionary biology of Dictyostelium and Myxococcus. Microbiology (Reading) 2000;146:1505–1512. doi: 10.1099/00221287-146-7-1505. [DOI] [PubMed] [Google Scholar]
- 5.Schulze J., Schierenberg E. Evolution of embryonic development in nematodes. EvoDevo. 2011;2:18. doi: 10.1186/2041-9139-2-18. [DOI] [PMC free article] [PubMed] [Google Scholar]
- 6.Rainey P.B., Rainey K. Evolution of cooperation and conflict in experimental bacterial populations. Nature. 2003;425:72–74. doi: 10.1038/nature01906. [DOI] [PubMed] [Google Scholar]
- 7.Sulston J.E., Schierenberg E., White J.G., Thomson J.N. The embryonic cell lineage of the nematode Caenorhabditis elegans. Dev. Biol. 1983;100:64–119. doi: 10.1016/0012-1606(83)90201-4. [DOI] [PubMed] [Google Scholar]
- 8.Brunet T., King N. The Origin of Animal Multicellularity and Cell Differentiation. Dev. Cell. 2017;43:124–140. doi: 10.1016/j.devcel.2017.09.016. [DOI] [PMC free article] [PubMed] [Google Scholar]
- 9.Rokas A. The Origins of Multicellularity and the Early History of the Genetic Toolkit For Animal Development. Annu. Rev. Genet. 2008;42:235–251. doi: 10.1146/annurev.genet.42.110807.091513. [DOI] [PubMed] [Google Scholar]
- 10.Kumar K., Mella-Herrera R.A., Golden J.W. Cyanobacterial Heterocysts. Cold Spring Harb. Perspect. Biol. 2010;2:a000315. doi: 10.1101/cshperspect.a000315. [DOI] [PMC free article] [PubMed] [Google Scholar]
- 11.Claessen D., Rozen D.E., Kuipers O.P., Søgaard-Andersen L., van Wezel G.P. Bacterial solutions to multicellularity: a tale of biofilms, filaments and fruiting bodies. Nat. Rev. Microbiol. 2014;12:115–124. doi: 10.1038/nrmicro3178. [DOI] [PubMed] [Google Scholar]
- 12.Golden J.W. Bacterial Genomes, Physical Structure and Analysis. Springer; 1998. Bacterial Genomes, Physical Structure and Analysis; pp. 162–173. [Google Scholar]
- 13.van der Woude M.W., Bäumler A.J. Phase and Antigenic Variation in Bacteria. Clin. Microbiol. Rev. 2004;17:581–611. doi: 10.1128/CMR.17.3.581-611.2004. [DOI] [PMC free article] [PubMed] [Google Scholar]
- 14.Manning P.A., Kaufmann A., Roll U., Pohlner J., Meyer T.F., Haas R. L-pilin variants of Neisseria gonorrhoeae MS11. Mol. Microbiol. 1991;5:917–926. doi: 10.1111/j.1365-2958.1991.tb00766.x. [DOI] [PubMed] [Google Scholar]
- 15.Colijn C., Mackey M.C. A mathematical model of hematopoiesis—I. Periodic chronic myelogenous leukemia. J. Theor. Biol. 2005;237:117–132. doi: 10.1016/j.jtbi.2005.03.033. [DOI] [PubMed] [Google Scholar]
- 16.Buenrostro J.D., Corces M.R., Lareau C.A., Wu B., Schep A.N., Aryee M.J., Majeti R., Chang H.Y., Greenleaf W.J. Integrated Single-Cell Analysis Maps the Continuous Regulatory Landscape of Human Hematopoietic Differentiation. Cell. 2018;173:1535–1548.e16. doi: 10.1016/j.cell.2018.03.074. [DOI] [PMC free article] [PubMed] [Google Scholar]
- 17.Karin O., Alon U. Biphasic response as a mechanism against mutant takeover in tissue homeostasis circuits. Mol. Syst. Biol. 2017;13:933. doi: 10.15252/msb.20177599. [DOI] [PMC free article] [PubMed] [Google Scholar]
- 18.Aktipis C.A., Boddy A.M., Jansen G., Hibner U., Hochberg M.E., Maley C.C., Wilkinson G.S. Cancer across the tree of life: cooperation and cheating in multicellularity. Philos. Trans. R. Soc. Lond. B Biol. Sci. 2015;370:20140219. doi: 10.1098/rstb.2014.0219. [DOI] [PMC free article] [PubMed] [Google Scholar]
- 19.Lara-Astiaso D., Weiner A., Lorenzo-Vivas E., Zaretsky I., Jaitin D.A., David E., Keren-Shaul H., Mildner A., Winter D., Jung S., et al. Immunogenetics. Chromatin state dynamics during blood formation. Science. 2014;345:943–949. doi: 10.1126/science.1256271. [DOI] [PMC free article] [PubMed] [Google Scholar]
- 20.Agarwal A., Bolosky W.J., Wilson D.B., Eide C.A., Olson S.B., Fan G., Druker B.J. Differentiation of leukemic blasts is not completely blocked in acute myeloid leukemia. Proc. Natl. Acad. Sci. USA. 2019;116:24593–24599. doi: 10.1073/pnas.1904091116. [DOI] [PMC free article] [PubMed] [Google Scholar]
- 21.Foley C., Mackey M.C. Dynamic hematological disease: a review. J. Math. Biol. 2009;58:285–322. doi: 10.1007/s00285-008-0165-3. [DOI] [PubMed] [Google Scholar]
- 22.Williams R.L., Murray R.M. Integrase-mediated differentiation circuits improve evolutionary stability of burdensome and toxic functions in E. coli. Nat. Commun. 2022;13:6822. doi: 10.1038/s41467-022-34361-y. [DOI] [PMC free article] [PubMed] [Google Scholar]
- 23.Hart Y., Reich-Zeliger S., Antebi Y.E., Zaretsky I., Mayo A.E., Alon U., Friedman N. Paradoxical Signaling by a Secreted Molecule Leads to Homeostasis of Cell Levels. Cell. 2014;158:1022–1032. doi: 10.1016/j.cell.2014.07.033. [DOI] [PubMed] [Google Scholar]
- 24.Foster K.R., Shaulsky G., Strassmann J.E., Queller D.C., Thompson C.R.L. Pleiotropy as a mechanism to stabilize cooperation. Nature. 2004;431:693–696. doi: 10.1038/nature02894. [DOI] [PubMed] [Google Scholar]
- 25.Bouchard C., Staller P., Eilers M. Control of cell proliferation by Myc. Trends Cell Biol. 1998;8:202–206. doi: 10.1016/s0962-8924(98)01251-3. [DOI] [PubMed] [Google Scholar]
- 26.Zou J., Li X.L., Shi Z.M., Xue J.F. Effects of C-myc gene silencing on interleukin-1β-induced rat chondrocyte cell proliferation, apoptosis and cytokine expression. J. Bone Miner. Metab. 2018;36:286–296. doi: 10.1007/s00774-017-0845-4. [DOI] [PubMed] [Google Scholar]
- 27.Hofmann J.W., Zhao X., De Cecco M., Peterson A.L., Pagliaroli L., Manivannan J., Hubbard G.B., Ikeno Y., Zhang Y., Feng B., et al. Reduced Expression of MYC Increases Longevity and Enhances Healthspan. Cell. 2015;160:477–488. doi: 10.1016/j.cell.2014.12.016. [DOI] [PMC free article] [PubMed] [Google Scholar]
- 28.Grieb B.C., Boyd K., Mitra R., Eischen C.M. Haploinsufficiency of the Myc regulator Mtbp extends survival and delays tumor development in aging mice. Aging. 2016;8:2590–2602. doi: 10.18632/aging.101092. [DOI] [PMC free article] [PubMed] [Google Scholar]
- 29.Lowe S.W., Cepero E., Evan G. Intrinsic tumour suppression. Nature. 2004;432:307–315. doi: 10.1038/nature03098. [DOI] [PubMed] [Google Scholar]
- 30.Evan G.I., Wyllie A.H., Gilbert C.S., Littlewood T.D., Land H., Brooks M., Waters C.M., Penn L.Z., Hancock D.C. Induction of apoptosis in fibroblasts by c-myc protein. Cell. 1992;69:119–128. doi: 10.1016/0092-8674(92)90123-t. [DOI] [PubMed] [Google Scholar]
- 31.Ma Y., Budde M.W., Mayalu M.N., Zhu J., Lu A.C., Murray R.M., Elowitz M.B. Synthetic mammalian signaling circuits for robust cell population control. Cell. 2022;185:967–979.e12. doi: 10.1016/j.cell.2022.01.026. [DOI] [PMC free article] [PubMed] [Google Scholar]
- 32.Mayalu M.N., Murray R.M. 2020. Theoretical Design of Paradoxical Signaling-Based Synthetic Population Control Circuit in E. coli. Preprint at bioRxiv. [Google Scholar]
- 33.Elowitz M., Lim W.A. Build life to understand it. Nature. 2010;468:889–890. doi: 10.1038/468889a. [DOI] [PMC free article] [PubMed] [Google Scholar]
- 34.Ebrahimkhani M.R., Ebisuya M. Synthetic developmental biology: build and control multicellular systems. Curr. Opin. Chem. Biol. 2019;52:9–15. doi: 10.1016/j.cbpa.2019.04.006. [DOI] [PubMed] [Google Scholar]
- 35.Sleight S.C., Bartley B.A., Lieviant J.A., Sauro H.M. Designing and engineering evolutionary robust genetic circuits. J. Biol. Eng. 2010;4:12. doi: 10.1186/1754-1611-4-12. [DOI] [PMC free article] [PubMed] [Google Scholar]
- 36.Nevozhay D., Adams R.M., Van Itallie E.V., Bennett M.R., Balázsi G. Mapping the Environmental Fitness Landscape of a Synthetic Gene Circuit. PLoS Comput. Biol. 2012;8 doi: 10.1371/journal.pcbi.1002480. [DOI] [PMC free article] [PubMed] [Google Scholar]
- 37.Menuhin-Gruman I., Arbel M., Amitay N., Sionov K., Naki D., Katzir I., Edgar O., Bergman S., Tuller T. Evolutionary Stability Optimizer (ESO): A Novel Approach to Identify and Avoid Mutational Hotspots in DNA Sequences While Maintaining High Expression Levels. ACS Synth. Biol. 2022;11:1142–1151. doi: 10.1021/acssynbio.1c00426. [DOI] [PMC free article] [PubMed] [Google Scholar]
- 38.Arbel-Groissman M., Menuhin-Gruman I., Naki D., Bergman S., Tuller T. Fighting the battle against evolution: designing genetically modified organisms for evolutionary stability. Trends Biotechnol. 2023;41:1518–1531. doi: 10.1016/j.tibtech.2023.06.008. [DOI] [PubMed] [Google Scholar]
- 39.Ceroni F., Boo A., Furini S., Gorochowski T.E., Borkowski O., Ladak Y.N., Awan A.R., Gilbert C., Stan G.B., Ellis T. Burden-driven feedback control of gene expression. Nat. Methods. 2018;15:387–393. doi: 10.1038/nmeth.4635. [DOI] [PubMed] [Google Scholar]
- 40.Kasari M., Kasari V., Kärmas M., Jõers A. Decoupling Growth and Production by Removing the Origin of Replication from a Bacterial Chromosome. ACS Synth. Biol. 2022;11:2610–2622. doi: 10.1021/acssynbio.1c00618. [DOI] [PMC free article] [PubMed] [Google Scholar]
- 41.Roquet N., Soleimany A.P., Ferris A.C., Aaronson S., Lu T.K. Synthetic recombinase-based state machines in living cells. Science. 2016;353:aad8559. doi: 10.1126/science.aad8559. [DOI] [PubMed] [Google Scholar]
- 42.Shao B., Rammohan J., Anderson D.A., Alperovich N., Ross D., Voigt C.A. Single-cell measurement of plasmid copy number and promoter activity. Nat. Commun. 2021;12:1475. doi: 10.1038/s41467-021-21734-y. [DOI] [PMC free article] [PubMed] [Google Scholar]
- 43.Yang L., Nielsen A.A.K., Fernandez-Rodriguez J., McClune C.J., Laub M.T., Lu T.K., Voigt C.A. Permanent genetic memory with >1-byte capacity. Nat. Methods. 2014;11:1261–1266. doi: 10.1038/nmeth.3147. [DOI] [PMC free article] [PubMed] [Google Scholar]
- 44.Bonnet J., Subsoontorn P., Endy D. Rewritable digital data storage in live cells via engineered control of recombination directionality. Proc. Natl. Acad. Sci. USA. 2012;109:8884–8889. doi: 10.1073/pnas.1202344109. [DOI] [PMC free article] [PubMed] [Google Scholar]
- 45.Yang J., Axelrod D.E., Komarova N.L. Determining the control networks regulating stem cell lineages in colonic crypts. J. Theor. Biol. 2017;429:190–203. doi: 10.1016/j.jtbi.2017.06.033. [DOI] [PMC free article] [PubMed] [Google Scholar]
- 46.Mittnenzweig M., Mayshar Y., Cheng S., Ben-Yair R., Hadas R., Rais Y., Chomsky E., Reines N., Uzonyi A., Lumerman L., et al. A single-embryo, single-cell time-resolved model for mouse gastrulation. Cell. 2021;184:2825–2842.e22. doi: 10.1016/j.cell.2021.04.004. [DOI] [PMC free article] [PubMed] [Google Scholar]
- 47.Farrell J.A., Wang Y., Riesenfeld S.J., Shekhar K., Regev A., Schier A.F. Single-cell reconstruction of developmental trajectories during zebrafish embryogenesis. Science. 2018;360:eaar3131. doi: 10.1126/science.aar3131. [DOI] [PMC free article] [PubMed] [Google Scholar]
- 48.Meyer A.J., Segall-Shapiro T.H., Glassey E., Zhang J., Voigt C.A. Escherichia coli “Marionette” strains with 12 highly optimized small-molecule sensors. Nat. Chem. Biol. 2019;15:196–204. doi: 10.1038/s41589-018-0168-3. [DOI] [PubMed] [Google Scholar]
- 49.Wahl M.E., Murray A.W. Multicellularity makes somatic differentiation evolutionarily stable. Proc. Natl. Acad. Sci. USA. 2016;113:8362–8367. doi: 10.1073/pnas.1608278113. [DOI] [PMC free article] [PubMed] [Google Scholar]
- 50.Barker N., Bartfeld S., Clevers H. Tissue-Resident Adult Stem Cell Populations of Rapidly Self-Renewing Organs. Cell Stem Cell. 2010;7:656–670. doi: 10.1016/j.stem.2010.11.016. [DOI] [PubMed] [Google Scholar]
- 51.Blanpain C., Fuchs E. Stem cell plasticity. Plasticity of epithelial stem cells in tissue regeneration. Science. 2014;344:1242281. doi: 10.1126/science.1242281. [DOI] [PMC free article] [PubMed] [Google Scholar]
- 52.Simons B.D., Clevers H. Strategies for Homeostatic Stem Cell Self-Renewal in Adult Tissues. Cell. 2011;145:851–862. doi: 10.1016/j.cell.2011.05.033. [DOI] [PubMed] [Google Scholar]
- 53.Alon U. Second Edition. CRC Press; 2019. An Introduction to Systems Biology: Design Principles of Biological Circuits. [Google Scholar]
- 54.Tóth B., Ben-Moshe S., Gavish A., Barkai N., Itzkovitz S. Early commitment and robust differentiation in colonic crypts. Mol. Syst. Biol. 2017;13:902. doi: 10.15252/msb.20167283. [DOI] [PMC free article] [PubMed] [Google Scholar]
- 55.Endy D. Foundations for engineering biology. Nature. 2005;438:449–453. doi: 10.1038/nature04342. [DOI] [PubMed] [Google Scholar]
- 56.You L., Cox R.S., Weiss R., Arnold F.H. Programmed population control by cell–cell communication and regulated killing. Nature. 2004;428:868–871. doi: 10.1038/nature02491. [DOI] [PubMed] [Google Scholar]
- 57.Chan C.T.Y., Lee J.W., Cameron D.E., Bashor C.J., Collins J.J. “Deadman” and “Passcode” microbial kill switches for bacterial containment. Nat. Chem. Biol. 2016;12:82–86. doi: 10.1038/nchembio.1979. [DOI] [PMC free article] [PubMed] [Google Scholar]
- 58.Sleight S.C., Sauro H.M. Visualization of Evolutionary Stability Dynamics and Competitive Fitness of Escherichia coli Engineered with Randomized Multigene Circuits. ACS Synth. Biol. 2013;2:519–528. doi: 10.1021/sb400055h. [DOI] [PubMed] [Google Scholar]
- 59.Chlebek J.L., Leonard S.P., Kang-Yun C., Yung M.C., Ricci D.P., Jiao Y., Park D.M. Prolonging genetic circuit stability through adaptive evolution of overlapping genes. Nucleic Acids Res. 2023;51:7094–7108. doi: 10.1093/nar/gkad484. [DOI] [PMC free article] [PubMed] [Google Scholar]
- 60.Yang S., Sleight S.C., Sauro H.M. Rationally designed bidirectional promoter improves the evolutionary stability of synthetic genetic circuits. Nucleic Acids Res. 2013;41:e33. doi: 10.1093/nar/gks972. [DOI] [PMC free article] [PubMed] [Google Scholar]
- 61.Stirling F., Bitzan L., O’Keefe S., Redfield E., Oliver J.W.K., Way J., Silver P.A. Rational Design of Evolutionarily Stable Microbial Kill Switches. Mol. Cell. 2017;68:686–697.e3. doi: 10.1016/j.molcel.2017.10.033. [DOI] [PMC free article] [PubMed] [Google Scholar]
- 62.González C., Ray J.C.J., Manhart M., Adams R.M., Nevozhay D., Morozov A.V., Balázsi G. Stress-response balance drives the evolution of a network module and its host genome. Mol. Syst. Biol. 2015;11:827. doi: 10.15252/msb.20156185. [DOI] [PMC free article] [PubMed] [Google Scholar]
- 63.Kheir Gouda M.K., Manhart M., Balázsi G. Evolutionary regain of lost gene circuit function. Proc. Natl. Acad. Sci. USA. 2019;116:25162–25171. doi: 10.1073/pnas.1912257116. [DOI] [PMC free article] [PubMed] [Google Scholar]
- 64.Brenner K., You L., Arnold F.H. Engineering microbial consortia: a new frontier in synthetic biology. Trends Biotechnol. 2008;26:483–489. doi: 10.1016/j.tibtech.2008.05.004. [DOI] [PubMed] [Google Scholar]
- 65.Molinari S., Shis D.L., Bhakta S.P., Chappell J., Igoshin O.A., Bennett M.R. A synthetic system for asymmetric cell division in Escherichia coli. Nat. Chem. Biol. 2019;15:917–924. doi: 10.1038/s41589-019-0339-x. [DOI] [PMC free article] [PubMed] [Google Scholar]
- 66.Glass D.S., Riedel-Kruse I.H. A Synthetic Bacterial Cell-Cell Adhesion Toolbox for Programming Multicellular Morphologies and Patterns. Cell. 2018;174:649–658.e16. doi: 10.1016/j.cell.2018.06.041. [DOI] [PubMed] [Google Scholar]
- 67.Kim H., Skinner D.J., Glass D.S., Hamby A.E., Stuart B.A.R., Dunkel J., Riedel-Kruse I.H. 4-bit adhesion logic enables universal multicellular interface patterning. Nature. 2022;608:324–329. doi: 10.1038/s41586-022-04944-2. [DOI] [PMC free article] [PubMed] [Google Scholar]
- 68.Bier E. Gene drives gaining speed. Nat. Rev. Genet. 2022;23:5–22. doi: 10.1038/s41576-021-00386-0. [DOI] [PMC free article] [PubMed] [Google Scholar]
- 69.Gallagher R.R., Patel J.R., Interiano A.L., Rovner A.J., Isaacs F.J. Multilayered genetic safeguards limit growth of microorganisms to defined environments. Nucleic Acids Res. 2015;43:1945–1954. doi: 10.1093/nar/gku1378. [DOI] [PMC free article] [PubMed] [Google Scholar]
- 70.Zheng E.J., Andrews I.W., Grote A.T., Manson A.L., Alcantar M.A., Earl A.M., Collins J.J. Modulating the evolutionary trajectory of tolerance using antibiotics with different metabolic dependencies. Nat. Commun. 2022;13:2525. doi: 10.1038/s41467-022-30272-0. [DOI] [PMC free article] [PubMed] [Google Scholar]
- 71.Deris J.B., Kim M., Zhang Z., Okano H., Hermsen R., Groisman A., Hwa T. The Innate Growth Bistability and Fitness Landscapes of Antibiotic-Resistant Bacteria. Science. 2013;342:1237435. doi: 10.1126/science.1237435. [DOI] [PMC free article] [PubMed] [Google Scholar]
- 72.Jain K.K. Synthetic Biology and Personalized Medicine. Med. Princ. Pract. 2013;22:209–219. doi: 10.1159/000341794. [DOI] [PMC free article] [PubMed] [Google Scholar]
- 73.Xie Z., Wroblewska L., Prochazka L., Weiss R., Benenson Y. Multi-Input RNAi-Based Logic Circuit for Identification of Specific Cancer Cells. Science. 2011;333:1307–1311. doi: 10.1126/science.1205527. [DOI] [PubMed] [Google Scholar]
- 74.Ellis T. Predicting how evolution will beat us. Microb. Biotechnol. 2019;12:41–43. doi: 10.1111/1751-7915.13327. [DOI] [PMC free article] [PubMed] [Google Scholar]
- 75.Borkowski O., Ceroni F., Stan G.B., Ellis T. Overloaded and stressed: whole-cell considerations for bacterial synthetic biology. Curr. Opin. Microbiol. 2016;33:123–130. doi: 10.1016/j.mib.2016.07.009. [DOI] [PubMed] [Google Scholar]
- 76.Du X., O’Brien L.E., Riedel-Kruse I.H. A Model for Adult Organ Resizing Demonstrates Stem Cell Scaling through a Tunable Commitment Rate. Biophys. J. 2017;113:174–184. doi: 10.1016/j.bpj.2017.05.040. [DOI] [PMC free article] [PubMed] [Google Scholar]
- 77.Balagaddé F.K., You L., Hansen C.L., Arnold F.H., Quake S.R. Long-Term Monitoring of Bacteria Undergoing Programmed Population Control in a Microchemostat. Science. 2005;309:137–140. doi: 10.1126/science.1109173. [DOI] [PubMed] [Google Scholar]
- 78.Travisano M., Velicer G.J. Strategies of microbial cheater control. Trends Microbiol. 2004;12:72–78. doi: 10.1016/j.tim.2003.12.009. [DOI] [PubMed] [Google Scholar]
- 79.Nowak M.A. Five Rules for the Evolution of Cooperation. Science. 2006;314:1560–1563. doi: 10.1126/science.1133755. [DOI] [PMC free article] [PubMed] [Google Scholar]
- 80.Zhou X., Franklin R.A., Adler M., Jacox J.B., Bailis W., Shyer J.A., Flavell R.A., Mayo A., Alon U., Medzhitov R. Circuit Design Features of a Stable Two-Cell System. Cell. 2018;172:744–757.e17. doi: 10.1016/j.cell.2018.01.015. [DOI] [PMC free article] [PubMed] [Google Scholar]
- 81.Korem Kohanim Y.K., Tendler A., Mayo A., Friedman N., Alon U. Endocrine Autoimmune Disease as a Fragility of Immune Surveillance against Hypersecreting Mutants. Immunity. 2020;52:872–884.e5. doi: 10.1016/j.immuni.2020.04.022. [DOI] [PMC free article] [PubMed] [Google Scholar]
- 82.Li H. Minimap2: pairwise alignment for nucleotide sequences. Bioinformatics. 2018;34:3094–3100. doi: 10.1093/bioinformatics/bty191. [DOI] [PMC free article] [PubMed] [Google Scholar]
- 83.Danecek P., Bonfield J.K., Liddle J., Marshall J., Ohan V., Pollard M.O., Whitwham A., Keane T., McCarthy S.A., Davies R.M., et al. Twelve years of SAMtools and BCFtools. GigaScience. 2021;10:giab008. doi: 10.1093/gigascience/giab008. [DOI] [PMC free article] [PubMed] [Google Scholar]
- 84.Shen W., Le S., Li Y., Hu F. SeqKit: A Cross-Platform and Ultrafast Toolkit for FASTA/Q File Manipulation. PLoS One. 2016;11 doi: 10.1371/journal.pone.0163962. [DOI] [PMC free article] [PubMed] [Google Scholar]
- 85.Cock P.J.A., Antao T., Chang J.T., Chapman B.A., Cox C.J., Dalke A., Friedberg I., Hamelryck T., Kauff F., Wilczynski B., et al. Biopython: freely available Python tools for computational molecular biology and bioinformatics. Bioinformatics. 2009;25:1422–1423. doi: 10.1093/bioinformatics/btp163. [DOI] [PMC free article] [PubMed] [Google Scholar]
- 86.Cretu Stancu M., van Roosmalen M.J., Renkens I., Nieboer M.M., Middelkamp S., de Ligt J., Pregno G., Giachino D., Mandrile G., Espejo Valle-Inclan J., et al. Mapping and phasing of structural variation in patient genomes using nanopore sequencing. Nat. Commun. 2017;8:1326. doi: 10.1038/s41467-017-01343-4. [DOI] [PMC free article] [PubMed] [Google Scholar]
- 87.Baba T., Ara T., Hasegawa M., Takai Y., Okumura Y., Baba M., Datsenko K.A., Tomita M., Wanner B.L., Mori H. Construction of Escherichia coli K-12 in-frame, single-gene knockout mutants: the Keio collection. Mol. Syst. Biol. 2006;2:2006.0008. doi: 10.1038/msb4100050. [DOI] [PMC free article] [PubMed] [Google Scholar]
- 88.Salis H.M., Mirsky E.A., Voigt C.A. Automated design of synthetic ribosome binding sites to control protein expression. Nat. Biotechnol. 2009;27:946–950. doi: 10.1038/nbt.1568. [DOI] [PMC free article] [PubMed] [Google Scholar]
- 89.Lee C., Kim J., Shin S.G., Hwang S. Absolute and relative QPCR quantification of plasmid copy number in Escherichia coli. J. Biotechnol. 2006;123:273–280. doi: 10.1016/j.jbiotec.2005.11.014. [DOI] [PubMed] [Google Scholar]
Associated Data
This section collects any data citations, data availability statements, or supplementary materials included in this article.
Supplementary Materials
Data Availability Statement
-
•
Raw DNA sequencing data have been deposited at the NCBI Sequence Read Archive and are publicly available as of the date of publication. Sequence information for all plasmids has been deposited at GenBank. Accession numbers are listed in the key resources table.
-
•
All original code is included in this paper’s supplemental information.
-
•
Any additional information required to reanalyze the data reported in this paper is available from the lead contact upon request.