

Abstract
Over two metres of DNA is packaged into each nucleus in the human body in a manner that still allows for gene regulation. This remarkable feat is accomplished by the wrapping of DNA around histone proteins in repeating units of nucleosomes to form a structure known as chromatin. This chromatin structure is subject to various modifications that have profound influences on gene expression. Recently developed techniques to study chromatin modifications at a genome-wide scale are now allowing researchers to probe the complex components that make up epigenomes. Here we review genome-wide approaches to studying epigenomic structure and the exciting findings that have been obtained using these technologies.
The identity of each cell in a multicellular organism is determined by the unique gene-expression patterns of that cell type. This identity must be remembered and passed on to daughter cells by epigenetic mechanisms, which are heritable changes that do not involve changes in DNA sequence. ‘Epigenetics’ has been defined in the scientific literature in several ways, and some disagreement persists as to which phenomena are truly epigenetic (for recent discussions see REFS 1–4). For our purposes, we will define an epigenome as the combination of all chromatin modifications in any given cell type, including DNA methylation and post-translational histone modifications. Accordingly, complex organisms such as humans do not have a single epigenome, but instead have multiple epigenomes depending on the tissue type and developmental stage.
The combination of chromatin immunoprecipitation (ChIP)5 and DNA microarrays, a technique that is known as genome-wide location analysis or ChIP–chip, marked the beginning of an era of rapid progress in high-throughput studies, with studies of chromatin modifications being no exception. Although ChIP–chip was first used to map DNA-binding proteins on a genome-wide scale6,7, it did not take long before it was applied to map other phenomena globally, such as histone modifications8–10 and nucleosome distribution11–13.
In the past few years, various sequencing-based protocols have been developed to analyse ChIP samples. Most of them combine ChIP with serial analysis of gene expression (SAGE), including the serial analysis of chromatin occupancy (SACO)14, the genome-wide mapping technique (GMAT)15 and ChIP combined with paired-end ditag sequencing (ChIP–PET)16. The recent combination of ChIP with massively parallel sequencing (ChIP–Seq)17–20 allows researchers to survey more of the genome in less time and promises to unveil new aspects of biology in the coming years.
Application of these techniques has led to great advances in our understanding of how epigenetic phenomena are regulated and how they affect gene expression. Here we focus on the technical aspects of genome-scale approaches to study epigenomes (for recent reviews on epigenetics and epigenomics see REFS 3,4,21,22). Although these techniques are equally applicable to the analysis of DNA- and chromatin-binding proteins, including chromatin-modifying enzymes and non-histone structural proteins that can directly or indirectly affect epigenomic structure, we mainly review their application to profiling DNA methylation, histone modifications, nucleosome positioning and chromatin accessibility, and summarize the most interesting results that have been obtained with each technique.
DNA methylation
In mammals, DNA methylation is confined to the addition of a methyl group to the cytosine in a CpG dinucleotide. This covalent modification is known to have an essential role in genome function, with involvement in processes such as gene regulation, chromosomal stability and parental imprinting23. GC-rich regions within mammalian genomes, which are known as CpG islands24,25, are resistant to methylation and are associated with most human genes26,27. De novo methylation of promoters that contain CpG islands leads to gene inactivation23. DNA methylation of transcription-factor-binding sites can influence their binding28–30, and aberrant DNA methylation is a well-established marker of cancer (see REFS 22, 31–34 for reviews).
Genome-scale approaches to studying DNA methylation.
Studies of DNA methylation on a genomic scale primarily rely on local techniques combined with global approaches such as DNA microarrays or high-throughput sequencing. The most important local techniques include genomic mapping of cleavage sites by restriction enzymes that differentiate between methylated and unmethylated CpG DNA sequences, sequencing of DNA after treatment with sodium bisulphite, which converts all unmethylated cytosines to uracils, affinity purification with methylcytosine DNA-binding domain (MBD) proteins, and immunoprecipitation of DNA with an antibody that recognizes 5-methyl cytosine (known as MeDIP, mDIP or mCIP).
Restriction enzymes were first used to study DNA methylation by Bird and Southern35, and many studies in the following years adopted this technique36–38. In one application of this approach, researchers use a restriction enzyme that only recognizes a specific ummethylated DNA sequence to identify a particular region as being unmethylated (cleaved) or methylated (uncleaved) (FIG. 1a). Other restriction enzymes, such as McrBC, specifically recognize methylated DNA sequence. The main advantage of such an approach is that it easily allows profiling of large genomic regions through the identification of cleavage sites. One disadvantage is that it is limited to studying DNA methylation that occurs within restriction enzyme sites. Restriction enzymes have been combined with microarrays to profile DNA methylation at a genome-wide level using CpG island microarrays39,40. More recently, restriction enzymes have been combined with direct sequencing to determine global methylation patterns in human brain DNA41.
Figure 1 |. Genome-wide methods for studying DNA methylation.

a | Restriction enzyme. DNA methylation can be identified using restriction enzymes that differentially recognize methylated and unmethylated cytosine bases. The recognition site for HpaII (CCGG) is shown as an example. Other restriction enzymes (and recognition sites) include AciI (CCGC and GCGG), BstUI (CGCG), HhaI (GCGC) and TaiI (ACGT). b | Bisulphite treatment. The treatment of DNA with bilsulphite changes all unmethylated cytosines to uracils, leaving methylated cytosines unchanged. c | Immunoprecipitation of methylated DNA (mCIP). DNA is first sonicated and an antibody that is specific to methylated cytosines is used to pull down methylated regions. Any of these methods can be combined with either hybridization to DNA microarrays or direct sequencing to study DNA methylation on a genomic scale.
Treating DNA with bisulphite converts all cytosine residues to uracil but leaves 5-methylcytosines unchanged (FIG. 1b). The utility of this selective conversion for studying DNA methylation was first recognized by Frommer and colleagues42 who treated DNA with bisulphite, amplified the DNA with PCR and sequenced the products. Although this technique is highly accurate, until recently it has proved difficult to apply to large genomic regions because examining bisulphite-treated DNA is labour-intensive. Various techniques have been introduced to increase the throughput of bisulphite experiments, combining bisulphite treatment with methylation-specific PCR that uses primers that are specific for methylated DNA43,44. Although these methods test only one CpG at a time, they can easily monitor multiple samples simultaneously. Additionally, Meissner and colleagues have developed an approach termed reduced representation bisulphite sequencing (RRBS) for large-scale analysis of bisulphite-treated DNA. In this method, restriction fragments of between 500bp and 600bp from BglII cleavage of genomic DNA are ligated to an adaptor and treated with sodium bisulphite. Following denaturation, the two strands are PCR-amplified separately, cloned and sequenced45. In principle, this technique can be extended to cover the entire genome by using other methods of DNA fragmentation.
In recent years, bisulphite treatment has been used in combination with microarrays46,47 and high-throughput sequencing48 to study DNA methylation at a genome-wide level. The analysis of bisulphite-treated DNA using oligonucleotide arrays utilizes the fact that after bisulphite treatment, unmethylated DNA will contain uracil in place of cytosine and hybridize poorly to array oligonucleotides that contain guanine. Methylated DNA, however, will hybridize as usual. A major limitation of this technique is that regions with low levels of methylation might not hybridize to the array following bisulphite treatment, making interpretation of the results difficult49.
Bisulphite treatment has also been combined with bead arrays produced by Illumina to profile DNA methylation at single-base resolution50. Here, bisulphite-treated DNA is assayed with two primers, one that hybridizes to cytosine and one that hybridizes to uracil. The primers are labelled with different fluorescent dyes and used in a PCR reaction with methylation-insensitive primers. The ratio of the PCR products can then be determined with the bead array. Although this approach leads to less coverage than other array-based techniques, almost single-base resolution can be obtained and many samples can be processed in parallel.
Sequencing of PCR-amplified products of bisulphite-treated DNA to profile DNA methylation at the human major histocompatibility complex was recently used in a pilot study by the Human Epigenome Project51. Ultimately, this consortium-led project has the ambitious goal of mapping DNA methylation throughout the human genome in all major tissues. The pilot project was scaled up to profile DNA methylation across human chromosomes 6, 20 and 22 in 12 healthy tissues, covering 22% of the CpGs on these chromosomes52. These studies found that DNA methylation is essentially bimodal, with the majority of regions that were profiled exhibiting either hypo- or hypermethylation.
In the past few years, several groups have combined immunoprecipitation of methylated DNA with microarrays to study DNA methylation at a genomic scale in human cells53,54 (FIG. 1c). These studies, called MeDIP, mDIP or mCIP, use an antibody that recognizes 5-methylcytosine to enrich methylated DNA by immunoprecipitation. Recently, mCIP has been combined with tiling microarrays to provide a DNA methylation map of the Arabidopsis thaliana genome55,56, and with high-density promoter arrays to map the human promoter methylome57,58. To confirm their mCIP–chip results, Zhang and colleagues also isolated methylated DNA using the MBD from human methyl CpG-binding protein 2 (MECP2) and hybridized these to the same tiling arrays that were used for mCIP–chip. The mCIP method recovered ~95% of the regions that had been detected with MBD–chip as well as ~20% more regions. They reasoned that the difference is probably due to MBD binding requiring a high density of methylcytosine in CpG dinucleotides and the fact that not all of the eluted fractions from the MBD column were hybridized to arrays55. Both of these two A. thaliana studies found that the promoter and the transcribed regions can be differentially methylated, and that this is related to the expression status55,56.
Bioinformatic studies of DNA methylation.
Several groups have now begun to use computational methods to study the DNA sequence features that determine methylation patterns. Das and colleagues examined the effectiveness of several computational pattern-recognition methods to predict the DNA methylation status of DNA in human neural tissue59. Using a support vector machine (SVM) approach, which is a machine learning technique used for classifying data, they were able to achieve 86% prediction accuracy. Similar methods that are trained on brain tissue methylation data have been shown to predict methylation status correctly for about two thirds of other tissues60, suggesting that the underlying DNA sequence is an important component in determining methylation patterns.
Bock and colleagues examined the correlation between over 1,000 DNA attributes with methylation data from human blood cells. They identified a few classes of attributes that correlate most highly with methylation, namely DNA sequence patterns, sequence repeats and, to a lesser extent, predicted DNA structure. They then trained an SVM and predicted CpG island methylation status, achieving an accuracy of 90% when tested on 12 CpG islands with unknown methylation status on human chromosome 21 (REF. 61). The same group went on to develop computational methods to identify CpG islands and quantify the strength of each identified CpG island by incorporating epigenetic as well as DNA sequence information62.
Post-translational histone modifications
Histone proteins are subject to a number of covalent modifications, primarily at their N-terminal tails, including methylation, acetylation, phosphorylation, ubiquitylation and ADP-ribosylation. Various models such as the charge-neutralization model63 and the histone code64,65, as well as a signalling-pathway model66, have been proposed to explain the role of histone modifications in transcription (see BOX 1 for details).
Box 1 |. Models of the functions of histone modification.
There are three popular models that attempt to explain the function of post-translational histone modifications in gene regulation: the charge-neutralization model, the histone-code model and the signalling-pathway model. Below we briefly outline the fundamentals of each model.
Charge neutralization
It is known that the specific modifications of histone acetylation and histone phosphorylation change the overall charge of the chromatin structure. The acetylation of histones neutralizes positive charges on DNA and phosphorylation adds a negative charge. According to the charge-neutralization model, these modifications can lead to a general decondensation of the chromatin fibre65. Indeed, there is evidence that histone acetylation can relax chromatin structure in vitro144.
Histone code
The histone code was originally introduced to explain how multiple histone modifications occurring in the same region could control gene regulation. The histone-code hypothesis states that multiple histone modifications can function combinatorially or sequentially to regulate downstream functions66,67.
Signalling pathway
The signalling-pathway model postulates that histone modifications can serve as signalling platforms to facilitate binding of enzymes for their function on chromatin68. More general than the histone-code model, this model suggests that multiple histone modifications can provide bistability, robustness and specificity through feedback loops, redundancy and combination.
Although histone modifications have been studied for several decades now, the past few years have witnessed a dramatic increase in the amount of information about the functions of these covalent histone modifications (see REFS 67,68 for recent reviews). Major contributions to this knowledge have come from the development of genome-wide approaches for studying histone modifications, and the results that have been obtained using these techniques. Most of the existing methods for studying histone modifications on a genomic scale combine the use of ChIP with high-throughput techniques including DNA microarrays and high-throughput sequencing.
Genome-scale approaches to studying histone modifications.
The most prevalent technique used to map histone modifications at a genomic scale has been the combination of ChIP with DNA microarrays (ChIP–chip) (FIG. 2). Briefly, chromatin fragments are isolated using antibodies that are specific to a feature of interest and the isolated fragments are amplified to generate micrograms of fluorescently labelled DNA; this is followed by hybridization to DNA microarrays. The first ChIP–chip studies of histone modifications in Saccharomyces cerevisiae8,9 and Drosophila melanogaster69 suggested that histone modifications are associated with distinct genomic regions and with distinct transcription states. These studies were followed by other ChIP–chip studies with higher resolution tiling arrays in yeast70,71 that further reinforced the concept of redundancy in histone-modification maps. ChIP–chip has also been used to profile histone modifications in mammalian genomes72–75.
Figure 2 |. Chromatin immunoprecipitation combined with DNA microarrays (ChIP–chip).

The ChIP–chip method can be used to study many of the epigenomic phenomena discussed in this Review. The example presented here shows how ChIP–chip can be used to study histone modifications. Modified chromatin is first purified by immunoprecipitating crosslinked chromatin using an antibody that is specific to a particular histone modification (shown in green). DNA is then amplified to obtain sufficient DNA. The colour-labelled ChIP DNA, together with the control DNA prepared from input chromatin and labelled with a different colour, is hybridized to a DNA microarray. The microarray probes can then be mapped to the genome to yield genomic coordinates.
Another high-throughput technique that combines ChIP with SAGE is GMAT15, which is also known as ChIP–SAGE (FIG. 3). Here, ChIP is carried out and is followed by SAGE. Short sequence tags of 21 bp are extracted from the sequencing library and mapped to a reference genome. The number of tags that are detected at a genomic region directly correlates with the modification level of the region. Since there is no probe hybridization involved in the process, the results obtained from GMAT might be more quantitative than ChIP–chip, though these two techniques have not been directly compared.
Figure 3 |. Chromatin immunoprecipitation combined with serial analysis of gene expression (ChIP–SAGE).

The combination of ChIP experiments with SAGE can be used to profile histone modifications at a genomic scale. The ChIP–SAGE procedure begins with a ChIP step to purify chromatin regions that are associated with a specific histone modification (shown in green), and proceeds as follows. First, crosslinks are reversed, a biotinylated universal linker (UL) is ligated to DNA ends and DNA is bound to streptavidin beads. Then NlaIII, which recognizes CATG, is used to digest DNA and a linker containing the recognition sequence of MmeI is ligated to the cleaved DNA ends. MmeI digestion produces 21–22 bp sequence tags from the immunoprecipitated fragments; the sequence tags are concatenated, cloned into a sequencing vector and sequenced. About 20 to 30 short sequence tags of 21 bp can be generated from each sequencing reaction. The sequence tags can then be mapped to the genome to identify modified regions.
ChIP–Seq is a recently developed technique for analysing ChIP DNA using a high-throughput massively parallel signature sequencing-like technique developed by Solexa (FIG. 4). Briefly, the ChIP DNA is ligated to a pair of adaptors and subjected to very limited amplification to generate ~200 ng of DNA. It is then bound by hybridization on a solid surface to covalently bonded oligos that are complementary to the adaptor sequences. A short sequence (25–50 bp) for each of the 30–60 million DNA templates is then determined from its end by ‘sequencing-by-synthesis’, which is a modified Sanger sequencing procedure. The first applications of ChIP–Seq to profile histone modifications were done in CD4+ T cells17 and mouse embryonic stem (ES) cells20. The number of sequenced reads that are mapped to a genomic locus is directly proportional to its modification level. Because ChIP–Seq requires less PCR amplification and does not depend on the efficiency of probe hybridization, in contrast to ChIP–chip, it is probably more quantitative and the modification levels that are obtained in ChIP–Seq experiments at different genomic regions can be directly compared. See BOX 2 for a comparison of ChIP–chip, ChIP–SAGE and ChIP–Seq techniques.
Figure 4 |. Chromatin immunoprecipitation combined with high-throughput sequencing techniques (ChIP–Seq).
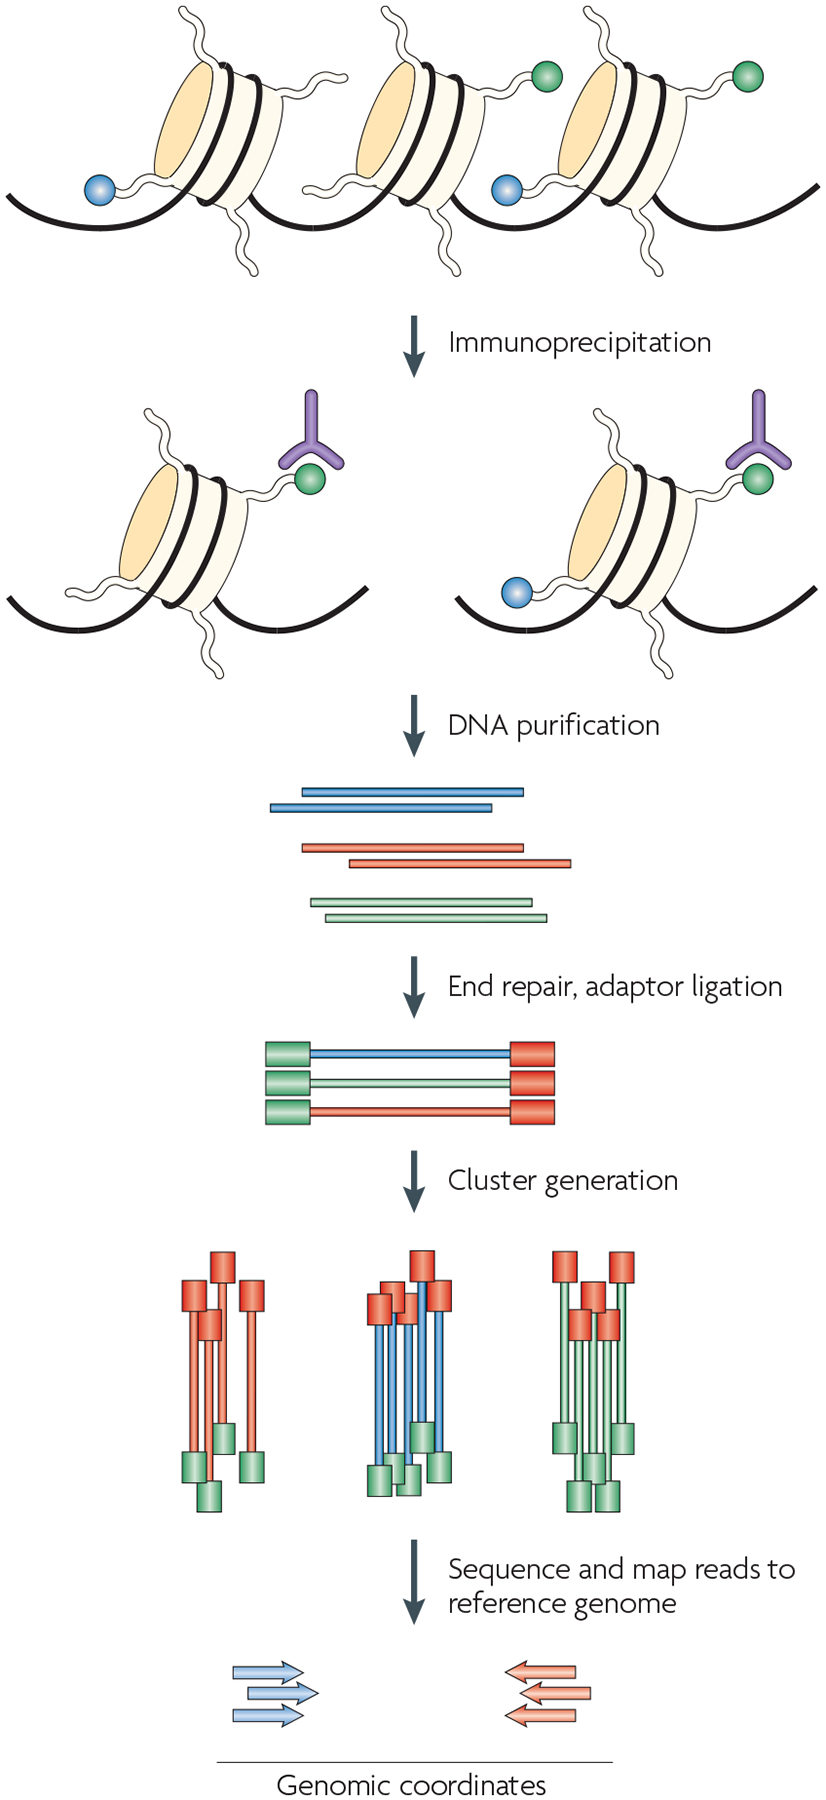
One of the most exciting recent advances in technologies for studying epigenetic phenomena at a genomic scale relies on the combination of ChIP experiments with high-throughput sequencing. The procedure that is outlined here is specific to the Illumina Genome Analyzer using Solexa technology, although other high-throughput sequencing techniques would also work in principle. The first step is the purification of modified chromatin by immunoprecipitation using an antibody that is specific to a particular histone modification (shown in green). The ChIP DNA ends are repaired and ligated to a pair of adaptors, followed by limited PCR amplification. The DNA molecules are bound to the surface of a flow cell that contains covalently bound oligonucleotides that recognize the adaptor sequences. Clusters of individual DNA molecules are generated by solid-phase PCR and sequencing by synthesis is performed. The resulting sequence reads are mapped to a reference genome to obtain genomic coordinates that correspond to the immunoprecipitated fragments.
Box 2 |. Comparison of ChIP–chip, ChIP–SAGE and ChIP–Seq.
Resolution
The resolution of ChIP–Seq depends on the size of the chromatin fragments that are used for ChIP (chromatin immunoprecipitation), as well as the depth of sequencing. Using mononucleosomes generated by micrococcal nuclease digestion, the histone modification signals that are detected by ChIP–Seq can be assigned to individual nucleosomes in the genome. The resolution of ChIP–chip depends on both the size of the chromatin fragments that are used for ChIP and the probes on the array. The resolution of ChIP-SAGE (serial analysis of gene expression) depends on how frequently restriction enzyme sites occur in the DNA that has been subject to ChIP.
Quantification
For ChIP–chip, the quantification depends on the hybridization efficiency of the ChIP DNA molecules to the probes on the array, which can vary dramatically depending on the sequence. No hybridization is required for ChIP–Seq and the ChIP DNA is minimally amplified to generate clusters of molecules that are directly counted by the sequencing procedure. Similar to ChIP–Seq, no hybridization is required for ChIP–SAGE. Much less PCR amplification of the ChIP DNA is required for ChIP–Seq than for ChIP–chip; therefore, ChIP–Seq and ChIP–SAGE are probably more quantitative that ChIP–chip.
Cost
To achieve nucleosome resolution in mammalian genomes, ChIP–Seq is less expensive than ChIP–chip given the current cost of whole-genome tiling arrays. ChIP–chip might be more cost-effective for profiling of subgenomic regions. ChIP–SAGE is also more expensive than ChIP–Seq because it uses the more expensive traditional sequencing methods.
Options
ChIP–Seq does not require pre-selection of genomic regions whereas ChIP–chip can only analyse the portion of the genome on a microarray. Although ChIP–SAGE can be used to study entire genomes, it is limited to regions that have recognition sites for the restriction enzyme that is used to cleave the ChIP DNA.
Genomic profiles of histone modifications.
Numerous genome-wide studies have provided data on the distribution of histone modifications in various model organisms. Studies using yeast indicate that histone H3 lysine 4 methylation (H3K4me) and histone acetylation correlate positively with transcription levels, are highly enriched in promoter regions and extend significantly into the transcribed regions70,71. These observations have been confirmed in higher eukaryotes including fly, mouse and humans69,72,76–78. However, recent observations indicate that H3K4 trimethylation (H3K4me3) signals are also detected at many silent promoters77,79,80, where they might be involved in priming the chromatin for future activation, maintaining a poised activation state or serving as a memory of previous transcriptional activation77,79,80. As more histone modifications have been analysed, it has become clear that many activating modifications tend to cluster at key regulatory regions, which might reinforce active chromatin states and provide potential redundancy in the system.
H3K9 and H3K27, as well as H4K20, have been implicated in heterochromatin formation and transcriptional repression81. Large-scale location analyses indeed indicate that H3K27me3 seems to be inversely correlated with gene activation77,82–84. In contrast to the localized distribution pattern of H3K4me3, H3K27me3 tends to spread over larger regions. H3K9me3 and H4K20me3 are enriched near boundaries of large heterochromatic domains and the former is wide-spread in the Giemsa-staining Q bands17. However, these two histone marks have also been detected at high levels at the 3′ ends of many active and inactive zinc finger (ZNF) genes17, although the functional significance of this localization remains unclear. Somewhat surprisingly, the monomethylations of these lysine residues are enriched in active genes, suggesting that they might have a role in transcriptional activation17. Although the seemingly opposite modifications H3K4me3 and H3K27me3 are usually located in different chromatin domains, they are found to coexist in a subset of genomic regions including promoters and other regulatory elements. Gene activity seems to correlate with both the absolute and relative levels of these two modifications77. Regions containing both of these modifications are termed ‘bivalent domains’ in ES cells and it has been suggested that they have crucial roles in ES cell differentiation by providing the potential for both transcriptional activation and repression73. Upon ES cell differentiation, these bivalent domains can be resolved to contain only one type of modification, depending on the expression status of the genomic locus in the differentiated cells. However, it remains unclear how these domains differ between ES cells and terminally differentiated cells. It will also be interesting to determine whether there are other distinct chromatin features in these regions in addition to the shared H3K4me3 and H3K27me3 marks. Recent evidence suggests that H2A ubiquitylation is involved in the poising of RNA polymerase II (Pol II) at bivalent domains in mouse ES cells85.
A picture is now emerging in which distinct genomic regions such as enhancers, promoters and gene bodies have distinct histone-modification patterns17,75,86. Functional enhancer elements have been successfully identified using genome-wide distribution patterns of histone acetylation77,87. On the basis of the analysis of histone modifications and histone-modifying-enzyme binding sites across a 30 Mb region of the human genome in HeLa cells, Heintzman and colleagues successfully predicted an unknown functional enhancer using the characteristic patterns of histone modifications that they identified. This work identified high levels of H3K4me1 and very low levels of H3K4me3 as a signature of enhancers75. However, whereas high levels of H3K4me1 and low levels of H3K4me3 are detected at some enhancers in human CD4+ T cells, high levels of H3K4me3 have been found at many other enhancers, including the distal enhancer of the interferon-γ gene17. The differences between these two studies might derive from the following: first, the former was based on the analysis of only 1% of the genome and therefore examined only a subset of potential enhancers, whereas the latter examined the whole genome; second, the different platforms that were used in these two studies might also have contributed to the variations; and third, it is difficult to exclude the possibility that some of these H3K4me1- or H3K4me3-associated regions might represent less active promoters or unknown promoters for non-coding RNA (ncRNA) genes. However, it seems that none of these modifications are associated with all enhancers, as each of the modifications, including H3K4me1, H3K4me2, H3K4me3 and H3K9me1, as well as the H2A.Z histone variant, are detected at only 20–40% of all potential enhancers17. Multiple patterns of histone modifications could be associated with enhancer elements. Although enhancers and promoters have many of the same histone modifications, active promoters are followed by high levels of H2BK5me1, H3K9me1, H3K27me1, H4K20me1 and H3K36me3 in their transcribed regions17. These modification patterns have been used to identify novel transcription units and determine functional transcription start sites17,20. It has become apparent that histone modification patterns can be a useful tool to achieve a more precise annotation of the human and other genomes.
The distinct epigenetic modification patterns that are associated with functional regulatory elements suggest that histone modifications can be determined by the underlying DNA sequences. Indeed, CpG islands are associated with high levels of histone acetylation and H3K4me3 in human T cells77,78. Virtually all CpG-rich promoters are associated with H3K4me3 in ES cells, whereas only a small fraction of CpG-poor promoters are associated with this modification20. Some groups have begun to look at the evolutionary conservation of histone modifications. Bernstein and colleagues have found that lysine methylation on histone H3 was conserved at orthologous human and mouse loci, although the underlying DNA sequence was not strongly conserved. From this they concluded that if DNA sequence elements are controlling histone methylation, they must be small or located far from the affected histones72. Work in our laboratory has shown that clusters of acetylation signals, called acetylation islands, are candidate enhancer elements and that these islands can still function as enhancers even if the underlying DNA sequence is not strongly conserved87. It is important to point out that we do not know the basis for this observed histone-modification conservation, although further analysis of potential transcription-factor binding sites might shed light on this matter.
The histone-code hypothesis suggests that multiple histone modifications function in a combinatorial fashion to specify distinct chromatin states66,67, allowing a large number of potential post-translational histone modifications to generate a unique chromatin structure for each gene that is compatible with the specific expression of that gene. Although it is not clear whether there are gene-specific patterns of histone modifications in the genome, the complete dictionary of histone-modification patterns at all genomic sites will help to answer this question. With the ability of the ChIP–Seq technique to probe histone-modification patterns across entire genomes in a time-efficient manner, we are now ready to address whether there are combinatorial patterns of histone modifications in the genome that serve to regulate gene transcription.
Histone variants.
The deposition of histone variants such as H2A.Z or H3.3 into nucleosomes constitutes another type of chromatin modification. Htz1 (the H2A.Z orthologue in budding yeast) marks the boundaries of heterochromatic regions88. Genome-wide ChIP–chip studies in yeast have indicated that Htz1 might be located at the promoters of most genes89, although there is evidence that they are preferentially present at the promoters of genes that are poised for transcription activation90–92 (reviewed in REF. 93). ChIP–Seq studies in humans have indicated that H2A.Z is localized to enhancers and promoters, with a positive correlation between occupancy and transcriptional activity at promoters17.
Recent high-resolution tiling microarray experiments have indicated that H3.3 marks the boundaries of regulatory regions in the D. melanogaster genome94,95. It has been suggested that H2A.Z might function to increase nucleosome mobility by destabilizing nucleosome structure96. Interestingly, nucleosomes containing both H3.3 and H2A.Z are even less stable than those containing H3.3 or H2A.Z alone, suggesting that deposition of histone variants into a nucleosome functions to create hierarchical nucleosomal stability97.
Cautions in interpreting ChIP experiments for histone modifications.
Each of the methods discussed above relies on ChIP experiments to examine specific modifications, but several points need to be kept in mind when interpreting ChIP results. First, the results absolutely rely on the specificity of the antibodies used in the experiments. As the community is putting more and more effort into generating and characterizing various modification antibodies, we now have a better resource of more reliable antibodies than a few years ago. However, caution must be exercised when working with a less well-characterized antibody. Second, different methods for chromatin preparation can lead to different results. For example, the use of either sonication or micrococcal nuclease (MNase) digestion to fragment the chromatin and whether or not to stabilize the chromatin by crosslinking are both issues that have to be carefully considered for specific applications. Sonication generates longer chromatin fragments and therefore can result in lower resolution, whereas MNase gives higher resolution but might introduce bias by selective digestion of active chromatin if not well controlled. Finally, because ChIP requires a population of hundreds of thousands or even millions of cells, any results that are obtained are just an average snap-shot of the modification status, which could contain contributions from very heterogeneous modification states of different cells.
Nucleosome positioning
The positioning of nucleosomes with respect to DNA can directly influence gene regulation98,99. In recent years, several genome-wide maps of nucleosome positions in yeast100,101, worm102 and across all human promoters13 have emerged. Most of these studies have taken advantage of the preferential cleavage of linker DNA over nucleosomal DNA by MNase. The mononucleosome-sized DNA that is isolated from MNase-digestion is analysed by either tiling microarrays containing overlapping probes13,100,101 or high-throughput sequencing102,103. ChIP–Seq data for certain histone modifications can also be used to map nucleosomes in certain regions of the genome (for a discussion see REFS 104,105)
Genomic profiles of nucleosome positions.
The first large-scale mapping of nucleosome positioning was performed by Yuan and colleagues, who used a tiling array with 50 bp probes tiled every 20 bp, covering most of chromosome 3 of the S. cerevisiae genome100. They found that Pol II promoters had a 200 bp nucleosome-free region upstream of the transcription start site that is flanked on either side by well positioned nucleosomes, and intergenic DNA was relatively depleted of nucleosomes compared to coding regions. A large-scale study of nucleosome positioning across 3,692 human promoters suggests that regions upstream of actively transcribed genes are depleted of nucleosomes13, which is in contrast with the results that were obtained from a ChIP–chip analysis using anti-histone H3 antibody72. The same study of nucleosomes in human promoters also determined that genes with similar expression patterns have similar profiles of nucleosomes at their promoters, and a similar result has been reported in yeast101.
The positioning of nucleosomes is usually described in terms of translational settings, referring to the placement of nucleosomes with respect to the genome, and rotational settings, referring to the orientation of DNA in relation to the histone octamer106. Several studies have suggested that the orientation of nucleosomes with respect to the DNA sequence might be contingent on the underlying DNA sequence, with nucleosomes adopting a position that is energetically favourable106,107. Albert and colleagues recently combined ChIP experiments with pyrosequencing to obtain a genome-wide profile of all H2A.Z nucleosomes in the yeast genome, providing precise genomic positions for more than 8,000 nucleosomes. Analysis of the underlying DNA sequence revealed that H2A.Z nucleosomes have a rotational setting with respect to DNA that is similar to what has been found with in vitro studies103. More recent work in yeast has shed further light on the features of DNA sequence that are responsible for nucleosome positioning, as discussed in the next section.
Bioinformatic studies of nucleosome positioning.
With genome-wide maps of nucleosome positions available for a variety of species, researchers now have a large set of experimentally verified nucleosome locations that allow them to investigate the factors that influence positioning. Some studies have reinforced the idea that nucleosome positions can be predicted by the DNA sequence alone, with nucleosomes adopting favourable positions with respect to DNA sequence in the majority of cases107,108. However, more recent studies conducted on more extensive data sets have argued that although a fraction of nucleosomes might be positioned in a way that is determined by the underlying DNA sequence, most are not109. The role of other sequence features in determining nucleosome level has recently been investigated in yeast using data from higher-resolution tiling arrays101. Strikingly, DNA structural features such as the tip, tilt and propeller-twist were strongly indicative of nucleosome occupancy101. This study also suggested that the AA/TT/TA dinucleotide repeat pattern does not have as strong a role in determining genome-wide nucleosome occupancy as previously thought. They point out that nucleosome exclusion signals might have a larger role in regulating the translational positioning of nucleosomes while DNA sequence patterns such as the AA/TT/TA dinucleotide repeat might have a role in the rotational placement of nucleosomes101.
Chromatin accessibility
The cell-type-specific transcription programme is controlled by the availability of a set of transcription factors and the accessibility of their target sites in the chromatin. Target-site accessibility is modulated by multiple factors, including DNA methylation and histone modifications. Therefore, the measurement of chromatin accessibility provides a different angle for examining epigenomic organization in a particular cell type. Various reagents, including deoxyribonuclease (DNase), MNase, restriction enzymes and chemicals, can be used to probe chromatin structure, and each of them has been used for particular applications. For example, restriction enzyme cleavage can reveal information on the ‘openness’ or accessibility of a specific sequence that includes the restriction enzyme target site. By contrast, MNase digestion is often used to define nucleosome boundaries, although it has also been used to probe the accessibility of large chromatin regions. Gilbert and colleagues developed a method to profile chromatin accessibility states by first separating MNase-digested ‘open’ and ‘closed’ chromatin by sucrose sedimentation, and then hybridizing the DNA to metaphase chromosomes and DNA microarrays110. They found that whereas open chromatin regions are often correlated with gene-dense regions and are cytologically decondensed, closed chromatin can exist in both heterochromatic C-bands and euchromatic G-bands. Interestingly, they also found that active genes can exist within closed chromatin domains.
DNase I cleavage patterns can define either general accessibility or hypersensitivity. The former reflects the condensation/decondensation status of a large chromatin region, whereas the latter is usually linked to the presence of functional enhancer elements or chromatin boundary elements111. For example, Weil and colleagues recently measured the condensation state of chromatin by analysing length-selected chromatin fragments generated from DNase I digestion112.
Identification of DNase I hypersensitive sites using high-throughput techniques allows genome-wide identification of potential transcriptional and chromatin regulatory regions such as promoters, enhancers and insulators113,114. A recent analysis of genome-wide DNase I hypersensitive sites in six cell lines indicates that 22% of them are present in all the examined cell types and that these hypersensitive sites usually correspond to promoters or insulators. However, most of the DNase I hypersensitive sites are cell-type specific and these are often enhancer elements115. DNase I HS sites are also associated with various histone modifications such as mono-, di- and trimethylation of H3K4 and monomethylation of H3K9 (REFS 17,115).
Another approach that has been introduced to profile nucleosome occupancy across the genome is the formaldehyde-assisted isolation of regulatory elements (FAIRE) approach116. In this approach, chromatin is first crosslinked by formaldehyde in vivo, and then sonicated and subjected to phenol-chloroform extraction. The DNA that is recovered in the aqueous phase can then be fluorescently labelled and hybridized to a microarray for genome-wide profiling of nucleosome occupancy. This approach was successfully used to profile nucleosome occupancy of yeast genes during the cell cycle117 and was recently applied to human cells to identify possible regulatory regions such as DNase I hypersensitive sites and active promoters118.
Analysing genome-wide data sets
One of the most crucial problems to consider when carrying out genome-wide experiments is how meaningful biological phenomena will be extracted from large data sets. Here, we briefly discuss some of the analysis techniques that have been applied to the genome-wide approaches summarized above. The common challenge for each of these techniques is to find peaks of signals that correspond to particular regions of the genome and determine at which threshold statistical significance exists.
A brief introduction to the analysis of tiling microarray experiments, containing a comparison of some of the best algorithms for peak finding as applied to each commercial source of tiling arrays, has recently been published119. Two of the most useful software packages available are TileMap120 and the Model-based analysis of Tiling-array (MAT) algorithm121. The advantages of these programs over other software packages are that they can do multi-sample comparisons and can work with a small number of replicates.
The sequence tag analysis and reporting tool (START) is an automated software tool that can analyse ChIP–SAGE data from a variety of genomes122. START takes as input sequences of inserts from the SAGE library and returns information about the tags such as nearby genes, miRNAs and predicted transcription-factor binding sites.
At present, there are no automated software packages that will analyse ChIP–Seq data, although we anticipate that such packages will be developed in the near future. As high-throughput sequencing platforms push the limits for the number of reads that can be produced in each run, a major bottle neck in data analysis will be aligning the sequenced reads to reference genomes while incorporating the individual base-call qualities (that is, the confidence in each sequenced base). The ELAND (efficient large-scale alignment of nucleotide databases) program that is distributed with the Solexa analysis pipeline is optimized to deal with read lengths of no more than 32 bp that align to a reference genome with no more than two mismatches. If longer reads are desired, other alignment tools will need to be used. Alignment algorithms that have been designed specifically for this purpose are now being developed (see the RMAP website).
Once sequence files are generated, the genomic locations of reads can be viewed on a genome browser such as the UCSC genome browser123, allowing for the examination of sequence read locations in relation to other genomic features. As with other high-throughput techniques that are coupled with ChIP experiments, the key to identifying a reliable region of modification or protein binding from ChIP–Seq data is to find statistically significant peaks of sequenced reads. The most important parameters in such analyses are the number of sequenced reads that are considered significant and the window size that the number of reads must fall within. As the ChIP–Seq reads correspond to the ends of the chromatin fragments, an adjustment to the positions where these reads align to a reference genome might be desirable to more accurately reflect the centre of the chromatin fragment. Determining what values of the read-count and window-size parameters are statistically significant can be accomplished by developing an expected background distribution, either with control experiments or statistical models17–20. Further analysis of the data will be project-specific and depend on the specific biological questions asked. A recently introduced technique of first using microarrays to capture specific regions of the genome can be used to focus ChIP–Seq experiments on smaller regions of interest in the genome, and thereby reduce the number of reads that are necessary for coverage124.
Other factors that influence epigenomes
Three-dimensional chromatin architecture.
Metazoan genomes do not function solely in the classic linear model in which regulatory factors regulate transcription by binding to target sites in proximity to a gene. Instead, long-range interactions among DNA regions spanning as much as 100kb and even across chromosomes have been detected and have been suggested to have crucial roles in regulating gene expression depending on the developmental stages of particular cell types125,126. These interactions are the result of the three-dimensional architecture of chromosomes within the nucleus and might contribute to epigenomic structure (for a recent review see REF. 127). The main technologies that have been developed to study these interactions are fluorescence in situ hybridization (FISH), and the chromosome conformation capture (3C) technique128 and its more high-throughput relatives chromosome conformation capture-on-chip (4C, also known as circular chromosome conformation capture)129,130 and chromosome conformation capture carbon copy (5C)131. The 3C technique involves crosslinking chromatin, using restriction enzymes to digest interacting regions and then ligating the digested fragments. The frequency with which two restriction fragments become ligated indicates how often they interact in the nucleus128. High-throughput extensions of 3C, such as 4C, allow for the profiling of many interacting regions for a given locus129,130. The 5C technique combines standard 3C with multiplexed ligation-mediated amplification to create 5C libraries that are then hybridized to DNA microarrays, or sequenced using high-throughput sequencing, to identify many interacting chromosome regions in parallel131.
Noncoding RNA.
Studies in Schizosaccharomyces pombe have shown that small RNAs that function as interfering RNAs can target and maintain heterochromatin132,133 (also, see REF. 134 for a recent review). A recent study used ChIP–chip to map regions of heterochromatin and euchromatin as well as RNAi components and small interfering RNAs (siRNAs) across the S. pombe genome135. This study confirmed the interdependence of RNAi and heterochromatin on a genomic scale. Furthermore, recent studies in humans have shown that ncRNAs are involved in demarcating active and silent chromatin domains136.
Protein binding in relation to chromatin modifications.
Several techniques discussed in this Review have been used to profile the chromatin occupancy of various chromatin or DNA-binding proteins (for a recent review see REF. 137). The utility of ChIP–chip was originally demonstrated by identifying Gal4 and Ste12 binding sites in the yeast genome7. The extension of ChIP–chip to ChIP–Seq has recently been used to identify binding sites for REST (RE1-silencing transcription factor; also known as neuron restrictive silencer factor)18, STAT1 (signal transducer and activator of transcription 1)19 and CTCF (CCCTC-binding factor)17, an insulator-binding protein, in the human genome.
Another technique — DNA adenine methyltransferase ID (DamID) — has also been used to identify DNA-binding sites on a genomic scale. In this technique, DNA-binding proteins are first fused to DNA adenine methyltransferase (Dam). When the protein of interest is expressed in a cell, Dam is targeted to the binding sites of this protein where it methylates local adenine bases. This local methylation can be detected to determine the binding sites of the protein of interest. DamID has been used to identify binding sites of HP1 (heterochromatic protein 1) in the D. melanogaster genome138.
An epigenomic picture
Technical progress in genome-wide mapping approaches during the past few years has enabled the examination of various epigenetic phenomena at a global level in various model organisms. Consequently, a comprehensive picture of epigenomes is emerging (FIG. 5). DNA is methylated throughout the genome except at functional regulatory regions, which include promoters and enhancers. Large heterochromatin domains are associated with widespread H3K9me2 and H3K9me3 signals as well as HP1 binding139. Conversely, euchromatic domains are associated with localized signals of H3K4me as well as H2A.Z and H3.3, occurring mainly at functional regulatory regions such as promoters, enhancers and insulators. These functional regulatory elements are characterized by DNase I hypersensitivity, and active promoters are depleted of nucleosomes. The monomethylation of H2BK5, H3K9, H3K27 and H4K20 as well as H3K36me3 are associated with actively transcribed regions, whereas H3K27me3 is widespread across silent genes in euchromatic domains.
Figure 5 |. Characteristics of epigenomes.
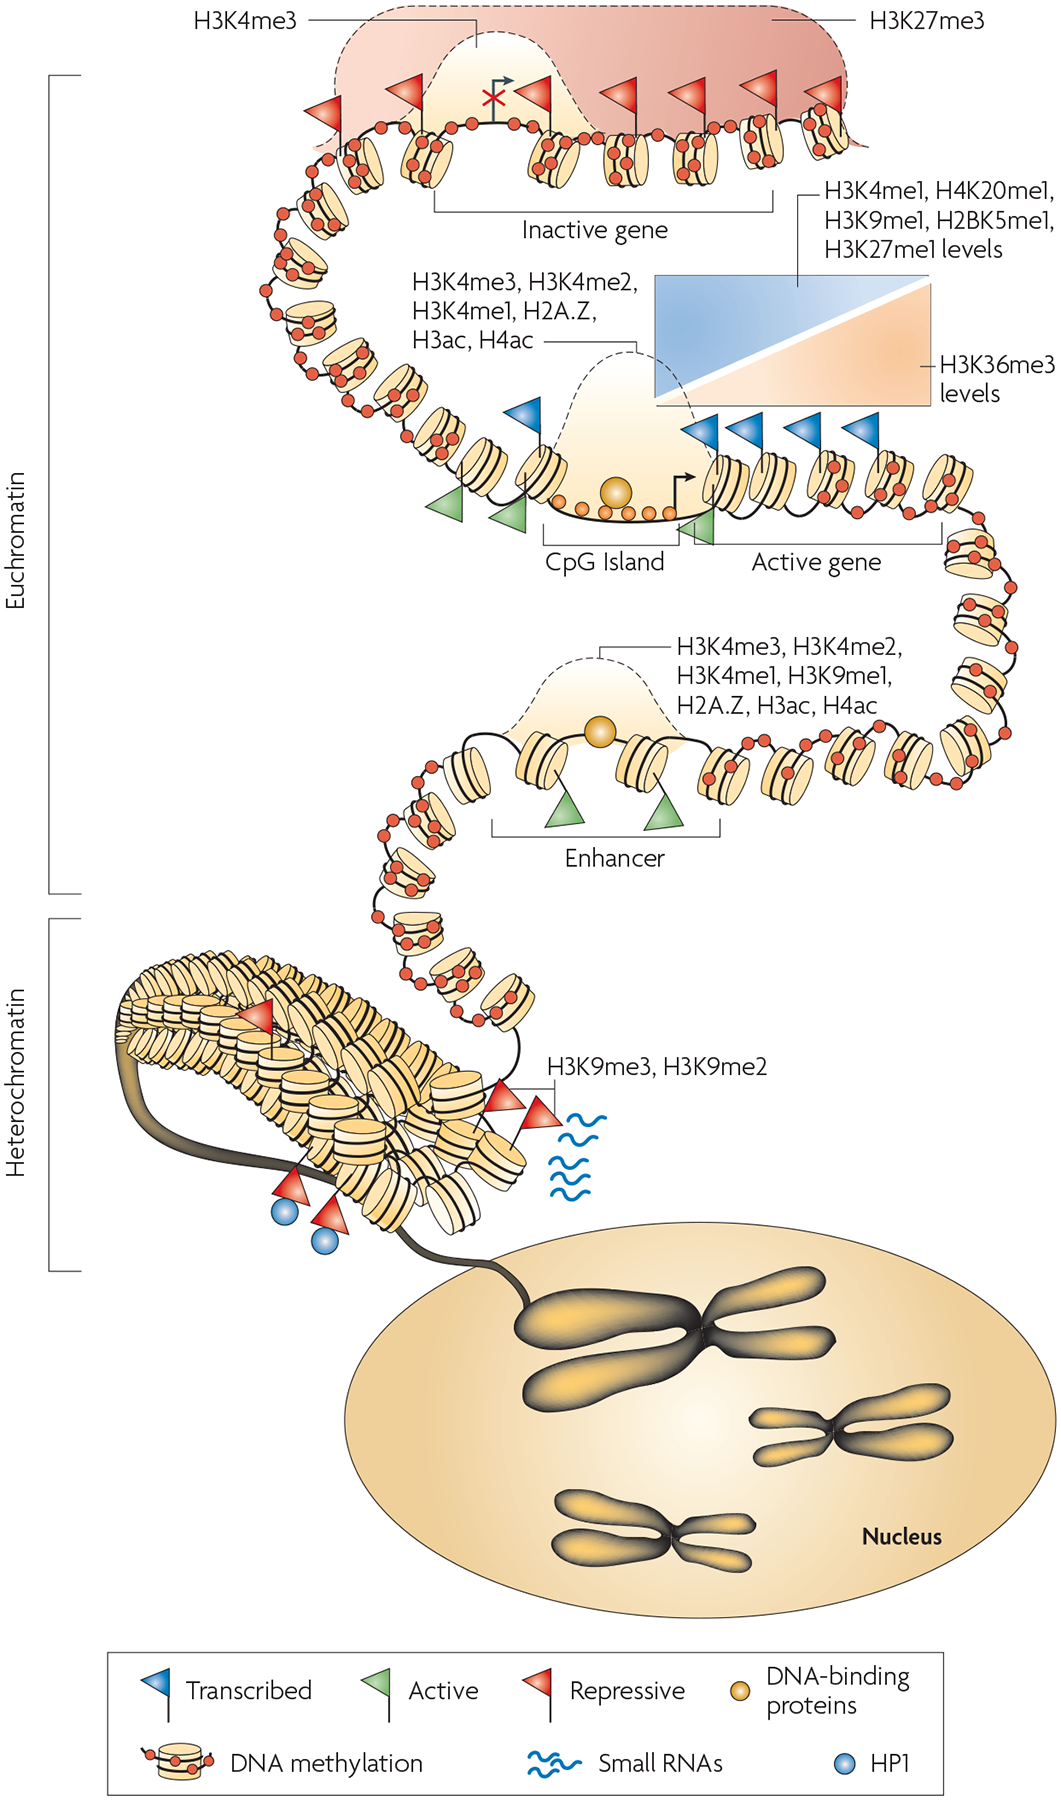
The interaction of DNA methylation, histone modification, nucleosome positioning and other factors such as small RNAs contribute to an overall epigenome that regulates gene expression and allows cells to remember their identity. Chromosomes are divided into accessible regions of euchromatin and poorly accessible regions of heterochromatin. Heterochromatic regions are marked with histone H3 lysine 9 di- and trimethylation (H3K9me2 and H3K9me3), which serve as a platform for HP1 (heterochromatic protein 1) binding. Small RNAs have been implicated in the maintenance of heterochromatin. DNA methylation is persistent throughout genomes, and is missing only in regions such as CpG islands, promoters and possibly enhancers. The H3K27me3 modification is present in broad domains that encompass inactive genes. Histone modifications including H3K4me3, H3K4me2, H3K4me1 as well as histone acetylation and histone variant H2A.Z mark the transcription start site regions of active genes. The monomethylations of H3K4, H3K9, H3K27, H4K20 and H2BK5 mark actively transcribed regions, peaking near the 5′ end of genes. The trimethylation of H3K36 also marks actively transcribed regions, but peaks near the 3′ end of genes.
Current data support the notion that DNA methylation, histone modifications, nucleosome location, ncRNAs, DNA-binding proteins and the three-dimensional organization of chromatin are not independent elements of functional epigenomes. Instead, they influence one another during the dynamic regulation of cellular differentiation or under pathological conditions. For example, evidence exists for H3K9me associated with heterochromatin-targeting DNA methylation in Neurospora crassa140. Moreover, the H3K27 methyltransferase EZH2 has been shown to control DNA methylation through a direct physical interaction with a DNA methyltransferase in a human cell line141.
Perspectives
Whereas DNA microarray-based techniques, including ChIP–chip, have provided valuable epigenomic information in various organisms, new protocols that utilize high-throughput sequencing techniques, such as ChIP–Seq, have shown even greater potential to unveil epigenomic features, particularly in the human genome. We anticipate that ChIP–Seq will find broad applications in genome-wide mapping of DNA methylation, histone modifications, nucleosome positioning, long-range chromatin interactions and other epigenetic processes.
Application of high-throughput protocols will undoubtedly reveal the contribution of epigenomes to normal development and pathological conditions. However, current protocols require hundreds of thousands or even millions of cells. In reality, often only a small number of cells of a particular tissue or from a developmental stage are available, and this is especially true of clinical samples. Therefore, the development of quantitative techniques to analyse a small number of cells at a genomic scale will be necessary. Several laboratories have already succeeded in significantly reducing the cell numbers that are required for ChIP protocols using carrier chromatin142 or modified protocols143, and these techniques can potentially be applied to genome-wide procedures.
Although epigenomic data are being generated at an unprecedented and ever increasing speed, the development of the computational tools that are required to integrate these data has lagged behind. Platforms, both web-based and stand-alone, will be needed to display and compare the mapping data of various epigenetic modifications across cell types, developmental stages and pathological conditions from different laboratories.
Genome-wide data about histone modifications as well as transcription-factor targeting sites have revealed numerous putative enhancer elements. However, as enhancers can function over long distance or even across different chromosomes, the promoters they regulate will not be unambiguously known without spatial proximity or direct interaction data. It is therefore important to develop techniques to analyse genome-wide enhancer–promoter interactions in order to understand genome function and the mechanisms of gene regulation.
It is an exciting time to be involved in research into epigenetic phenomena. Novel technologies that have been introduced in the past few years have led to great progress in our understanding of epigenomes. There is still much to be learned and the use of genome-scale techniques will provide us with much more information in the coming years.
DATABASES
UniProtKB: http://ca.expasy.org/sprot
FURTHER INFORMATION
Keji Zhao’s homepage: http://public.nhlbi.nih.gov/Staff/Home/UserInputForPerson.aspx?source=external&OID=895&tab=AboutMe&LabID=lmi
Human Epigenome Project: http://www.epigenome.org/
Illumina: http://www.illumina.com/
MAT: http://chip.dfci.harvard.edu/~wli/MAT
RMAP: http://rulai.cshl.edu/rmap/
TileMap: http://biogibbs.stanford.edu/~jihk/TileMap/index.htm
ALL LINKS ARE ACTIVE IN THE ONLINE PDF
Acknowledgements
We thank members of the Zhao laboratory for helpful discussions. We apologize to those whose work was not included here owing to space limitations. Research in the authors’ laboratory is supported by the Intramural Research Program of the US National Institutes of Health, National Heart, Lung and Blood Institute.
Glossary
- Chromatin immunoprecipitation
A technique to isolate individual chromatin fragments using an antibody that is specific to a feature of the chromatin fragments (for example, a DNA-binding protein, a particular histone modification, or DNA methylation)
- ChIP–chip
The combination of ChIP experiments with DNA microarrays to profile protein targeting or chromatin modifications over large genomic regions
- Serial analysis of gene expression
A sequence-based quantitative technique that is used to determine mRNA levels. cDNA is generated from an mRNA sample, digested with a four-base cutter and ligated to an adaptor containing a class II restriction enzyme that releases a 14 to 21 bp fragment. The short fragments are concatenated together, cloned into a sequencing vector and sequenced
- ChIP–Seq
The combination of ChIP experiments with high-throughput sequencing to quantitatively analyse protein targeting or chromatin modifications across the entire genome
- Tiling microarrays
DNA microarrays with densely spaced or overlapping probes that allow for high-resolution genomic mapping
- Fluorescence in situ hybridization
A technique that involves the fluorescent labelling of single-stranded DNA probes that then target specific regions of chromosomes and allow for the visualization of these regions within the cell
- 3C
Chromosome conformation capture. A technique that is used to study the long-distance interactions between genomic regions, which in turn can be used to study the three-dimensional architecture of chromosomes within a cell nucleus
- 4C
Either chromosome conformation capture-on-chip or circular chromosome conformation capture. These techniques allow the profiling of many interactions throughout a genome with a specific locus
- 5C
Chromosome conformation capture carbon copy. A high-throughput extension of 3C that pairs the 3C technology with DNA microarrays or high-throughput sequencing. This technique allows the profiling of many chromatin interactions in parallel
References
- 1.Goldberg AD, Allis CD & Bernstein E Epigenetics: a landscape takes shape. Cell 128, 635–638 (2007). [DOI] [PubMed] [Google Scholar]
- 2.Ptashne M On the use of the word ‘epigenetic’. Curr. Biol 17, R233–R236 (2007). [DOI] [PubMed] [Google Scholar]
- 3.Bird A Perceptions of epigenetics. Nature 447, 396–398 (2007). [DOI] [PubMed] [Google Scholar]
- 4.Bernstein BE, Meissner A & Lander ES The mammalian epigenome. Cell 128, 669–681 (2007). [DOI] [PubMed] [Google Scholar]
- 5.Orlando V & Paro R Mapping Polycomb-repressed domains in the bithorax complex using in vivo formaldehyde cross-linked chromatin. Cell 75, 1187–1198 (1993). [DOI] [PubMed] [Google Scholar]
- 6.Blat Y & Kleckner N Cohesins bind to preferential sites along yeast chromosome III, with differential regulation along arms versus the centric region. Cell 98, 249–259 (1999). [DOI] [PubMed] [Google Scholar]
- 7.Ren B et al. Genome-wide location and function of DNA binding proteins. Science 290, 2306–2309 (2000). [DOI] [PubMed] [Google Scholar]; This paper introduced the ChIP–chip technique, used here to map Gal4 and Ste12 binding sites in the yeast genome.
- 8.Bernstein BE et al. Methylation of histone H3 Lys 4 in coding regions of active genes. Proc. Natl Acad. Sci. USA 99, 8695–8700 (2002). [DOI] [PMC free article] [PubMed] [Google Scholar]
- 9.Robyr D et al. Microarray deacetylation maps determine genome-wide functions for yeast histone deacetylases. Cell 109, 437–446 (2002). [DOI] [PubMed] [Google Scholar]
- 10.Robyr D & Grunstein M Genomewide histone acetylation microarrays. Methods 31, 83–89 (2003). [DOI] [PubMed] [Google Scholar]
- 11.Bernstein BE, Liu CL, Humphrey EL, Perlstein EO & Schreiber SL Global nucleosome occupancy in yeast. Genome Biol 5, R62 (2004). [DOI] [PMC free article] [PubMed] [Google Scholar]
- 12.Lee CK, Shibata Y, Rao B, Strahl BD & Lieb JD Evidence for nucleosome depletion at active regulatory regions genome-wide. Nature Genet 36, 900–905 (2004). [DOI] [PubMed] [Google Scholar]
- 13.Ozsolak F, Song JS, Liu XS & Fisher DE High-throughput mapping of the chromatin structure of human promoters. Nature Biotechnol 25, 244–248 (2007). [DOI] [PubMed] [Google Scholar]; This study mapped nucleosome positions across ~3,700 promoters in seven human cell lines using MNase digestion followed by hybridization to tiling microarrays.
- 14.Impey S et al. Defining the CREB regulon: a genome-wide analysis of transcription factor regulatory regions. Cell 119, 1041–1054 (2004). [DOI] [PubMed] [Google Scholar]
- 15.Roh TY, Ngau WC, Cui K, Landsman D & Zhao K High-resolution genome-wide mapping of histone modifications. Nature Biotechnol 22, 1013–1016 (2004). [DOI] [PubMed] [Google Scholar]
- 16.Wei CL et al. A global map of p53 transcription-factor binding sites in the human genome. Cell 124, 207–219 (2006). [DOI] [PubMed] [Google Scholar]
- 17.Barski A et al. High-resolution profiling of histone methylations in the human genome. Cell 129, 823–837 (2007). [DOI] [PubMed] [Google Scholar]
- 18.Johnson DS, Mortazavi A, Myers RM & Wold B Genome-wide mapping of in vivo protein–DNA interactions. Science 316, 1497–1502 (2007). [DOI] [PubMed] [Google Scholar]
- 19.Robertson G et al. Genome-wide profiles of STAT1 DNA association using chromatin immunoprecipitation and massively parallel sequencing. Nature Methods 4, 651–657 (2007). [DOI] [PubMed] [Google Scholar]
- 20.Mikkelsen TS et al. Genome-wide maps of chromatin state in pluripotent and lineage-committed cells. Nature 448, 553–560 (2007). [DOI] [PMC free article] [PubMed] [Google Scholar]; Together with Reference 17, these studies were the first to demonstrate how ChIP–Seq can be used to profile histone modifications and DNA-binding sites across the entire human genome.
- 21.Feinberg AP Phenotypic plasticity and the epigenetics of human disease. Nature 447, 433–440 (2007). [DOI] [PubMed] [Google Scholar]
- 22.Esteller M Cancer epigenomics: DNA methylomes and histone-modification maps. Nature Rev. Genet 8, 286–298 (2007). [DOI] [PubMed] [Google Scholar]
- 23.Bird A DNA methylation patterns and epigenetic memory. Genes Dev 16, 6–21 (2002). [DOI] [PubMed] [Google Scholar]
- 24.Gardiner-Garden M & Frommer M CpG islands in vertebrate genomes. J. Mol. Biol 196, 261–282 (1987). [DOI] [PubMed] [Google Scholar]
- 25.Takai D & Jones PA Comprehensive analysis of CpG islands in human chromosomes 21 and 22. Proc. Natl Acad. Sci. USA 99, 3740–3745 (2002). [DOI] [PMC free article] [PubMed] [Google Scholar]
- 26.Ng HH & Bird A DNA methylation and chromatin modification. Curr. Opin. Genet. Dev 9, 158–163 (1999). [DOI] [PubMed] [Google Scholar]
- 27.Ioshikhes IP & Zhang MQ Large-scale human promoter mapping using CpG islands. Nature Genet 26, 61–63 (2000). [DOI] [PubMed] [Google Scholar]
- 28.Bell AC, West AG & Felsenfeld G The protein CTCF is required for the enhancer blocking activity of vertebrate insulators. Cell 98, 387–396 (1999). [DOI] [PubMed] [Google Scholar]
- 29.Hark AT et al. CTCF mediates methylation-sensitive enhancer-blocking activity at the H19/Igf2 locus. Nature 405, 486–489 (2000). [DOI] [PubMed] [Google Scholar]
- 30.Tate PH & Bird AP Effects of DNA methylation on DNA-binding proteins and gene expression. Curr. Opin. Genet. Dev 3, 226–231 (1993). [DOI] [PubMed] [Google Scholar]
- 31.Robertson KD & Wolffe AP DNA methylation in health and disease. Nature Rev. Genet 1, 11–19 (2000). [DOI] [PubMed] [Google Scholar]
- 32.Baylin SB & Herman JG DNA hypermethylation in tumorigenesis: epigenetics joins genetics. Trends Genet 16, 168–174 (2000). [DOI] [PubMed] [Google Scholar]
- 33.Jones PA & Laird PW Cancer epigenetics comes of age. Nature Genet 21, 163–167 (1999). [DOI] [PubMed] [Google Scholar]
- 34.Zilberman D & Henikoff S Genome-wide analysis of DNA methylation patterns. Development 134, 3959–3965 (2007). [DOI] [PubMed] [Google Scholar]
- 35.Bird AP & Southern EM Use of restriction enzymes to study eukaryotic DNA methylation: I. The methylation pattern in ribosomal DNA from Xenopus laevis. J. Mol. Biol 118, 27–47 (1978). [DOI] [PubMed] [Google Scholar]
- 36.Selker EU et al. The methylated component of the Neurospora crassa genome. Nature 422, 893–897 (2003). [DOI] [PubMed] [Google Scholar]
- 37.Khulan B et al. Comparative isoschizomer profiling of cytosine methylation: the HELP assay. Genome Res 16, 1046–1055 (2006). [DOI] [PMC free article] [PubMed] [Google Scholar]
- 38.Lippman Z et al. Role of transposable elements in heterochromatin and epigenetic control. Nature 430, 471–476 (2004). [DOI] [PubMed] [Google Scholar]
- 39.Yan PS et al. Dissecting complex epigenetic alterations in breast cancer using CpG island microarrays. Cancer Res 61, 8375–8380 (2001). [PubMed] [Google Scholar]
- 40.Hatada I et al. A microarray-based method for detecting methylated loci. J. Hum. Genet 47, 448–451 (2002). [DOI] [PubMed] [Google Scholar]
- 41.Rollins RA et al. Large-scale structure of genomic methylation patterns. Genome Res 16, 157–163 (2006). [DOI] [PMC free article] [PubMed] [Google Scholar]
- 42.Frommer M et al. A genomic sequencing protocol that yields a positive display of 5-methylcytosine residues in individual DNA strands. Proc. Natl Acad. Sci. USA 89, 1827–1831 (1992). [DOI] [PMC free article] [PubMed] [Google Scholar]
- 43.Herman JG, Graff JR, Myohanen S, Nelkin BD & Baylin SB Methylation-specific PCR: a novel PCR assay for methylation status of CpG islands. Proc. Natl Acad. Sci. USA 93, 9821–9826 (1996). [DOI] [PMC free article] [PubMed] [Google Scholar]
- 44.Eads CA et al. MethyLight: a high-throughput assay to measure DNA methylation. Nucleic Acids Res 28, e32 (2000). [DOI] [PMC free article] [PubMed] [Google Scholar]
- 45.Meissner A et al. Reduced representation bisulfite sequencing for comparative high-resolution DNA methylation analysis. Nucleic Acids Res 33, 5868–5877 (2005). [DOI] [PMC free article] [PubMed] [Google Scholar]
- 46.Adorjan P et al. Tumour class prediction and discovery by microarray-based DNA methylation analysis. Nucleic Acids Res 30, e21 (2002). [DOI] [PMC free article] [PubMed] [Google Scholar]
- 47.Gitan RS, Shi H, Chen CM, Yan PS & Huang TH Methylation-specific oligonucleotide microarray: a new potential for high-throughput methylation analysis. Genome Res 12, 158–164 (2002). [DOI] [PMC free article] [PubMed] [Google Scholar]
- 48.Dupont JM, Tost J, Jammes H & Gut IG De novo quantitative bisulfite sequencing using the pyrosequencing technology. Anal. Biochem 333, 119–127 (2004). [DOI] [PubMed] [Google Scholar]
- 49.Mockler TC et al. Applications of DNA tiling arrays for whole-genome analysis. Genomics 85, 1–15 (2005). [DOI] [PubMed] [Google Scholar]
- 50.Bibikova M et al. High-throughput DNA methylation profiling using universal bead arrays. Genome Res 16, 383–393 (2006). [DOI] [PMC free article] [PubMed] [Google Scholar]
- 51.Rakyan VK et al. DNA methylation profiling of the human major histocompatibility complex: a pilot study for the human epigenome project. PLoS Biol 2, e405 (2004). [DOI] [PMC free article] [PubMed] [Google Scholar]
- 52.Eckhardt F et al. DNA methylation profiling of human chromosomes 6, 20 and 22. Nature Genet 38, 1378–1385 (2006). [DOI] [PMC free article] [PubMed] [Google Scholar]; The follow-up study from the Human Epigenome Project consortium, which profiled DNA methylation on three human chromosomes for several healthy tissues and primary cells by sequencing bisulphite-treated DNA.
- 53.Keshet I et al. Evidence for an instructive mechanism of de novo methylation in cancer cells. Nature Genet 38, 149–153 (2006). [DOI] [PubMed] [Google Scholar]
- 54.Weber M et al. Chromosome-wide and promoter-specific analyses identify sites of differential DNA methylation in normal and transformed human cells. Nature Genet 37, 853–862 (2005). [DOI] [PubMed] [Google Scholar]
- 55.Zhang X et al. Genome-wide high-resolution mapping and functional analysis of DNA methylation in Arabidopsis. Cell 126, 1189–1201 (2006). [DOI] [PubMed] [Google Scholar]; The first comprehensive map of DNA methylation for an entire genome, produced by performing mCIP combined with tiling microarrays with 35 bp resolution.
- 56.Zilberman D, Gehring M, Tran RK, Ballinger T & Henikoff S Genome-wide analysis of Arabidopsis thaliana DNA methylation uncovers an interdependence between methylation and transcription. Nature Genet 39, 61–69 (2007). [DOI] [PubMed] [Google Scholar]
- 57.Shen L et al. Genome-wide profiling of DNA methylation reveals a class of normally methylated CpG island promoters. PLoS Genet 3, 2023–2036 (2007). [DOI] [PMC free article] [PubMed] [Google Scholar]
- 58.Weber M et al. Distribution, silencing potential and evolutionary impact of promoter DNA methylation in the human genome. Nature Genet 39, 457–466 (2007). [DOI] [PubMed] [Google Scholar]
- 59.Das R et al. Computational prediction of methylation status in human genomic sequences. Proc. Natl Acad. Sci. USA 103, 10713–10716 (2006). [DOI] [PMC free article] [PubMed] [Google Scholar]
- 60.Fang F, Fan S, Zhang X & Zhang MQ Predicting methylation status of CpG islands in the human brain. Bioinformatics 22, 2204–2209 (2006). [DOI] [PubMed] [Google Scholar]
- 61.Bock C et al. CpG island methylation in human lymphocytes is highly correlated with DNA sequence, repeats, and predicted DNA structure. PLoS Genet 2, e26 (2006). [DOI] [PMC free article] [PubMed] [Google Scholar]
- 62.Bock C, Walter J, Paulsen M & Lengauer T CpG island mapping by epigenome prediction. PLoS Comput. Biol 3, e110 (2007). [DOI] [PMC free article] [PubMed] [Google Scholar]
- 63.Roth SY & Allis CD Chromatin condensation: does histone H1 dephosphorylation play a role? Trends Biochem. Sci 17, 93–98 (1992). [DOI] [PubMed] [Google Scholar]
- 64.Strahl BD & Allis CD The language of covalent histone modifications. Nature 403, 41–45 (2000). [DOI] [PubMed] [Google Scholar]
- 65.Turner BM Histone acetylation and an epigenetic code. Bioessays 22, 836–845 (2000). [DOI] [PubMed] [Google Scholar]
- 66.Schreiber SL & Bernstein BE Signaling network model of chromatin. Cell 111, 771–778 (2002). [DOI] [PubMed] [Google Scholar]
- 67.Kouzarides T Chromatin modifications and their function. Cell 128, 693–705 (2007). [DOI] [PubMed] [Google Scholar]
- 68.Li B, Carey M & Workman JL The role of chromatin during transcription. Cell 128, 707–719 (2007). [DOI] [PubMed] [Google Scholar]
- 69.Schubeler D et al. The histone modification pattern of active genes revealed through genome-wide chromatin analysis of a higher eukaryote. Genes Dev 18, 1263–1271 (2004). [DOI] [PMC free article] [PubMed] [Google Scholar]
- 70.Liu CL et al. Single-nucleosome mapping of histone modifications in S. cerevisiae. PLoS Biol 3, e328 (2005). [DOI] [PMC free article] [PubMed] [Google Scholar]
- 71.Pokholok DK et al. Genome-wide map of nucleosome acetylation and methylation in yeast. Cell 122, 517–527 (2005). [DOI] [PubMed] [Google Scholar]
- 72.Bernstein BE et al. Genomic maps and comparative analysis of histone modifications in human and mouse. Cell 120, 169–181 (2005). [DOI] [PubMed] [Google Scholar]
- 73.Bernstein BE et al. A bivalent chromatin structure marks key developmental genes in embryonic stem cells. Cell 125, 315–326 (2006). [DOI] [PubMed] [Google Scholar]
- 74.Koch CM et al. The landscape of histone modifications across 1% of the human genome in five human cell lines. Genome Res 17, 691–707 (2007). [DOI] [PMC free article] [PubMed] [Google Scholar]
- 75.Heintzman ND et al. Distinct and predictive chromatin signatures of transcriptional promoters and enhancers in the human genome. Nature Genet 39, 311–318 (2007). [DOI] [PubMed] [Google Scholar]
- 76.Kim TH et al. A high-resolution map of active promoters in the human genome. Nature 436, 876–880 (2005). [DOI] [PMC free article] [PubMed] [Google Scholar]
- 77.Roh TY, Cuddapah S, Cui K & Zhao K The genomic landscape of histone modifications in human T cells. Proc. Natl Acad. Sci. USA 103, 15782–15787 (2006). [DOI] [PMC free article] [PubMed] [Google Scholar]
- 78.Roh TY, Cuddapah S & Zhao K Active chromatin domains are defined by acetylation islands revealed by genome-wide mapping. Genes Dev 19, 542–552 (2005). [DOI] [PMC free article] [PubMed] [Google Scholar]
- 79.Guenther MG, Levine SS, Boyer LA, Jaenisch R & Young RA A chromatin landmark and transcription initiation at most promoters in human cells. Cell 130, 77–88 (2007). [DOI] [PMC free article] [PubMed] [Google Scholar]
- 80.Ng HH, Robert F, Young RA & Struhl K Targeted recruitment of Set1 histone methylase by elongating Pol II provides a localized mark and memory of recent transcriptional activity. Mol. Cell 11, 709–719 (2003). [DOI] [PubMed] [Google Scholar]
- 81.Martens JH et al. The profile of repeat-associated histone lysine methylation states in the mouse epigenome. EMBO J 24, 800–812 (2005). [DOI] [PMC free article] [PubMed] [Google Scholar]
- 82.Boyer LA et al. Polycomb complexes repress developmental regulators in murine embryonic stem cells. Nature 441, 349–353 (2006). [DOI] [PubMed] [Google Scholar]
- 83.Lee TI et al. Control of developmental regulators by Polycomb in human embryonic stem cells. Cell 125, 301–313 (2006). [DOI] [PMC free article] [PubMed] [Google Scholar]
- 84.Squazzo SL et al. Suz12 binds to silenced regions of the genome in a cell-type-specific manner. Genome Res 16, 890–900 (2006). [DOI] [PMC free article] [PubMed] [Google Scholar]
- 85.Stock JK et al. Ring1-mediated ubiquitination of H2A restrains poised RNA polymerase II at bivalent genes in mouse ES cells. Nature Cell Biol 9, 1428–1435 (2007). [DOI] [PubMed] [Google Scholar]
- 86.Birney E et al. Identification and analysis of functional elements in 1% of the human genome by the ENCODE pilot project. Nature 447, 799–816 (2007). [DOI] [PMC free article] [PubMed] [Google Scholar]
- 87.Roh TY, Wei G, Farrell CM & Zhao K Genome-wide prediction of conserved and nonconserved enhancers by histone acetylation patterns. Genome Res 17, 74–81 (2007). [DOI] [PMC free article] [PubMed] [Google Scholar]
- 88.Meneghini MD, Wu M & Madhani HD Conserved histone variant H2A.Z protects euchromatin from the ectopic spread of silent heterochromatin. Cell 112, 725–736 (2003). [DOI] [PubMed] [Google Scholar]
- 89.Raisner RM et al. Histone variant H2A.Z marks the 5′ ends of both active and inactive genes in euchromatin. Cell 123, 233–248 (2005). [DOI] [PMC free article] [PubMed] [Google Scholar]
- 90.Zhang H, Roberts DN & Cairns BR Genome-wide dynamics of Htz1, a histone H2A variant that poises repressed/basal promoters for activation through histone loss. Cell 123, 219–231 (2005). [DOI] [PMC free article] [PubMed] [Google Scholar]
- 91.Guillemette B et al. Variant histone H2A.Z is globally localized to the promoters of inactive yeast genes and regulates nucleosome positioning. PLoS Biol 3, e384 (2005). [DOI] [PMC free article] [PubMed] [Google Scholar]
- 92.Li B et al. Preferential occupancy of histone variant H2AZ at inactive promoters influences local histone modifications and chromatin remodeling. Proc. Natl Acad. Sci. USA 102, 18385–18390 (2005). [DOI] [PMC free article] [PubMed] [Google Scholar]
- 93.Guillemette B & Gaudreau L Reuniting the contrasting functions of H2A.Z. Biochem. Cell Biol 84, 528–535 (2006). [DOI] [PubMed] [Google Scholar]
- 94.Mito Y, Henikoff JG & Henikoff S Histone replacement marks the boundaries of cis-regulatory domains. Science 315, 1408–1411 (2007). [DOI] [PubMed] [Google Scholar]
- 95.Mito Y, Henikoff JG & Henikoff S Genome-scale profiling of histone H3.3 replacement patterns. Nature Genet 37, 1090–1097 (2005). [DOI] [PubMed] [Google Scholar]
- 96.Suto RK, Clarkson MJ, Tremethick DJ & Luger K Crystal structure of a nucleosome core particle containing the variant histone H2A.Z. Nature Struct. Biol 7, 1121–1124 (2000). [DOI] [PubMed] [Google Scholar]
- 97.Jin C & Felsenfeld G Nucleosome stability mediated by histone variants H3.3 and H2A.Z. Genes Dev 21, 1519–1529 (2007). [DOI] [PMC free article] [PubMed] [Google Scholar]
- 98.Lohr D & Lopez J GAL4/GAL80-dependent nucleosome disruption/deposition on the upstream regions of the yeast GAL1–10 and GAL80 genes. J. Biol. Chem 270, 27671–27678 (1995). [DOI] [PubMed] [Google Scholar]
- 99.Straka C & Horz W A functional role for nucleosomes in the repression of a yeast promoter. EMBO J 10, 361–368 (1991). [DOI] [PMC free article] [PubMed] [Google Scholar]
- 100.Yuan GC et al. Genome-scale identification of nucleosome positions in S. cerevisiae. Science 309, 626–630 (2005). [DOI] [PubMed] [Google Scholar]; This study profiled nucleosome positions at high resolution across most of chromosome 3 of the S. cerevisiae genome with MNase digestion followed by hybridization to DNA microarrays.
- 101.Lee W et al. A high-resolution atlas of nucleosome occupancy in yeast. Nature Genet 39, 1235–1244 (2007). [DOI] [PubMed] [Google Scholar]
- 102.Johnson SM, Tan FJ, McCullough HL, Riordan DP & Fire AZ Flexibility and constraint in the nucleosome core landscape of Caenorhabditis elegans chromatin. Genome Res 16, 1505–1516 (2006). [DOI] [PMC free article] [PubMed] [Google Scholar]
- 103.Albert I et al. Translational and rotational settings of H2A.Z nucleosomes across the Saccharomyces cerevisiae genome. Nature 446, 572–576 (2007). [DOI] [PubMed] [Google Scholar]
- 104.Barski A et al. Response: mapping nucleosome positions using ChIP-Seq data. Cell 131, 832–833 (2007). [Google Scholar]
- 105.Schmid CD & Bucher P ChIP–Seq data reveal nucleosome architecture of human promoters. Cell 131, 831–832 (2007). [DOI] [PubMed] [Google Scholar]
- 106.Satchwell SC, Drew HR & Travers AA Sequence periodicities in chicken nucleosome core DNA. J. Mol. Biol 191, 659–675 (1986). [DOI] [PubMed] [Google Scholar]
- 107.Segal E et al. A genomic code for nucleosome positioning. Nature 442, 772–778 (2006). [DOI] [PMC free article] [PubMed] [Google Scholar]
- 108.Ioshikhes IP, Albert I, Zanton SJ & Pugh BF Nucleosome positions predicted through comparative genomics. Nature Genet 38, 1210–1215 (2006). [DOI] [PubMed] [Google Scholar]
- 109.Peckham HE et al. Nucleosome positioning signals in genomic DNA. Genome Res 17, 1170–1177 (2007). [DOI] [PMC free article] [PubMed] [Google Scholar]
- 110.Gilbert N et al. Chromatin architecture of the human genome: gene-rich domains are enriched in open chromatin fibers. Cell 118, 555–566 (2004). [DOI] [PubMed] [Google Scholar]
- 111.Crawford GE et al. Identifying gene regulatory elements by genome-wide recovery of DNase hypersensitive sites. Proc. Natl Acad. Sci. USA 101, 992–997 (2004). [DOI] [PMC free article] [PubMed] [Google Scholar]
- 112.Weil MR, Widlak P, Minna JD & Garner HR Global survey of chromatin accessibility using DNA microarrays. Genome Res 14, 1374–1381 (2004). [DOI] [PMC free article] [PubMed] [Google Scholar]
- 113.Crawford GE et al. DNase-chip: a high-resolution method to identify DNase I hypersensitive sites using tiled microarrays. Nature Methods 3, 503–509 (2006). [DOI] [PMC free article] [PubMed] [Google Scholar]
- 114.Crawford GE et al. Genome-wide mapping of DNase hypersensitive sites using massively parallel signature sequencing (MPSS). Genome Res 16, 123–131 (2006). [DOI] [PMC free article] [PubMed] [Google Scholar]
- 115.Xi H et al. Identification and characterization of cell type-specific and ubiquitous chromatin regulatory structures in the human genome. PLoS Genet 3, e136 (2007). [DOI] [PMC free article] [PubMed] [Google Scholar]
- 116.Nagy PL, Cleary ML, Brown PO & Lieb JD Genomewide demarcation of RNA polymerase II transcription units revealed by physical fractionation of chromatin. Proc. Natl Acad. Sci. USA 100, 6364–6369 (2003). [DOI] [PMC free article] [PubMed] [Google Scholar]
- 117.Hogan GJ, Lee CK & Lieb JD Cell cycle-specified fluctuation of nucleosome occupancy at gene promoters. PLoS Genet 2, e158 (2006). [DOI] [PMC free article] [PubMed] [Google Scholar]
- 118.Giresi PG, Kim J, McDaniell RM, Iyer VR & Lieb JD FAIRE (formaldehyde-assisted isolation of regulatory elements) isolates active regulatory elements from human chromatin. Genome Res 17, 877–885 (2007). [DOI] [PMC free article] [PubMed] [Google Scholar]
- 119.Liu XS Getting started in tiling microarray analysis. PLoS Comput. Biol 3, 1842–1844 (2007). [DOI] [PMC free article] [PubMed] [Google Scholar]
- 120.Ji H & Wong WH TileMap: create chromosomal map of tiling array hybridizations. Bioinformatics 21, 3629–3636 (2005). [DOI] [PubMed] [Google Scholar]
- 121.Johnson WE et al. Model-based analysis of tiling-arrays for ChIP–chip. Proc. Natl Acad. Sci. USA 103, 12457–12462 (2006). [DOI] [PMC free article] [PubMed] [Google Scholar]
- 122.Marinescu VD et al. START: an automated tool for serial analysis of chromatin occupancy data. Bioinformatics 22, 999–1001 (2006). [DOI] [PubMed] [Google Scholar]
- 123.Kent WJ et al. The human genome browser at UCSC. Genome Res 12, 996–1006 (2002). [DOI] [PMC free article] [PubMed] [Google Scholar]
- 124.Hodges E et al. Genome-wide in situ exon capture for selective resequencing. Nature Genet 39, 1522–1527 (2007). [DOI] [PubMed] [Google Scholar]
- 125.Spilianakis CG & Flavell RA Long-range intrachromosomal interactions in the T helper type 2 cytokine locus. Nature Immunol 5, 1017–1027 (2004). [DOI] [PubMed] [Google Scholar]
- 126.Spilianakis CG, Lalioti MD, Town T, Lee GR & Flavell RA Interchromosomal associations between alternatively expressed loci. Nature 435, 637–645 (2005). [DOI] [PubMed] [Google Scholar]
- 127.Lanctot C, Cheutin T, Cremer M, Cavalli G & Cremer T Dynamic genome architecture in the nuclear space: regulation of gene expression in three dimensions. Nature Rev. Genet 8, 104–115 (2007). [DOI] [PubMed] [Google Scholar]
- 128.Dekker J, Rippe K, Dekker M & Kleckner N Capturing chromosome conformation. Science 295, 1306–1311 (2002). [DOI] [PubMed] [Google Scholar]; This paper introduced the chromosome conformation capture (3C) technique.
- 129.Zhao Z et al. Circular chromosome conformation capture (4C) uncovers extensive networks of epigenetically regulated intra- and interchromosomal interactions. Nature Genet 38, 1341–1347 (2006). [DOI] [PubMed] [Google Scholar]
- 130.Simonis M et al. Nuclear organization of active and inactive chromatin domains uncovered by chromosome conformation capture-on-chip (4C). Nature Genet 38, 1348–1354 (2006). [DOI] [PubMed] [Google Scholar]
- 131.Dostie J et al. Chromosome conformation capture carbon copy (5C): a massively parallel solution for mapping interactions between genomic elements. Genome Res 16, 1299–1309 (2006). [DOI] [PMC free article] [PubMed] [Google Scholar]
- 132.Hall IM et al. Establishment and maintenance of a heterochromatin domain. Science 297, 2232–2237 (2002). [DOI] [PubMed] [Google Scholar]
- 133.Volpe TA et al. Regulation of heterochromatic silencing and histone H3 lysine-9 methylation by RNAi. Science 297, 1833–1837 (2002). [DOI] [PubMed] [Google Scholar]
- 134.Grewal SI & Elgin SC Transcription and RNA interference in the formation of heterochromatin. Nature 447, 399–406 (2007). [DOI] [PMC free article] [PubMed] [Google Scholar]
- 135.Cam HP et al. Comprehensive analysis of heterochromatin- and RNAi-mediated epigenetic control of the fission yeast genome. Nature Genet 37, 809–819 (2005). [DOI] [PubMed] [Google Scholar]
- 136.Rinn JL et al. Functional demarcation of active and silent chromatin domains in human HOX loci by noncoding RNAs. Cell 129, 1311–1323 (2007). [DOI] [PMC free article] [PubMed] [Google Scholar]
- 137.Kim TH & Ren B Genome-wide analysis of protein–DNA interactions. Annu. Rev. Genomics Hum. Genet 7, 81–102 (2006). [DOI] [PubMed] [Google Scholar]
- 138.van Steensel B & Henikoff S Identification of in vivo DNA targets of chromatin proteins using tethered dam methyltransferase. Nature Biotechnol 18, 424–428 (2000). [DOI] [PubMed] [Google Scholar]
- 139.Eissenberg JC & Elgin SC The HP1 protein family: getting a grip on chromatin. Curr. Opin. Genet. Dev 10, 204–210 (2000). [DOI] [PubMed] [Google Scholar]
- 140.Tamaru H & Selker EU A histone H3 methyltransferase controls DNA methylation in Neurospora crassa. Nature 414, 277–283 (2001). [DOI] [PubMed] [Google Scholar]
- 141.Vire E et al. The Polycomb group protein EZH2 directly controls DNA methylation. Nature 439, 871–874 (2006). [DOI] [PubMed] [Google Scholar]
- 142.O’Neill LP, VerMilyea MD & Turner BM Epigenetic characterization of the early embryo with a chromatin immunoprecipitation protocol applicable to small cell populations. Nature Genet 38, 835–841 (2006). [DOI] [PubMed] [Google Scholar]
- 143.Dahl JA & Collas P Q2ChIP, a quick and quantitative chromatin immunoprecipitation assay, unravels epigenetic dynamics of developmentally regulated genes in human carcinoma cells. Stem Cells 25, 1037–1046 (2007). [DOI] [PubMed] [Google Scholar]
- 144.Wolffe AP & Hayes JJ Chromatin disruption and modification. Nucleic Acids Res 27, 711–720 (1999). [DOI] [PMC free article] [PubMed] [Google Scholar]