

Abstract
Background and Aims
Semaglutide has been studied in patients with metabolic dysfunction‐associated steatohepatitis (MASH) due to potential benefit from weight loss on liver inflammation. However, preclinical studies suggest that MASH improvement may be independent of weight loss. We aim to assess the impact of semaglutide on MASH in relation to weight loss.
Methods
This retrospective study included 420 patients with diabetes on semaglutide for at least 12 months between 2011 and 2022. Exclusion criteria were liver disease other than MASH, decompensated cirrhosis, malignancy, and bariatric surgery. Primary endpoints were clinically significant improvements in AST or ALT (mean difference > 6.3 U/L and > 10.6 U/L respectively). Statistical analysis included Student's t‐test/ANOVA, Wilcoxon signed‐rank test/Friedman test as appropriate, and binary logistic regression.
Results
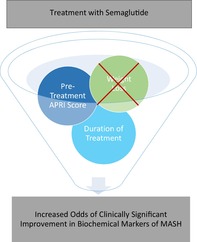
Median duration of semaglutide was 22.5 months and 80% of patients received 1 mg/week. BMI improved by a mean (SD) of 1.9 points (2.8), weight by 13.3 lbs. (19.1), AST by 4.1 U/L (11.5), and ALT by 5.3 U/L (14.2). In 28% and 22% of patients respectively, AST and ALT had a clinically significant improvement. MASH scores (NFS, FIB4, APRI) improved after semaglutide (p < 0.001). No statistically significant differences in AST or ALT improvement were found when patients were stratified by BMI prior to semaglutide or when stratified by percentage of weight loss. On logistic regression, the duration of semaglutide and pretreatment APRI score increased the odds of clinically significant improvements of AST and ALT.
Conclusion
Semaglutide treatment was associated with improvement in transaminases and MASH scores. Higher odds of positive semaglutide effects were observed with longer treatment duration and were independent of weight loss.
Keywords: metabolic dysfunction‐associated steatohepatitis, semaglutide, treatment, weight loss
In this study, Semaglutide treatment was associated with improvement of transaminases and MASH scores. Higher odds of positive semaglutide effects were observed with longer treatment duration and were independent of weight loss which supports findings from pre‐clinical studies. Patients with a normal BMI that have MASH or those that do not lose weight should not be excluded from semaglutide since there may be other mechanisms leading to MASH improvement.
Introduction
Metabolic dysfunction‐associated steatohepatitis (MASH) is a dynamic liver disease often associated with obesity, insulin resistance, and dyslipidemia. 1 , 2 MASH involves fat deposition and subsequent inflammation with potential progression to advanced fibrosis, which ultimately leads to increased morbidity and mortality. 2 In addition to genetic and environmental factors, insulin resistance plays a central role in the development of metabolic dysfunction‐associated steatotic liver disease (MASLD) due to increased circulating free fatty acids leading to lipotoxicity, glucotoxicity, and several metabolic comorbidities. 1 , 3
Currently, there are no approved pharmacological treatments for MASH, so management has been centered around lifestyle changes and managing comorbidities. However, as the prevalence of MASH and other metabolic diseases continues to rise, clinical and research efforts have been geared toward identifying other areas of intervention. 1 Recent research has sought to better understand how glucagon‐like peptide‐1 receptor agonists (GLP‐1 RA) impact MASH. 4 , 5 GLP‐1 RA increase insulin secretion, slow gastric emptying, suppress glucagon secretion, and subsequently lead to a reduction in caloric intake. 6
One GLP‐1 RA that has shown early promise is semaglutide (SEMA), which has been approved for type 2 diabetes mellitus, with subsequent expansion of use for weight management. 7 Since SEMA approval, there has been growing evidence demonstrating improvement in a range of metabolic outcomes including, but not limited to, obesity and cardiovascular events. 8 , 9 Given the association between MASH, obesity, and cardiovascular risk, further research has been done to assess the impact of SEMA on MASH.
Initial preclinical studies suggested that MASH improvement due to SEMA may be independent of weight loss. 10 Clinical trials have since demonstrated an improvement in serum asparate and alanine transaminase (ALT and AST) levels and histologic resolution of MASH without progression of liver fibrosis when compared with placebo. 4 , 5 However, the recent literature has focused on the effect of SEMA on MASH in the context of weight loss. Therefore, considerable debate remains as to whether these changes are merely secondary consequences of GLP‐1 RA‐induced weight loss or if these changes are at least partially due to independent anti‐inflammatory properties of SEMA. 4 , 10 , 11 , 12 , 13 In this study, we aim to assess the impact of SEMA on serologic markers of MASH independent of weight loss.
Methods
Study setting and variables
This retrospective study was conducted at the John Cochran Veterans Affairs (VA) Medical Center in St. Louis, Missouri. The study consisted of adults aged 18 and above who received SEMA between January 2011 and September 2022. After receiving institutional review board approval (IRB), six independent investigators reviewed medical records of the selected patients. Demographic and relevant variables were abstracted and included age, gender, ethnicity, current tobacco or alcohol use, and history of cirrhosis, coronary artery disease, heart failure, hypertension, and diabetes. The total duration of any GLP‐1 RA was recorded along with the duration of SEMA and dose received. Additionally, the use of other hypoglycemic agents during the study period was also noted. During the study period, BMI (body mass index), weight, height, HbA1c, lipid panel, AST, ALT, ALP, TB, NAFLD Fibrosis Score (NFS), Fibrosis‐4 Score (FIB‐4), and AST to Platelets Ratio Index (APRI) were recorded at three separate time points: (1) at least 6 months prior to any GLP‐1 RA; (2) time of initiation of SEMA; and (3) end date of SEMA (if the patient was still on the medication, date of chart abstraction was used).
Sample size calculations
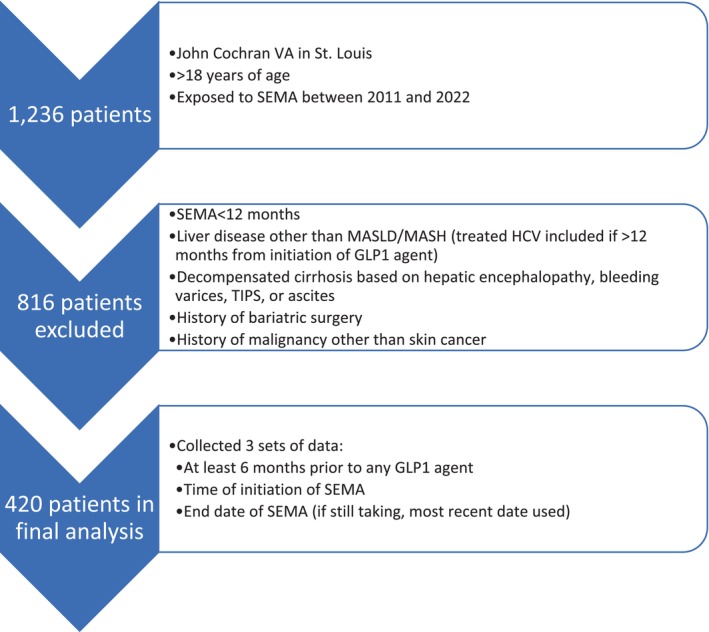
During this time period, 1236 patients had been exposed to SEMA at the John Cochran VA. Based on a 95% confidence level, 5% margin of error, and up to 59% improvement in MASH with SEMA, 5 the minimum sample size needed to capture this change was 285 patients.
Exclusion criteria
Patients were excluded if they received SEMA <12 months, had liver disease other than MASLD/MASH (patients treated with hepatitis C virus with a sustained virologic response were included if treatment was >12 months from initiation of GLP‐1 RA), decompensated cirrhosis (based on hepatic encephalopathy, bleeding varices, presence of a transjugular intrahepatic portosystemic shunt, or ascites), history of bariatric surgery, or history of malignancy other than skin cancer.
Outcome measures
Primary endpoints were clinically significant improvements in AST or ALT (defined as mean difference >6.3 U/L and >10.6 U/L respectively based on Ng et al. Hepatology 2022) 14 along with identification of variables that increase the likelihood of MASH improvement while on SEMA.
Statistical analysis
IBM SPSS Statistics (Version 28.0) was used to perform all statistical analysis. Frequencies and percentages were reported for categorical variables. Mean and standard deviation were reported for continuous variables when normally distributed, whereas median and range were reported for those that were not normally distributed. When comparing groups, Student's t‐test and ANOVA were used for normally distributed variables and Wilcoxon signed‐rank test and Friedman test were used as the nonparametric equivalent. Both univariate and multivariate binary logistic regression were also performed. All statistical tests were two‐sided using an a = 0.05 level of significance.
Ethics and approvals
This study was reviewed by the VA St. Louis Health Care System IRB and deemed to be a quality improvement study, so an IRB number was not assigned. Data de‐identification was performed prior to analysis. The manuscript was prepared according to STROBE guidelines. All authors reviewed and approved the final manuscript.
Results
A total of 1236 patients were exposed to SEMA between 2011 and 2022. Eight hundred and sixteen patients were excluded (Fig 1) mainly due to <12 months of SEMA use or potentially confounding comorbidities (liver disease other than MASLD/MASH, decompensated cirrhosis, prior bariatric surgery, or malignancy other than skin cancer). The final analysis included 420 patients who met the selection criteria. Demographics and baseline data of the study population are given in Table 1. The median age of the study population was 71 years old (range 36–97), with 94% male and 79% Caucasian. Twenty patients (5%) had compensated cirrhosis, and 84 patients (20%) reported active alcohol use (quantity was not recorded). The median duration of total GLP‐1 RA was 56 months (range 13–124) and the median duration of SEMA was 22.5 months (12–56). Most patients (80%) received 1 mg subcutaneous (SQ) of SEMA weekly, whereas the remaining received 0.5 mg of SQ weekly.
Figure 1.
Selection criteria.
Table 1.
Demographic data of the study population (n = 420)
| Age (years), Median (Range) | 71 (36–97) |
| Sex, n (%) | |
| Male | 394 (94.3) |
| Female | 24 (5.7) |
| Race, n (%) | |
| White | 327 (78.6) |
| Black | 75 (18) |
| Hispanic | 0 (0) |
| Asian | 3 (0.7) |
| Other | 11 (2.6) |
| History of cirrhosis, n (%) | 20 (4.8) |
| History of coronary artery disease, n (%) | 162 (38.6) |
| History of heart failure, n (%) | 78 (18.6) |
| History of hypertension, n (%) | 390 (92.9) |
| History of diabetes, n (%) | 416 (99) |
| Current tobacco use, n (%) | 70 (16.7) |
| Current alcohol use, n (%) | 84 (20) |
| Duration of any GLP1 agent (months), median (range) | 55.8 (13–124) |
| Duration of SEMA (months), median (range) | 22.5 (12–56) |
| Dose of SEMA, n (%) | |
| 0.5 mg/week | 83 (19.9) |
| 1 mg/week | 334 (80.1) |
| Use of another hypoglycemic agent during the study period, n (%) | |
| SGLT2 inhibitor | 226 (53.8) |
| Insulin | 339 (80.7) |
| Any other PO hypoglycemic agent | 357 (85) |
| Use of statin during the study period, n (%) | 388 (92.4) |
Data were also divided and compared by time during the study period (Table 2). BMI at 24 months and 12 months prior to any GLP‐1 RA was not statistically different from the BMI at time of initiation of a GLP‐1 RA (P > 0.05). Median BMI decreased from the time of initiation of any GLP‐1 RA (36.3) to the time of initiation of SEMA (35.6) to at least 12 months of SEMA (33.8) with Wilcoxon signed‐rank test and Friedman test P < 0.001. Median weight, AST, and ALT followed a similar trend with Wilcoxon signed‐rank test and Friedman test <0.001. Noninvasive scores for fibrosis (NFS, FIB‐4, APRI) were also calculated at the same three time points (Table 3). During SEMA use, median improvement in the NFS was −0.1 (range −7 to 6.9), FIB‐4 was −0.1 (range −3.5 to 3.8), and APRI was −0.04 (−1.1 to 0.76). Friedman test comparing each individual score at three different time points resulted in P < 0.001.
Table 2.
Treatment data of the study population (n = 420)
| 24 months prior to any GLP1 agent | 12 months prior to any GLP1 agent | Time of initiation of any GLP1 agent | Time of initiation of SEMA | After ≥12 months of SEMA | Wilcoxon Signed‐Rank test P value | Friedman test P value | |
|---|---|---|---|---|---|---|---|
| BMI (kg/m2), median (range) | 36 (21–67) | 36.1 (20–67) | 36.3 (21–66) | 35.6 (22–67) | 33.8 (20–68) | <0.001 | <0.001 |
| Weight (lbs), median (range) | N/A | 254 (148–454) | 248 (154–454) | 235 (144–434) | <0.001 | <0.001 | |
| Hemoglobin A1c (%), median (range) | N/A | 8.4 (5–17) | 8 (5–15) | 7.3 (4–16) | N/A | ||
| Total Cholesterol (mg/dL), median (range) | N/A | 154 (75–345) | 143 (75–306) | 137 (61–434) | N/A | ||
| Triglycerides (mg/dL), median (range) | N/A | 176 (43–1818) | 170 (43–1818) | 143 (32–1191) | N/A | ||
| LDL (mg/dL), median (range) | N/A | 80.4 (1–258) | 72 (14–764) | 70 (3–275) | N/A | ||
| AST (u/L), median (range) | N/A | 24 (7–105) | 23 (9–113) | 20 (9–64) | <0.001 | <0.001 | |
| ALT (u/L), median (range) | N/A | 27 (7–142) | 26 (6–149) | 22 (7–110) | <0.001 | <0.001 | |
| ALP (u/L), median (range) | N/A | 81 (30–278) | 84 (35–236) | 81 (25–410) | 0.012 | 0.006 | |
| Total Bilirubin (mg/dL), median (range) | N/A | 0.6 (0.1–2.2) | 0.5 (0.1–7) | 0.6 (0.1–2.7) | 0.011 | 0.07 | |
Table 3.
Change in noninvasive markers of fibrosis during the study period
| Before any GLP1 | Before SEMA | After at least 12 months of SEMA | Change during SEMA | Wilcoxon Signed‐Rank test P VALUE | Friedman test P value | |
|---|---|---|---|---|---|---|
| NFS, median (range) | 0.68 (−6 to 6.3) | 0.70 (−5.1 to 6.4) | 0.64 (−5.2 to 4.5) | −0.1 (−7 to 6.9) | 0.086 | <0.001 |
| NFS groups, n (%) | n = 405 | n = 390 | n = 377 | N/A | N/A | N/A |
| Low likelihood of advanced fibrosis(<−1.455) | 29 (7.2) | 30 (7.7) | 29 (7.7) | — | — | — |
| Indeterminate (−1.455 to 0.675) | 172 (42.5) | 159 (40.8) | 163 (43.2) | — | — | — |
| High likelihood of advanced fibrosis(>0.675) | 204 (50.4) | 201 (51.5) | 185 (49.1) | — | — | — |
| FIB4, median (range) | 1.4 (0.38 to 9) | 1.4 (0.4 to 8.8) | 1 (1 to 3) | −0.12 (−3.48 to 3.77) | <0.001 | <0.001 |
| FIB4 groups, n (%) | n = 397 | n = 372 | n = 353 | N/A | N/A | N/A |
| Low likelihood of advanced fibrosis (<1.45) | 203 (51.1) | 192 (51.6) | 205 (58.1) | — | — | — |
| Indeterminate (1.45 to 3.25) | 170 (42.8) | 164 (44.1) | 130 (36.8) | — | — | — |
| High likelihood of advanced fibrosis (>3.25) | 24 (6) | 16 (4.3) | 18 (5.1) | — | — | — |
| APRI, median (range) | 0.28 (0 to 1.2) | 0.26 (0 to 1.6) | 0.22 (0 to 1.3) | −0.04 (−1.1 to 0.76) | <0.001 | <0.001 |
| APRI groups, n (%) | n = 399 | n = 376 | n = 368 | N/A | N/A | N/A |
| Low likelihood of advanced fibrosis (<0.5) | 339 (85) | 333 (88.6) | 333 (90.5) | — | — | — |
| Indeterminate (0.5–1.5) | 60 (15) | 41 (10.9) | 35 (9.5) | — | — | — |
| High likelihood of advanced fibrosis (>1.5) | 0 (0) | 2 (0.5) | 0 (0) | — | — | — |
When adjusting for the aforementioned definition of clinically significant improvement in aminotransferases, 14 28% of patients had an improvement in AST and 22% had an improvement in ALT (Table 4). Improvement in AST and ALT was then stratified by BMI groups prior to SEMA: healthy weight, overweight, class 1 obesity, class 2 obesity, and class 3 obesity (Table 5). There was no statistically significant difference in the improvement of AST or ALT when compared between the various BMI groups (ANOVA P > 0.05). Improvements in AST and ALT were also stratified by percentage of weight loss during SEMA: no weight loss, 0–5% weight loss, 5–10% weight loss, and >10% weight loss (Table 6). There was no statistically significant difference in the improvement of AST or ALT when compared between the various percentages of weight loss (ANOVA P > 0.05). Improvement in AST and ALT was then compared between duration of SEMA use: 12 months, 12–24 months, 24–36 months, and 36–60 months (Table 7). There was a statistically significant difference in the improvement in ALT with a greater absolute mean difference as the duration of SEMA increased (ANOVA P = 0.03).
Table 4.
Patients with clinically significant improvement in aminotransferases during SEMA
| n (%) | |
|---|---|
| AST (mean difference > 6.33 u/L) | 117 (27.9) |
| ALT (mean difference > 10.6 u/L) | 92 (21.9) |
| AST or ALT | 140 (33.3) |
| AST and ALT | 69 (16.4) |
Table 5.
Mean difference of liver chemistries after ≥12 months of SEMA based on BMI group prior to SEMA (n = 395)
| Healthy weight (18.5 ≤BMI <25) n = 5 | Overweight (25 ≤BMI <30) n = 47 | Class 1 Obesity (30 ≤BMI <35) n = 125 | Class 2 Obesity (35 ≤BMI <40) n = 123 | Class 3 Obesity (BMI ≥40) n = 95 | ANOVA | |
|---|---|---|---|---|---|---|
| AST (u/L), mean difference (SD) | −6.2 (6.6) | −3.4 (13.6) | −1.8 (9.1) | −4.6 (11.4) | −6.4 (13.1) | 0.10 |
| Patients with clinically significant change in AST | — | — | — | — | — | N/A |
| Within BMI group, n (%) | 3 (60) | 10 (21.3) | 30 (24) | 35 (28.5) | 34 (35.8) | — |
| Within total, n (%) | 3 (0.76) | 10 (2.5) | 30 (7.6) | 35 (8.8) | 34 (8.6) | — |
| Clinically significant AST (u/L), mean difference (SD) | −10 (5.2) | −19.1 (15.7) | −11.8 (4.5) | −15.1 (13.6) | −17.2 (13.2) | 0.28 |
| ALT (u/L), mean difference (SD) | −12 (9.2) | −4.7 (15) | −3 (11.6) | −5.8 (13.1) | −6.8 (16.3) | 0.25 |
| Clinically significant change in ALT | — | — | — | — | — | N/A |
| Within BMI group, n (%) | 2 (40) | 6 (12.8) | 23 (18.4) | 31 (25.2) | 26 (27.4) | — |
| Within total, n (%) | 2 (0.51) | 6 (1.5) | 23 (5.8) | 31 (7.8) | 27 (6.8) | — |
| Clinically significant ALT (u/L), mean difference (SD) | −20.5 (6.4) | −31.3 (14) | −17.5 (9.8) | −20.6 (13.4) | −24.7 (15.1) | 0.14 |
| Clinically significant change in both AST and ALT | — | — | — | — | — | N/A |
| Within BMI group, n (%) | 2 (40) | 6 (12.8) | 15 (12) | 22 (17.9) | 20 (21.1) | — |
| Within total, n (%) | 2 (0.51) | 6 (1.5) | 15 (3.8) | 22 (5.6) | 20 (5.1) | — |
| ALP (u/L), mean difference (SD) | −0.8 (19.4) | −3.7 (22.1) | −2.4 (22.1) | −3.7 (18) | +3.2 (34.3) | 0.36 |
| Total Bilirubin (mg/dL), mean difference (SD) | +0.02 (0.18) | +0.06 (0.23) | +0.05 (0.29) | +0.03 (0.24) | +0.004 (0.30) | 0.79 |
Table 6.
Mean difference of liver chemistries after at least 12 months of SEMA based on percentage of weight loss (n = 391)
| No weight loss n = 85 | 0–5% Weight loss n = 111 | 5–10% Weight loss n = 109 | >10% Weight loss n = 86 | ANOVA | |
|---|---|---|---|---|---|
| AST (u/L), mean difference (SD) | −2 (12.1) | −4.6 (11.9) | −4.5 (6.9) | −5.3 (14.6) | 0.30 |
| Patients with clinically significant change in AST | — | — | — | — | — |
| Within weight loss group, n (%) | 21 (24.7) | 26 (23.4) | 38 (34.9) | 28 (32.6) | N/A |
| Within total, n (%) | 21 (5.3) | 26 (6.6) | 38 (9.7) | 28 (7.2) | — |
| Clinically significant AST (u/L), mean difference (SD) | −15.5 (7.7) | −17.8 (14.6) | −11.2 (5.5) | −17.4 (16.1) | 0.08 |
| ALT (u/L), mean difference (SD) | −2.9 (13.4) | −4.8 (14.8) | 5.2 (9.4) | −7.9 (16.9) | 0.17 |
| Clinically significant change in ALT | — | — | — | — | N/A |
| Within weight loss group, n (%) | 17 (20) | 22 (19.8) | 26 (23.9) | 24 (27.9) | — |
| Within total, n (%) | 17 (4.3) | 22 (5.6) | 26 (6.6) | 24 (6.1) | — |
| Clinically significant ALT (u/L), mean difference (SD) | −21.4 (10.8) | −24.6 (16.3) | −16.3 (4.7) | −24.8 (16.6) | 0.09 |
| Clinically significant change in both AST and ALT | — | — | — | — | N/A |
| Within weight loss group, n (%) | 14 (16.5) | 18 (16.2) | 17 (15.6) | 17 (19.8) | — |
| Within total, n (%) | 14 (3.6) | 18 (4.6) | 17 (4.3) | 17 (4.3) | — |
| ALP (u/L), mean difference (SD) | +1.8 (29.8) | −6.6 (18.8) | −0.77 (19.6) | −0.55 (29.9) | 0.14 |
| Total Bilirubin (mg/dL), mean difference (SD) | +0.03 (0.25) | +0.02 (0.22) | −0.01 (0.26) | +0.10 (0.34) | 0.35 |
Table 7.
Mean difference of BMI, weight, and liver chemistries based on duration of SEMA (n = 420)
| 12 months SEMA n = 17 | 12–24 months SEMA n = 232 | 24–36 months SEMA n = 87 | 36–60 months SEMA n = 84 | ANOVA | |
|---|---|---|---|---|---|
| BMI (kg/m2), mean difference (SD) | −1.4 (2.2) | −1.8 (2.8) | −2.1 (2.6) | −2.2 (3.2) | 0.58 |
| Weight (lbs), mean difference (SD) | −8.6 (14.7) | −12.3 (18.3) | −14.4 (17.7) | −16 (23) | 0.34 |
| AST (u/L), mean difference (SD) | −0.27 (8.2) | −3.3 (10.9) | −5.5 (13.6) | −5.9 (10.7) | 0.17 |
| Patients with clinically significant change in AST | — | — | — | — | N/A |
| Within semaglutide duration group, n (%) | 2 (11.8) | 52 (22.4) | 32 (36.8) | 31 (36.9) | — |
| Within total, n (%) | 2 (0.5) | 52 (12.4) | 32 (7.6) | 31 (7.4) | — |
| Clinically significant AST (u/L), mean difference (SD) | −10.5 (4.9) | −14.9 (13) | −16.6 (12.9) | −14.1 (8.3) | 0.79 |
| ALT (u/L), mean difference (SD) | −1.7 (12.8) | −3.6 (13.3) | −8.9 (16.8) | −6.4 (12.8) | 0.03 |
| Clinically significant change in ALT | — | — | — | — | N/A |
| Within semaglutide duration group, n (%) | 1 (5.9) | 43 (18.5) | 26 (29.9) | 22 (26.2) | — |
| Within total, n (%) | 1 (0.23) | 43 (10.2) | 26 (6.2) | 22 (5.2) | — |
| Clinically significant ALT (u/L), mean difference (SD) | −34 | −21.5 (14.1) | −25.4 (18.3) | −18.8 (7.4) | 0.34 |
| Clinically significant change in both AST and ALT | — | — | — | — | N/A |
| Within semaglutide duration group, n (%) | 1 (5.9) | 33 (14.2) | 21 (24.1) | 14 (16.7) | — |
| Within total, n (%) | 1 (0.23) | 33 (7.9) | 21 (5) | 14 (3.3) | — |
| ALP (u/L), mean difference (SD) | +5.7 (20.8) | −1.7 (18.1) | −0.96 (30.4) | −1 (32.7) | 0.83 |
| Total Bilirubin (mg/dL), mean difference (SD) | +0.05 (0.14) | +0.04 (0.25) | +0.06 (0.33) | −0.004 (0.25) | 0.60 |
Univariate and multivariate analyses
Separate univariate and multivariate binary logistic regression analyses were performed for each outcome (Table 8). In the univariate analysis, the predictors of clinically significant AST improvement included duration of SEMA treatment, history of compensated cirrhosis, and APRI score between 0.5 and 1.5. The predictors of clinically significant ALT improvement included history of compensated cirrhosis and APRI score between 0.5 and 1.5. Notably, changes in BMI or weight loss after SEMA treatment were both not found to be statistically significant predictors of either clinically significant AST or ALT improvement. Multivariate analysis was conducted using the clinically significant variables from the univariate analysis. Based on multivariate analyses, duration of SEMA treatment (OR 1.06, P < 0.001 and OR 1.03, P = 0.02), and APRI score of 0.5–1.5 (OR 4.4, P < 0.001 and OR 4.8, P < 0.001) were found to be statistically significant predictors of either clinically significant ALT or AST improvement.
Table 8.
Univariate and multivariate binary logistic regression with clinically significant improvement in AST or ALT as the dependent variable
| Clinically significant AST improvement | Clinically significant ALT improvement | |||
|---|---|---|---|---|
| Univariate | Multivariate | Univariate | Multivariate | |
| Months of treatment |
OR 1.03 P = 0.002* |
OR 1.06 P < 0.001* |
OR 1.02 P = 0.08 |
OR 1.03 P = 0.02* |
| Compensated cirrhosis |
OR 2.7 P = 0.03* |
OR 1.2 P = 0.75 |
OR 3.9 P = 0.003* |
OR 2.2 P = 0.14 |
| APRI score 0.5–1.5 prior to treatment |
OR 4.3 P < 0.001* |
OR 4.4 P < 0.001* |
OR 5.3 P < 0.001* |
OR 4.8 P < 0.001* |
| Change in BMI after treatment |
OR 0.95 P = 0.16 |
‐ |
OR 0.92 P = 0.05 |
‐ |
| Weight loss after treatment |
OR 0.99 P = 0.23 |
‐ |
OR 0.99 P = 0.08 |
‐ |
Statistically significant P < 0.05.
OR, odds ratio.
As 53.8% of patients took a sodium‐glucose transport protein 2 (SGLT2) inhibitor at some point during the study period, multivariate analysis was also adjusted for exposure. The duration of SEMA treatment (OR 1.03, P = 0.004) and APRI score 0.5 of 1.5 (OR 3.8, P < 0.001) were noted to be significant predictors of clinically significant AST improvement, whereas compensated cirrhosis (OR 2.2, P = 0.13) was not. Multivariate analysis for clinically significant ALT improvement demonstrated similar results to pre‐adjustment analyses. Compensated cirrhosis had an OR of 3.8 (P = 0.01), duration of SEMA had an OR of 1.02 (P = 0.09), and APRI score of 0.5–1.5 had an OR of 1.8 (P = 0.06).
In addition, repeat univariate and multivariate binary logistic regression analyses were also completed on 336 patients after excluding those with active alcohol use (Table 9). Compared with the analyses performed on the entire cohort, there were some changes in the amplitude of the OR, but the main difference was seen in univariate analysis for clinically significant ALT improvement. Changes in BMI and weight loss after treatment were noted to both be significant predictors; however, the ORs were 0.89 (P = 0.02) and 0.99 (P = 0.04) respectively, suggesting a similar trend as seen in the analyses of the entire cohort.
Table 9.
Univariate and multivariate binary logistic regression with clinically significant improvement in AST or ALT as the dependent variable after selecting for patients without active alcohol use (n = 336)
| Clinically significant AST improvement | Clinically significant ALT improvement | |||
|---|---|---|---|---|
| Univariate | Multivariate | Univariate | Multivariate | |
| Months of treatment |
OR 1.03 P = 0.01* |
OR 1.03 P = 0.02* |
OR 1.01 P = 0.55 |
OR 1.01 P = 0.48 |
| Compensated cirrhosis |
OR 3.3 P = 0.03* |
OR 2.4 P = 0.15 |
OR 4.8 P = 0.004* |
OR 4.7 P = 0.01* |
| APRI score 0.5–1.5 prior to treatment |
OR 4.03 P < 0.001* |
OR 3.5 P < 0.001* |
OR 2.04 P = 0.04* |
OR 1.5 P = 0.28 |
| Change in BMI after treatment |
OR 0.93 P = 0.09 |
‐ |
OR 0.89 P = 0.02* |
‐ |
| Weight loss after treatment |
OR 0.99 P = 0.15 |
‐ |
OR 0.99 P = 0.04* |
‐ |
Statistically significant P < 0.05.
OR, odds ratio.
Discussion
The aim of this study was to assess the impact of SEMA on biochemical and noninvasive markers of fibrosis in MASH with regard to weight loss. Of the 420 patients included, 28% had a clinically significant improvement in AST and 22% had a clinically significant improvement in ALT, which suggests overall effectiveness of SEMA. In addition to these changes, serologic markers of MASH including NFS, FIB‐4, and APRI all improved while on SEMA (Table 3). This also points to a positive effect of SEMA on validated, noninvasive markers of fibrosis in MASH and alludes to SEMA improving hepatic steatosis and fibrosis, though this direct mechanism remains to be elucidated.
Although median BMI decreased from the time of initiation of SEMA (BMI 35.6) to after at least 12 months of SEMA (BMI 33.8), there were no statistically significant differences in improvement in AST or ALT when stratified by BMI group prior to SEMA or by percentage of weight loss after treatment (Tables 5 and 6). Therefore, despite improvement in MASH during SEMA, different BMI groups and amounts of weight loss did not influence the main endpoints. These findings suggest a direct effect of SEMA on inflammation and steatosis, which may not be influenced by weight loss.
Based on univariate and multivariate analyses of the entire cohort, the duration of SEMA and pretreatment APRI score were found to be the only statistically significant predictors of clinically significant improvements in AST or ALT. This may be related to the components of the scores themselves because AST is heavily weighted in the APRI score compared with the NFS and FIB‐4 scores The odds of achieving a clinically significant improvement in AST or ALT while on SEMA improved by 3–6% per month of SEMA starting at 12 months, suggesting a maintained effect. Additionally, an APRI score of 0.5–1.5 (indeterminate likelihood of advanced fibrosis) was found to have 3–4 times increased odds of clinically significant improvement in AST or ALT, potentially due to the lack of advanced fibrosis that would allow MASH improvement and fibrosis regression. Notably, changes in BMI and weight loss during SEMA treatment were not statistically significant variables, which suggest that the improvement in the surrogates for MASH were independent of weight loss. When univariate and multivariate analyses were performed after removing patients with active alcohol use, overall trends remained similar and weight loss and change in BMI were not predictors of clinically significant AST or ALT improvement. Additionally, as 53.8% of patients were exposed to SGLT2 inhibitors, multivariate analyses were also adjusted for SGLT2 use, but the results were similar to pre‐adjustment. Although SGLT inhibitors may confound results due to independent effects, these medications have not had as robust data regarding improvement in MASH, but nonetheless, our data seem to demonstrate similar trends regardless of SGLT2 inhibitor exposure.
These findings are consistent with preclinical studies that also noted that MASH improvement occurred without weight loss. 10 Instead, there may be an independent inflammatory pathway that is being targeted by SEMA that leads to MASH improvement. Further studies are needed to isolate this potential pathway to provide future pharmacologic targets and endpoints. These results may also have implications for expanding the target population for SEMA when considering treatment of MASH. Patients without diabetes or with lean MASLD/MASH may still benefit from SEMA given the dynamic nature of fatty liver disease, which needs to be investigated further. As reduction in cardiovascular risk is one of the main goals of treatment of MASH, improvement in MASH regardless of weight loss may also lead to improvement in cardiovascular morbidity and mortality in those with a normal BMI and should also be studied further. 8
Additionally, as SEMA is being used more frequently for type II diabetes and weight loss, these results may provide an opportunity for primary care physicians and endocrinologists to understand changes to surrogate markers of MASH during treatment. The doses used in this study are used for patients with diabetes (0.5–1 mg SQ weekly), whereas higher doses are used for weight loss. Therefore, higher doses may lead to an even more robust effect and greater AST and ALT improvement. As demonstrated in this study, all fibrosis scores improved with SEMA, so checking labs and these scores periodically throughout treatment may provide an approachable and noninvasive manner of monitoring MASH treatment.
The main limitations revolve around the retrospective nature of the study. We defined clinically significant improvement in MASH based on improvement in AST and ALT, which was described by a study by Ng et al. that calculated a placebo rate of improvement in aminotransferases from NASH‐randomized clinical trials until 2022. 14 Therefore, if AST and ALT did not improve by a mean difference >6.3 U/L and >10.6 U/L, respectively, we deemed the treatment to be clinically insignificant and could possibly be attributed to a placebo effect. Although the placebo rate was used from a previously published study, having a placebo arm to compare the effectiveness of SEMA would have been useful. In terms of study endpoints, because we could not quantify diet/lifestyle modifications due to lack of documentation and because a majority of patients did not have a liver biopsy, we were unable to compare and correlate our findings with standard medical therapy and histologic changes in steatosis, inflammation, or fibrosis. Despite not having consistently available serial imaging and FibroScan, we were able to use noninvasive markers of fibrosis. Additionally, the study population was mainly Caucasian males, so data may not be representative of the general population. Lastly, 20% of patients reported a history of alcohol use but could not be further quantified, but the overall trends were similar after removing these patients and performing a sub‐analysis. Despite these limitations, findings from this study pave the way to future work that should include patients with normal BMI and MASH while also investigating other pathways that may lead to improvement of MASH without weight loss.
In conclusion, there are no current approved therapies for MASH, so recommendations are based on lifestyle modifications. However, multiple studies have shown promising results for GLP‐1 RA. In this study, 22% and 28% of patients had a clinically significant improvement in ALT and AST, respectively, but these changes were independent of weight loss. The most notable predictor of improvement of MASH was the duration of SEMA treatment. While further studies are necessary, our study supports preclinical studies that SEMA may be a promising drug for MASH treatment outcomes independent of BMI and weight loss.
Declaration of conflict of interest: Dr. Mauricio Lisker‐Melman is a member of ABBVIE and the VBI Vaccines speaker bureau. Dr. Gregory Sayuk reports serving as a consultant for AbbVie and Ironwood Pharmaceuticals, Inc., and serving on the speakers' bureau for AbbVie, Ironwood Pharmaceuticals, Inc., Ardelyx, Sanofi/Regeneron, and Salix Pharmaceuticals. The other authors declare that they have no conflict of interest.
Author contribution: All authors participated in gathering articles, synthesizing data, and writing the paper.
Financial support: The authors declare that they have not received any financial support to complete the study or write the manuscript.
References
- 1. Rinella ME, Neuschwander‐Tetri BA, Siddiqui MS et al. AASLD Practice Guidance on the clinical assessment and management of nonalcoholic fatty liver disease. Hepatology. 2023; 77: 1797–1835. [DOI] [PMC free article] [PubMed] [Google Scholar]
- 2. Sheka AC, Adeyi O, Thompson J, Hameed B, Crawford PA, Ikramuddin S. Nonalcoholic Steatohepatitis: A review. JAMA. 2020; 323: 1175–1183. [DOI] [PubMed] [Google Scholar]
- 3. Gastaldelli A, Cusi K. From NASH to diabetes and from diabetes to NASH: Mechanisms and treatment options. JHEP Rep. 2019; 1: 312–328. [DOI] [PMC free article] [PubMed] [Google Scholar]
- 4. Newsome P, Francque S, Harrison S et al. Effect of semaglutide on liver enzymes and markers of inflammation in subjects with type 2 diabetes and/or obesity. Aliment. Pharmacol. Ther. 2019; 50: 193–203. [DOI] [PMC free article] [PubMed] [Google Scholar]
- 5. Newsome PN, Buchholtz K, Cusi K et al. A placebo‐controlled trial of subcutaneous semaglutide in nonalcoholic steatohepatitis. N. Engl. J. Med. 2021; 384: 1113–1124. [DOI] [PubMed] [Google Scholar]
- 6. Nauck MA, Quast DR, Wefers J, Meier JJ. GLP‐1 receptor agonists in the treatment of type 2 diabetes ‐ state‐of‐the‐art. Mol. Metab. 2021; 46: 101102. [DOI] [PMC free article] [PubMed] [Google Scholar]
- 7. FDA . FDA Approves new drug treatment for chronic weight management, first since 2014. U.S. Food and Drug Administration. https://www.fda.gov/news-events/press-announcements/fda-approves-new-drug-treatment-chronic-weight-management-first-2014 Published June 4, 2021. Accessed March 15, 2023.
- 8. Marso SP, Bain SC, Consoli A et al. Semaglutide and cardiovascular outcomes in patients with type 2 diabetes. N. Engl. J. Med. 2016; 375: 1834–1844. [DOI] [PubMed] [Google Scholar]
- 9. Wilding JPH, Batterham RL, Calanna S et al. Once‐weekly semaglutide in adults with overweight or obesity. N. Engl. J. Med. 2021; 384: 989–1002. [DOI] [PubMed] [Google Scholar]
- 10. Kalogirou M, Sinakos E. Treating nonalcoholic steatohepatitis with antidiabetic drugs: Will GLP‐1 agonists end the struggle? World J. Hepatol. 2018; 10: 790–794. [DOI] [PMC free article] [PubMed] [Google Scholar]
- 11. Dichtel LE. The glucagon‐like peptide‐1 receptor agonist, semaglutide, for the treatment of nonalcoholic steatohepatitis. Hepatology. 2021; 74: 2290–2292. [DOI] [PMC free article] [PubMed] [Google Scholar]
- 12. Rakipovski G, Rolin B, Nøhr J et al. The GLP‐1 Analogs Liraglutide and Semaglutide Reduce Atherosclerosis in ApoE−/− and LDLr−/− Mice by a Mechanism That Includes Inflammatory Pathways. JACC Basic Transl Sci. 2018. Nov 21; 3: 844–857. [DOI] [PMC free article] [PubMed] [Google Scholar]
- 13. Zhao X, Wang M, Wen Z et al. GLP‐1 receptor agonists: beyond their pancreatic effects. Front Endocrinol (Lausanne). 2021; 12: 721135. [DOI] [PMC free article] [PubMed] [Google Scholar]
- 14. Ng CH, Xiao J, Lim WH et al. Placebo effect on progression and regression in NASH: Evidence from a meta‐analysis. Hepatology. 2022; 75: 1647–1661. [DOI] [PubMed] [Google Scholar]